Embed Size (px)
Citation preview
Spectro-Temporal Characterization of the PhotoactivationMechanism of Two New Oxidized Cryptochrome/Photolyase
Photoreceptors
Johanna Brazard,† Anwar Usman,† Fabien Lacombat,† Christian Ley,†
Monique M. Martin,† Pascal Plaza,*,† Laetitia Mony,‡ Marc Heijde,§
Gerald Zabulon,§ and Chris Bowler§
UMR 8640 CNRS-ENS-UPMC, Departement de Chimie, Ecole Normale Superieure, 24 rueLhomond, 75005 Paris, France, UMR 8601 CNRS, Laboratoire de Chimie et Biochimie
Pharmacologies et Toxicologiques, UniVersite Paris Descartes, 12 rue de l’Ecole de medecine,75006 Paris, France, and UMR 8186 CNRS-ENS, Departement de Biologie, Ecole Normale
Superieure, 46 rue d’Ulm, 75005 Paris, France
Received January 20, 2010; E-mail: [email protected]
Abstract: The photoactivation dynamics of two new flavoproteins (OtCPF1 and OtCPF2) of the cryptochromephotolyase family (CPF), belonging to the green alga Ostreococcus tauri, was studied by broadband UV-visfemtosecond absorption spectroscopy. Upon excitation of the protein chromophoric cofactor, flavin adeninedinucleotide in its oxidized form (FADox), we observed in both cases the ultrafast photoreduction of FADox:in 390 fs for OtCPF1 and 590 fs for OtCPF2. Although such ultrafast electron transfer has already beenreported for other flavoproteins and CPF members, the present result is the first demonstration with fullspectral characterization of the mechanism. Analysis of the photoproduct spectra allowed identifyingtryptophan as the primary electron donor. This residue is found to be oxidized to its protonated radicalcation form (WH•+), while FADox is reduced to FAD•-. Subsequent kinetics were observed in the picosecondand subnanosecond regime, mostly described by a biexponential partial decay of the photoproduct transientsignal (9 and 81 ps for OtCPF1, and 13 and 340 ps for OtCPF2), with reduced spectral changes, while along-lived photoproduct remains in the nanosecond time scale. We interpret these observations within themodel proposed by the groups of Brettel and Vos, which describes the photoreduction of FADH• within E.coli CPD photolyase (EcCPD) as a sequential electron transfer along a chain of three tryptophan residues,although in that case the rate limiting step was the primary photoreduction in 30 ps. In the present study,excitation of FADox permitted to reveal the following steps and spectroscopically assign them to the hole-hopping process along the tryptophan chain, accompanied by partial charge recombination at each step.In addition, structural analysis performed by homology modeling allowed us to propose a tentative structureof the relative orientations of FAD and the conserved tryptophan triad. The results of preliminary transientanisotropy measurements performed on OtCPF2 finally showed good compatibility with the oxidation ofthe distal tryptophan residue (WH351) in 340 ps, hence, with the overall Brettel-Vos mechanism.
1. Introduction
The cryptochrome/photolyase family (CPF) forms a groupof structurally homologous proteins, widely distributed withineubacteria, archaea and eukaryotes. These proteins are activatedby near-UV/blue photons and mediate a variety of light-dependent biological functions.1-3 Photolyases use the energyof light to repair the major UV-induced lesions of DNA: CPDphotolyases (CPD-PL) split cyclobutane pyrimidine dimers
(CPD), while (6-4) photolyases (64-PL) take care of (6-4)pyrimidine-pyrimidone photoproducts.4-7 Cryptochromes (CRY)may act as photosensory proteins mediating different types ofresponses to light:8 regulation of photomorphogenesis, floweringand phototropism in plants,9 synchronization of the circadianclock for some animals.10 DASH cryptochromes (CRY-DASH)form a separate subfamily, the members of which have beenproposed to perform distinct functions in different organisms:
† UMR 8640 CNRS-ENS-UPMC, Departement de Chimie, Ecole Nor-male Superieure.
‡ UMR 8601 CNRS, Laboratoire de Chimie et Biochimie Pharmacologieset Toxicologiques, Universite Paris Descartes.
§ UMR 8186 CNRS-ENS, Departement de Biologie, Ecole NormaleSuperieure.(1) Sancar, A. Chem. ReV. 2003, 103, 2203–2237.(2) Cashmore, A. R.; Jarillo, J. A.; Wu, Y.-J.; Liu, D. Science 1999, 284,
760–765.(3) Todo, T.; Ryo, H.; Yamamoto, K.; Toh, H.; Inui, T.; Ayaki, H.;
Nomura, T.; Ikenaga, M. Science 1996, 272, 109–112.
(4) Malhotra, K.; Kim, S. T.; Sancar, A. Biochemistry 1994, 33, 8712–8718.
(5) Todo, T.; Takemori, H.; Ryo, H.; Ihara, M.; Matsunaga, T.; Nikaido,O.; Sato, K.; Nomura, T. Nature 1993, 361, 371–374.
(6) Brudler, R.; Hitomi, K.; Daiyasu, H.; Toh, H.; Kucho, K.; Ishiura,M.; Kanehisa, M.; Roberts, V. A.; Todo, T.; Tainer, J. A.; Getzoff,E. D. Mol. Cell 2003, 11, 59–67.
(7) Daiyasu, H.; Ishikawa, T.; Kuma, K.; Iwai, S.; Todo, T.; Toh, H. GenesCells 2004, 9, 479–495.
(8) Lin, C. T.; Todo, T. Genome Biology 2005, 6, article number 220.(9) Ahmad, M.; Cashmore, A. R. Nature 1993, 366, 162–166.
(10) Sancar, A. J. Biol. Chem. 2004, 279, 34079–34082.
Published on Web 03/12/2010
10.1021/ja1002372 2010 American Chemical Society J. AM. CHEM. SOC. 2010, 132, 4935–4945 9 4935
transcriptional repression within the circadian system,6,7,11
double-stranded DNA photolyase activity,7 specific single-stranded DNA photolyase activity.12-14
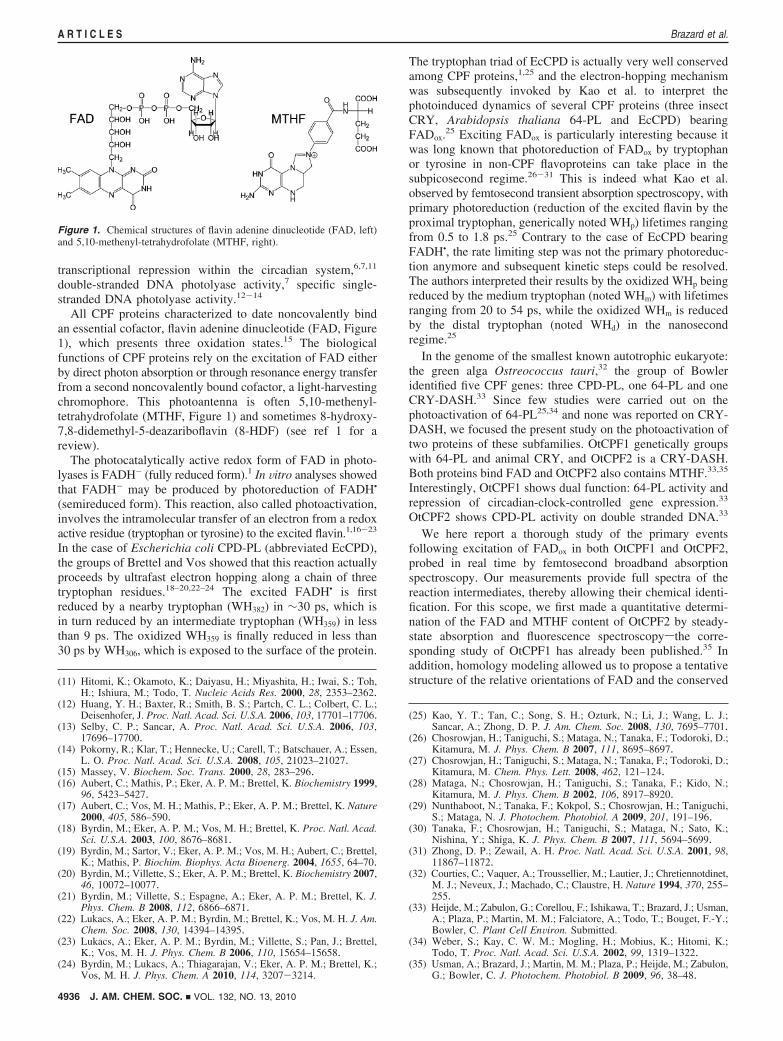
All CPF proteins characterized to date noncovalently bindan essential cofactor, flavin adenine dinucleotide (FAD, Figure1), which presents three oxidation states.15 The biologicalfunctions of CPF proteins rely on the excitation of FAD eitherby direct photon absorption or through resonance energy transferfrom a second noncovalently bound cofactor, a light-harvestingchromophore. This photoantenna is often 5,10-methenyl-tetrahydrofolate (MTHF, Figure 1) and sometimes 8-hydroxy-7,8-didemethyl-5-deazariboflavin (8-HDF) (see ref 1 for areview).
The photocatalytically active redox form of FAD in photo-lyases is FADH- (fully reduced form).1 In Vitro analyses showedthat FADH- may be produced by photoreduction of FADH•
(semireduced form). This reaction, also called photoactivation,involves the intramolecular transfer of an electron from a redoxactive residue (tryptophan or tyrosine) to the excited flavin.1,16-23
In the case of Escherichia coli CPD-PL (abbreviated EcCPD),the groups of Brettel and Vos showed that this reaction actuallyproceeds by ultrafast electron hopping along a chain of threetryptophan residues.18–20,22–24 The excited FADH• is firstreduced by a nearby tryptophan (WH382) in ∼30 ps, which isin turn reduced by an intermediate tryptophan (WH359) in lessthan 9 ps. The oxidized WH359 is finally reduced in less than30 ps by WH306, which is exposed to the surface of the protein.
The tryptophan triad of EcCPD is actually very well conservedamong CPF proteins,1,25 and the electron-hopping mechanismwas subsequently invoked by Kao et al. to interpret thephotoinduced dynamics of several CPF proteins (three insectCRY, Arabidopsis thaliana 64-PL and EcCPD) bearingFADox.
25 Exciting FADox is particularly interesting because itwas long known that photoreduction of FADox by tryptophanor tyrosine in non-CPF flavoproteins can take place in thesubpicosecond regime.26-31 This is indeed what Kao et al.observed by femtosecond transient absorption spectroscopy, withprimary photoreduction (reduction of the excited flavin by theproximal tryptophan, generically noted WHp) lifetimes rangingfrom 0.5 to 1.8 ps.25 Contrary to the case of EcCPD bearingFADH•, the rate limiting step was not the primary photoreduc-tion anymore and subsequent kinetic steps could be resolved.The authors interpreted their results by the oxidized WHp beingreduced by the medium tryptophan (noted WHm) with lifetimesranging from 20 to 54 ps, while the oxidized WHm is reducedby the distal tryptophan (noted WHd) in the nanosecondregime.25
In the genome of the smallest known autotrophic eukaryote:the green alga Ostreococcus tauri,32 the group of Bowleridentified five CPF genes: three CPD-PL, one 64-PL and oneCRY-DASH.33 Since few studies were carried out on thephotoactivation of 64-PL25,34 and none was reported on CRY-DASH, we focused the present study on the photoactivation oftwo proteins of these subfamilies. OtCPF1 genetically groupswith 64-PL and animal CRY, and OtCPF2 is a CRY-DASH.Both proteins bind FAD and OtCPF2 also contains MTHF.33,35
Interestingly, OtCPF1 shows dual function: 64-PL activity andrepression of circadian-clock-controlled gene expression.33
OtCPF2 shows CPD-PL activity on double stranded DNA.33
We here report a thorough study of the primary eventsfollowing excitation of FADox in both OtCPF1 and OtCPF2,probed in real time by femtosecond broadband absorptionspectroscopy. Our measurements provide full spectra of thereaction intermediates, thereby allowing their chemical identi-fication. For this scope, we first made a quantitative determi-nation of the FAD and MTHF content of OtCPF2 by steady-state absorption and fluorescence spectroscopysthe corre-sponding study of OtCPF1 has already been published.35 Inaddition, homology modeling allowed us to propose a tentativestructure of the relative orientations of FAD and the conserved(11) Hitomi, K.; Okamoto, K.; Daiyasu, H.; Miyashita, H.; Iwai, S.; Toh,
H.; Ishiura, M.; Todo, T. Nucleic Acids Res. 2000, 28, 2353–2362.(12) Huang, Y. H.; Baxter, R.; Smith, B. S.; Partch, C. L.; Colbert, C. L.;
Deisenhofer, J. Proc. Natl. Acad. Sci. U.S.A. 2006, 103, 17701–17706.(13) Selby, C. P.; Sancar, A. Proc. Natl. Acad. Sci. U.S.A. 2006, 103,
17696–17700.(14) Pokorny, R.; Klar, T.; Hennecke, U.; Carell, T.; Batschauer, A.; Essen,
L. O. Proc. Natl. Acad. Sci. U.S.A. 2008, 105, 21023–21027.(15) Massey, V. Biochem. Soc. Trans. 2000, 28, 283–296.(16) Aubert, C.; Mathis, P.; Eker, A. P. M.; Brettel, K. Biochemistry 1999,
96, 5423–5427.(17) Aubert, C.; Vos, M. H.; Mathis, P.; Eker, A. P. M.; Brettel, K. Nature
2000, 405, 586–590.(18) Byrdin, M.; Eker, A. P. M.; Vos, M. H.; Brettel, K. Proc. Natl. Acad.
Sci. U.S.A. 2003, 100, 8676–8681.(19) Byrdin, M.; Sartor, V.; Eker, A. P. M.; Vos, M. H.; Aubert, C.; Brettel,
K.; Mathis, P. Biochim. Biophys. Acta Bioenerg. 2004, 1655, 64–70.(20) Byrdin, M.; Villette, S.; Eker, A. P. M.; Brettel, K. Biochemistry 2007,
46, 10072–10077.(21) Byrdin, M.; Villette, S.; Espagne, A.; Eker, A. P. M.; Brettel, K. J.
Phys. Chem. B 2008, 112, 6866–6871.(22) Lukacs, A.; Eker, A. P. M.; Byrdin, M.; Brettel, K.; Vos, M. H. J. Am.
Chem. Soc. 2008, 130, 14394–14395.(23) Lukacs, A.; Eker, A. P. M.; Byrdin, M.; Villette, S.; Pan, J.; Brettel,
K.; Vos, M. H. J. Phys. Chem. B 2006, 110, 15654–15658.(24) Byrdin, M.; Lukacs, A.; Thiagarajan, V.; Eker, A. P. M.; Brettel, K.;
Vos, M. H. J. Phys. Chem. A 2010, 114, 3207-3214.
(25) Kao, Y. T.; Tan, C.; Song, S. H.; Ozturk, N.; Li, J.; Wang, L. J.;Sancar, A.; Zhong, D. P. J. Am. Chem. Soc. 2008, 130, 7695–7701.
(26) Chosrowjan, H.; Taniguchi, S.; Mataga, N.; Tanaka, F.; Todoroki, D.;Kitamura, M. J. Phys. Chem. B 2007, 111, 8695–8697.
(27) Chosrowjan, H.; Taniguchi, S.; Mataga, N.; Tanaka, F.; Todoroki, D.;Kitamura, M. Chem. Phys. Lett. 2008, 462, 121–124.
(28) Mataga, N.; Chosrowjan, H.; Taniguchi, S.; Tanaka, F.; Kido, N.;Kitamura, M. J. Phys. Chem. B 2002, 106, 8917–8920.
(29) Nunthaboot, N.; Tanaka, F.; Kokpol, S.; Chosrowjan, H.; Taniguchi,S.; Mataga, N. J. Photochem. Photobiol. A 2009, 201, 191–196.
(30) Tanaka, F.; Chosrowjan, H.; Taniguchi, S.; Mataga, N.; Sato, K.;Nishina, Y.; Shiga, K. J. Phys. Chem. B 2007, 111, 5694–5699.
(31) Zhong, D. P.; Zewail, A. H. Proc. Natl. Acad. Sci. U.S.A. 2001, 98,11867–11872.
(32) Courties, C.; Vaquer, A.; Troussellier, M.; Lautier, J.; Chretiennotdinet,M. J.; Neveux, J.; Machado, C.; Claustre, H. Nature 1994, 370, 255–255.
(33) Heijde, M.; Zabulon, G.; Corellou, F.; Ishikawa, T.; Brazard, J.; Usman,A.; Plaza, P.; Martin, M. M.; Falciatore, A.; Todo, T.; Bouget, F.-Y.;Bowler, C. Plant Cell EnViron. Submitted.
(34) Weber, S.; Kay, C. W. M.; Mogling, H.; Mobius, K.; Hitomi, K.;Todo, T. Proc. Natl. Acad. Sci. U.S.A. 2002, 99, 1319–1322.
(35) Usman, A.; Brazard, J.; Martin, M. M.; Plaza, P.; Heijde, M.; Zabulon,G.; Bowler, C. J. Photochem. Photobiol. B 2009, 96, 38–48.
Figure 1. Chemical structures of flavin adenine dinucleotide (FAD, left)and 5,10-methenyl-tetrahydrofolate (MTHF, right).
4936 J. AM. CHEM. SOC. 9 VOL. 132, NO. 13, 2010
A R T I C L E S Brazard et al.
tryptophan triad. We finally report a study by femtosecondpolarized absorption spectroscopy, a method applied by thegroups of Brettel and Vos to the photoreduction of FADH• inEcCPD in order to resolve electron transfer between thetryptophan residues of the tryptophan chain, which are chemi-cally identical but differently oriented.21,22
2. Materials and Methods
2.1. Sample Preparation. OtCPF1 and OtCPF2 were overex-pressed in E. coli as glutathione S-transferase (GST) fusion proteins.The expression and purification protocols have already beendescribed for OtCPF135 and were also used for OtCPF2. Briefly,purification was made on a gluthatione Sepharose 4B resin(Amersham Biosciences) which binds the GST tag. The proteinswere released by adding a GSH (reduced L-gluthatione) rich elutionbuffer (Tris HCl pH 8.0 100 mmol L-1, NaCl 100 mmol L-1, GSH20 mmol L-1). We have shown in ref 35 that the presence of GSHin OtCPF1 samples induces large changes of the chromophorecomposition under continuous irradiation. Such an effect was notobserved for OtCPF2 (see section 3.1). GSH, was therefore removedfrom OtCPF1, but not OtCPF2, samples by dialysis on a Cellu SepT2 (6-8 kDa) membrane. The dialysis buffer contained: Tris HClpH 8.0, 100 mmol L-1, and NaCl 100 mmol L-1. It was changedfour times, every 30 min (the volume ratio of each step was 600).The purified proteins were concentrated by means of Microconcentrifugable membrane filters (10 kDa cutoff) in order to obtain afinal volume of 50 µL. The concentrated samples reached a maximalabsorbance (over 1-mm optical path) of: 0.04 at 448 nm for OtCPF1and 0.07-0.18 at 386 nm for OtCPF2. After addition of glycerol(10% vol/vol), they were stored at-80 °C. Before each experiment,the samples were thawed at 0 °C, then centrifuged for 10 min at14,000 rpm (15500g), at 5 °C, in order to remove aggregatedproteins.
The denaturated sample of OtCPF2 was obtained by heating thenative protein at 65 °C for 10 min. Treatment of OtCPF2 withsodium borohydride was performed at 0 °C by adding freshlyprepared 100 mmol L-1 solution of sodium borohydride (purchasedfrom Merck) in Tris buffer.
2.2. Steady-State Spectroscopy and Photolysis. UV-vis ab-sorption spectra were recorded with double-beam UV spectropho-tometers: UV-mc2 (Safas) or Cary 300 (Varian). Fluorescencespectra were measured with a fully corrected Fluoromax-3 (JobinYvon) spectrofluorometer. For steady-state photolysis, the samplecontained in a 2 × 10 mm cuvette was irradiated either at 400 or470 nm by the spectrofluorometer excitation beam. Measurementson the chromophore released in the solution after heat denaturationwere done at room temperature. For all other experiments, the cellwas thermostatted at 5 °C by a temperature-controlled bath(Minichiller Inox, Huber).
The cofactor composition of the sample was determined aspreviously detailed35 by fitting the absorption spectrum of theprotein to a sum of reference spectra of the pure components(namely FADox, FADH•, FADH- and, in the case of OtCPF2,MTHF). The apoprotein concentration, yielding the apoprotein/FADratio, was assessed both by measurement of the mass of precipitatedapoprotein upon heat denaturation and measurement of the UVabsorbance at 280 nm.35 We give here the average of the (close)values found by the two measurements.
2.3. Time-Resolved Absorption Spectroscopy. Broadband(350-750 nm) femtosecond transient absorption spectra wererecorded by the pump-probe with white-light continuum technique.The laser source is a commercial amplified Ti:Sapphire laser system(Tsunami+Spitfire, Spectra Physics) delivering 50-fs pulses at 775nm, at 1 kHz repetition rate. The 470-nm pump beam (55 fs) wasgenerated by using a two-stage noncollinear optical parametricamplifier (NOPA, Clark-MXR). The energy used to excite thesamples ranged from 230 to 330 nJ per pulse, focused on a diameterof about 80 µm. Care was taken to check that this fluence lay in
the linear regime. The continuum probe beam was generated byfocusing a few µJ/pulse of the 775-nm beam on a moving CaF2
plate and split into a sample beam and a reference beam. The pumpand probe beams were focused by 90° off-axis parabolic mirrorsonto the sample cell and crossed at an angle of ca. 5°. The diameterof the pump beam slightly exceeded that of the probe beam. Theprobe beam was delayed with respect to the pump beam by amotorized optical delay line. The sample solutions were containedin 2-mm-wide, 1-mm-thick, fused-silica cuvettes, thermostatted at5 °C to prevent protein degradation. The cuvette holder wascontinuously moved up and down (one dimension) in order to avoidphotolysis, at a maximum speed of 20 mm/sec (which guaranteesat displacement of 120 µm between each pump shot); the oscillationfrequency was about 0.4 Hz. The experiments were stopped beforeany substantial degradation of the sample, inducing scattering ofthe probe beam, became visible (the steady-state absorbance of thesamples was continuously monitored during the experiments). Theprobe beams (reference and sample) were then dispersed in aspectrograph (Acton SP306i) and recorded at 333 Hz on a CCDcamera (Roper Scientific, Spec-10 100B, 100 × 1340 pixels); 6000to 24000 pump shots were averaged to obtain the differentialabsorbance (∆A) spectra. For isotropic conditions, the linearpolarizations of the pump and probe beams were set at the magicangle (54.7°). For anisotropic conditions, they were set at 45°, andanalyzers were inserted after the sample to alternatively record theparallel and perpendicular contributions.
The ∆A spectra were corrected from the chirp of the probebeamsindependently measured by recording cross-phase modula-tion in the pure solvent. Scattering of the pump beam was removedof the differential spectra, both for data analysis and figurepresentation.
2.4. Data Analysis. The transient absorption data were globallyfitted to a sum of exponential functions, convoluted by a Gaussianfunction representing the setup response function, after dimensionalreduction and noise filtering (see all technical details in ref 36) bysingular value decomposition (SVD).37 The number of retainedsingular values at the stage of analysis of the truncated data matrix(where times below ∼200 fs were removed in order to get rid of aof a cross-phase modulation artifact during pump-probe overlap)was four, which was enough to ensure that no information losscould alter the subsequent global fitting procedure. The decay-associated difference spectrum (DADS, i.e. spectrum of preexpo-nential factors) of each time component was calculated over theentire experimental spectral range. This description allowed us tocalculate the differential spectra associated to the species (species-associated difference spectra, SADS) of simple kinetic models.38
For a sequential scheme with 100% conversion yield from onespecies to the next and increasing lifetimes, SADS are namedevolution-associated difference spectra (EADS).39 The EADSprovide a dynamically meaningful abstract of the experimental data,which benefits both from deconvolution of the response function(EADS1 is the differential spectrum of initial excited state,extrapolated at t ) 0) and SVD noise reduction.
2.5. Homology Modeling. The sequences of the OtCPF1 andOtCPF2 genes were aligned on other CPF genes, and homologymodels were subsequently generated by optimizing the tertiarystructure of the proteins on the basis of proper templates. Detailson the methods used for this work are given in SupportingInformation (section 8).
(36) Brazard, J.; Ley, C.; Lacombat, F.; Plaza, P.; Martin, M. M.; Checcucci,G.; Lenci, F. J. Phys. Chem. B 2008, 112, 15182–15194.
(37) Henry, E. R.; Hofrichter, J. Methods Enzymol. 1992, 210, 129–193.(38) Ernsting, N. P.; Kovalenko, S. A.; Senyushkina, T.; Saam, J.;
Farztdinov, V. J. Phys. Chem. A 2001, 105, 3443–3453.(39) van Stokkum, I. H. M.; Delmar, S. L.; van Grondelle, R. Biochim.
Biophys. Acta Bioenerg. 2004, 1657, 82–104.
J. AM. CHEM. SOC. 9 VOL. 132, NO. 13, 2010 4937
Photoactivation of Two New Oxidized CPF Proteins A R T I C L E S
3. Results
In the following subsections, we first report the steady-stateabsorption and fluorescence spectroscopy of OtCPF2 allowingthe quantitative analysis of its FAD and MTHF chromophorecontent. We then present the study of the primary eventsfollowing excitation of FADox in both OtCPF1 and OtCPF2,by femtosecond isotropic broadband absorption spectroscopy.We finally report a study of OtCPF2 by femtosecond polarizedabsorption spectroscopy.
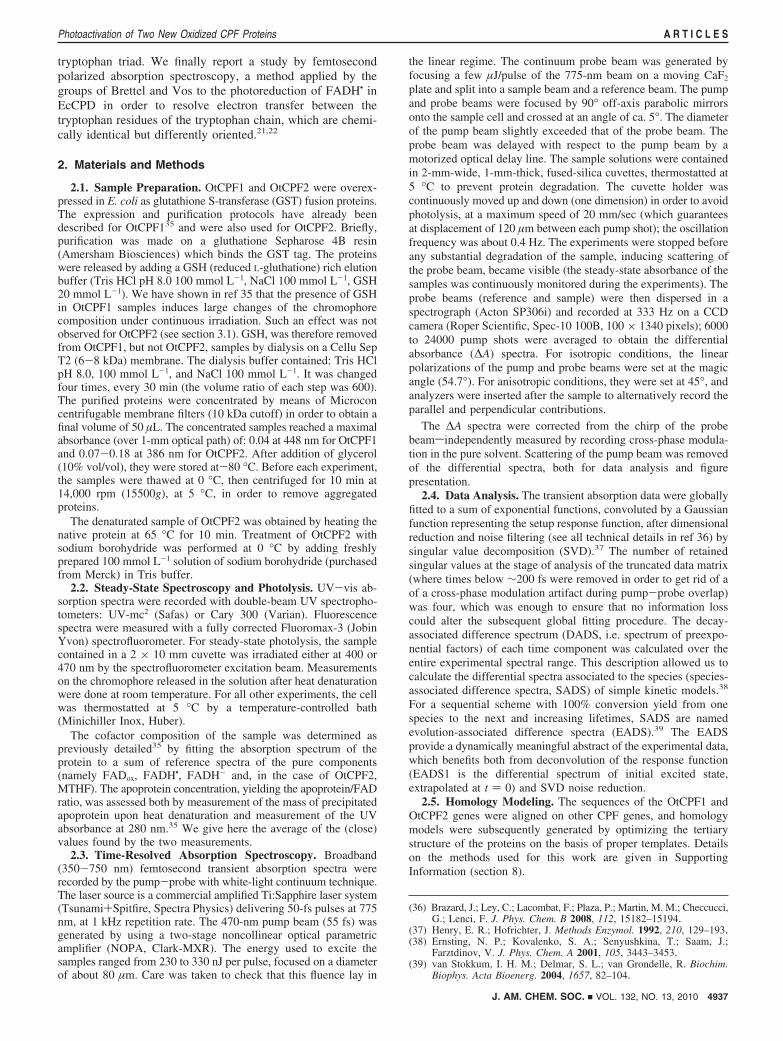
3.1. Cofactor Content of OtCPF1 and OtCPF2. As mentionedin the Introduction, the steady-state spectroscopic properties ofOtCPF1 were previously published.35 After purification, its onlynoncovalently bound cofactor is FAD, mainly found in theoxidized form (FADox), absorbing around 366 and 448 nm. Theabsorption spectrum of OtCPF2 is more complex (Figure 2). Itconsists of a major band centered at 386 nm, a weak band at470 nm and a minor band extending from 500 to 675 nm. Theintense peak at 386 nm shows the presence of enzyme-boundMTHF,4,40 and the small bands between 450 and 700 nmindicate the coexistence of flavins in oxidized and neutralsemiquinone states.41 The presence of fully reduced flavincannot be excluded because this state significantly absorbsbetween 320 and 450 nm, although with a lower molarextinction coefficient than MTHF.42
Further chemical tests evidenced the presence of MTHF andFAD in OtCPF2 (see details in Supporting Information, section1). The fluorescence spectrum of OtCPF2 shows a peak at 493nm mainly due to MTHF. This peak disappears upon reactingthe protein with sodium borohydride, which is characteristic ofthe presence of MTHF.43 Moreover, the fluorescence of theflavin released from the protein upon heat denaturation showsa peak at 525 nm. This typical emission of fully oxidized flavinshows a 5-fold intensity increase upon lowering the pH from8.0 to 3.0. This effect, which is not observed for flavin
mononucleotide or riboflavin, clearly characterizes FAD. It isdue to the protonation of the adenine at pH 3.0 and thesubsequent opening of the stacked intramolecular complexwhich partly quenches the fluorescence of the isoalloxazine atpH 8.0.44,45 It is therefore established that the flavin nonco-valently bound to OtCPF2 is FAD.
As mentioned above, FAD is likely found in three redox states(FADox, FADH• and FADH-) in OtCPF2. As previouslydescribed for OtCPF1,35 we confirmed this hypothesis byglobally fitting the absorption spectrum of our OtCPF2 sampleswith a weighted sum of the absorption coefficient spectra ofFADox, FADH•, FADH- and, in the present case, of MTHF.The best fit was obtained by using published spectra of thesespecies bound to E. coli CPD photolyase.41 The good qualityof the fit (see Figure 2, red line) indicates there is no otherchromophore, absorbing in the UV-vis domain, bound toOtCPF2. For a freshly thawed diluted sample the resultingconcentrations were: [FADox] ) 7.7 ( 0.1 µmol L-1 (26% oftotal FAD content), [FADH•] ) 2.6 ( 0.2 µmol L-1 (9%),[FADH-] ) 18.7 ( 0.3 µmol L-1 (65%) and [MTHF] ) 19.05( 0.05 µmol L-1. The total concentration of FAD and theconcentration of MTHF were also calculated by a global fit ofthe absorption spectrum of the supernatant obtained after heatdenaturation of OtCPF2 (see Supporting Information, section2) and were found in very good agreement with the presentresults. We retained the average values, i.e.: [FAD] ) 28.5 (0.7 µmol L-1 and [MTHF] ) 19.8 ( 0.3 µmol L-1. It appearsthat MTHF is in substoichiometric ratio (0.69) relative to FAD,which had already been observed for other CPF proteins.1
The presence of FADox and FADH• in purified OtCPF2samples is likely due to the oxidation of FADH- duringpurification and storage of the proteins under aerobic conditions.The mixture of FAD redox states may not reflect a physiologicalfunction of OtCPF2. The predominance of FADH- in purifiedOtCPF2, as opposed to purified OtCPF1, may indicate that FADis mainly in its fully reduced form in ViVo and/or that thechromophore is less exposed to air in OtCPF2 than in OtCPF1.
The apoprotein concentration of OtCPF2 was found to be 39( 8 µmol L-1. The FAD/apoprotein and MTHF/apoproteinratios are 73% and 51%, respectively. These substoichiometricratios were already reported in the literature for other purifiedCPF proteins.1
Contrary to OtCPF1,35 OtCPF2 samples are photochemicallystable at 5 °C, upon continuous irradiation at 400 and 470 nm,even without removing GSH. We interpret this stability byassuming that the slow electron recombination reaction occurringafter photoreduction of FAD is, in OtCPF2, faster than thereduction of the oxidized protein residue, i.e. the distal WHd
radical if the Brettel-Vos mechanism applies, by reducedglutathione. This radical may as well be less exposed to thesolvent in OtCPF2 than in OtCPF1.
3.2. Isotropic Transient Absorption Spectroscopy ofOtCPF1. The absorbance of the OtCPF1-dialyzed sample chosenfor transient absorption spectroscopy was 0.04 at 448 nm. Thecorresponding distribution of ground-state species was: 66%FADox, 7% FADH• and 27% FADH-. After excitation ofdialyzed OtCPF1 with 55 fs pulses at 470 nm, the initial excited-state fractions (xi*; the star indicates the excited state) werecalculated to be 88% FADox*, 5% FADH•* and 7% FADH-*,by using the following formula (for each species i):
(40) Worthington, E. N.; Kavakli, I. H.; Berrocal-Tito, G.; Bondo, B. E.;Sancar, A. J. Biol. Chem. 2003, 278, 39143–39154.
(41) Jorns, M. S.; Wang, B. Y.; Jordan, S. P.; Chanderkar, L. P.Biochemistry. 1990, 29, 552–561.
(42) Song, S. H.; Dick, B.; Penzkofer, A.; Pokorny, R.; Batschauer, A.;Essen, L. O. J. Photochem. Photobiol. B 2006, 85, 1–16.
(43) Hamm-Alvarez, S.; Sancar, A.; Rajagopalan, K. V. J. Biol. Chem.1989, 264, 9649–9656.
(44) Faeder, E. J.; Siegel, L. M. Anal. Biochem. 1973, 53, 332–336.(45) Barrio, J. R.; Tolman, G. L.; Leonard, N. J.; Spencer, R. D.; Weber,
G. Proc. Natl. Acad. Sci. U.S.A. 1973, 70, 941–943.
Figure 2. Steady-state absorption spectrum of OtCPF2 in Tris buffer (black)and the corresponding best fit (red) obtained with a weighted sum of thespectra of FADox, FADH•, FADH- and MTHF bound in E. coli CPDphotolyase.41
4938 J. AM. CHEM. SOC. 9 VOL. 132, NO. 13, 2010
A R T I C L E S Brazard et al.
where ci is the ground-state concentration of species i and ε470(i)is the molar extinction coefficient of species i, averaged between460 and 480 nm in order to account for the broad spectral widthof the excitation pulse.
Although the initial excited population is a mixture of states,it mainly contains excited FADox. It is worth noting that, contraryto our previous steady-state photolysis findings,35 no accumula-tion of any photoproduct was detected during the presentexperiments. This is due to the dialysis of the OtCPF1 samplewhich efficiently removed GSH.
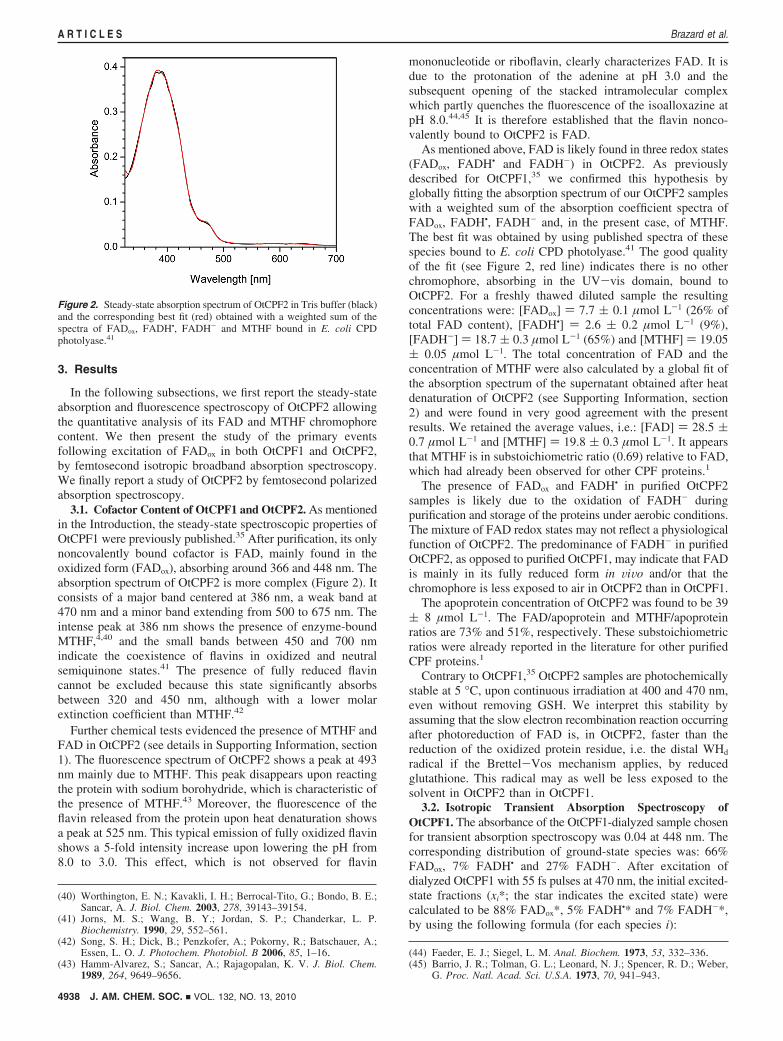
Figure 3 presents an overview of transient absorption spectraof OtCPF1 after excitation at 470 nm, for pump-probe delaysranging between 0.2 and 1400 ps. At 0.2 ps delay (Figure 3A)one observes three positive ∆A bands that are dominated bytransient absorption contributions: a large one starting below416 nm, a small one centered around 508 nm, and a broadstructure extending beyond 580 nm. Ground-state bleaching isclearly seen around 447 nm and gives rise to a net negativeband between 416 nm and about 490 nm, where it is dominant.Stimulated emission is apparent around 540 nm althoughsuperimposed to a transient-absorption background. Stimulatedemission is dominant and produces a net negative peak, between527 and 580 nm only.
The general shape of this differential spectrum is fullycompatible with the excitation of FADox essentially. Thedifference with transient spectra of oxidized FAD46 or ribofla-vin47 in solution mostly lies in the position of the stimulated-emission band, which is blue-shifted in the case of OtCPF1.This effect is likely due to the lower polarity of the FAD bindingpocket, as compared to bulk water. The temporal evolution ofthe spectra shows three phases:
• Phase 1 (Figure 3A): The blue positive band and thebleaching band remain stable between 0.2 and 1 ps. Thestimulated emission contribution, however, disappears andleaves a positive band, a maximum of which is seen around590 nm. A nontrivial (∆A * 0) temporary isosbestic pointis seen at 655 nm.
• Phase 2 (Figure 3B): Between 1 and 20 ps, one notes aweak quasi-proportional (homothetic) decay of all the bandsexcept for the transient absorption one at 493-527 nm,which decays slightly more steeply.
• Phase 3 (Figure 3C): All bands decay slowly and quasi-proportionally between 20 and 1400 ps.
Figure 3A, demonstrates that a photoinduced reaction occursbetween 0.2 and 1 ps. The disappearance of stimulated emission,but not of ground-state bleaching, shows that FADox undergoesprompt de-excitation and concomitantly produces new photo-products responsible for the subsequent transient absorptionchanges. This scheme is in good agreement with the nontrivialtemporary isosbestic point observed at 655 nm. The fact thatnearly no ground-state recovery occurs indicates that this earlyreaction has a very high yield. According to our previousobservation of a photoreduction of FADox under continuousirradiation,35 the present reaction is likely to be assigned to theprimary reduction of excited FADox. The literature on the
photoactivation of FAD inside of CPF proteins,16–23 and otherflavoproteins,26–31,48 points to the involvement of a proximalaromatic amino acid, tryptophan or tyrosine, as the electrondonor. The analysis of the spectra after 1 ps pump-probe delaywill allow a precise determination of this donor (see Discussion,section 4.1.1). In the meantime note that partial ground-staterecovery is seen after 1 ps delay, accompanied by a few spectralmodifications of the photoproducts, and that a long-lived residualphotoproduct spectrum is still observed at 1.4 ns.
Global analysis of the data was performed with best resultsby using three exponential components plus a plateau. Thelifetimes of the exponentials were found to be: 0.39 ( 0.03 ps,9 ( 2 ps and 81 ( 8 ps. The corresponding DADS (pre-exponential factor spectra) are given and commented in Sup-porting Information (section 3). The EADS (see definition insection 2.4) are provided as well.
3.3. Isotropic Transient Absorption Spectroscopy ofOtCPF2. The OtCPF2 sample used for isotropic transientabsorption spectroscopy is called OtCPF2-Iso. Its ground-statechromophore distribution is the following: 16% FADox, 2%FADH•, 36% FADH-, and 46% MTHF. After excitation at 470nm (55 fs pulses), the distribution of the initial excited states isexpected to be the following: 78% FADox*, 5% FADH•*, 10%FADH-*, and 7% MTHF*. The main excited species is FADox.
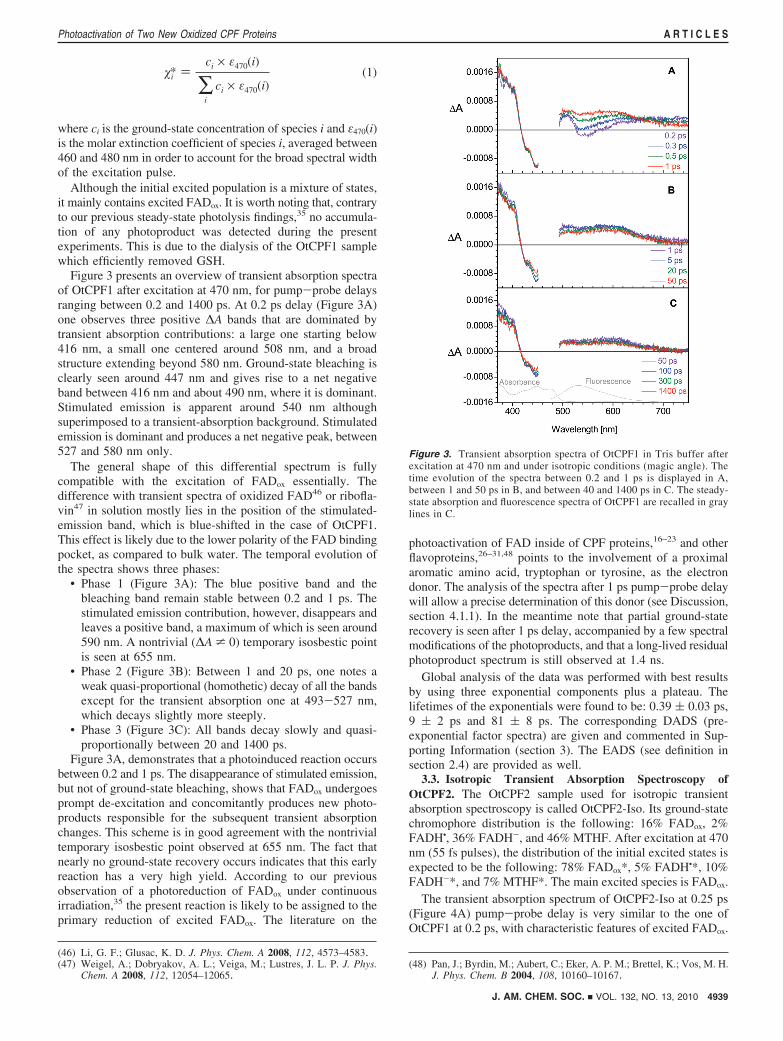
The transient absorption spectrum of OtCPF2-Iso at 0.25 ps(Figure 4A) pump-probe delay is very similar to the one ofOtCPF1 at 0.2 ps, with characteristic features of excited FADox.
(46) Li, G. F.; Glusac, K. D. J. Phys. Chem. A 2008, 112, 4573–4583.(47) Weigel, A.; Dobryakov, A. L.; Veiga, M.; Lustres, J. L. P. J. Phys.
Chem. A 2008, 112, 12054–12065.(48) Pan, J.; Byrdin, M.; Aubert, C.; Eker, A. P. M.; Brettel, K.; Vos, M. H.
J. Phys. Chem. B 2004, 108, 10160–10167.
�i* )ci × ε470(i)
∑i
ci × ε470(i)(1)
Figure 3. Transient absorption spectra of OtCPF1 in Tris buffer afterexcitation at 470 nm and under isotropic conditions (magic angle). Thetime evolution of the spectra between 0.2 and 1 ps is displayed in A,between 1 and 50 ps in B, and between 40 and 1400 ps in C. The steady-state absorption and fluorescence spectra of OtCPF1 are recalled in graylines in C.
J. AM. CHEM. SOC. 9 VOL. 132, NO. 13, 2010 4939
Photoactivation of Two New Oxidized CPF Proteins A R T I C L E S
The temporal evolution of spectra between 0.25 and 1400 ps isplotted in Figure 4. As for OtCPF1, it can be divided in threephases:
• Phase 1 (Figure 4A): the bleaching band (peaking at 442nm) and the blue transient absorption band (below 415 nm)do not evolve for 0.25 to 1.5 ps pump-probe delays.During the same time, the stimulated-emission band (peak-ing around 540 nm) disappears and is replaced by a broadtransient absorption band. A temporary isosbestic point isobserved at 654 nm.
• Phase 2 (Figure 4B): a weak and quasi-proportional decayof all bands, including bleaching, is observed between 1.5and 50 ps. The transient absorption band around 505 nmis seen to flatten slightly.
• Phase 3 (Figure 4C): little evolution of the spectra is seenfrom 200 to 1400 ps, except for a decrease of the visibletransient absorption, around 600 nm.
A photoreaction obviously occurs between 0.25 and 1.5 ps,evidenced by the loss of stimulated emission, the simultaneousgrowth of a new transient absorption band and the presence ofan isosbestic point at 654 nm. Almost no recovery of the groundstate occurs in this period of time, since the bleaching banddoes not evolve. As previously seen for OtCPF1, photoreductionof excited FADox is expected and the electron donor could bea nearby aromatic amino acid, a tryptophan or a tyrosine. Afterthe initial photoreaction, a partial ground-state recovery isobserved between 1.5 and 50 ps and a residual, apparently long-lived, spectrum remains at 1.4 ns.
The data were globally fitted to a sum of three exponentialcomponents plus a plateau. The lifetimes of the exponentialswere found to be: 0.59 ( 0.03 ps, 13 ( 3 ps and 340 ( 43 ps.The corresponding DADS and EADS are given in SupportingInformation (section 4). Let us note for now that DADS2,attached to the 13-ps lifetime, presents a shallow dip around540 nm which evokes the loss of a stimulated emissioncontribution.
3.4. Polarized Transient Absorption Spectroscopy ofOtCPF2. We measured polarized transient absorption spectraof an OtCPF2 sample (called OtCPF2-Aniso), which happenedto be more dilute than OtCPF-Iso. The initial excited-statepopulation of OtCPF2-Aniso is mainly made of FADox* (in fact:64% FADox*, 12% FADH•*, 16% FADH-* and 8% MTHF*).
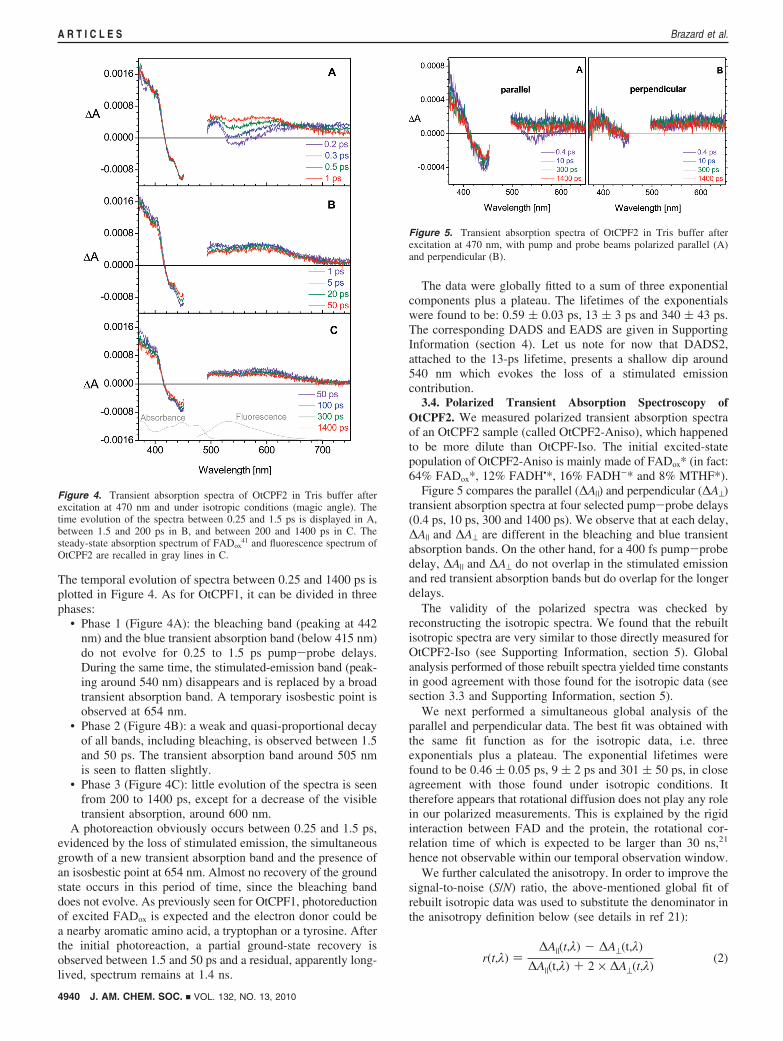
Figure 5 compares the parallel (∆A|) and perpendicular (∆A⊥)transient absorption spectra at four selected pump-probe delays(0.4 ps, 10 ps, 300 and 1400 ps). We observe that at each delay,∆A| and ∆A⊥ are different in the bleaching and blue transientabsorption bands. On the other hand, for a 400 fs pump-probedelay, ∆A| and ∆A⊥ do not overlap in the stimulated emissionand red transient absorption bands but do overlap for the longerdelays.
The validity of the polarized spectra was checked byreconstructing the isotropic spectra. We found that the rebuiltisotropic spectra are very similar to those directly measured forOtCPF2-Iso (see Supporting Information, section 5). Globalanalysis performed of those rebuilt spectra yielded time constantsin good agreement with those found for the isotropic data (seesection 3.3 and Supporting Information, section 5).
We next performed a simultaneous global analysis of theparallel and perpendicular data. The best fit was obtained withthe same fit function as for the isotropic data, i.e. threeexponentials plus a plateau. The exponential lifetimes werefound to be 0.46 ( 0.05 ps, 9 ( 2 ps and 301 ( 50 ps, in closeagreement with those found under isotropic conditions. Ittherefore appears that rotational diffusion does not play any rolein our polarized measurements. This is explained by the rigidinteraction between FAD and the protein, the rotational cor-relation time of which is expected to be larger than 30 ns,21
hence not observable within our temporal observation window.We further calculated the anisotropy. In order to improve the
signal-to-noise (S/N) ratio, the above-mentioned global fit ofrebuilt isotropic data was used to substitute the denominator inthe anisotropy definition below (see details in ref 21):
Figure 4. Transient absorption spectra of OtCPF2 in Tris buffer afterexcitation at 470 nm and under isotropic conditions (magic angle). Thetime evolution of the spectra between 0.25 and 1.5 ps is displayed in A,between 1.5 and 200 ps in B, and between 200 and 1400 ps in C. Thesteady-state absorption spectrum of FADox
41 and fluorescence spectrum ofOtCPF2 are recalled in gray lines in C.
Figure 5. Transient absorption spectra of OtCPF2 in Tris buffer afterexcitation at 470 nm, with pump and probe beams polarized parallel (A)and perpendicular (B).
r(t,λ) )∆A|(t,λ) - ∆A⊥(t,λ)
∆A|(t,λ) + 2 × ∆A⊥(t,λ)(2)
4940 J. AM. CHEM. SOC. 9 VOL. 132, NO. 13, 2010
A R T I C L E S Brazard et al.
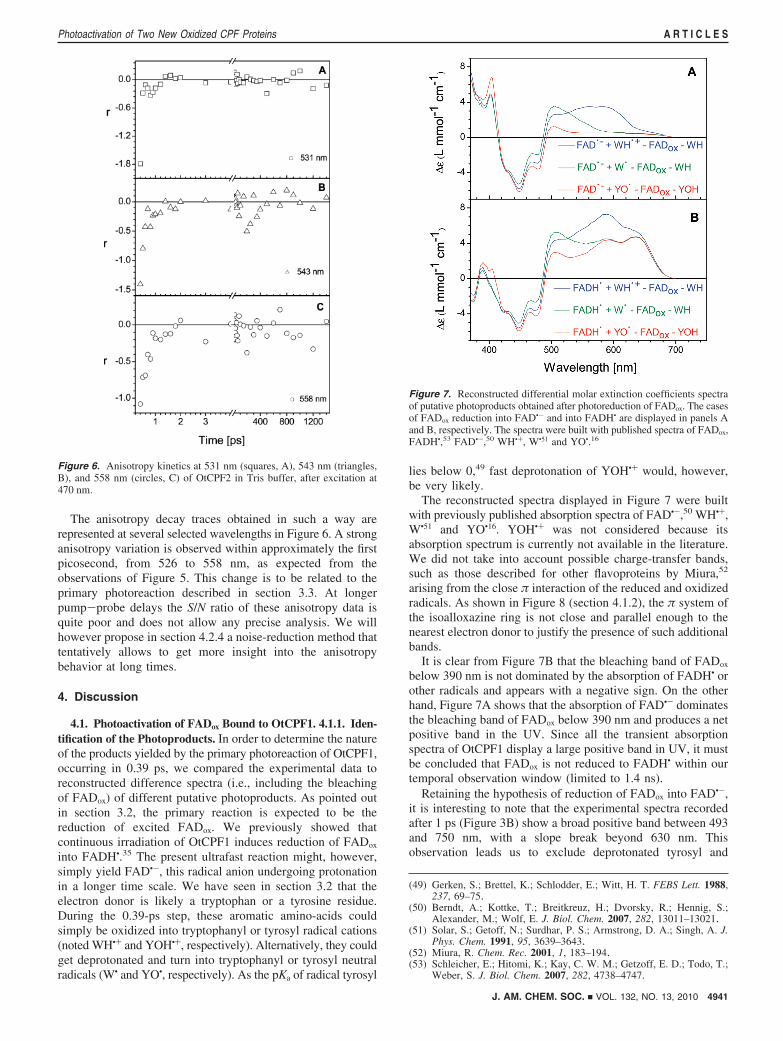
The anisotropy decay traces obtained in such a way arerepresented at several selected wavelengths in Figure 6. A stronganisotropy variation is observed within approximately the firstpicosecond, from 526 to 558 nm, as expected from theobservations of Figure 5. This change is to be related to theprimary photoreaction described in section 3.3. At longerpump-probe delays the S/N ratio of these anisotropy data isquite poor and does not allow any precise analysis. We willhowever propose in section 4.2.4 a noise-reduction method thattentatively allows to get more insight into the anisotropybehavior at long times.
4. Discussion
4.1. Photoactivation of FADox Bound to OtCPF1. 4.1.1. Iden-tification of the Photoproducts. In order to determine the natureof the products yielded by the primary photoreaction of OtCPF1,occurring in 0.39 ps, we compared the experimental data toreconstructed difference spectra (i.e., including the bleachingof FADox) of different putative photoproducts. As pointed outin section 3.2, the primary reaction is expected to be thereduction of excited FADox. We previously showed thatcontinuous irradiation of OtCPF1 induces reduction of FADox
into FADH•.35 The present ultrafast reaction might, however,simply yield FAD•-, this radical anion undergoing protonationin a longer time scale. We have seen in section 3.2 that theelectron donor is likely a tryptophan or a tyrosine residue.During the 0.39-ps step, these aromatic amino-acids couldsimply be oxidized into tryptophanyl or tyrosyl radical cations(noted WH•+ and YOH•+, respectively). Alternatively, they couldget deprotonated and turn into tryptophanyl or tyrosyl neutralradicals (W• and YO•, respectively). As the pKa of radical tyrosyl
lies below 0,49 fast deprotonation of YOH•+ would, however,be very likely.
The reconstructed spectra displayed in Figure 7 were builtwith previously published absorption spectra of FAD•-,50 WH•+,W•51 and YO•16. YOH•+ was not considered because itsabsorption spectrum is currently not available in the literature.We did not take into account possible charge-transfer bands,such as those described for other flavoproteins by Miura,52
arising from the close π interaction of the reduced and oxidizedradicals. As shown in Figure 8 (section 4.1.2), the π system ofthe isoalloxazine ring is not close and parallel enough to thenearest electron donor to justify the presence of such additionalbands.
It is clear from Figure 7B that the bleaching band of FADox
below 390 nm is not dominated by the absorption of FADH• orother radicals and appears with a negative sign. On the otherhand, Figure 7A shows that the absorption of FAD•- dominatesthe bleaching band of FADox below 390 nm and produces a netpositive band in the UV. Since all the transient absorptionspectra of OtCPF1 display a large positive band in UV, it mustbe concluded that FADox is not reduced to FADH• within ourtemporal observation window (limited to 1.4 ns).
Retaining the hypothesis of reduction of FADox into FAD•-,it is interesting to note that the experimental spectra recordedafter 1 ps (Figure 3B) show a broad positive band between 493and 750 nm, with a slope break beyond 630 nm. Thisobservation leads us to exclude deprotonated tyrosyl and
(49) Gerken, S.; Brettel, K.; Schlodder, E.; Witt, H. T. FEBS Lett. 1988,237, 69–75.
(50) Berndt, A.; Kottke, T.; Breitkreuz, H.; Dvorsky, R.; Hennig, S.;Alexander, M.; Wolf, E. J. Biol. Chem. 2007, 282, 13011–13021.
(51) Solar, S.; Getoff, N.; Surdhar, P. S.; Armstrong, D. A.; Singh, A. J.Phys. Chem. 1991, 95, 3639–3643.
(52) Miura, R. Chem. Rec. 2001, 1, 183–194.(53) Schleicher, E.; Hitomi, K.; Kay, C. W. M.; Getzoff, E. D.; Todo, T.;
Weber, S. J. Biol. Chem. 2007, 282, 4738–4747.
Figure 6. Anisotropy kinetics at 531 nm (squares, A), 543 nm (triangles,B), and 558 nm (circles, C) of OtCPF2 in Tris buffer, after excitation at470 nm.
Figure 7. Reconstructed differential molar extinction coefficients spectraof putative photoproducts obtained after photoreduction of FADox. The casesof FADox reduction into FAD•- and into FADH• are displayed in panels Aand B, respectively. The spectra were built with published spectra of FADox,FADH•,53 FAD•-,50 WH•+, W•51 and YO•.16
J. AM. CHEM. SOC. 9 VOL. 132, NO. 13, 2010 4941
Photoactivation of Two New Oxidized CPF Proteins A R T I C L E S
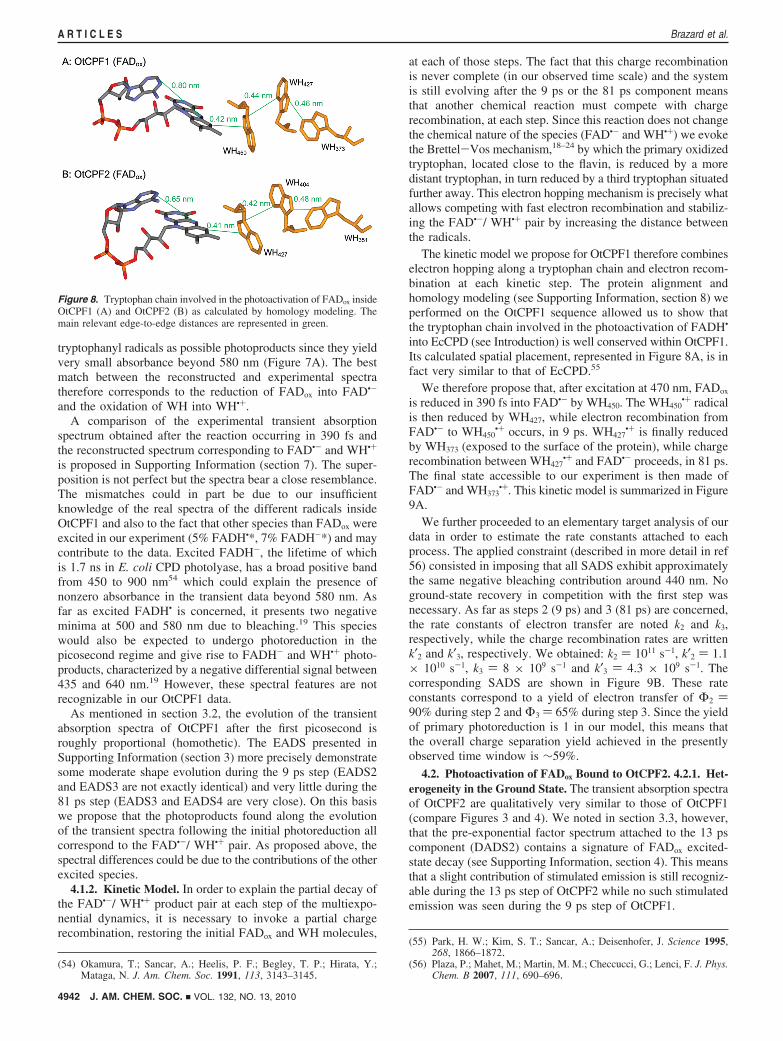
tryptophanyl radicals as possible photoproducts since they yieldvery small absorbance beyond 580 nm (Figure 7A). The bestmatch between the reconstructed and experimental spectratherefore corresponds to the reduction of FADox into FAD•-
and the oxidation of WH into WH•+.A comparison of the experimental transient absorption
spectrum obtained after the reaction occurring in 390 fs andthe reconstructed spectrum corresponding to FAD•- and WH•+
is proposed in Supporting Information (section 7). The super-position is not perfect but the spectra bear a close resemblance.The mismatches could in part be due to our insufficientknowledge of the real spectra of the different radicals insideOtCPF1 and also to the fact that other species than FADox wereexcited in our experiment (5% FADH•*, 7% FADH-*) and maycontribute to the data. Excited FADH-, the lifetime of whichis 1.7 ns in E. coli CPD photolyase, has a broad positive bandfrom 450 to 900 nm54 which could explain the presence ofnonzero absorbance in the transient data beyond 580 nm. Asfar as excited FADH• is concerned, it presents two negativeminima at 500 and 580 nm due to bleaching.19 This specieswould also be expected to undergo photoreduction in thepicosecond regime and give rise to FADH- and WH•+ photo-products, characterized by a negative differential signal between435 and 640 nm.19 However, these spectral features are notrecognizable in our OtCPF1 data.
As mentioned in section 3.2, the evolution of the transientabsorption spectra of OtCPF1 after the first picosecond isroughly proportional (homothetic). The EADS presented inSupporting Information (section 3) more precisely demonstratesome moderate shape evolution during the 9 ps step (EADS2and EADS3 are not exactly identical) and very little during the81 ps step (EADS3 and EADS4 are very close). On this basiswe propose that the photoproducts found along the evolutionof the transient spectra following the initial photoreduction allcorrespond to the FAD•-/ WH•+ pair. As proposed above, thespectral differences could be due to the contributions of the otherexcited species.
4.1.2. Kinetic Model. In order to explain the partial decay ofthe FAD•-/ WH•+ product pair at each step of the multiexpo-nential dynamics, it is necessary to invoke a partial chargerecombination, restoring the initial FADox and WH molecules,
at each of those steps. The fact that this charge recombinationis never complete (in our observed time scale) and the systemis still evolving after the 9 ps or the 81 ps component meansthat another chemical reaction must compete with chargerecombination, at each step. Since this reaction does not changethe chemical nature of the species (FAD•- and WH•+) we evokethe Brettel-Vos mechanism,18–24 by which the primary oxidizedtryptophan, located close to the flavin, is reduced by a moredistant tryptophan, in turn reduced by a third tryptophan situatedfurther away. This electron hopping mechanism is precisely whatallows competing with fast electron recombination and stabiliz-ing the FAD•-/ WH•+ pair by increasing the distance betweenthe radicals.
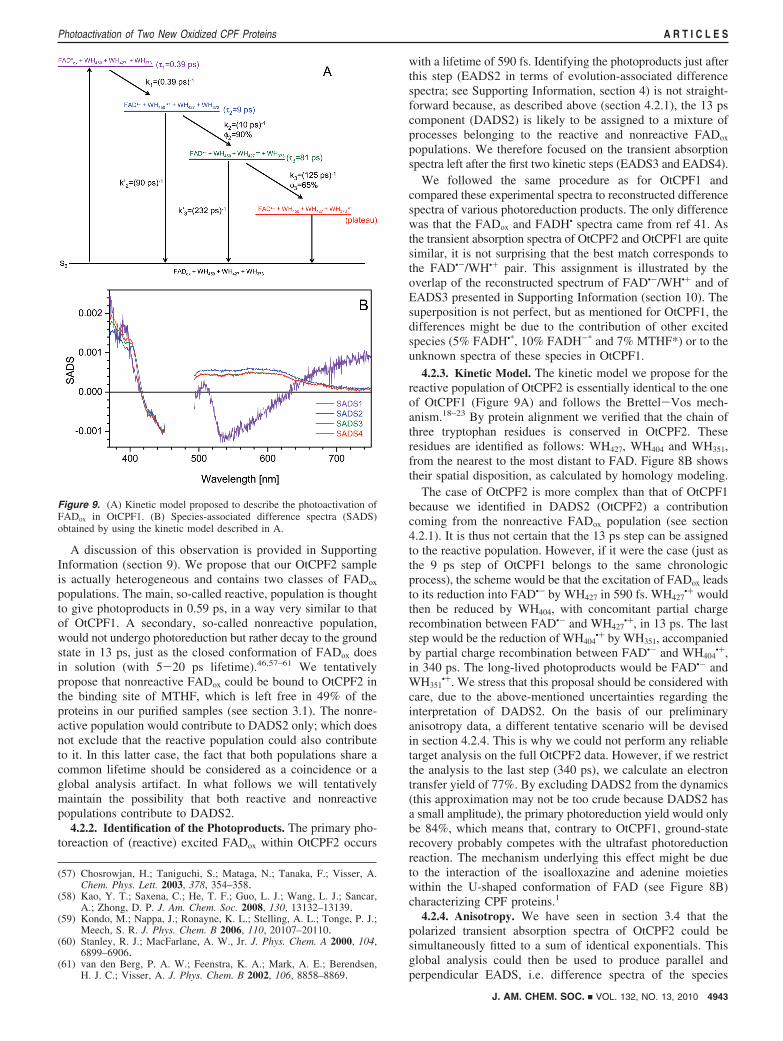
The kinetic model we propose for OtCPF1 therefore combineselectron hopping along a tryptophan chain and electron recom-bination at each kinetic step. The protein alignment andhomology modeling (see Supporting Information, section 8) weperformed on the OtCPF1 sequence allowed us to show thatthe tryptophan chain involved in the photoactivation of FADH•
into EcCPD (see Introduction) is well conserved within OtCPF1.Its calculated spatial placement, represented in Figure 8A, is infact very similar to that of EcCPD.55
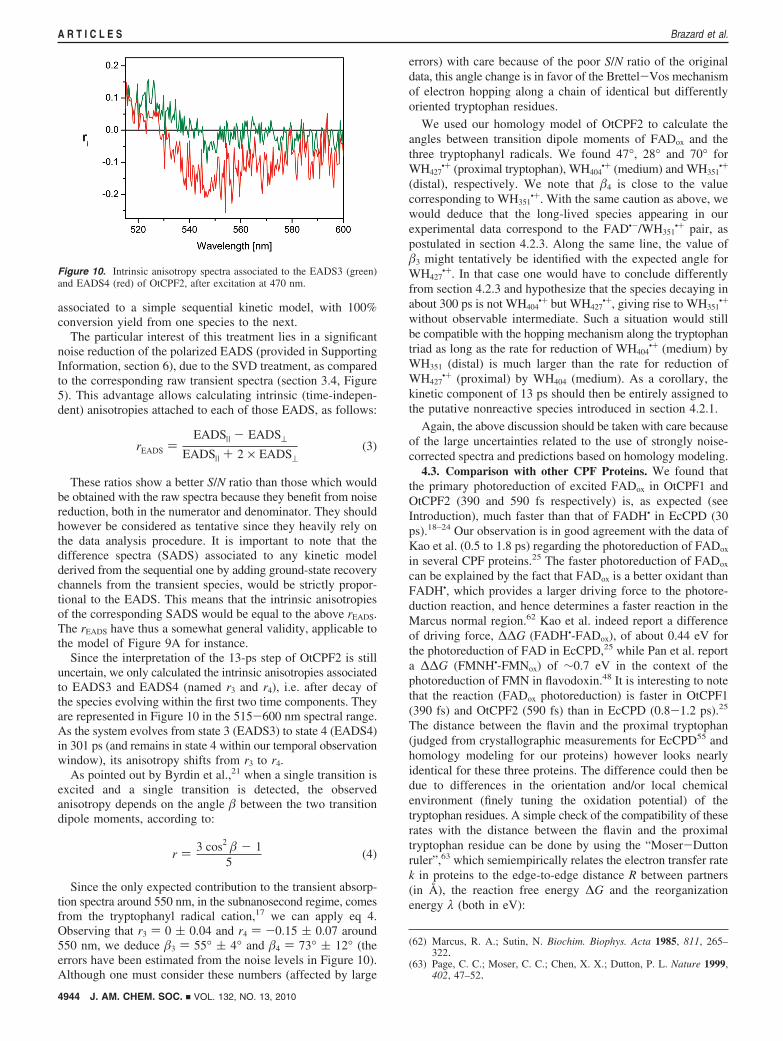
We therefore propose that, after excitation at 470 nm, FADox
is reduced in 390 fs into FAD•- by WH450. The WH450•+ radical
is then reduced by WH427, while electron recombination fromFAD•- to WH450
•+ occurs, in 9 ps. WH427•+ is finally reduced
by WH373 (exposed to the surface of the protein), while chargerecombination between WH427
•+ and FAD•- proceeds, in 81 ps.The final state accessible to our experiment is then made ofFAD•- and WH373
•+. This kinetic model is summarized in Figure9A.
We further proceeded to an elementary target analysis of ourdata in order to estimate the rate constants attached to eachprocess. The applied constraint (described in more detail in ref56) consisted in imposing that all SADS exhibit approximatelythe same negative bleaching contribution around 440 nm. Noground-state recovery in competition with the first step wasnecessary. As far as steps 2 (9 ps) and 3 (81 ps) are concerned,the rate constants of electron transfer are noted k2 and k3,respectively, while the charge recombination rates are writtenk′2 and k′3, respectively. We obtained: k2 ) 1011 s-1, k′2 ) 1.1× 10¹⁰ s-1, k3 ) 8 × 10⁹ s-1 and k′3 ) 4.3 × 10⁹ s-1. Thecorresponding SADS are shown in Figure 9B. These rateconstants correspond to a yield of electron transfer of Φ2 )90% during step 2 and Φ3 ) 65% during step 3. Since the yieldof primary photoreduction is 1 in our model, this means thatthe overall charge separation yield achieved in the presentlyobserved time window is ∼59%.
4.2. Photoactivation of FADox Bound to OtCPF2. 4.2.1. Het-erogeneity in the Ground State. The transient absorption spectraof OtCPF2 are qualitatively very similar to those of OtCPF1(compare Figures 3 and 4). We noted in section 3.3, however,that the pre-exponential factor spectrum attached to the 13 pscomponent (DADS2) contains a signature of FADox excited-state decay (see Supporting Information, section 4). This meansthat a slight contribution of stimulated emission is still recogniz-able during the 13 ps step of OtCPF2 while no such stimulatedemission was seen during the 9 ps step of OtCPF1.
(54) Okamura, T.; Sancar, A.; Heelis, P. F.; Begley, T. P.; Hirata, Y.;Mataga, N. J. Am. Chem. Soc. 1991, 113, 3143–3145.
(55) Park, H. W.; Kim, S. T.; Sancar, A.; Deisenhofer, J. Science 1995,268, 1866–1872.
(56) Plaza, P.; Mahet, M.; Martin, M. M.; Checcucci, G.; Lenci, F. J. Phys.Chem. B 2007, 111, 690–696.
Figure 8. Tryptophan chain involved in the photoactivation of FADox insideOtCPF1 (A) and OtCPF2 (B) as calculated by homology modeling. Themain relevant edge-to-edge distances are represented in green.
4942 J. AM. CHEM. SOC. 9 VOL. 132, NO. 13, 2010
A R T I C L E S Brazard et al.
A discussion of this observation is provided in SupportingInformation (section 9). We propose that our OtCPF2 sampleis actually heterogeneous and contains two classes of FADox
populations. The main, so-called reactive, population is thoughtto give photoproducts in 0.59 ps, in a way very similar to thatof OtCPF1. A secondary, so-called nonreactive population,would not undergo photoreduction but rather decay to the groundstate in 13 ps, just as the closed conformation of FADox doesin solution (with 5-20 ps lifetime).46,57–61 We tentativelypropose that nonreactive FADox could be bound to OtCPF2 inthe binding site of MTHF, which is left free in 49% of theproteins in our purified samples (see section 3.1). The nonre-active population would contribute to DADS2 only; which doesnot exclude that the reactive population could also contributeto it. In this latter case, the fact that both populations share acommon lifetime should be considered as a coincidence or aglobal analysis artifact. In what follows we will tentativelymaintain the possibility that both reactive and nonreactivepopulations contribute to DADS2.
4.2.2. Identification of the Photoproducts. The primary pho-toreaction of (reactive) excited FADox within OtCPF2 occurs
with a lifetime of 590 fs. Identifying the photoproducts just afterthis step (EADS2 in terms of evolution-associated differencespectra; see Supporting Information, section 4) is not straight-forward because, as described above (section 4.2.1), the 13 pscomponent (DADS2) is likely to be assigned to a mixture ofprocesses belonging to the reactive and nonreactive FADox
populations. We therefore focused on the transient absorptionspectra left after the first two kinetic steps (EADS3 and EADS4).
We followed the same procedure as for OtCPF1 andcompared these experimental spectra to reconstructed differencespectra of various photoreduction products. The only differencewas that the FADox and FADH• spectra came from ref 41. Asthe transient absorption spectra of OtCPF2 and OtCPF1 are quitesimilar, it is not surprising that the best match corresponds tothe FAD•-/WH•+ pair. This assignment is illustrated by theoverlap of the reconstructed spectrum of FAD•-/WH•+ and ofEADS3 presented in Supporting Information (section 10). Thesuperposition is not perfect, but as mentioned for OtCPF1, thedifferences might be due to the contribution of other excitedspecies (5% FADH•*, 10% FADH-* and 7% MTHF*) or to theunknown spectra of these species in OtCPF1.
4.2.3. Kinetic Model. The kinetic model we propose for thereactive population of OtCPF2 is essentially identical to the oneof OtCPF1 (Figure 9A) and follows the Brettel-Vos mech-anism.18–23 By protein alignment we verified that the chain ofthree tryptophan residues is conserved in OtCPF2. Theseresidues are identified as follows: WH427, WH404 and WH351,from the nearest to the most distant to FAD. Figure 8B showstheir spatial disposition, as calculated by homology modeling.
The case of OtCPF2 is more complex than that of OtCPF1because we identified in DADS2 (OtCPF2) a contributioncoming from the nonreactive FADox population (see section4.2.1). It is thus not certain that the 13 ps step can be assignedto the reactive population. However, if it were the case (just asthe 9 ps step of OtCPF1 belongs to the same chronologicprocess), the scheme would be that the excitation of FADox leadsto its reduction into FAD•- by WH427 in 590 fs. WH427
•+ wouldthen be reduced by WH404, with concomitant partial chargerecombination between FAD•- and WH427
•+, in 13 ps. The laststep would be the reduction of WH404
•+ by WH351, accompaniedby partial charge recombination between FAD•- and WH404
•+,in 340 ps. The long-lived photoproducts would be FAD•- andWH351
•+. We stress that this proposal should be considered withcare, due to the above-mentioned uncertainties regarding theinterpretation of DADS2. On the basis of our preliminaryanisotropy data, a different tentative scenario will be devisedin section 4.2.4. This is why we could not perform any reliabletarget analysis on the full OtCPF2 data. However, if we restrictthe analysis to the last step (340 ps), we calculate an electrontransfer yield of 77%. By excluding DADS2 from the dynamics(this approximation may not be too crude because DADS2 hasa small amplitude), the primary photoreduction yield would onlybe 84%, which means that, contrary to OtCPF1, ground-staterecovery probably competes with the ultrafast photoreductionreaction. The mechanism underlying this effect might be dueto the interaction of the isoalloxazine and adenine moietieswithin the U-shaped conformation of FAD (see Figure 8B)characterizing CPF proteins.1
4.2.4. Anisotropy. We have seen in section 3.4 that thepolarized transient absorption spectra of OtCPF2 could besimultaneously fitted to a sum of identical exponentials. Thisglobal analysis could then be used to produce parallel andperpendicular EADS, i.e. difference spectra of the species
(57) Chosrowjan, H.; Taniguchi, S.; Mataga, N.; Tanaka, F.; Visser, A.Chem. Phys. Lett. 2003, 378, 354–358.
(58) Kao, Y. T.; Saxena, C.; He, T. F.; Guo, L. J.; Wang, L. J.; Sancar,A.; Zhong, D. P. J. Am. Chem. Soc. 2008, 130, 13132–13139.
(59) Kondo, M.; Nappa, J.; Ronayne, K. L.; Stelling, A. L.; Tonge, P. J.;Meech, S. R. J. Phys. Chem. B 2006, 110, 20107–20110.
(60) Stanley, R. J.; MacFarlane, A. W., Jr. J. Phys. Chem. A 2000, 104,6899–6906.
(61) van den Berg, P. A. W.; Feenstra, K. A.; Mark, A. E.; Berendsen,H. J. C.; Visser, A. J. Phys. Chem. B 2002, 106, 8858–8869.
Figure 9. (A) Kinetic model proposed to describe the photoactivation ofFADox in OtCPF1. (B) Species-associated difference spectra (SADS)obtained by using the kinetic model described in A.
J. AM. CHEM. SOC. 9 VOL. 132, NO. 13, 2010 4943
Photoactivation of Two New Oxidized CPF Proteins A R T I C L E S
associated to a simple sequential kinetic model, with 100%conversion yield from one species to the next.
The particular interest of this treatment lies in a significantnoise reduction of the polarized EADS (provided in SupportingInformation, section 6), due to the SVD treatment, as comparedto the corresponding raw transient spectra (section 3.4, Figure5). This advantage allows calculating intrinsic (time-indepen-dent) anisotropies attached to each of those EADS, as follows:
These ratios show a better S/N ratio than those which wouldbe obtained with the raw spectra because they benefit from noisereduction, both in the numerator and denominator. They shouldhowever be considered as tentative since they heavily rely onthe data analysis procedure. It is important to note that thedifference spectra (SADS) associated to any kinetic modelderived from the sequential one by adding ground-state recoverychannels from the transient species, would be strictly propor-tional to the EADS. This means that the intrinsic anisotropiesof the corresponding SADS would be equal to the above rEADS.The rEADS have thus a somewhat general validity, applicable tothe model of Figure 9A for instance.
Since the interpretation of the 13-ps step of OtCPF2 is stilluncertain, we only calculated the intrinsic anisotropies associatedto EADS3 and EADS4 (named r3 and r4), i.e. after decay ofthe species evolving within the first two time components. Theyare represented in Figure 10 in the 515-600 nm spectral range.As the system evolves from state 3 (EADS3) to state 4 (EADS4)in 301 ps (and remains in state 4 within our temporal observationwindow), its anisotropy shifts from r3 to r4.
As pointed out by Byrdin et al.,21 when a single transition isexcited and a single transition is detected, the observedanisotropy depends on the angle � between the two transitiondipole moments, according to:
Since the only expected contribution to the transient absorp-tion spectra around 550 nm, in the subnanosecond regime, comesfrom the tryptophanyl radical cation,17 we can apply eq 4.Observing that r3 ) 0 ( 0.04 and r4 ) -0.15 ( 0.07 around550 nm, we deduce �3 ) 55° ( 4° and �4 ) 73° ( 12° (theerrors have been estimated from the noise levels in Figure 10).Although one must consider these numbers (affected by large
errors) with care because of the poor S/N ratio of the originaldata, this angle change is in favor of the Brettel-Vos mechanismof electron hopping along a chain of identical but differentlyoriented tryptophan residues.
We used our homology model of OtCPF2 to calculate theangles between transition dipole moments of FADox and thethree tryptophanyl radicals. We found 47°, 28° and 70° forWH427
•+ (proximal tryptophan), WH404•+ (medium) and WH351
•+
(distal), respectively. We note that �4 is close to the valuecorresponding to WH351
•+. With the same caution as above, wewould deduce that the long-lived species appearing in ourexperimental data correspond to the FAD•-/WH351
•+ pair, aspostulated in section 4.2.3. Along the same line, the value of�3 might tentatively be identified with the expected angle forWH427
•+. In that case one would have to conclude differentlyfrom section 4.2.3 and hypothesize that the species decaying inabout 300 ps is not WH404
•+ but WH427•+, giving rise to WH351
•+
without observable intermediate. Such a situation would stillbe compatible with the hopping mechanism along the tryptophantriad as long as the rate for reduction of WH404
•+ (medium) byWH351 (distal) is much larger than the rate for reduction ofWH427
•+ (proximal) by WH404 (medium). As a corollary, thekinetic component of 13 ps should then be entirely assigned tothe putative nonreactive species introduced in section 4.2.1.
Again, the above discussion should be taken with care becauseof the large uncertainties related to the use of strongly noise-corrected spectra and predictions based on homology modeling.
4.3. Comparison with other CPF Proteins. We found thatthe primary photoreduction of excited FADox in OtCPF1 andOtCPF2 (390 and 590 fs respectively) is, as expected (seeIntroduction), much faster than that of FADH• in EcCPD (30ps).18–24 Our observation is in good agreement with the data ofKao et al. (0.5 to 1.8 ps) regarding the photoreduction of FADox
in several CPF proteins.25 The faster photoreduction of FADox
can be explained by the fact that FADox is a better oxidant thanFADH•, which provides a larger driving force to the photore-duction reaction, and hence determines a faster reaction in theMarcus normal region.62 Kao et al. indeed report a differenceof driving force, ∆∆G (FADH•-FADox), of about 0.44 eV forthe photoreduction of FAD in EcCPD,25 while Pan et al. reporta ∆∆G (FMNH•-FMNox) of ∼0.7 eV in the context of thephotoreduction of FMN in flavodoxin.48 It is interesting to notethat the reaction (FADox photoreduction) is faster in OtCPF1(390 fs) and OtCPF2 (590 fs) than in EcCPD (0.8-1.2 ps).25
The distance between the flavin and the proximal tryptophan(judged from crystallographic measurements for EcCPD55 andhomology modeling for our proteins) however looks nearlyidentical for these three proteins. The difference could then bedue to differences in the orientation and/or local chemicalenvironment (finely tuning the oxidation potential) of thetryptophan residues. A simple check of the compatibility of theserates with the distance between the flavin and the proximaltryptophan residue can be done by using the “Moser-Duttonruler”,63 which semiempirically relates the electron transfer ratek in proteins to the edge-to-edge distance R between partners(in Å), the reaction free energy ∆G and the reorganizationenergy λ (both in eV):
(62) Marcus, R. A.; Sutin, N. Biochim. Biophys. Acta 1985, 811, 265–322.
(63) Page, C. C.; Moser, C. C.; Chen, X. X.; Dutton, P. L. Nature 1999,402, 47–52.
Figure 10. Intrinsic anisotropy spectra associated to the EADS3 (green)and EADS4 (red) of OtCPF2, after excitation at 470 nm.
rEADS )EADS| - EADS⊥
EADS| + 2 × EADS⊥(3)
r ) 3 cos2 � - 15
(4)
4944 J. AM. CHEM. SOC. 9 VOL. 132, NO. 13, 2010
A R T I C L E S Brazard et al.
Since, according to our homology modeling estimations, Rranges from 4.1 to 4.2 Å for OtCPF1 and OtCPF2, the upperlimit of k (when ∆G ) -λ) should be of the order of 3 × 10-12
s-1. This value is in good agreement with the experimentallifetimes (390 and 590 fs), which in turn indicates that ∆G )-λ approximately applies for the photoreduction of FADox inOtCPF1 and OtCPF2. It can therefore be inferred that theseprimary reactions are nearly barrierless. A small barrier mightexplain the slightly slower reaction rate in EcCPD, for whichR is equal to 4.3 Å.55
The lifetime corresponding to the second kinetic step (reduc-tion of the proximal tryptophanyl radical by the mediumtryptophan is 9 ps for OtCPF1 and, tentatively, 13 ps forOtCPF2) is in good agreement with lifetimes (ranging from 20to 54 ps) reported by Kao et al. for the same reaction in othercryptochromes and photolyases.25 These numbers could alsoagree well with the corresponding value (faster than 9 ps)deduced by the Brettel and Vos groups for EcCPD initiallybearing FADH•.23,24 It should be kept in mind, however, thatthe Brettel and Vos value of 9 ps is an upper limit and that theactual lifetime could be significantly smaller.
As far as the subsequent kinetic step is concerned (reductionof the medium tryptophanyl radical by the distal tryptophan in81 ps in OtCPF1 and, tentatively, in 340 ps in OtCPF2), ourvalues are significantly larger than the upper limit of 30 psdeduced by the Brettel and Vos groups for EcCPD initiallybearing FADH•.22 No precise value was given by Kao et al.although they mention a lifetime in the proximate nanosecondregime.25
In the absence of reliable crystallographic structures of ourproteins (and those reported by Kao et al.25), it is difficult torationalize the differences in the various reported lifetimes. Wecan generically invoke the fact that the distances betweentryptophan residues, their relative orientations and the chemicalnature of the amino-acid surrounding them (which may modulatetheir oxidation potential) can substantially alter the driving forceof the electron hopping reaction. We in particular noticed thatthe loop surrounding the distal tryptophan (WHd) residue inEcCPD (from H288 to P310) is very different from that found inOtCPF1 or OtCPF2. In OtCPF1 and OtCPF2 this loop containstwice as many charged aminoacids than in EcCPD. The OtCPF2loop contains more positively charged aminoacids than OtCPF1and EcCPD. More precisely, in EcCPD WHd closely interactswith one hydrophobic residue (V304) and several carbonyl groupsof the peptide backbone. According to our homology calcula-tions, the nearest neighbors of WHd in OtCPF1 are twohydrophobic residues (M462 and L471) and the positively chargedK475. In our model of OtCPF2, WHd mostly interacts with onehydrophobic residue (L341) and two positively charged residues(R347 and R353). The surrounding of the other tryptophans doesnot show such drastic differences between proteins. However,it is interesting to note that the proximal tryptophan (WHp) ofOtCPF2 is in π interaction with another tryptophan (W424),whereas in OtCPF1 and EcCPD WHp interacts with an aspar-agine. It might therefore be thought that such differences couldexplain the kinetic differences observed between the variouschromoproteins.
5. Concluding Remarks
We have shown by femtosecond transient absorption spec-troscopy that the ultrafast photoreduction of FADox bound totwo new CPF proteins (OtCPF1 and OtCPF2) from the greenalga O. tauri occurs in the subpicosecond regime (390 fs forOtCPF1 and 590 fs for OtCPF2). For the first time in the caseof oxidized CPF proteins the photoproducts of this reaction werespectroscopically identified, by full broadband transient spectra,as FAD•- and WH•+. As this primary photoreaction is ultrafast,subsequent kinetic steps occurring in the picosecond regimecould be resolved and interpreted. They are assigned to a cascadeof electron hopping reactions along a chain of three conservedtryptophan residues, as reported by the groups of Brettel andVos for the photoreduction of FADH• within EcCPD.18–24
Charge recombination reactions in competition with the electronhopping mechanism were identified as well.
Protein alignments allowed us to verify that the chain oftryptophan residues found in other CPF proteins is wellconserved within OtCPF1 and OtCPF2. The spatial dispositionof the tryptophan residues and the flavin found by homologymodeling is very similar to the one experimentally reported forEcCPD.
In the case of OtCPF1 we could propose a complete kineticmodel of the photoreduction reaction, including rate constantsand electron transfer yields. The case of OtCPF2 is morecomplex, due a particular kinetic behavior that we attributed tothe presence of a ground-state heterogeneity in the samples. Oneso-called reactive (FADox) population undergoes the photore-duction mechanism through the tryptophan chain, while thenonreactive simply decays in 13 ps to the ground state. Thispopulation might correspond to FADox being bound to OtCPF2in the binding site of MTHF. A kinetic model, analogous tothe one of OtCPF1, was tentatively proposed, but no rateconstants were given due to the complexity of the system.
Polarized transient absorption experiments performed onOtCPF2 further allowed us to provide elements in favor of theelectron hopping mechanism along the tryptophan chain andtentatively confirmed the fact that the final photoproductobserved in our experimental time window involves the radicalcation of the distal tryptophan residue.
Acknowledgment. This work was supported by the ANR(French National Agency for Research) through the “Femtomotile”Project (ANR-05-BLAN-0188-01) and by the EU-FP6 MarineGenomics from the Network of Excellence (GOCE-CT-2004-505403).
Supporting Information Available: (1) Spectroscopic chemi-cal analysis of MTHF and FAD in OtCPF2; (2) total concentra-tion of FAD and concentration of MTHF in OtCPF2; (3) globalanalysis of the transient absorption data of OtCPF1; (4) globalanalysis of the transient absorption data of OtCPF2; (5)reconstructed isotropic transient spectra of OtCPF2; (6) SVDanalysis of the polarized transient spectra of OtCPF2; (7)photoreduction products of OtCPF1; (8) homology modeling;(9) ground-state heterogeneity of OtCPF2; (10) photoreductionproducts of OtCPF2. This material is available free of chargevia the Internet at http://pubs.acs.org.
JA1002372
log10 k ) 15 - 0.6R - 3.1(∆G + λ)2/λ (5)
J. AM. CHEM. SOC. 9 VOL. 132, NO. 13, 2010 4945
Photoactivation of Two New Oxidized CPF Proteins A R T I C L E S