Embed Size (px)
Citation preview
J Physiol 566.1 (2005) pp 61–76 61
SYMPOS IUM REPORT
Spectrally opponent inputs to the human luminancepathway: slow +M and −L cone inputs revealed byintense long-wavelength adaptation
Andrew Stockman1, Daniel J. Plummer2 and Ethan D. Montag3
1Institute of Ophthalmology, University College London, 11-43 Bath Street, London EC1V 9EL, UK2Department of Psychology, University of California San Diego, La Jolla, CA 92093-0109, USA3Rochester Institute of Technology, Center for Imaging Science, Munsell Color Science Laboratory, 54 Lomb Memorial Drive,Rochester, NY 14623-5604, USA
The nature of the inputs to achromatic luminance flicker perception was exploredpsychophysically by measuring middle- (M-) and long-wavelength-sensitive (L-) conemodulation sensitivities, M- and L-cone phase delays, and spectral sensitivities as a functionof temporal frequency. Under intense long-wavelength adaptation, the existence of multipleluminance inputs was revealed by substantial frequency-dependent changes in all three typesof measure. Fast (f) and slow (s) M-cone input signals of the same polarity (+sM and +fM)sum at low frequencies, but then destructively interfere near 16 Hz because of the delay betweenthem. In contrast, fast and slow L-cone input signals of opposite polarity (−sL and +fL) cancelat low frequencies, but then constructively interfere near 16 Hz. Although these slow, spectrallyopponent luminance inputs(+sMand−sL)wouldusuallybecharacterizedaschromatic,andthefast, non-opponent inputs (+fM and +fL) as achromatic, both contribute to flicker photometricnulls without producing visible colour variation. Although its output produces an achromaticpercept, the luminance channel has slow, spectrally opponent inputs in addition to the expectednon-opponent ones. Consequently, it is not possible in general to silence this channel with pairsof ‘equiluminant’ alternating stimuli, since stimuli equated for the non-opponent luminancemechanism (+fM and +fL) may still generate spectrally opponent signals (+sM and +sL).
(Received 28 January 2005; accepted after revision 25 April 2005; first published online 28 April 2005)Corresponding author A. Stockman: Institute of Ophthalmology, University College London, 11-43 Bath Street,London EC1V 9EL, UK. Email: [email protected]
In conventional models of the early visual system, signalsfrom the three types of cones (short- (S), middle- (M) andlong- (L) wavelength-sensitive) feed into the luminancechannel (L+M) or into the more sluggish chromaticchannels (L–M) or (S−(L+M)) (e.g. Schrodinger, 1925;Luther, 1927; Walls, 1955; De Lange, 1958; Guth et al.1968; Smith & Pokorny, 1975; Boynton, 1979; Eisner &MacLeod, 1980). Discrepancies, such as the observationof a small, inverted S-cone input to luminance have beenreported (Stockman et al. 1987, 1991a; Lee & Stromeyer,1989), but have been typically ignored in order topreserve the utility of the conventional model of luminance(e.g. Lennie et al. 1993).
Failures of the conventional model of luminance
The concept of luminance depends on the context in whichit is used. Photometrically, it is defined by the luminous
efficiency function, V (λ), which is the effectiveness oflights of different wavelengths in specific photometricmatching tasks. Those perceptual tasks now most typicallyinclude heterochromatic flicker photometry (HFP) or aversion of side-by-side matching, in which the relativeintensities of the two half-fields are set so that theborder between them appears ‘minimally distinct’ (MDB)(e.g. Ives, 1912; Wagner & Boynton, 1972). This definitionof luminance is somewhat narrow, however, since the V (λ)function is strictly appropriate only to the measurementtask and to the experimental conditions under which it wasmeasured (e.g. De Vries, 1948; Eisner & MacLeod, 1981;Stockman et al. 1993b).
Mechanistically, the term luminance is applied to thehypothetical visual process in the human visual systemthat is assumed to signal ‘luminance’, which may have aV (λ)-like spectral sensitivity under limited conditions (seebelow). A defining property of the luminance channel is
C© The Physiological Society 2005 DOI: 10.1113/jphysiol.2005.084046
62 A. Stockman and others J Physiol 566.1
that it responds univariantly to lights of different wave-length, and is therefore colour-blind.
In this paper, we describe two phenomena that are notpredicted by the conventional model of luminance, andwhich therefore illustrate the need for a revised model.
(1) Phase delays required for flicker nulls. When detectedsolely by the luminance channel, two sinusoidallyalternating lights that are ‘luminance-equated’ shouldappear perfectly uniform and non-flickering whatevertheir chromaticities. In order to eliminate completelythe perception of flicker, however, subjects often have toadjust the two lights away from opposite phase. Earlyestimates of these phase adjustments were relatively small,ranging from less than 9 deg at 6 Hz or 4 deg at 14 Hz(De Lange, 1958), to less than 14 deg between 20 and55 Hz (Cushman & Levinson, 1983). Phase adjustmentsas large as 30 deg at frequencies below 9 Hz were found byWalraven & Leebeek (1964), but their data may have beencontaminated by rods (see also von Grunau, 1977). Morerecently, much larger phase differences have been found.Lindsey et al. (1986) and Swanson et al. (1987) reportedphase delays between red and green lights of nearly 180 degat 2 Hz, falling rapidly with increasing frequency to 0 degby about 13 Hz. The data of Lindsey et al. and Swansonet al. provide the first clear evidence for slow, invertedinputs to the luminance channel that we also find, butthey did not initially interpret their results as such. See theDiscussion for a more comprehensive review of other workin this area.
The changes in phase delay with frequency that we findunder intense long-wavelength adaptation are substantialeven at frequencies as high as 25 Hz (see below). Theyare much too large to be consistent with the conventionalmodel of luminance with two additive L- and M-coneinputs with similar temporal responses.
(2) Frequency-dependent changes in flicker spectralsensitivities. Modulation sensitivity for flickering mono-chromatic lights varies with wavelength in a way thatreflects the spectral sensitivity of the combination of conesignals supporting detection. With the S-cones suppressedby a shortwave auxiliary field, and at those moderate tohigh temporal frequencies at which the luminance pathwayis assumed to predominate, flicker spectral sensitivity istypically characterized as some linear combination of theL- and M-cone spectral sensitivities (e.g. Eisner, 1982;Stockman et al. 1993b). The conventional model of theearly visual system predicts that this combination shouldnot strongly depend on flicker frequency (but see Marks& Bornstein, 1973). Yet, we show that flicker spectralsensitivity functions measured on a 658 nm field changedramatically with flicker frequency: as the frequencyincreases, the functions become shallower, tending awayfrom an M-cone spectral sensitivity function towards that
of an L-cone (see Figs 2 and 3). Although an M-conespectral sensitivity is expected due to selective chromaticadaptation by the background, an L-cone one is not.
We might expect large frequency-dependent changes inflicker spectral sensitivity if visual signals with differentspectral sensitivities constructively interfere at somefrequencies, but, then, because of large phase delays,destructively interfere at other frequencies. As we showbelow, the changes in spectral sensitivity with frequencyare predictable, in part, from the phase delays of the under-lying M- and L-cone signals.
Relative cone adaptation
Since light adaptation speeds up the light response of conephotoreceptors (e.g. Baylor et al. 1984) and each conesystem can deliver signals with different phase delays,phase and amplitude differences between the M- andL-cone signals will arise if the two cones are in differentstates of adaptation. Given the large difference in M- andL-cone sensitivity at 658 nm (1.1 log units according toStockman & Sharpe, 2000), substantial phase differencesmight be expected on the very intense 658 nm field usedin these experiments. Such differences due to selectiveadaptation have been proposed before (Drum, 1977,1984). However, because of the effects of photopigmentbleaching on the very high intensity field, we expect theadaptive states of the M- and L-cone types to be relativelysimilar in this experiment. In other work, we find thatthe adaptive state of the cones monitored by temporalphase delay and amplitude sensitivity measurementsreach a roughly asymptotic level above a bleach of about50% (A. Stockman, M. Langendorfer & L. T. Sharpe,unpublished observations). On the 12.50 log10 quantas−1 deg−2, 658 nm field used in the experiment, whichbleaches approximately 90% and 50% of the L- andM-cone photopigments, respectively, any phasedifferences between the M- and L-cone signals caused byadaptational imbalances are likely to be small. In fact,using the data from a binocular phase delay experiment(A. Stockman, M. Langendorfer & L. T. Sharpe,unpublished observations), we estimate that the L- andM-cone phase delays in the current experiment will be onaverage less than ± 6 deg. Systematic differences causedby differential cone adaptation are found on the lowerintensity red backgrounds described in the accompanyingpaper (Stockman & Plummer, 2005).
Developing a new model
For the initial interpretation of our data, we subscribeto an operational definition of the channel (or channels)that underlie the perception of achromatic flicker. Weassume that in its response to flicker this channelproduces a colour-blind or univariant percept or output,such that two flickering lights of any wavelength
C© The Physiological Society 2005
J Physiol 566.1 Spectrally opponent M–L luminance inputs 63
composition can be flicker-photometrically cancelledby adjusting their relative amplitude and phase. Thisdefinition consequently excludes those frequencies atwhich any temporal colour variation is produced thatcannot be flicker-photometrically nulled, but we findunder the conditions of our experiment that thisapplies to only low temporal frequencies. Near-threshold,flicker-photometric nulls are generally possible at allfrequencies above ca 5 Hz.
In a series of papers on flicker and flicker interactions,of which this is the first, we demonstrate that achromaticflicker perception depends on multiple cone signals withdifferent temporal properties and with different signs.To characterize these signals, we have measured phasedelay and modulation sensitivity as a function of temporalfrequency, for monochromatic and cone-isolating stimuli,under a variety of adaptation conditions. Here wepresent data obtained on an intense deep-red field.In these experiments, which were carried out underintense long-wavelength adaptation, we have identifiedfive signals. In the experiments in the accompanying paper,which were measured on less intense fields, we identify twoadditional signals (see also Stockman & Plummer, 2005).
Nomenclature
For brevity, we will refer to the various contributionsto achromatic flicker perception as ‘S’, ‘M’ or‘L’ (for short-, middle- or long-wavelength-sensitive,respectively), according to the cone type from which theinput signals originate, prefixed by either ‘f’ or ‘s’ (forfast or slow), according to the relative phase delay of theinput signal, and by either ‘+’ or ‘−’, according to whetherthe inputs are non-inverted or inverted with respect tothe traditional fast signals. The five signals identified inthis paper are +fM, +fL, +sM, −sL and −sS (the −sSsignal corresponds to the inverted S-cone input previouslyreported). We use slow and fast here as descriptive termsto distinguish between the two categories of inferred conesignals without implying any underlying mechanism.
Methods
Subjects
Three male observers (the authors: AS, DP and EM)and one female observer (CK) participated in theseexperiments. All observers had normal colour vision andwere experienced psychophysical observers. The mainobservers were AS and DP. The results for EM and CK (notshown), who measured only a subset of the experiments,were generally similar to those for AS. Informed consentwas obtained in writing from each subject. These studiesconformed to the standards set by the Declaration ofHelsinki, and the procedures have been approved by localethics committees in the UK and USA.
Apparatus
The optical apparatus was a conventional Maxwellian-viewoptical system illuminated by a 900 W Xe arc lamp thatproduced a 2 mm diameter output beam in the plane of theobserver’s pupil. Target and background wavelengths wereselected by the use of 3-cavity, blocked interference filterswith half-maximum bandwidths of between 7 and 11 nm(Ealing or Oriel). Infra-red radiation was minimized byheat-absorbing glass. Intensity could be controlled by fixedneutral density filters or variable neutral density filtersunder computer control.
Sinusoidal modulation of the targets was produced bythe pulse-width modulation of liquid crystal light shutters(Displaytech) at a carrier frequency of 400 Hz. Each shutterhad rise and fall times of less than 50 µs. The contrastsof the shutters in the test channels were > 300 : 1 at thewavelengths used in the experiments.
The position of the observer’s head was maintained bya dental wax impression.
Stimuli
Flickering targets of 4 deg in diameter (and in oneexperiment of 1 and 2 deg diameter) were presented super-imposed in the centre of a 9 deg diameter backgroundfield. Fixation was central. The background field was658 nm and delivered 12.50 log10 quanta s−1 deg−2 atthe cornea (5.18 log10 photopic trolands (ph td)). When500 or 540 nm targets were used, an auxiliary 410 nmbackground, which delivered 10.80 log10 quanta s−1 deg−2
(1.93 log10 ph td), was superimposed on the red fieldin order to prevent any S-cone contribution to flickerperception, which would in any case have been minimal.Subjects light adapted to test and background fields for atleast 3 min prior to any data collection. The M-cone andL-cone bleaching levels for these stimuli are approximately50% and 90%, respectively (Rushton & Henry, 1968;Stockman & Sharpe, 2000).
In the first experiments, flickering targets of 500, 540,577 or 609 nm were superimposed on a flickering targetof 656 nm, and both were presented superimposed inthe centre of the larger background field of 658 nm. The656 nm target is effectively ‘equichromatic’ with the back-ground. Phase settings were made between each of the 500,540, 577 or 609 nm targets and the 656 nm target. In laterexperiments, each of the three shorter wavelength targetswas paired with a second 656 nm target (so, 500 and 656,540 and 656 or 577 and 656 nm). Each pair was set to beequal for the L-cones, so that when they were sinusoidallyalternated they produced primarily an M-cone flickersignal (given that any S-cone signal was suppressed by the410 nm background). Phase settings were made betweeneach M-cone-isolating pair and the equichromatic 656 nmlight. In other experiments, a pair of 650 and 550 nm lightswere set to be equal for the M-cones, so that when they
C© The Physiological Society 2005
64 A. Stockman and others J Physiol 566.1
were sinusoidally alternated they produced primarily anL-cone flicker signal. In this case, phase settings were madebetween the L-cone-isolating pair and the equichromatic656 nm light.
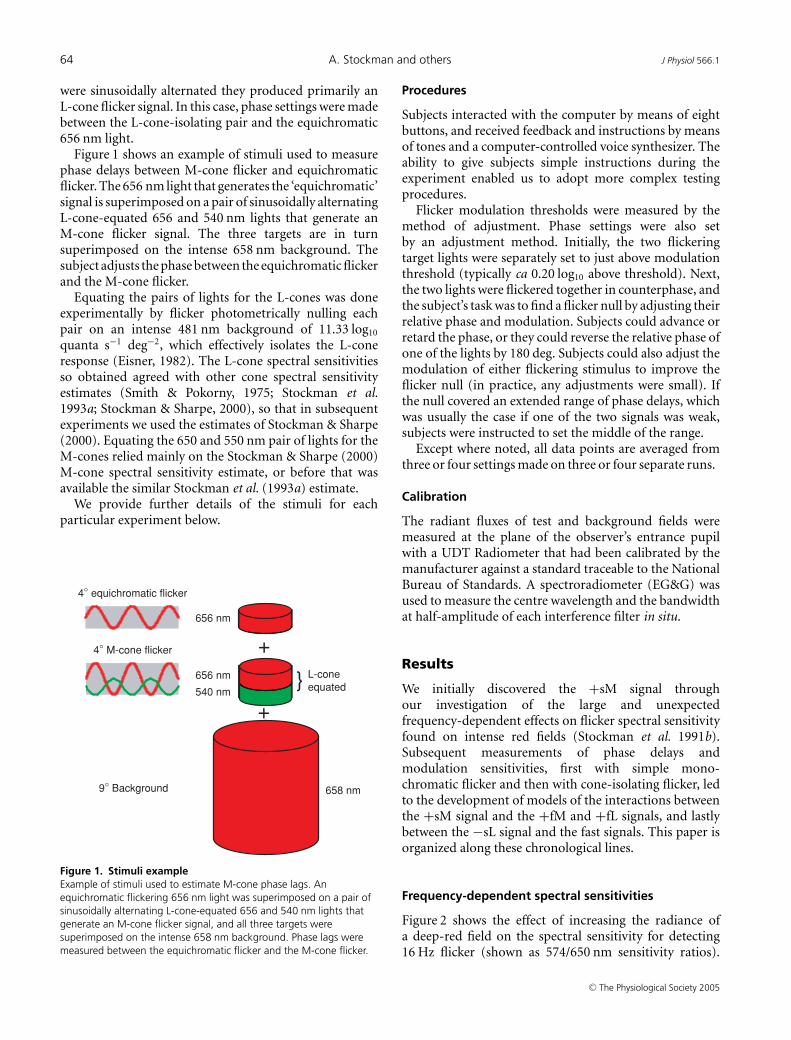
Figure 1 shows an example of stimuli used to measurephase delays between M-cone flicker and equichromaticflicker. The 656 nm light that generates the ‘equichromatic’signal is superimposed on a pair of sinusoidally alternatingL-cone-equated 656 and 540 nm lights that generate anM-cone flicker signal. The three targets are in turnsuperimposed on the intense 658 nm background. Thesubject adjusts the phase between the equichromatic flickerand the M-cone flicker.
Equating the pairs of lights for the L-cones was doneexperimentally by flicker photometrically nulling eachpair on an intense 481 nm background of 11.33 log10
quanta s−1 deg−2, which effectively isolates the L-coneresponse (Eisner, 1982). The L-cone spectral sensitivitiesso obtained agreed with other cone spectral sensitivityestimates (Smith & Pokorny, 1975; Stockman et al.1993a; Stockman & Sharpe, 2000), so that in subsequentexperiments we used the estimates of Stockman & Sharpe(2000). Equating the 650 and 550 nm pair of lights for theM-cones relied mainly on the Stockman & Sharpe (2000)M-cone spectral sensitivity estimate, or before that wasavailable the similar Stockman et al. (1993a) estimate.
We provide further details of the stimuli for eachparticular experiment below.
4° M-cone flicker
4° equichromatic flicker
9° Background
+
+
L-coneequated}
656 nm
656 nm
540 nm
658 nm
Figure 1. Stimuli exampleExample of stimuli used to estimate M-cone phase lags. Anequichromatic flickering 656 nm light was superimposed on a pair ofsinusoidally alternating L-cone-equated 656 and 540 nm lights thatgenerate an M-cone flicker signal, and all three targets weresuperimposed on the intense 658 nm background. Phase lags weremeasured between the equichromatic flicker and the M-cone flicker.
Procedures
Subjects interacted with the computer by means of eightbuttons, and received feedback and instructions by meansof tones and a computer-controlled voice synthesizer. Theability to give subjects simple instructions during theexperiment enabled us to adopt more complex testingprocedures.
Flicker modulation thresholds were measured by themethod of adjustment. Phase settings were also setby an adjustment method. Initially, the two flickeringtarget lights were separately set to just above modulationthreshold (typically ca 0.20 log10 above threshold). Next,the two lights were flickered together in counterphase, andthe subject’s task was to find a flicker null by adjusting theirrelative phase and modulation. Subjects could advance orretard the phase, or they could reverse the relative phase ofone of the lights by 180 deg. Subjects could also adjust themodulation of either flickering stimulus to improve theflicker null (in practice, any adjustments were small). Ifthe null covered an extended range of phase delays, whichwas usually the case if one of the two signals was weak,subjects were instructed to set the middle of the range.
Except where noted, all data points are averaged fromthree or four settings made on three or four separate runs.
Calibration
The radiant fluxes of test and background fields weremeasured at the plane of the observer’s entrance pupilwith a UDT Radiometer that had been calibrated by themanufacturer against a standard traceable to the NationalBureau of Standards. A spectroradiometer (EG&G) wasused to measure the centre wavelength and the bandwidthat half-amplitude of each interference filter in situ.
Results
We initially discovered the +sM signal throughour investigation of the large and unexpectedfrequency-dependent effects on flicker spectral sensitivityfound on intense red fields (Stockman et al. 1991b).Subsequent measurements of phase delays andmodulation sensitivities, first with simple mono-chromatic flicker and then with cone-isolating flicker, ledto the development of models of the interactions betweenthe +sM signal and the +fM and +fL signals, and lastlybetween the −sL signal and the fast signals. This paper isorganized along these chronological lines.
Frequency-dependent spectral sensitivities
Figure 2 shows the effect of increasing the radiance ofa deep-red field on the spectral sensitivity for detecting16 Hz flicker (shown as 574/650 nm sensitivity ratios).
C© The Physiological Society 2005
J Physiol 566.1 Spectrally opponent M–L luminance inputs 65
658-nm background radiance (log quanta s-1 deg-2)
9 10 11 12 13Log
quan
tal s
ensi
tivity
rat
io (
574/
650
nm)
0.5
1.0
1.5
2.0
M-cone
L-cone
AS EM
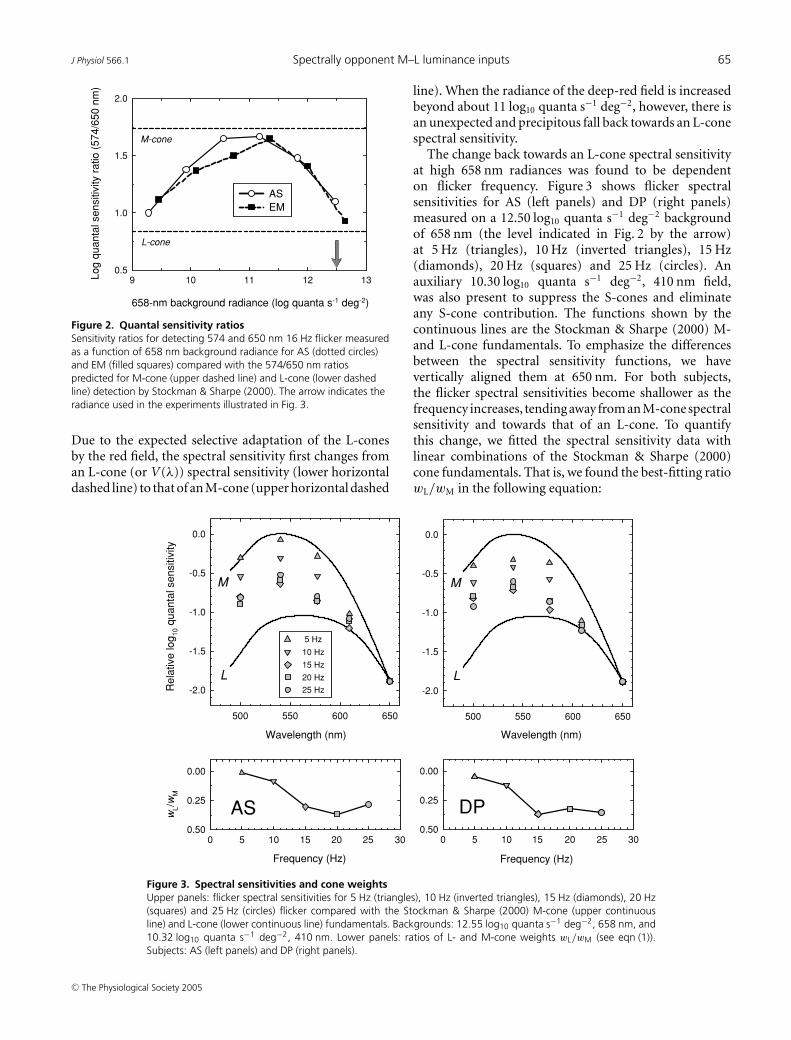
Figure 2. Quantal sensitivity ratiosSensitivity ratios for detecting 574 and 650 nm 16 Hz flicker measuredas a function of 658 nm background radiance for AS (dotted circles)and EM (filled squares) compared with the 574/650 nm ratiospredicted for M-cone (upper dashed line) and L-cone (lower dashedline) detection by Stockman & Sharpe (2000). The arrow indicates theradiance used in the experiments illustrated in Fig. 3.
Due to the expected selective adaptation of the L-conesby the red field, the spectral sensitivity first changes froman L-cone (or V (λ)) spectral sensitivity (lower horizontaldashed line) to that of an M-cone (upper horizontal dashed
0 5 10 15 20 25 30
0.00
0.25
0.50
500 550 600 650
-2.0
-1.5
-1.0
-0.5
0.0
AS
Frequency (Hz)
Wavelength (nm)
wL/
wM
Rel
ativ
e lo
g 10 q
uant
al s
ensi
tivity
M
L 20 Hz
25 Hz
15 Hz
10 Hz
5 Hz
0 5 10 15 20 25 30
0.00
0.25
0.50
500 550 600 650
-2.0
-1.5
-1.0
-0.5
0.0
DP
Frequency (Hz)
Wavelength (nm)
M
L
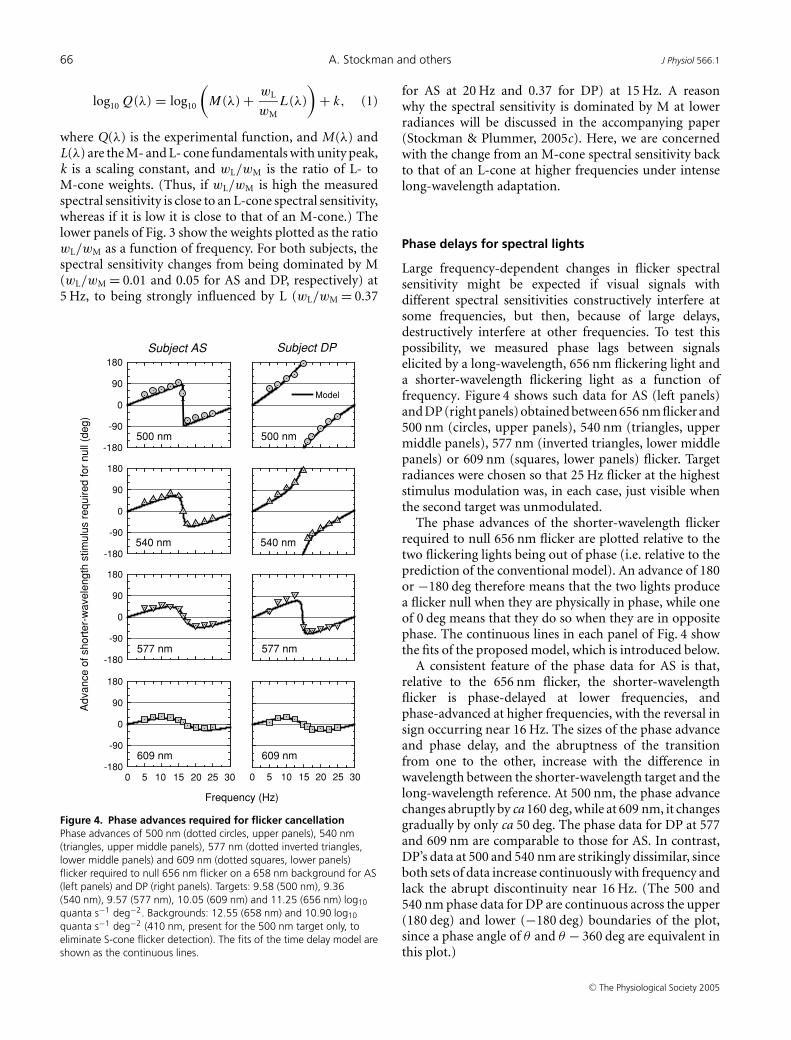
Figure 3. Spectral sensitivities and cone weightsUpper panels: flicker spectral sensitivities for 5 Hz (triangles), 10 Hz (inverted triangles), 15 Hz (diamonds), 20 Hz(squares) and 25 Hz (circles) flicker compared with the Stockman & Sharpe (2000) M-cone (upper continuousline) and L-cone (lower continuous line) fundamentals. Backgrounds: 12.55 log10 quanta s−1 deg−2, 658 nm, and10.32 log10 quanta s−1 deg−2, 410 nm. Lower panels: ratios of L- and M-cone weights wL/wM (see eqn (1)).Subjects: AS (left panels) and DP (right panels).
line). When the radiance of the deep-red field is increasedbeyond about 11 log10 quanta s−1 deg−2, however, there isan unexpected and precipitous fall back towards an L-conespectral sensitivity.
The change back towards an L-cone spectral sensitivityat high 658 nm radiances was found to be dependenton flicker frequency. Figure 3 shows flicker spectralsensitivities for AS (left panels) and DP (right panels)measured on a 12.50 log10 quanta s−1 deg−2 backgroundof 658 nm (the level indicated in Fig. 2 by the arrow)at 5 Hz (triangles), 10 Hz (inverted triangles), 15 Hz(diamonds), 20 Hz (squares) and 25 Hz (circles). Anauxiliary 10.30 log10 quanta s−1 deg−2, 410 nm field,was also present to suppress the S-cones and eliminateany S-cone contribution. The functions shown by thecontinuous lines are the Stockman & Sharpe (2000) M-and L-cone fundamentals. To emphasize the differencesbetween the spectral sensitivity functions, we havevertically aligned them at 650 nm. For both subjects,the flicker spectral sensitivities become shallower as thefrequency increases, tending away from an M-cone spectralsensitivity and towards that of an L-cone. To quantifythis change, we fitted the spectral sensitivity data withlinear combinations of the Stockman & Sharpe (2000)cone fundamentals. That is, we found the best-fitting ratiowL/wM in the following equation:
C© The Physiological Society 2005
66 A. Stockman and others J Physiol 566.1
log10 Q(λ) = log10
(M(λ) + wL
wML(λ)
)+ k, (1)
where Q(λ) is the experimental function, and M(λ) andL(λ) are the M- and L- cone fundamentals with unity peak,k is a scaling constant, and wL/wM is the ratio of L- toM-cone weights. (Thus, if wL/wM is high the measuredspectral sensitivity is close to an L-cone spectral sensitivity,whereas if it is low it is close to that of an M-cone.) Thelower panels of Fig. 3 show the weights plotted as the ratiowL/wM as a function of frequency. For both subjects, thespectral sensitivity changes from being dominated by M(wL/wM = 0.01 and 0.05 for AS and DP, respectively) at5 Hz, to being strongly influenced by L (wL/wM = 0.37
0 5 10 15 20 25 30
Frequency (Hz)
Subject DP
500 nm
577 nm
540 nm
609 nm
Model
0 5 10 15 20 25 30-180
-90
0
90
180
-180
-90
0
90
180
Adv
ance
of s
hort
er-w
avel
engt
h st
imul
us r
equi
red
for
null
(deg
)
-180
-90
0
90
180Subject AS
500 nm
577 nm
-180
-90
0
90
180
540 nm
609 nm
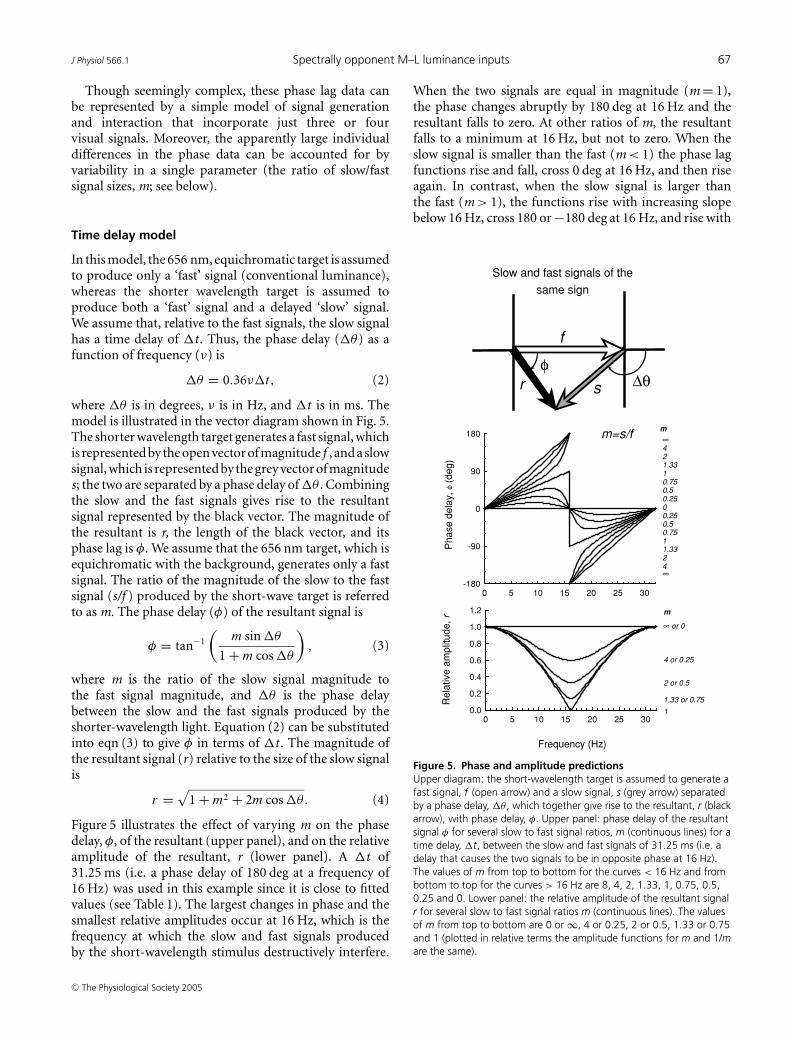
Figure 4. Phase advances required for flicker cancellationPhase advances of 500 nm (dotted circles, upper panels), 540 nm(triangles, upper middle panels), 577 nm (dotted inverted triangles,lower middle panels) and 609 nm (dotted squares, lower panels)flicker required to null 656 nm flicker on a 658 nm background for AS(left panels) and DP (right panels). Targets: 9.58 (500 nm), 9.36(540 nm), 9.57 (577 nm), 10.05 (609 nm) and 11.25 (656 nm) log10
quanta s−1 deg−2. Backgrounds: 12.55 (658 nm) and 10.90 log10
quanta s−1 deg−2 (410 nm, present for the 500 nm target only, toeliminate S-cone flicker detection). The fits of the time delay model areshown as the continuous lines.
for AS at 20 Hz and 0.37 for DP) at 15 Hz. A reasonwhy the spectral sensitivity is dominated by M at lowerradiances will be discussed in the accompanying paper(Stockman & Plummer, 2005c). Here, we are concernedwith the change from an M-cone spectral sensitivity backto that of an L-cone at higher frequencies under intenselong-wavelength adaptation.
Phase delays for spectral lights
Large frequency-dependent changes in flicker spectralsensitivity might be expected if visual signals withdifferent spectral sensitivities constructively interfere atsome frequencies, but then, because of large delays,destructively interfere at other frequencies. To test thispossibility, we measured phase lags between signalselicited by a long-wavelength, 656 nm flickering light anda shorter-wavelength flickering light as a function offrequency. Figure 4 shows such data for AS (left panels)and DP (right panels) obtained between 656 nm flicker and500 nm (circles, upper panels), 540 nm (triangles, uppermiddle panels), 577 nm (inverted triangles, lower middlepanels) or 609 nm (squares, lower panels) flicker. Targetradiances were chosen so that 25 Hz flicker at the higheststimulus modulation was, in each case, just visible whenthe second target was unmodulated.
The phase advances of the shorter-wavelength flickerrequired to null 656 nm flicker are plotted relative to thetwo flickering lights being out of phase (i.e. relative to theprediction of the conventional model). An advance of 180or −180 deg therefore means that the two lights producea flicker null when they are physically in phase, while oneof 0 deg means that they do so when they are in oppositephase. The continuous lines in each panel of Fig. 4 showthe fits of the proposed model, which is introduced below.
A consistent feature of the phase data for AS is that,relative to the 656 nm flicker, the shorter-wavelengthflicker is phase-delayed at lower frequencies, andphase-advanced at higher frequencies, with the reversal insign occurring near 16 Hz. The sizes of the phase advanceand phase delay, and the abruptness of the transitionfrom one to the other, increase with the difference inwavelength between the shorter-wavelength target and thelong-wavelength reference. At 500 nm, the phase advancechanges abruptly by ca 160 deg, while at 609 nm, it changesgradually by only ca 50 deg. The phase data for DP at 577and 609 nm are comparable to those for AS. In contrast,DP’s data at 500 and 540 nm are strikingly dissimilar, sinceboth sets of data increase continuously with frequency andlack the abrupt discontinuity near 16 Hz. (The 500 and540 nm phase data for DP are continuous across the upper(180 deg) and lower (−180 deg) boundaries of the plot,since a phase angle of θ and θ − 360 deg are equivalent inthis plot.)
C© The Physiological Society 2005
J Physiol 566.1 Spectrally opponent M–L luminance inputs 67
Though seemingly complex, these phase lag data canbe represented by a simple model of signal generationand interaction that incorporate just three or fourvisual signals. Moreover, the apparently large individualdifferences in the phase data can be accounted for byvariability in a single parameter (the ratio of slow/fastsignal sizes, m; see below).
Time delay model
In this model, the 656 nm, equichromatic target is assumedto produce only a ‘fast’ signal (conventional luminance),whereas the shorter wavelength target is assumed toproduce both a ‘fast’ signal and a delayed ‘slow’ signal.We assume that, relative to the fast signals, the slow signalhas a time delay of �t . Thus, the phase delay (�θ) as afunction of frequency (ν) is
�θ = 0.36ν�t, (2)
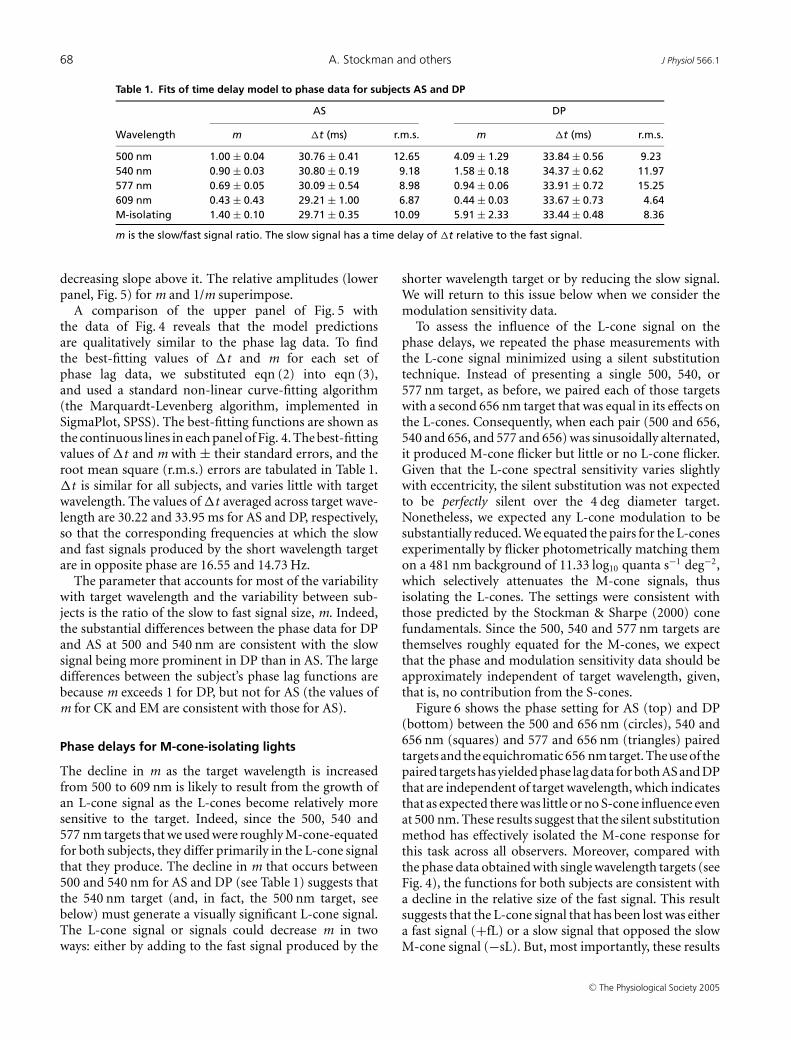
where �θ is in degrees, ν is in Hz, and �t is in ms. Themodel is illustrated in the vector diagram shown in Fig. 5.The shorter wavelength target generates a fast signal, whichis represented by the open vector of magnitude f , and a slowsignal, which is represented by the grey vector of magnitudes; the two are separated by a phase delay of �θ . Combiningthe slow and the fast signals gives rise to the resultantsignal represented by the black vector. The magnitude ofthe resultant is r, the length of the black vector, and itsphase lag is φ. We assume that the 656 nm target, which isequichromatic with the background, generates only a fastsignal. The ratio of the magnitude of the slow to the fastsignal (s/f ) produced by the short-wave target is referredto as m. The phase delay (φ) of the resultant signal is
φ = tan−1
(m sin �θ
1 + m cos �θ
), (3)
where m is the ratio of the slow signal magnitude tothe fast signal magnitude, and �θ is the phase delaybetween the slow and the fast signals produced by theshorter-wavelength light. Equation (2) can be substitutedinto eqn (3) to give φ in terms of �t . The magnitude ofthe resultant signal (r) relative to the size of the slow signalis
r =√
1 + m2 + 2m cos �θ. (4)
Figure 5 illustrates the effect of varying m on the phasedelay, φ, of the resultant (upper panel), and on the relativeamplitude of the resultant, r (lower panel). A �t of31.25 ms (i.e. a phase delay of 180 deg at a frequency of16 Hz) was used in this example since it is close to fittedvalues (see Table 1). The largest changes in phase and thesmallest relative amplitudes occur at 16 Hz, which is thefrequency at which the slow and fast signals producedby the short-wavelength stimulus destructively interfere.
When the two signals are equal in magnitude (m = 1),the phase changes abruptly by 180 deg at 16 Hz and theresultant falls to zero. At other ratios of m, the resultantfalls to a minimum at 16 Hz, but not to zero. When theslow signal is smaller than the fast (m < 1) the phase lagfunctions rise and fall, cross 0 deg at 16 Hz, and then riseagain. In contrast, when the slow signal is larger thanthe fast (m > 1), the functions rise with increasing slopebelow 16 Hz, cross 180 or −180 deg at 16 Hz, and rise with
0 5 10 15 20 25 30
Pha
se d
elay
, φ(d
eg)
-180
-90
0
90
180
Frequency (Hz)
0 5 10 15 20 25 30
Rel
ativ
e am
plitu
de, r
0.0
0.2
0.4
0.6
0.8
1.0
1.2
421.3310.750.50.2500.250.50.7511.3324
m
∞ or 0
4 or 0.25
2 or 0.5
1.33 or 0.75
1
∞
∞
Slow and fast signals of the
same sign
φ∆θ
f
sr
mm=s/f
Figure 5. Phase and amplitude predictionsUpper diagram: the short-wavelength target is assumed to generate afast signal, f (open arrow) and a slow signal, s (grey arrow) separatedby a phase delay, �θ , which together give rise to the resultant, r (blackarrow), with phase delay, φ. Upper panel: phase delay of the resultantsignal φ for several slow to fast signal ratios, m (continuous lines) for atime delay, �t, between the slow and fast signals of 31.25 ms (i.e. adelay that causes the two signals to be in opposite phase at 16 Hz).The values of m from top to bottom for the curves < 16 Hz and frombottom to top for the curves > 16 Hz are 8, 4, 2, 1.33, 1, 0.75, 0.5,0.25 and 0. Lower panel: the relative amplitude of the resultant signalr for several slow to fast signal ratios m (continuous lines). The valuesof m from top to bottom are 0 or ∞, 4 or 0.25, 2 or 0.5, 1.33 or 0.75and 1 (plotted in relative terms the amplitude functions for m and 1/mare the same).
C© The Physiological Society 2005
68 A. Stockman and others J Physiol 566.1
Table 1. Fits of time delay model to phase data for subjects AS and DP
AS DP
Wavelength m �t (ms) r.m.s. m �t (ms) r.m.s.
500 nm 1.00 ± 0.04 30.76 ± 0.41 12.65 4.09 ± 1.29 33.84 ± 0.56 9.23540 nm 0.90 ± 0.03 30.80 ± 0.19 9.18 1.58 ± 0.18 34.37 ± 0.62 11.97577 nm 0.69 ± 0.05 30.09 ± 0.54 8.98 0.94 ± 0.06 33.91 ± 0.72 15.25609 nm 0.43 ± 0.43 29.21 ± 1.00 6.87 0.44 ± 0.03 33.67 ± 0.73 4.64M-isolating 1.40 ± 0.10 29.71 ± 0.35 10.09 5.91 ± 2.33 33.44 ± 0.48 8.36
m is the slow/fast signal ratio. The slow signal has a time delay of �t relative to the fast signal.
decreasing slope above it. The relative amplitudes (lowerpanel, Fig. 5) for m and 1/m superimpose.
A comparison of the upper panel of Fig. 5 withthe data of Fig. 4 reveals that the model predictionsare qualitatively similar to the phase lag data. To findthe best-fitting values of �t and m for each set ofphase lag data, we substituted eqn (2) into eqn (3),and used a standard non-linear curve-fitting algorithm(the Marquardt-Levenberg algorithm, implemented inSigmaPlot, SPSS). The best-fitting functions are shown asthe continuous lines in each panel of Fig. 4. The best-fittingvalues of �t and m with ± their standard errors, and theroot mean square (r.m.s.) errors are tabulated in Table 1.�t is similar for all subjects, and varies little with targetwavelength. The values of �t averaged across target wave-length are 30.22 and 33.95 ms for AS and DP, respectively,so that the corresponding frequencies at which the slowand fast signals produced by the short wavelength targetare in opposite phase are 16.55 and 14.73 Hz.
The parameter that accounts for most of the variabilitywith target wavelength and the variability between sub-jects is the ratio of the slow to fast signal size, m. Indeed,the substantial differences between the phase data for DPand AS at 500 and 540 nm are consistent with the slowsignal being more prominent in DP than in AS. The largedifferences between the subject’s phase lag functions arebecause m exceeds 1 for DP, but not for AS (the values ofm for CK and EM are consistent with those for AS).
Phase delays for M-cone-isolating lights
The decline in m as the target wavelength is increasedfrom 500 to 609 nm is likely to result from the growth ofan L-cone signal as the L-cones become relatively moresensitive to the target. Indeed, since the 500, 540 and577 nm targets that we used were roughly M-cone-equatedfor both subjects, they differ primarily in the L-cone signalthat they produce. The decline in m that occurs between500 and 540 nm for AS and DP (see Table 1) suggests thatthe 540 nm target (and, in fact, the 500 nm target, seebelow) must generate a visually significant L-cone signal.The L-cone signal or signals could decrease m in twoways: either by adding to the fast signal produced by the
shorter wavelength target or by reducing the slow signal.We will return to this issue below when we consider themodulation sensitivity data.
To assess the influence of the L-cone signal on thephase delays, we repeated the phase measurements withthe L-cone signal minimized using a silent substitutiontechnique. Instead of presenting a single 500, 540, or577 nm target, as before, we paired each of those targetswith a second 656 nm target that was equal in its effects onthe L-cones. Consequently, when each pair (500 and 656,540 and 656, and 577 and 656) was sinusoidally alternated,it produced M-cone flicker but little or no L-cone flicker.Given that the L-cone spectral sensitivity varies slightlywith eccentricity, the silent substitution was not expectedto be perfectly silent over the 4 deg diameter target.Nonetheless, we expected any L-cone modulation to besubstantially reduced. We equated the pairs for the L-conesexperimentally by flicker photometrically matching themon a 481 nm background of 11.33 log10 quanta s−1 deg−2,which selectively attenuates the M-cone signals, thusisolating the L-cones. The settings were consistent withthose predicted by the Stockman & Sharpe (2000) conefundamentals. Since the 500, 540 and 577 nm targets arethemselves roughly equated for the M-cones, we expectthat the phase and modulation sensitivity data should beapproximately independent of target wavelength, given,that is, no contribution from the S-cones.
Figure 6 shows the phase setting for AS (top) and DP(bottom) between the 500 and 656 nm (circles), 540 and656 nm (squares) and 577 and 656 nm (triangles) pairedtargets and the equichromatic 656 nm target. The use of thepaired targets has yielded phase lag data for both AS and DPthat are independent of target wavelength, which indicatesthat as expected there was little or no S-cone influence evenat 500 nm. These results suggest that the silent substitutionmethod has effectively isolated the M-cone response forthis task across all observers. Moreover, compared withthe phase data obtained with single wavelength targets (seeFig. 4), the functions for both subjects are consistent witha decline in the relative size of the fast signal. This resultsuggests that the L-cone signal that has been lost was eithera fast signal (+fL) or a slow signal that opposed the slowM-cone signal (−sL). But, most importantly, these results
C© The Physiological Society 2005
J Physiol 566.1 Spectrally opponent M–L luminance inputs 69
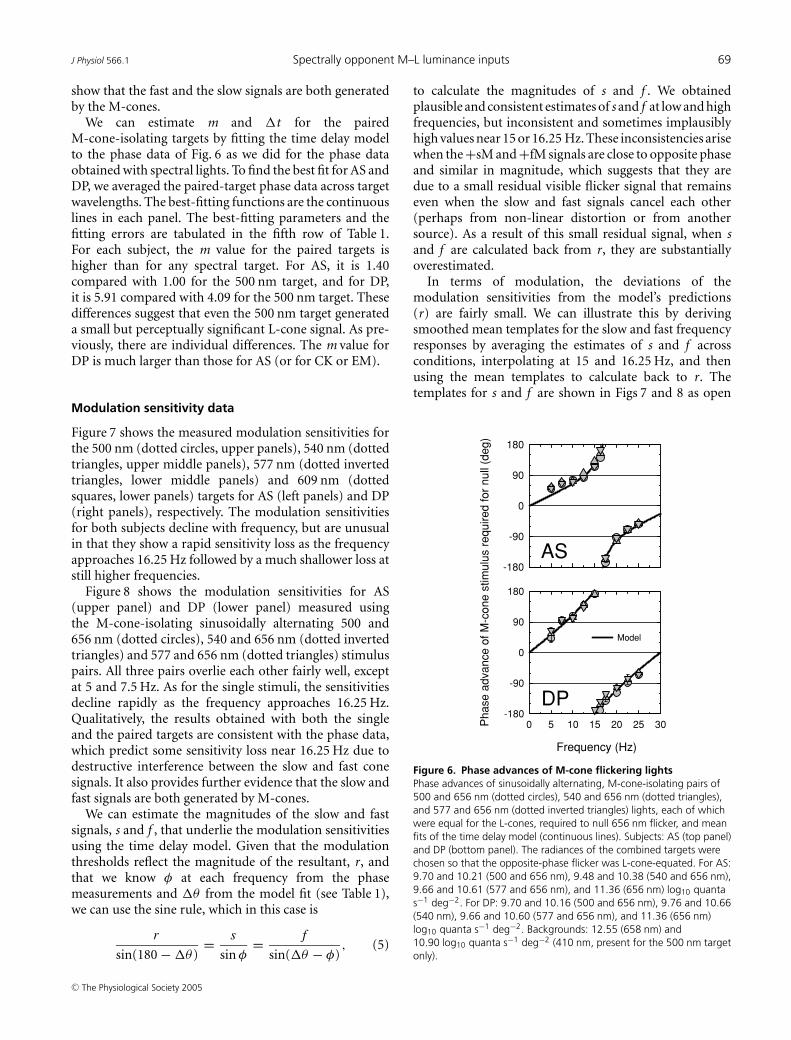
show that the fast and the slow signals are both generatedby the M-cones.
We can estimate m and �t for the pairedM-cone-isolating targets by fitting the time delay modelto the phase data of Fig. 6 as we did for the phase dataobtained with spectral lights. To find the best fit for AS andDP, we averaged the paired-target phase data across targetwavelengths. The best-fitting functions are the continuouslines in each panel. The best-fitting parameters and thefitting errors are tabulated in the fifth row of Table 1.For each subject, the m value for the paired targets ishigher than for any spectral target. For AS, it is 1.40compared with 1.00 for the 500 nm target, and for DP,it is 5.91 compared with 4.09 for the 500 nm target. Thesedifferences suggest that even the 500 nm target generateda small but perceptually significant L-cone signal. As pre-viously, there are individual differences. The m value forDP is much larger than those for AS (or for CK or EM).
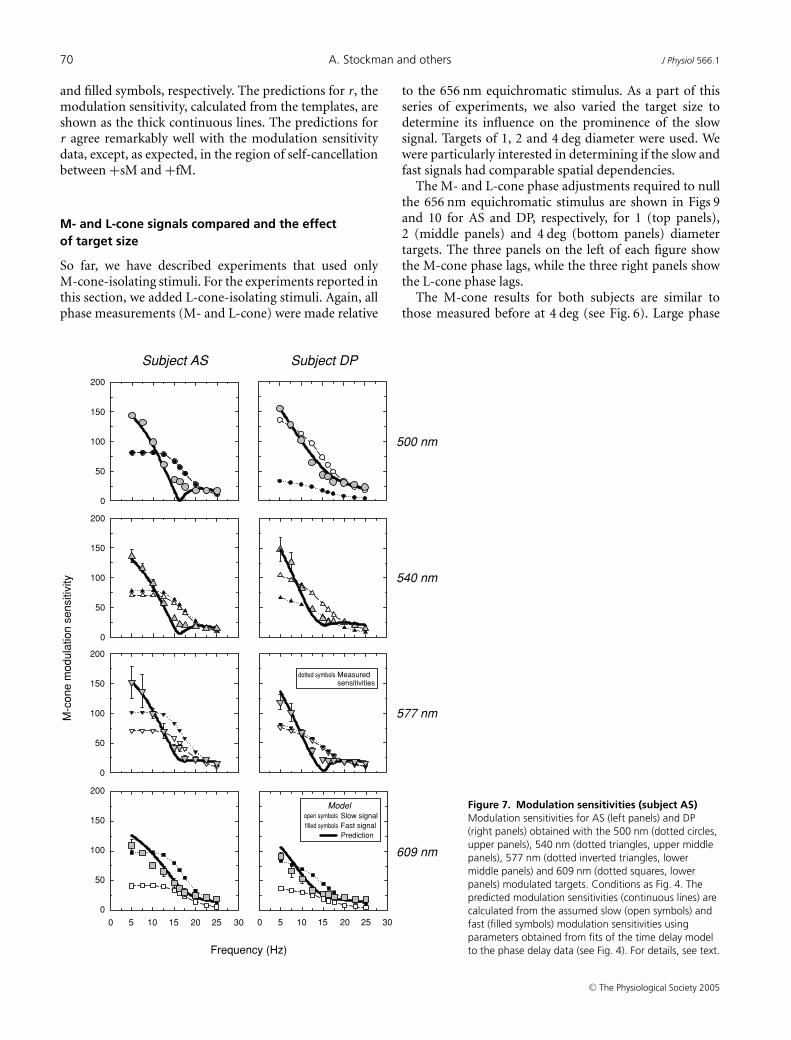
Modulation sensitivity data
Figure 7 shows the measured modulation sensitivities forthe 500 nm (dotted circles, upper panels), 540 nm (dottedtriangles, upper middle panels), 577 nm (dotted invertedtriangles, lower middle panels) and 609 nm (dottedsquares, lower panels) targets for AS (left panels) and DP(right panels), respectively. The modulation sensitivitiesfor both subjects decline with frequency, but are unusualin that they show a rapid sensitivity loss as the frequencyapproaches 16.25 Hz followed by a much shallower loss atstill higher frequencies.
Figure 8 shows the modulation sensitivities for AS(upper panel) and DP (lower panel) measured usingthe M-cone-isolating sinusoidally alternating 500 and656 nm (dotted circles), 540 and 656 nm (dotted invertedtriangles) and 577 and 656 nm (dotted triangles) stimuluspairs. All three pairs overlie each other fairly well, exceptat 5 and 7.5 Hz. As for the single stimuli, the sensitivitiesdecline rapidly as the frequency approaches 16.25 Hz.Qualitatively, the results obtained with both the singleand the paired targets are consistent with the phase data,which predict some sensitivity loss near 16.25 Hz due todestructive interference between the slow and fast conesignals. It also provides further evidence that the slow andfast signals are both generated by M-cones.
We can estimate the magnitudes of the slow and fastsignals, s and f , that underlie the modulation sensitivitiesusing the time delay model. Given that the modulationthresholds reflect the magnitude of the resultant, r, andthat we know φ at each frequency from the phasemeasurements and �θ from the model fit (see Table 1),we can use the sine rule, which in this case is
r
sin(180 − �θ)= s
sin φ= f
sin(�θ − φ), (5)
to calculate the magnitudes of s and f . We obtainedplausible and consistent estimates of s and f at low and highfrequencies, but inconsistent and sometimes implausiblyhigh values near 15 or 16.25 Hz. These inconsistencies arisewhen the +sM and +fM signals are close to opposite phaseand similar in magnitude, which suggests that they aredue to a small residual visible flicker signal that remainseven when the slow and fast signals cancel each other(perhaps from non-linear distortion or from anothersource). As a result of this small residual signal, when sand f are calculated back from r, they are substantiallyoverestimated.
In terms of modulation, the deviations of themodulation sensitivities from the model’s predictions(r) are fairly small. We can illustrate this by derivingsmoothed mean templates for the slow and fast frequencyresponses by averaging the estimates of s and f acrossconditions, interpolating at 15 and 16.25 Hz, and thenusing the mean templates to calculate back to r. Thetemplates for s and f are shown in Figs 7 and 8 as open
Frequency (Hz)
0 5 10 15 20 25 30-180
-90
0
90
180
-180
-90
0
90
180
AS
DP
Pha
se a
dvan
ce o
f M-c
one
stim
ulus
req
uire
d fo
r nu
ll (d
eg)
Model
Figure 6. Phase advances of M-cone flickering lightsPhase advances of sinusoidally alternating, M-cone-isolating pairs of500 and 656 nm (dotted circles), 540 and 656 nm (dotted triangles),and 577 and 656 nm (dotted inverted triangles) lights, each of whichwere equal for the L-cones, required to null 656 nm flicker, and meanfits of the time delay model (continuous lines). Subjects: AS (top panel)and DP (bottom panel). The radiances of the combined targets werechosen so that the opposite-phase flicker was L-cone-equated. For AS:9.70 and 10.21 (500 and 656 nm), 9.48 and 10.38 (540 and 656 nm),9.66 and 10.61 (577 and 656 nm), and 11.36 (656 nm) log10 quantas−1 deg−2. For DP: 9.70 and 10.16 (500 and 656 nm), 9.76 and 10.66(540 nm), 9.66 and 10.60 (577 and 656 nm), and 11.36 (656 nm)log10 quanta s−1 deg−2. Backgrounds: 12.55 (658 nm) and10.90 log10 quanta s−1 deg−2 (410 nm, present for the 500 nm targetonly).
C© The Physiological Society 2005
70 A. Stockman and others J Physiol 566.1
and filled symbols, respectively. The predictions for r, themodulation sensitivity, calculated from the templates, areshown as the thick continuous lines. The predictions forr agree remarkably well with the modulation sensitivitydata, except, as expected, in the region of self-cancellationbetween +sM and +fM.
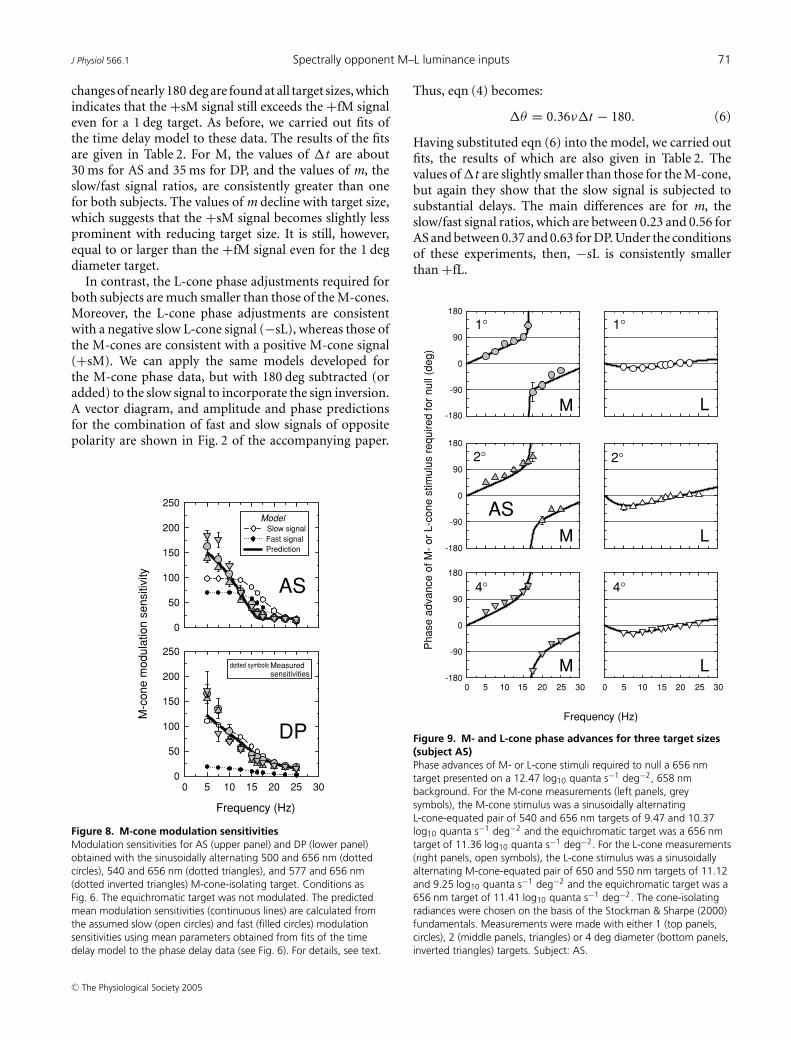
M- and L-cone signals compared and the effectof target size
So far, we have described experiments that used onlyM-cone-isolating stimuli. For the experiments reported inthis section, we added L-cone-isolating stimuli. Again, allphase measurements (M- and L-cone) were made relative
Frequency (Hz)
M-c
one
mod
ulat
ion
sens
itivi
ty
0
50
100
150
200
0 5 10 15 20 25 30
0
50
100
150
200
500 nm
Subject AS
609 nm
0
50
100
150
200
0
50
100
150
200
577 nm
0 5 10 15 20 25 30
540 nm
dotted symbols Measuredsensitivities
open symbolsModel
filled symbolsPrediction
Slow signalFast signal
Subject DP
Figure 7. Modulation sensitivities (subject AS)Modulation sensitivities for AS (left panels) and DP(right panels) obtained with the 500 nm (dotted circles,upper panels), 540 nm (dotted triangles, upper middlepanels), 577 nm (dotted inverted triangles, lowermiddle panels) and 609 nm (dotted squares, lowerpanels) modulated targets. Conditions as Fig. 4. Thepredicted modulation sensitivities (continuous lines) arecalculated from the assumed slow (open symbols) andfast (filled symbols) modulation sensitivities usingparameters obtained from fits of the time delay modelto the phase delay data (see Fig. 4). For details, see text.
to the 656 nm equichromatic stimulus. As a part of thisseries of experiments, we also varied the target size todetermine its influence on the prominence of the slowsignal. Targets of 1, 2 and 4 deg diameter were used. Wewere particularly interested in determining if the slow andfast signals had comparable spatial dependencies.
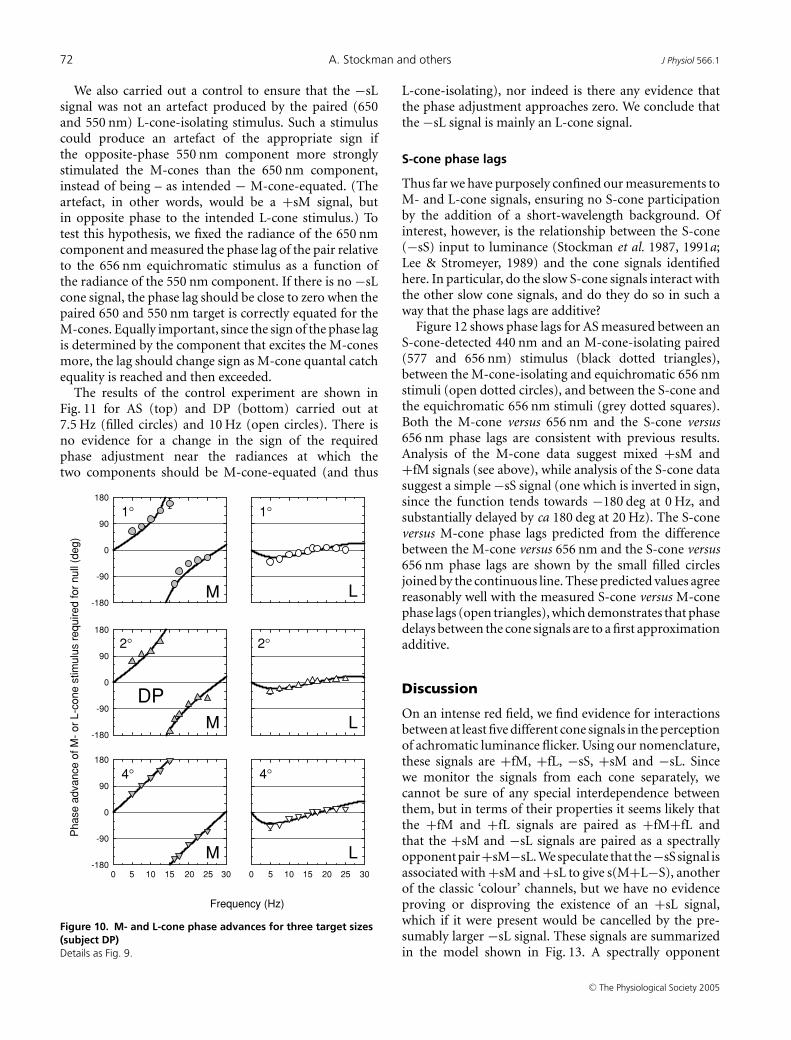
The M- and L-cone phase adjustments required to nullthe 656 nm equichromatic stimulus are shown in Figs 9and 10 for AS and DP, respectively, for 1 (top panels),2 (middle panels) and 4 deg (bottom panels) diametertargets. The three panels on the left of each figure showthe M-cone phase lags, while the three right panels showthe L-cone phase lags.
The M-cone results for both subjects are similar tothose measured before at 4 deg (see Fig. 6). Large phase
C© The Physiological Society 2005
J Physiol 566.1 Spectrally opponent M–L luminance inputs 71
changes of nearly 180 deg are found at all target sizes, whichindicates that the +sM signal still exceeds the +fM signaleven for a 1 deg target. As before, we carried out fits ofthe time delay model to these data. The results of the fitsare given in Table 2. For M, the values of �t are about30 ms for AS and 35 ms for DP, and the values of m, theslow/fast signal ratios, are consistently greater than onefor both subjects. The values of m decline with target size,which suggests that the +sM signal becomes slightly lessprominent with reducing target size. It is still, however,equal to or larger than the +fM signal even for the 1 degdiameter target.
In contrast, the L-cone phase adjustments required forboth subjects are much smaller than those of the M-cones.Moreover, the L-cone phase adjustments are consistentwith a negative slow L-cone signal (−sL), whereas those ofthe M-cones are consistent with a positive M-cone signal(+sM). We can apply the same models developed forthe M-cone phase data, but with 180 deg subtracted (oradded) to the slow signal to incorporate the sign inversion.A vector diagram, and amplitude and phase predictionsfor the combination of fast and slow signals of oppositepolarity are shown in Fig. 2 of the accompanying paper.
Frequency (Hz)
M-c
one
mod
ulat
ion
sens
itivi
ty
0
50
100
150
200
250
AS
0 5 10 15 20 25 300
50
100
150
200
250
DP
dotted symbols Measuredsensitivities
Model
Prediction
Slow signalFast signal
Figure 8. M-cone modulation sensitivitiesModulation sensitivities for AS (upper panel) and DP (lower panel)obtained with the sinusoidally alternating 500 and 656 nm (dottedcircles), 540 and 656 nm (dotted triangles), and 577 and 656 nm(dotted inverted triangles) M-cone-isolating target. Conditions asFig. 6. The equichromatic target was not modulated. The predictedmean modulation sensitivities (continuous lines) are calculated fromthe assumed slow (open circles) and fast (filled circles) modulationsensitivities using mean parameters obtained from fits of the timedelay model to the phase delay data (see Fig. 6). For details, see text.
Thus, eqn (4) becomes:
�θ = 0.36ν�t − 180. (6)
Having substituted eqn (6) into the model, we carried outfits, the results of which are also given in Table 2. Thevalues of �t are slightly smaller than those for the M-cone,but again they show that the slow signal is subjected tosubstantial delays. The main differences are for m, theslow/fast signal ratios, which are between 0.23 and 0.56 forAS and between 0.37 and 0.63 for DP. Under the conditionsof these experiments, then, −sL is consistently smallerthan +fL.
-180
-90
0
90
180
0 5 10 15 20 25 30-180
-90
0
90
180
Frequency (Hz)
Pha
se a
dvan
ce o
f M-
or L
-con
e st
imul
us r
equi
red
for
null
(deg
)-180
-90
0
90
180
AS
1°
2°
4°
0 5 10 15 20 25 30
1°
2°
4°
M
M
M
L
L
L
Figure 9. M- and L-cone phase advances for three target sizes(subject AS)Phase advances of M- or L-cone stimuli required to null a 656 nmtarget presented on a 12.47 log10 quanta s−1 deg−2, 658 nmbackground. For the M-cone measurements (left panels, greysymbols), the M-cone stimulus was a sinusoidally alternatingL-cone-equated pair of 540 and 656 nm targets of 9.47 and 10.37log10 quanta s−1 deg−2 and the equichromatic target was a 656 nmtarget of 11.36 log10 quanta s−1 deg−2. For the L-cone measurements(right panels, open symbols), the L-cone stimulus was a sinusoidallyalternating M-cone-equated pair of 650 and 550 nm targets of 11.12and 9.25 log10 quanta s−1 deg−2 and the equichromatic target was a656 nm target of 11.41 log10 quanta s−1 deg−2. The cone-isolatingradiances were chosen on the basis of the Stockman & Sharpe (2000)fundamentals. Measurements were made with either 1 (top panels,circles), 2 (middle panels, triangles) or 4 deg diameter (bottom panels,inverted triangles) targets. Subject: AS.
C© The Physiological Society 2005
72 A. Stockman and others J Physiol 566.1
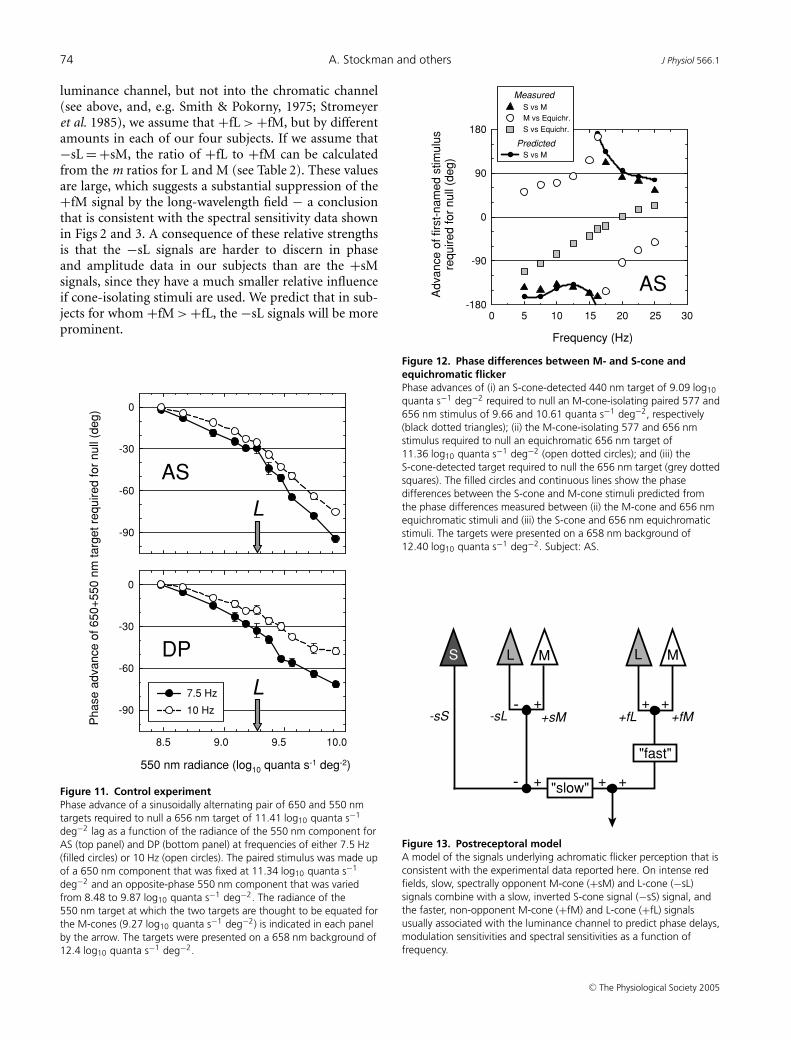
We also carried out a control to ensure that the −sLsignal was not an artefact produced by the paired (650and 550 nm) L-cone-isolating stimulus. Such a stimuluscould produce an artefact of the appropriate sign ifthe opposite-phase 550 nm component more stronglystimulated the M-cones than the 650 nm component,instead of being – as intended − M-cone-equated. (Theartefact, in other words, would be a +sM signal, butin opposite phase to the intended L-cone stimulus.) Totest this hypothesis, we fixed the radiance of the 650 nmcomponent and measured the phase lag of the pair relativeto the 656 nm equichromatic stimulus as a function ofthe radiance of the 550 nm component. If there is no −sLcone signal, the phase lag should be close to zero when thepaired 650 and 550 nm target is correctly equated for theM-cones. Equally important, since the sign of the phase lagis determined by the component that excites the M-conesmore, the lag should change sign as M-cone quantal catchequality is reached and then exceeded.
The results of the control experiment are shown inFig. 11 for AS (top) and DP (bottom) carried out at7.5 Hz (filled circles) and 10 Hz (open circles). There isno evidence for a change in the sign of the requiredphase adjustment near the radiances at which thetwo components should be M-cone-equated (and thus
-180
-90
0
90
180
0 5 10 15 20 25 30-180
-90
0
90
180
Frequency (Hz)
Pha
se a
dvan
ce o
f M-
or L
-con
e st
imul
us r
equi
red
for
null
(deg
)
-180
-90
0
90
180
DP
1°
2°
4°
0 5 10 15 20 25 30
1°
2°
4°
M
M
M
L
L
L
Figure 10. M- and L-cone phase advances for three target sizes(subject DP)Details as Fig. 9.
L-cone-isolating), nor indeed is there any evidence thatthe phase adjustment approaches zero. We conclude thatthe −sL signal is mainly an L-cone signal.
S-cone phase lags
Thus far we have purposely confined our measurements toM- and L-cone signals, ensuring no S-cone participationby the addition of a short-wavelength background. Ofinterest, however, is the relationship between the S-cone(−sS) input to luminance (Stockman et al. 1987, 1991a;Lee & Stromeyer, 1989) and the cone signals identifiedhere. In particular, do the slow S-cone signals interact withthe other slow cone signals, and do they do so in such away that the phase lags are additive?
Figure 12 shows phase lags for AS measured between anS-cone-detected 440 nm and an M-cone-isolating paired(577 and 656 nm) stimulus (black dotted triangles),between the M-cone-isolating and equichromatic 656 nmstimuli (open dotted circles), and between the S-cone andthe equichromatic 656 nm stimuli (grey dotted squares).Both the M-cone versus 656 nm and the S-cone versus656 nm phase lags are consistent with previous results.Analysis of the M-cone data suggest mixed +sM and+fM signals (see above), while analysis of the S-cone datasuggest a simple −sS signal (one which is inverted in sign,since the function tends towards −180 deg at 0 Hz, andsubstantially delayed by ca 180 deg at 20 Hz). The S-coneversus M-cone phase lags predicted from the differencebetween the M-cone versus 656 nm and the S-cone versus656 nm phase lags are shown by the small filled circlesjoined by the continuous line. These predicted values agreereasonably well with the measured S-cone versus M-conephase lags (open triangles), which demonstrates that phasedelays between the cone signals are to a first approximationadditive.
Discussion
On an intense red field, we find evidence for interactionsbetween at least five different cone signals in the perceptionof achromatic luminance flicker. Using our nomenclature,these signals are +fM, +fL, −sS, +sM and −sL. Sincewe monitor the signals from each cone separately, wecannot be sure of any special interdependence betweenthem, but in terms of their properties it seems likely thatthe +fM and +fL signals are paired as +fM+fL andthat the +sM and −sL signals are paired as a spectrallyopponent pair+sM−sL. We speculate that the−sS signal isassociated with +sM and +sL to give s(M+L−S), anotherof the classic ‘colour’ channels, but we have no evidenceproving or disproving the existence of an +sL signal,which if it were present would be cancelled by the pre-sumably larger −sL signal. These signals are summarizedin the model shown in Fig. 13. A spectrally opponent
C© The Physiological Society 2005
J Physiol 566.1 Spectrally opponent M–L luminance inputs 73
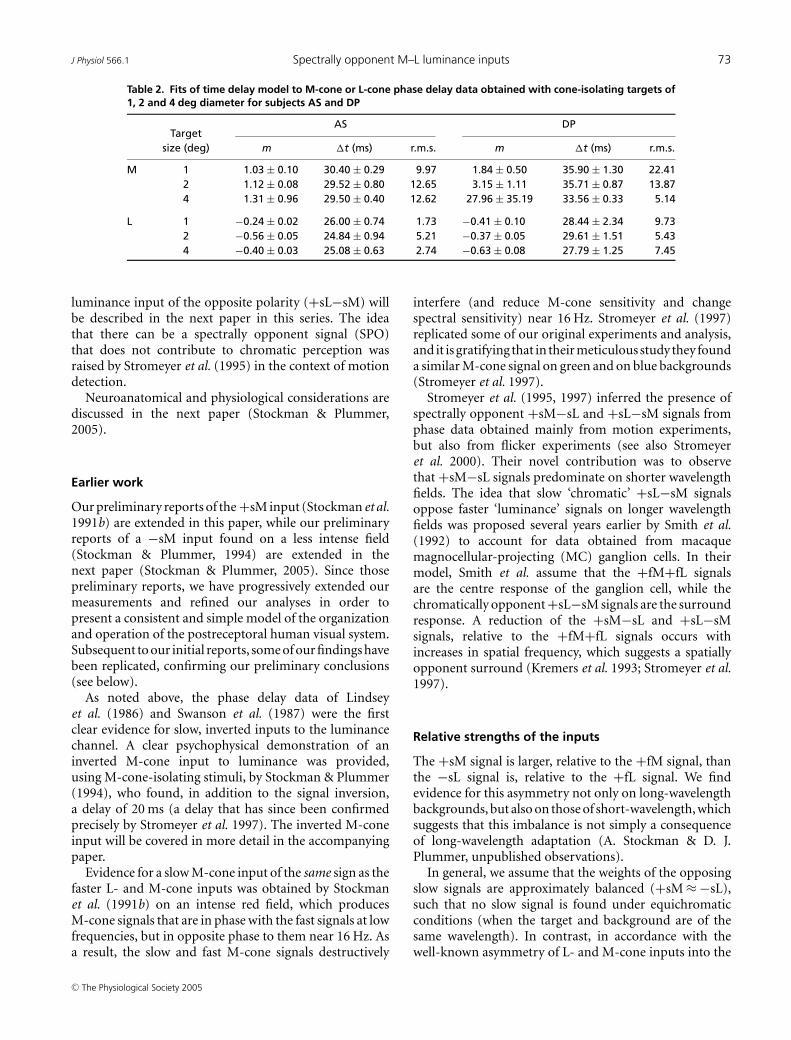
Table 2. Fits of time delay model to M-cone or L-cone phase delay data obtained with cone-isolating targets of1, 2 and 4 deg diameter for subjects AS and DP
AS DPTarget
size (deg) m �t (ms) r.m.s. m �t (ms) r.m.s.
M 1 1.03 ± 0.10 30.40 ± 0.29 9.97 1.84 ± 0.50 35.90 ± 1.30 22.412 1.12 ± 0.08 29.52 ± 0.80 12.65 3.15 ± 1.11 35.71 ± 0.87 13.874 1.31 ± 0.96 29.50 ± 0.40 12.62 27.96 ± 35.19 33.56 ± 0.33 5.14
L 1 −0.24 ± 0.02 26.00 ± 0.74 1.73 −0.41 ± 0.10 28.44 ± 2.34 9.732 −0.56 ± 0.05 24.84 ± 0.94 5.21 −0.37 ± 0.05 29.61 ± 1.51 5.434 −0.40 ± 0.03 25.08 ± 0.63 2.74 −0.63 ± 0.08 27.79 ± 1.25 7.45
luminance input of the opposite polarity (+sL−sM) willbe described in the next paper in this series. The ideathat there can be a spectrally opponent signal (SPO)that does not contribute to chromatic perception wasraised by Stromeyer et al. (1995) in the context of motiondetection.
Neuroanatomical and physiological considerations arediscussed in the next paper (Stockman & Plummer,2005).
Earlier work
Our preliminary reports of the +sM input (Stockman et al.1991b) are extended in this paper, while our preliminaryreports of a −sM input found on a less intense field(Stockman & Plummer, 1994) are extended in thenext paper (Stockman & Plummer, 2005). Since thosepreliminary reports, we have progressively extended ourmeasurements and refined our analyses in order topresent a consistent and simple model of the organizationand operation of the postreceptoral human visual system.Subsequent to our initial reports, some of our findings havebeen replicated, confirming our preliminary conclusions(see below).
As noted above, the phase delay data of Lindseyet al. (1986) and Swanson et al. (1987) were the firstclear evidence for slow, inverted inputs to the luminancechannel. A clear psychophysical demonstration of aninverted M-cone input to luminance was provided,using M-cone-isolating stimuli, by Stockman & Plummer(1994), who found, in addition to the signal inversion,a delay of 20 ms (a delay that has since been confirmedprecisely by Stromeyer et al. 1997). The inverted M-coneinput will be covered in more detail in the accompanyingpaper.
Evidence for a slow M-cone input of the same sign as thefaster L- and M-cone inputs was obtained by Stockmanet al. (1991b) on an intense red field, which producesM-cone signals that are in phase with the fast signals at lowfrequencies, but in opposite phase to them near 16 Hz. Asa result, the slow and fast M-cone signals destructively
interfere (and reduce M-cone sensitivity and changespectral sensitivity) near 16 Hz. Stromeyer et al. (1997)replicated some of our original experiments and analysis,and it is gratifying that in their meticulous study they founda similar M-cone signal on green and on blue backgrounds(Stromeyer et al. 1997).
Stromeyer et al. (1995, 1997) inferred the presence ofspectrally opponent +sM−sL and +sL−sM signals fromphase data obtained mainly from motion experiments,but also from flicker experiments (see also Stromeyeret al. 2000). Their novel contribution was to observethat +sM−sL signals predominate on shorter wavelengthfields. The idea that slow ‘chromatic’ +sL−sM signalsoppose faster ‘luminance’ signals on longer wavelengthfields was proposed several years earlier by Smith et al.(1992) to account for data obtained from macaquemagnocellular-projecting (MC) ganglion cells. In theirmodel, Smith et al. assume that the +fM+fL signalsare the centre response of the ganglion cell, while thechromatically opponent +sL−sM signals are the surroundresponse. A reduction of the +sM−sL and +sL−sMsignals, relative to the +fM+fL signals occurs withincreases in spatial frequency, which suggests a spatiallyopponent surround (Kremers et al. 1993; Stromeyer et al.1997).
Relative strengths of the inputs
The +sM signal is larger, relative to the +fM signal, thanthe −sL signal is, relative to the +fL signal. We findevidence for this asymmetry not only on long-wavelengthbackgrounds, but also on those of short-wavelength, whichsuggests that this imbalance is not simply a consequenceof long-wavelength adaptation (A. Stockman & D. J.Plummer, unpublished observations).
In general, we assume that the weights of the opposingslow signals are approximately balanced (+sM ≈ −sL),such that no slow signal is found under equichromaticconditions (when the target and background are of thesame wavelength). In contrast, in accordance with thewell-known asymmetry of L- and M-cone inputs into the
C© The Physiological Society 2005
74 A. Stockman and others J Physiol 566.1
luminance channel, but not into the chromatic channel(see above, and, e.g. Smith & Pokorny, 1975; Stromeyeret al. 1985), we assume that +fL > +fM, but by differentamounts in each of our four subjects. If we assume that−sL = +sM, the ratio of +fL to +fM can be calculatedfrom the m ratios for L and M (see Table 2). These valuesare large, which suggests a substantial suppression of the+fM signal by the long-wavelength field − a conclusionthat is consistent with the spectral sensitivity data shownin Figs 2 and 3. A consequence of these relative strengthsis that the −sL signals are harder to discern in phaseand amplitude data in our subjects than are the +sMsignals, since they have a much smaller relative influenceif cone-isolating stimuli are used. We predict that in sub-jects for whom +fM > +fL, the −sL signals will be moreprominent.
550 nm radiance (log10 quanta s-1 deg-2)
Pha
se a
dvan
ce o
f 650
+55
0 nm
targ
et r
equi
red
for
null
(deg
)
-90
-60
-30
0
AS
L
8.5 9.0 9.5 10.0
-90
-60
-30
0
DP
L7.5 Hz
10 Hz
Figure 11. Control experimentPhase advance of a sinusoidally alternating pair of 650 and 550 nmtargets required to null a 656 nm target of 11.41 log10 quanta s−1
deg−2 lag as a function of the radiance of the 550 nm component forAS (top panel) and DP (bottom panel) at frequencies of either 7.5 Hz(filled circles) or 10 Hz (open circles). The paired stimulus was made upof a 650 nm component that was fixed at 11.34 log10 quanta s−1
deg−2 and an opposite-phase 550 nm component that was variedfrom 8.48 to 9.87 log10 quanta s−1 deg−2. The radiance of the550 nm target at which the two targets are thought to be equated forthe M-cones (9.27 log10 quanta s−1 deg−2) is indicated in each panelby the arrow. The targets were presented on a 658 nm background of12.4 log10 quanta s−1 deg−2.
Frequency (Hz)
0 5 10 15 20 25 30
Adv
ance
of f
irst-
nam
ed s
timul
usre
quire
d fo
r nu
ll (d
eg)
-180
-90
0
90
180
AS
PredictedS vs M
M vs Equichr.
Measured
S vs Equichr.
S vs M
Figure 12. Phase differences between M- and S-cone andequichromatic flickerPhase advances of (i) an S-cone-detected 440 nm target of 9.09 log10
quanta s−1 deg−2 required to null an M-cone-isolating paired 577 and656 nm stimulus of 9.66 and 10.61 quanta s−1 deg−2, respectively(black dotted triangles); (ii) the M-cone-isolating 577 and 656 nmstimulus required to null an equichromatic 656 nm target of11.36 log10 quanta s−1 deg−2 (open dotted circles); and (iii) theS-cone-detected target required to null the 656 nm target (grey dottedsquares). The filled circles and continuous lines show the phasedifferences between the S-cone and M-cone stimuli predicted fromthe phase differences measured between (ii) the M-cone and 656 nmequichromatic stimuli and (iii) the S-cone and 656 nm equichromaticstimuli. The targets were presented on a 658 nm background of12.40 log10 quanta s−1 deg−2. Subject: AS.
-
"slow"
"fast"
+++
++ +
+sM +fL-sS
S M ML L
-
-sL +fM
Figure 13. Postreceptoral modelA model of the signals underlying achromatic flicker perception that isconsistent with the experimental data reported here. On intense redfields, slow, spectrally opponent M-cone (+sM) and L-cone (−sL)signals combine with a slow, inverted S-cone signal (−sS) signal, andthe faster, non-opponent M-cone (+fM) and L-cone (+fL) signalsusually associated with the luminance channel to predict phase delays,modulation sensitivities and spectral sensitivities as a function offrequency.
C© The Physiological Society 2005
J Physiol 566.1 Spectrally opponent M–L luminance inputs 75
Other considerations
We have several other considerations. First, we assumedthat there are no phase differences between the M- andL-cone signals transmitted through the same type ofchannel. Although the red field much more strongly adaptsthe L-cones than the M-cones, under the very intenseadaptation conditions of our experiment we assume thatthe changes in phase have reached their maximum ornearly so (see above). The likely error in this assumption isindicated by the change in�t when the single shorter wave-length targets were substituted for the L-cone-equatedpaired targets that stimulated the M-cones. The fact thatthese changes are small (cf. Tables 1 and 2) suggests thatany errors too are small.
Second, the results reported in this paper seem toconflict with the work of Eisner & MacLeod (1981), whoobtained 17 Hz flicker photometric spectral sensitivities onred fields that were close to an M-cone spectral sensitivity.Figure 1, which shows the difference in the sensitivity to16 Hz flicker at 574 and 650 nm, helps to explain both setsof results. On lower intensity backgrounds, the sensitivitydifference is close to an M-cone spectral sensitivity, asEisner & MacLeod found. However, on high intensity back-grounds, the spectral sensitivity reverts back towards L,partly because of self-cancellation between the slow andfast M-cone signals, but also because of a suppression of the+fM signal (A. Stockman & D. J. Plummer, unpublishedobservations).
Third, because phase differences must be measuredrelative to another process, we can never be sure of theabsolute phase delays of any signal. In these experiments,we use equichromatic flicker as the reference, but we donot know the complexity of its phase behaviour.
Fourth, implicit in the time delay model is theassumption that �t and m are not frequency dependent;i.e. that the shapes of the logarithmic temporal modulationsensitivities of the slow and fast signals are identical. Theability of such a simple model to account for the data isstriking. The phase lag data, however, tend to fall slightlyabove the predictions of the time delay model at both lowand high frequencies, which suggests that m or �t or bothchange with frequency. We can account for such changesby passing the slow signal through additional stages oflow-pass temporal filtering. One stage of filtering reducesthe r.m.s. error by about one half.
Conclusions
Under intense long-wavelength adaptation, multiplecone signals contribute to achromatic flicker perception.These signals, which can be fast (+fM, +fL) or slowand of the same or different sign (+sM, −sL, −sS),constructively and destructively interfere to producecharacteristic, frequency-dependent changes in spectral
sensitivity, modulation sensitivity and phase delay data.The luminance channel has an achromatic output, butslow spectrally opponent inputs.
The existence of multiple inputs to the luminancechannel questions the conventional psychophysical modelof the human visual system. It also casts further doubton the interpretation of the myriad of ‘chromatic’experiments that have relied on HFP or MDB to silencethe luminance channel, since equiluminance only silencesa subset of the luminance inputs.
References
Baylor DA, Nunn BJ & Schnapf JL (1984). The photocurrent,noise and spectral sensitivity of rods of the monkey Macacafascicularis. J Physiol 357, 575–607.
Boynton RM (1979). Human Color Vision. Holt, Rinehart andWinston, New York.
Cushman WB & Levinson JZ (1983). Phase shift in red andgreen counter-phase flicker at high frequencies. J Opt Soc Am73, 1557–1561.
De Lange H (1958). Research into the dynamic nature of thehuman fovea-cortex systems with intermittent andmodulated light. II. Phase shift in brightness and delay incolor perception. J Opt Soc Am 48, 784–789.
De Vries H (1948). The luminosity curve of the eye asdetermined by measurements with the flicker photometer.Physica 14, 319–348.
Drum BA (1977). Cone interactions at high flicker frequencies:Evidence for cone latency differences? J Opt Soc Am 67,1601–1603.
Drum B (1984). Cone response latency and log sensitivity:proportional changes with light adaptation. Vision Res 24,323–331.
Eisner A (1982). Comparison of flicker-photometric andflicker-threshold spectral sensitivities while the eye isadapted to colored backgrounds. J Opt Soc Am 72, 517–518.
Eisner A & MacLeod DIA (1980). Blue sensitive cones do notcontribute to luminance. J Opt Soc Am 70, 121–123.
Eisner A & MacLeod DIA (1981). Flicker photometric study ofchromatic adaptation: selective suppression of cone inputsby colored backgrounds. J Opt Soc Am 71, 705–718.
Guth SL, Alexander JV, Chumbly JI, Gillman CB & PattersonMM (1968). Factors affecting luminance additivity atthreshold. Vision Res 8, 913–928.
Ives HE (1912). Studies in the photometry of lights of differentcolours. I. Spectral luminosity curves obtained by theequality of brightness photometer and flicker photometerunder similar conditions. Philos Mag Ser 6, 149–188.
Kremers J, Yeh T & Lee BB (1993). The response of macaqueganglion cells and human observers to heterochromaticallymodulated lights: the effect of stimulus size. Vision Res 34,217–221.
Lee J & Stromeyer CF (1989). Contribution of humanshort-wave cones to luminance and motion detection.J Physiol 413, 563–593.
Lennie P, Pokorny J & Smith VC (1993). Luminance. J Opt SocAm A 10, 1283–1293.
C© The Physiological Society 2005
76 A. Stockman and others J Physiol 566.1
Lindsey DT, Pokorny J & Smith VC (1986). Phase-dependentsensitivity to heterochromatic flicker. J Opt Soc Am A 3,921–927.
Luther R (1927). Aus dem Gebiet der Farbreizmetrik. Z TechnPhysik 8, 540–558.
Marks LE & Bornstein MH (1973). Spectral sensitivity byconstant CFF: effect of chromatic adaptation. J Opt Soc Am63, 220–226.
Rushton WAH & Henry GH (1968). Bleaching andregeneration of cone pigments in man. Vision Res 8,617–631.
Schrodinger E (1925). Uber das Verhaltnis der Vierfarben zurDreifarbentheorie. Sitzungberichte Abt 2a, Mathematik,Astronomie, Physik, Meteorogie Mechanik A 134, 471.
Smith VC, Lee BB, Pokorny J, Martin PR & Valberg A (1992).Responses of macaque ganglion cells to the relative phase ofheterochromatically modulated lights. J Physiol 458,191–221.
Smith VC & Pokorny J (1975). Spectral sensitivity of the fovealcone photopigments between 400 and 500 nm. Vision Res 15,161–171.
Stockman A, MacLeod DIA & DePriest DD (1987). An invertedS-cone input to the luminance channel: evidence for twoprocesses in S-cone flicker detection. Invest Ophthalmol VisSci (suppl.) 28, 92.
Stockman A, MacLeod DIA & DePriest DD (1991a).The temporal properties of the human short-wavephotoreceptors and their associated pathways. Vision Res 31,189–208.
Stockman A, MacLeod DIA & Johnson NE (1993a). Spectralsensitivities of the human cones. J Opt Soc Am A 10,2491–2521.
Stockman A, MacLeod DIA & Vivien JA (1993b). Isolation ofthe middle- and long-wavelength sensitive cones in normaltrichromats. J Opt Soc Am A 10, 2471–2490.
Stockman A, Montag ED & MacLeod DIA (1991b). Largechanges in phase delay on intense bleaching backgrounds.Invest Ophthalmol Vis Sci (suppl.) 32, 841.
Stockman A & Plummer DJ (1994). The luminance channel canbe opponent? Invest Ophthalmol Vis Sci (suppl.) 35, 1572.
Stockman A & Plummer DJ (2005c). Spectrally-opponentinputs to the human luminance pathway: slow +L and –Mcone inputs revealed by low to moderate long-wavelengthadaptation. J Physiol 566, 77–91.
Stockman A & Sharpe LT (2000). Spectral sensitivities of themiddle- and long-wavelength sensitive cones derived frommeasurements in observers of known genotype. Vision Res40, 1711–1737.
Stromeyer CF III, Chaparro A, Tolias AS & Kronauer RE(1997). Colour adaptation modifies the long-wave versusmiddle-wave cone weights and temporal phases in humanluminance (but not red–green) mechanism. J Physiol 499,227–254.
Stromeyer CF III, Cole GR & Kronauer RE (1985). Second-siteadaptation in the red-green chromatic pathways. Vision Res25, 219–237.
Stromeyer CF III, Gowdy PD, Chaparro A, Kladakis S, WillenJD & Kronauer RE (2000). Colour adaptation modifies thetemporal properties of the long- and middle-wave conesignals in the human luminance mechanism. J Physiol 526,177–194.
Stromeyer CF III, Kronauer RE, Ryu A, Chaparro A & Eskew RT(1995). Contributions of human long-wave and middle-wavecones to motion detection. J Physiol 485, 221–243.
Swanson WH, Pokorny J & Smith VC (1987). Effects oftemporal frequency on phase-dependent sensitivity toheterochromatic flicker. J Opt Soc Am A 4, 2266–2273.
von Grunau MW (1977). Lateral interactions and rodintrusions in color flicker. Vision Res 17, 911–916.
Wagner G & Boynton RM (1972). Comparison of fourmethods of heterochromatic photometry. J Opt Soc Am 62,1508–1515.
Walls GL (1955). A branched-pathway schema for the color-vision system and some of the evidence for it.Am J Ophthalmol 39, 8–23.
Walraven PL & Leebeek HJ (1964). Phase shift of sinusoidallyalternating colored stimuli. J Opt Soc Am 54, 78–82.
Acknowledgements
We thank Chong Kim for experimental assistance, and DonaldI. A. MacLeod for helpful comments at the start of thisproject, and Sabine Apitz, Rhea Eskew, Ted Sharpe, and HannahSmithson for comments on the manuscript. This work wassupported previously by NIH grant EY10206 and currently by aWellcome Trust grant, both awarded to A.S.
C© The Physiological Society 2005