Embed Size (px)
Citation preview

Spectral induced polarization in a sandy medium
containing semiconductor materials: study of the
polarization mechanism
F. Abdulsamad, N. Florsch and C. Camerlynck
Preface
The polarization mechanism in mineralized medium is not
completely understood yet.
Diffusion of charge carriers inside the semi-conductor grain or
around it in the electrolyte: which one is determinant?
The basic equation is not valid in mineralized medium:
𝝉 =𝑎2
𝐷(after Gurin et al.2015; Revil et al. 2015)
2
Objectives
3
New experimental study of the polarization phenomena in
mineralized medium (semi-conductors).
New numerical modelling based on Poisson-Nernst-Planck
equations has been applied.
Background
Wong (1979) attributes the polarization observed overmineralized medium to two mechanisms:
1- Redox-active ions at the grain surface.
2- Flow of inactive ion in the solution.
Revil et al. (2015 a, b) attribute the polarization in presence ofsemi-conductor minerals to the diffusion and accumulation ofcharges (electrons and holes) inside the metallic grains (inabsence of redox activity).
Both studies show that the metal grain behaves like isolator atlower frequency.
4
Experiments setup
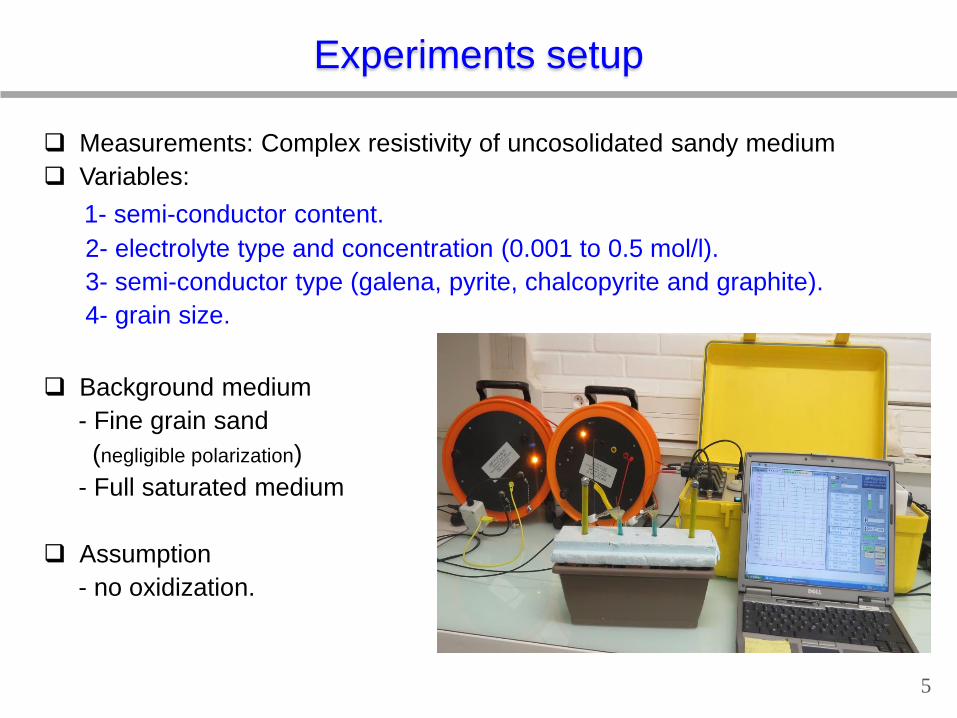
Measurements: Complex resistivity of uncosolidated sandy medium
Variables:
1- semi-conductor content.
2- electrolyte type and concentration (0.001 to 0.5 mol/l).
3- semi-conductor type (galena, pyrite, chalcopyrite and graphite).
4- grain size.
Background medium
- Fine grain sand
(negligible polarization)
- Full saturated medium
Assumption
- no oxidization.
5

Chargeability: 𝑴 =ρ0−ρ∞
ρ0
ρ0 and ρ∞ are amplitude of the complex resistivity at lower and higherfrequency.
6
Calculated parameters
The relaxation time: 𝝉 =1
2π𝑓𝑝𝑒𝑎𝑘
𝑓𝑝𝑒𝑎𝑘 is the critical frequency (the frequency of the phase peak).

7
Example: measurements on Galena of 0.5 mm grain size.
Semi-conductor content
Linear relationship between (𝑴) and the volume content semi-conductor.
Critical frequency
Little increase of semi-
conductor content, results
in a slight decrease in CR
amplitude.
(Mahan et al.1986; Hupfer et
al. 2016).
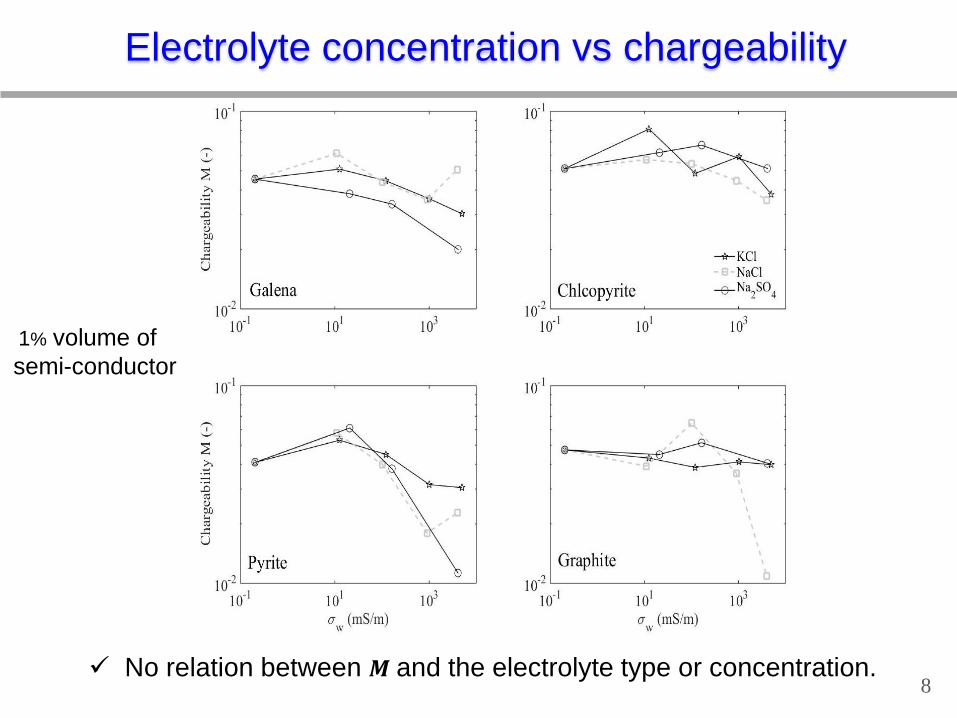
No relation between 𝑴 and the electrolyte type or concentration.8
Electrolyte concentration vs chargeability
1% volume of
semi-conductor
9
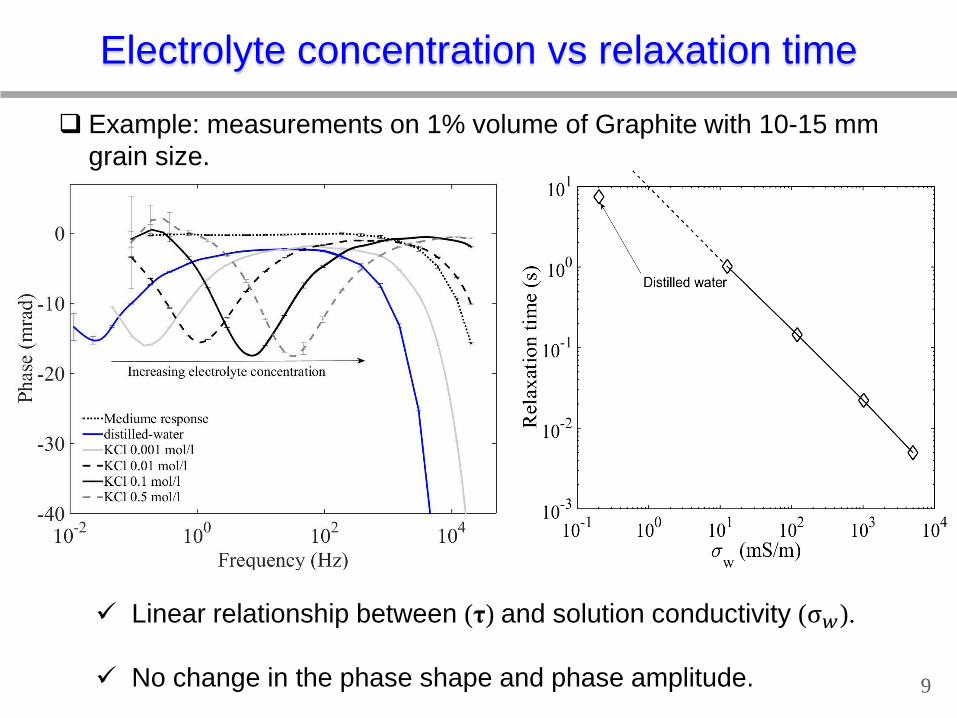
Electrolyte concentration vs relaxation time
Example: measurements on 1% volume of Graphite with 10-15 mm
grain size.
Linear relationship between (τ) and solution conductivity (σ𝑤).
No change in the phase shape and phase amplitude.

The conductivity strongly
impacts the time constant𝝉.
10
Electrolyte type vs mineral type
log10( 𝝉) = −0.8 log10 σ𝑤 + 𝐵
𝐵 is dependent on the grain
size and mineral type.

11
Semi-conductor grain size
σω=53.2 mS/m
Example: measurements on Chalcopyrite with different grain size.
Log – log relationship between (τ) and 𝑎2.
Negligible change of (τ) with mineral type (Galena and Chalcopyrite).
Slope ≅ 2
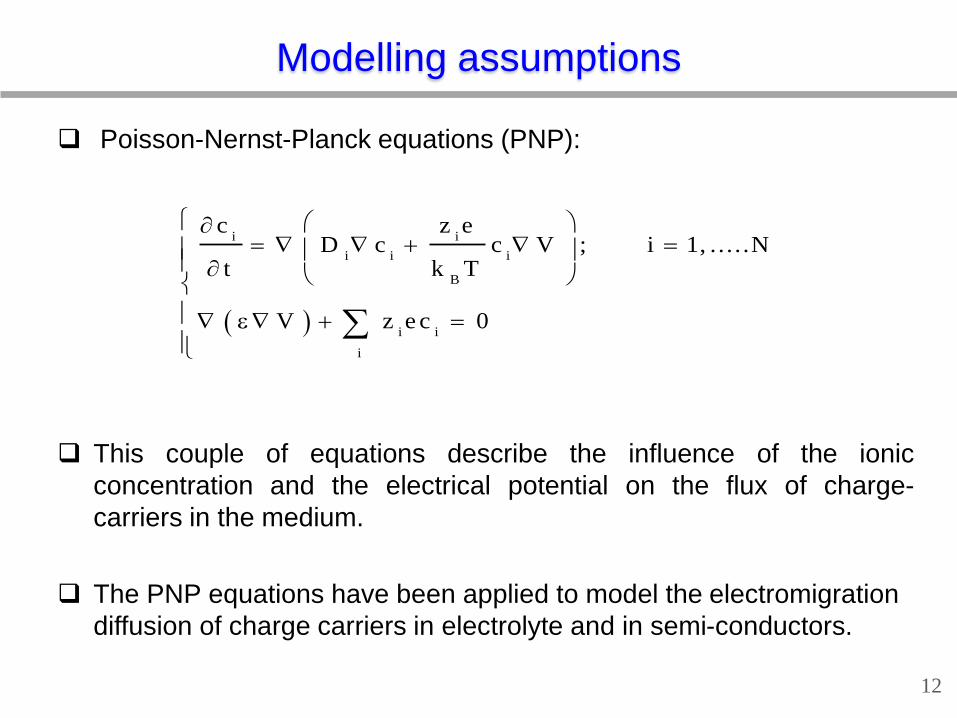
Modelling assumptions
Poisson-Nernst-Planck equations (PNP):
This couple of equations describe the influence of the ionic
concentration and the electrical potential on the flux of charge-
carriers in the medium.
The PNP equations have been applied to model the electromigration
diffusion of charge carriers in electrolyte and in semi-conductors.
12
i i
i i i
B
i i
i
c z eD c c V ; i 1, .. . . .N
t k T
V z e c 0
13
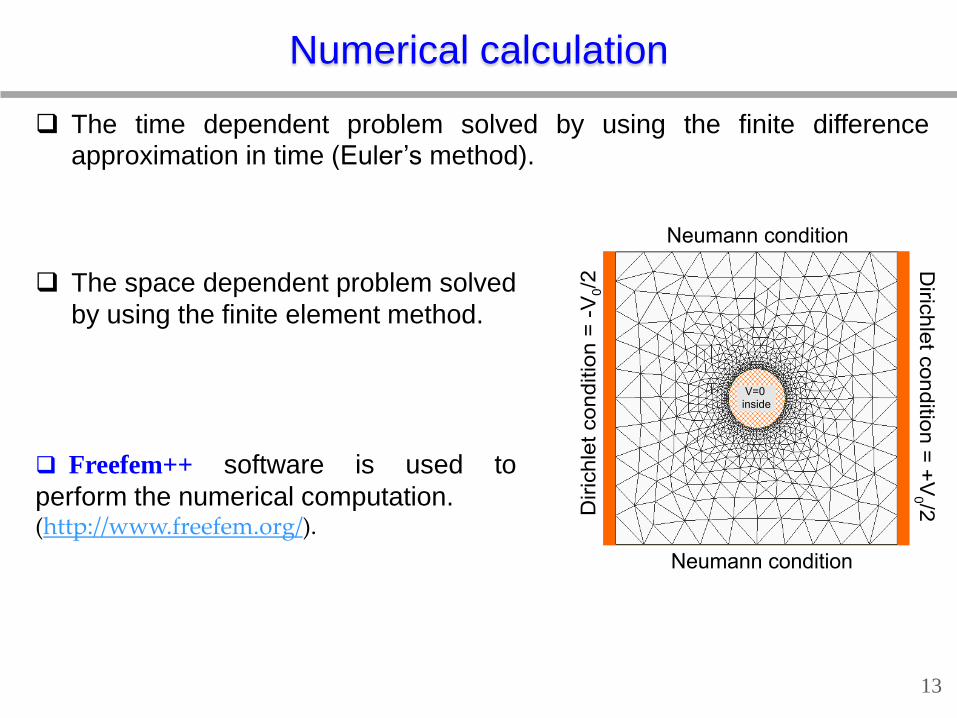
The time dependent problem solved by using the finite differenceapproximation in time (Euler’s method).
Numerical calculation
The space dependent problem solved
by using the finite element method.
Freefem++ software is used to
perform the numerical computation.(http://www.freefem.org/).
Results of numerical calculation
14
Potential (V)
2- After injection:
When the particle at center: its
own potential is zero all time.
(simplification)
Assumptions:
1- Before injection:
Potential is zero everywhere in
medium
Homogeneous ions concentration.
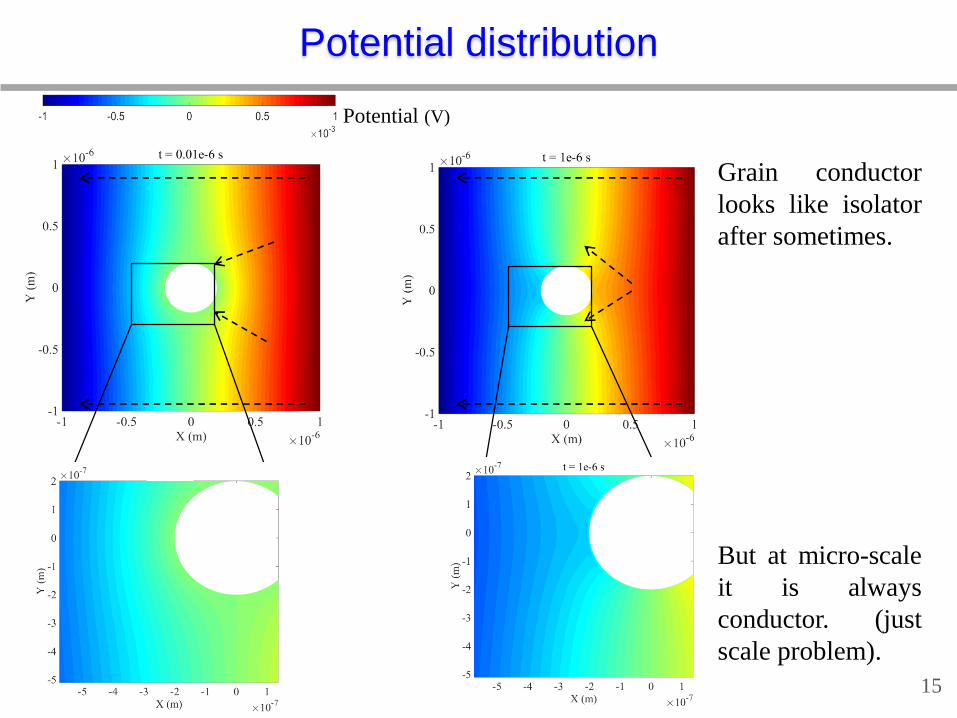
Potential distribution
15
Grain conductor
looks like isolator
after sometimes.
But at micro-scale
it is always
conductor. (just
scale problem).
Potential (V)

16
Changing the concentration-Numerically
The potential difference between M and N
during a cycle of Ton and Toff.
M N
∆V
I (A)
Time (s)
Ton Toff
Toff
The secondary potential (V)
Case of KCl electrolyte.
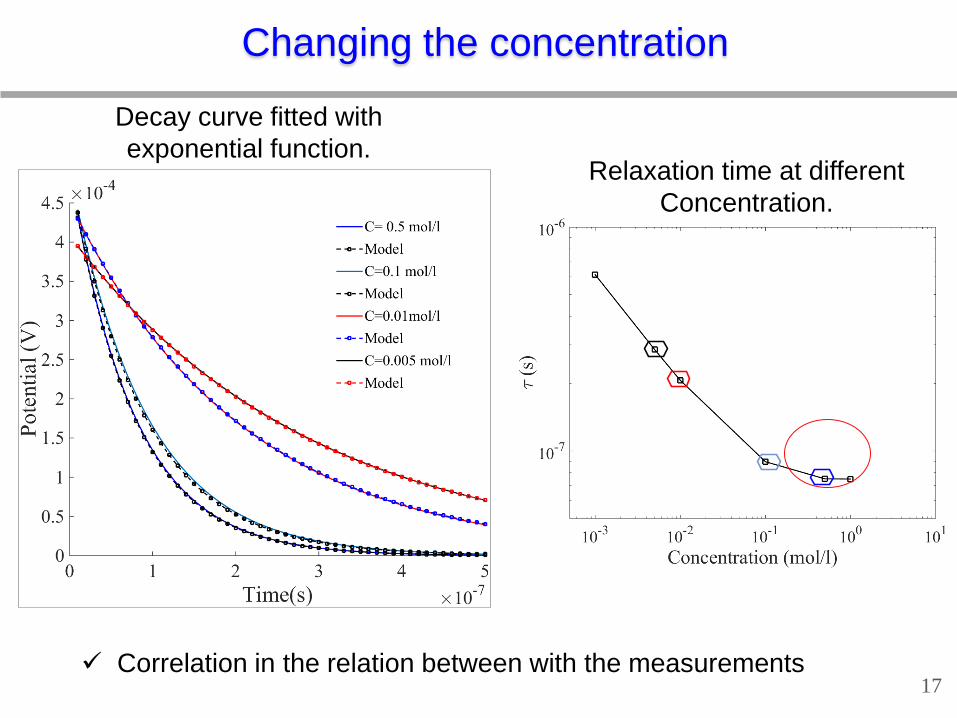
Changing the concentration
17
Decay curve fitted with
exponential function. Relaxation time at different
Concentration.
Correlation in the relation between with the measurements

18
Qualitative Comparison (Numerical vs experimental)
Extracted from real response
Extracted from numerical response
a = 2-3.15 mm.
a = 1 μm.
Difference because of
different grain size.
Measurements and modelling in presence of KCl electrolyte.

Conclusions
𝑴 is a function of the metal volume and independent of theelectrolyte type and concentration.
τ is a function to grain radius, electrolyte conductivity, and slightly tomineral type.
The electric dipole formed inside the semi-conductor induces adiffusion of charge carriers in its vicinity.
At lower frequency the numerical calculation shows that the grainbehaves as isolator.
Numerical calculations is in agreement with experimental resultsand shows a dependence of relaxation time on the electrolyteconcentration.
19

20

21

22

Outlook
Improvement of the numerical model
Make computation in frequency domain.
Managing the FreeFem++ up scaling to reach more realistic
simulation
Managing a semi-empiricale model the same as the model of
realistic parameters.
23


![Spectral Domain Polarization Sensitive Optical Coherence ... · In this context, digital image correlation (DIC) [15] equipment is routinely applied in addition to the (global/overall)](https://img.pdfslide.us/doc/110x75/5f2190e0fdd92518455fff41/spectral-domain-polarization-sensitive-optical-coherence-in-this-context-digital.jpg)