Embed Size (px)
Citation preview
Complete Citation: Sabburg, J. and Parisi, Alfio (2006). Spectral dependency of cloud enhanced UV irradiance. Atmospheric Research, 81, 206-214. ISSN 0169-8095. Accessed from USQ ePrints http://eprints.usq.edu.au
Spectral dependency of cloud enhanced UV irradiance
Sabburg, J.M * and Parisi, A.V
Faculty of Sciences, University of Southern Queensland, Toowoomba, Australia. 4350
*To whom correspondence should be directed. Email: [email protected]
1
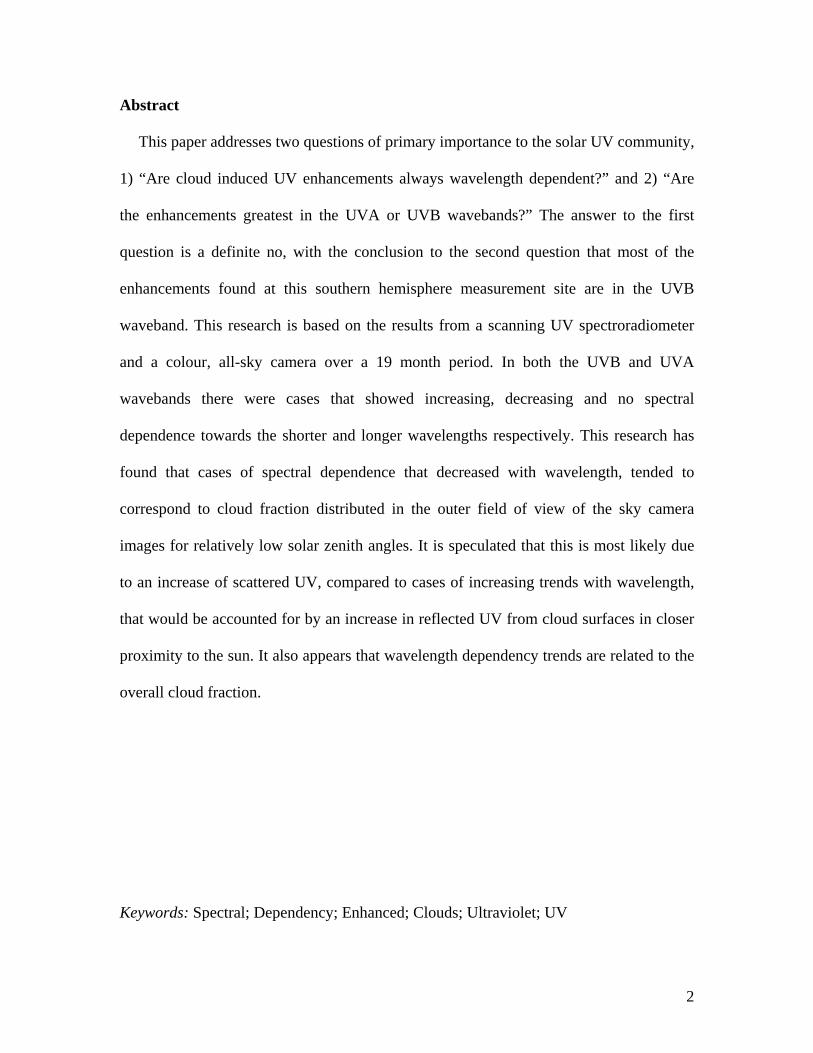
Abstract
This paper addresses two questions of primary importance to the solar UV community,
1) “Are cloud induced UV enhancements always wavelength dependent?” and 2) “Are
the enhancements greatest in the UVA or UVB wavebands?” The answer to the first
question is a definite no, with the conclusion to the second question that most of the
enhancements found at this southern hemisphere measurement site are in the UVB
waveband. This research is based on the results from a scanning UV spectroradiometer
and a colour, all-sky camera over a 19 month period. In both the UVB and UVA
wavebands there were cases that showed increasing, decreasing and no spectral
dependence towards the shorter and longer wavelengths respectively. This research has
found that cases of spectral dependence that decreased with wavelength, tended to
correspond to cloud fraction distributed in the outer field of view of the sky camera
images for relatively low solar zenith angles. It is speculated that this is most likely due
to an increase of scattered UV, compared to cases of increasing trends with wavelength,
that would be accounted for by an increase in reflected UV from cloud surfaces in closer
proximity to the sun. It also appears that wavelength dependency trends are related to the
overall cloud fraction.
Keywords: Spectral; Dependency; Enhanced; Clouds; Ultraviolet; UV
2
1. Introduction
It has previously been reported, and subsequently reviewed by Parisi et al (2004), that
certain configurations of cloud can cause an increase in the ultraviolet (UV) radiation
reaching the earth’s surface, with respect to an equivalent clear sky scenario (e.g. Bener,
1964; McCormick and Suehrcke, 1990; Mims and Frederick, 1994; Sabburg and Wong,
2000; Sabburg et al., 2001). These reports of UV enhancement due to cloud have been
measured in both the UVA (320-400 nm) and UVB (280-320 nm) wavebands.
Additionally, the spectral dependency of UV due to cloud, and to some extent cloud
enhanced UV, have also been published (e.g. Bais et al., 1993; Seckmeyer et al., 1996;
Schwander et al., 2002; Crawford et al., 2003). The reported extent of UV spectral
dependency varies, with earlier papers concluding that the scattering of UV radiation by
clouds is essentially wavelength independent. Later papers (e.g. Crawford et al., 2003),
present both wavelength independent and wavelength dependent (decreasing ‘trend’)
cases, as well as examples of UV enhancement showing an increasing trend with
wavelength. The spectral data was presented mainly in the UVA waveband, with some
evidence of a continuing trend in the UVB.
There are currently only three published papers specifically relating to the issues of
spectral UV enhancement and their wavelength dependency due to cloud (Sabburg et al.,
2003, Sabburg and Long, 2004 and Lovengreen et al., 2005). The first two papers discuss
preliminary data (collected from two different spectral UV instruments) and posed
questions relating to the importance of quality assurance, QA, in relation to measurement
methodology, which this current paper partly addresses. The third paper presents data
from a multichannel radiometer, effectively a compromise between using broadband
3
radiometers (e.g. Sabburg and Wong, 2000) and scanning spectral radiometers (e.g.
Sabburg et al., 2003). There remains two questions of primary importance to be
investigated in this current research, 1) “Are cloud induced UV enhancements always
wavelength dependent?” and 2) “Are the enhancements greatest in the UVA or UVB
wavebands?”
2. Instrumentation
The measurement site for this research was located at the campus of the University of
Southern Queensland (USQ), Toowoomba, Australia (27.5°S, 151.9°E, 693 m altitude).
The radiation and environmental monitoring equipment were located atop a 4-storey
building with no surrounding hills or trees affecting the field of view (FOV). This site has
a relatively unpolluted atmosphere (Parisi and Downs, 2004).
2.1 Spectral Instrument
The solar UV spectrum was recorded from 280 to 400 nm in 0.5 nm increments with a
scanning UV spectroradiometer (Bentham Instruments, Reading, UK) based on a double
grating monochromator (model DTMc300F) with 2400 lines/mm gratings. This
instrument is described in Parisi and Downs (2004). Briefly, it is installed in a container
that is weather proof and temperature stabilised (for most of the year). On each day, the
spectroradiometer automatically starts scanning at 5:00am Australian Eastern Standard
Time (EST), and thereafter every 5 minutes till 7:00pm EST. Each scan takes
approximately one minute to initialise and two minutes to complete the scan.
Irradiance and wavelength calibrations were undertaken on 17 March 2003, 10
December 2003, 11 June 2004 and 17 December 2004. The irradiance calibration was
4
against a 150 W quartz tungsten halogen (QTH) lamp calibrated to the National Physical
Laboratory, UK standard and the wavelength calibration against the UV spectral lines of
a mercury lamp. On a regular basis between these absolute calibrations, the wavelength
calibration was checked and three sets of 150 W QTH lamps were employed to check the
irradiance stability. A temporal and temperature correction was required to be applied to
the data between 11 June 2004 and 17 December 2004, with no correction required
between the other times of the absolute calibrations. After applying the temporal
correction, the uncertainty of the spectral UV data was of the order of ±7% (not including
±3% uncertainty in the traceability of the calibration lamp to the UK standard).
2.2 All-Sky Imager and Photodiode
The sky imager and algorithms have been fully described elsewhere (Sabburg and
Long, 2004). In summary, the sky imager (Yankee Environmental Systems, YES, TSI-
440) was geometrically aligned with the sun so that a shadow band prevented reflection
of the sun directly into the digital camera lens. The sky imager was used to capture sky
images (160° FOV), automatically every 5 min of daylight, to coincide with the
beginning of each spectral scan of the Bentham (described in the last section).
Subsequently, digital image processing produced the following parameters which were
later used to quantify the sky dome during enhanced UV scans: cloud fraction, cloud
uniformity, cloud proximity to the sun and solar obstruction by cloud. The performance
of these algorithms has been reported as better than ±76% (Sabburg and Long, 2004),
±76% and ±85% (Long et al., 2005), for cloud fraction, uniformity and obstruction,
respectively (not corrected for sun circle or horizon area).
5
On visual inspection of 788 of the images mentioned in the results section below
(where approximately 6 scans were chosen throughout each day), 23% agreement was
found for a difference in the cloud fraction (less than or equal to 10%) in the 30° FOV
determined by the cloud proximity algorithm and the visual inspection. For cases where
this algorithm exceeded the visual inspection by more than 10% (49% of the images), it
was found to be due to the “whitening / blooming effects”, as described by Long et al.
(2005). For cases where the visual inspections exceeded the algorithm by more than 10%
(28% of the images), it was found to be due to the misdetection of cirrus cloud fraction.
Based on these findings it was decided to perform parallel visual inspections of the
images when required.
To overcome previous QA issues, relating to the uncertainty of the sky dome changing
significantly during the scanning of the UV spectrum by the spectral instrument (Sabburg
and Long, 2004), a photodiode circuit was constructed and the skyward looking
photodiode was positioned in the vicinity of the Bentham and all-sky imager. The circuit
was based on a ‘555’ timer chip and an 8-bit analogue to digital (A/D) converter. A
BASIC program captured the photodiode data (continuously) and stored 5 digital counts
(each representing approximately 30 sec), representing the sky light during the duration
of the Bentham scans. Digital counts of the incoming sky light (ranging from 0, no
skylight, to 50, bright skylight), were tested to an accuracy of ±2% with known light
levels. Additionally, on the 17th August and 13th October 2004, the photodiode output
was compared to the TSI cloud fraction and solar obstruction algorithms (on the second
day the TSI was set to a 10 sec capture time). Although the photodiode output changed
by approximately 2% during cases of a cloud fraction change of the order of 15% (for
6
clouds near the solar disk with the sun not obstructed), the most notable changes of the
PD output occurred when the sun became obstructed, or unobstructed, by cloud (with
essentially no change in cloud fraction), of the order of 60%. This information was
subsequently used to reject spectral scans from the dataset where the digital light counts
changed by more than 1% during the 2.5 min period. This approach, of using a PD,
ensured that the scanning of the UV waveband (280 to 400 nm in 0.5 nm steps), was
‘effectively’ equivalent to 240 discrete wavelengths obtained simultaneously, compared
to only 4 wavelengths in the UV waveband used in the work of Lovengreen et al. (2005),
namely 305, 320, 340 and 380 nm.
3. Results, Analysis and Discussion
The UV and environmental dataset, used in this research, was collected between 30
June 2003 and 25 December 2004 (19 months, 71335 scans). After performing QA on the
dataset and rejecting scans where the photodiode indicated that the sky dome conditions
had changed, approximately 10% of these scans were available for further analysis.
To address the first of the two questions of primary importance, “Are cloud induced
UV enhancements always wavelength dependent?” it was necessary to decide how cases
of UV enhancement would be chosen. As the health community is the primary
beneficiary of this environmental information, it was decided to focus attention on
erythemal UV (UV in the range of 280 to 400 nm, weighted by the erythemal action
spectrum (CIE, 1987), specifically the UV index, UVI (WMO, 1994). In other words
only the wavelength dependency of scans that were selected as UVI enhanced were
considered. To select these cases of UVI enhancements the method of Sabburg and Long
7
(2004) was chosen (i.e. establishing a clear sky ‘envelope’ or clear sky UVI versus solar
zenith angle, SZA, relationship), with the modification that Total Ozone Mapping
Spectrometer (TOMS) ozone data (valid for around 11:15am local time), was used to
further categorise the clear sky data into three groups (see below). The TOMS web site
states that the latitude dependent error in the data is zero near the equator and -2% to -4%
at 50 degrees latitude. The latitude of the current research is 27.5o and so this error is
expected to be half this amount. Finally, TOMS aerosol index (AI) data (ranging from -
0.48 to 0.9) was used to select the cases of the ‘cleanest’ (i.e. least aerosol load), clear sky
scans (while retaining a statistically significant number of data points for each group),
which were finally used to produce the following relatively clean, clear sky envelopes
valid for the SZA range of 26 to 70°, with an r2 of 0.98 to 1.00 (based on a cubic
polynomial line-of-best-fit), and an ozone range as indicated:
UVI = -4 x 10⁻⁶ SZA3 + 0.0036 SZA2 - 0.6157 SZA + 27.947 (225 to 255 DU)
UVI = 8 x 10⁻⁵ SZA3 - 0.0093 SZA2 + 0.1027 SZA + 13.91 (256 to 285 DU)
UVI = 9 x 10⁻⁵ SZA3 - 0.0111 SZA2 + 0.2334 SZA + 9.9666 (286 to 345 DU)
The maximum scatter of the data points, centred on the above relationships, was found
to be less than ±13%. To ensure that UV enhancements were genuine, and not selected
due to either the uncertainty of the Bentham (±7%) or the uncertainty of the clear sky
envelopes (±13%), only scans for which the UVI on cloudy days exceeded the
corresponding clear sky value by 20% (i.e. 7 + 13%), were chosen. Initially this resulted
in 121 scans, but was reduced to 91 scans (with enhancements ranging from 20 to 30%),
8
over the SZA range of 24 to 70°, after further manual QA was undertaken (e.g. 30 scans
did not correspond to actual cloudy skies, but rather due to “whitening / blooming
effects”).
Table 1 summarises the environmental parameters of cloud fraction (percentage of
total 160° FOV, calculated by the standard YES algorithm); cloud uniformity (1 if cloud
fraction in the four quadrants of the image were within 20% of the total image cloud
fraction, otherwise, 0); cloud proximity to the sun (percentage of cloud in each of four
regions: approximately 0 to 30°, 30 to 60°, 60 to 80°, and 80 to 160° FOV, about the
solar position within the image) and finally solar obstruction by cloud (1 if cloud blocked
the solar disk, else 0, as determined by the standard YES algorithm), for these 91 cases of
genuine UVI enhancement. On examination of these cases it was found that on the 10th
December 2003, there were 6 cases of continuous UVI enhancement lasting from 1:30 to
1:55pm and a further 5 continual cases lasting from 2:45 to 3:05pm.
Next, for each of the above cases of UVI enhancements, the characteristics of the ratio
of each spectrum, to the closest, corresponding, clear sky spectrum (based on differences
of ozone amount, < 25 DU, and SZA, < 2°), were examined, resulting in 56 spectral
ratios. The cut-off wavelength of each spectrum was chosen when the UV irradiance was
less than 5 mWm-2nm-1. This avoided inaccurate ratios due to the low photon counts for
wavelengths less than the cut-off of the respective spectra. During the testing phase of the
above methodology, and by examining the ratio of a number of similar SZA clear-sky,
clean scans with those of corresponding model scans (obtained from
http://www.acd.ucar.edu/Science/Models/TUV/Interactive_TUV/), it was found that the
Bentham produced some scatter in the 0.5 nm UV spectral ratio. This indicates the
9
possibility that there was a wavelength resolution problem with the Bentham, for at least
some of the time during the data collection period. If the spectra obtained from the
Bentham (and model) were ideal, there would not be any scatter about a ratio of one.
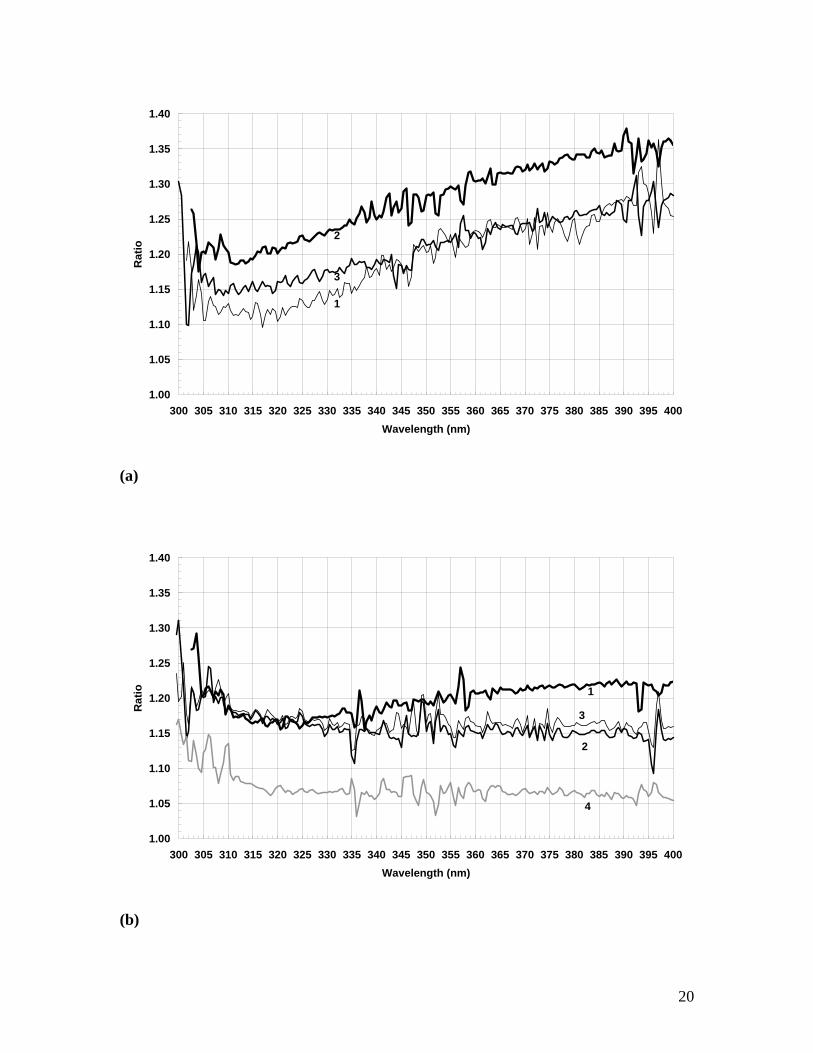
The consequence of this finding was that 10 spectra were found that had small scatter
(r2 > 0.80, for a line-of-best-fit of spectra above 320 nm) (see Figure 1 and Table 2). All
10 spectra had an upward ‘turning’ trend for decreasing wavelengths less than 310 nm,
and as indicated from Table 1, all spectra corresponded to an unobstructed sun. A
summary of these 10, and remaining 46 scans, is presented in Table 3. It was not possible
to determine if the scatter, mentioned above, was due to equipment, atmospheric or both
effects, however, the data does suggest that 64% of the scans were essentially wavelength
independent in the UVB, and 66% in the UVA. Of the remaining scans in the UVB
(36%), if atmospheric effects are assumed, it is not possible to draw any firm conclusions
as to whether the upward or downward trends were due to cloud enhancement or ozone
variation, but the data suggests there are more upward than downward trends. In the
UVA, there are almost an equal number of scan ratios with positive (29) and negative
(27) slopes of the lines-of-best-fit, and it would appear that there are more scans with
downward (negative) trends (11), with increasing wavelength, compared to upward
(positive) trends (8), i.e. slopes greater than ± 0.0005.
Thus, although this data suggests that the majority of UV enhanced spectra are
wavelength independent in the UV (280-400nm), those that are wavelength dependent
tend to have a greater number of increasing trends in the UVB, and decreasing trends in
the UVA, thus suggesting that on average there are more spectra that are UVB enhanced
than UVA enhanced. This suggestion is supported by the average of all 56 UV spectral
10
enhancements (average UVI ratio of 1.16), for each 0.5 nm wavelength, giving an
average of 1.17 for the UVB and 1.14 for the UVA bands respectively.
When the results presented in Table 2 are further examined, it is possible to speculate
some criteria for producing cases of upward and downward sloping spectral ratios. It
appears that cases of upward slopes are more likely for higher SZA and greater cloud
fraction, compared to lower SZA and smaller cloud fraction for downward sloping ratios.
When the images corresponding to the 10 spectra are examined, it is also found that cases
of downward sloping ratios, with increasing wavelength, tend to have their cloud fraction
distributed in the outer FOV of the image, compared to either neutral or upward sloping
ratios (Figure 2). This finding was confirmed when visually examining the other 7
downward sloping ratios of the full 56 scan dataset, and will be further investigated in an
additional publication. Finally, the cloud fraction data presented in the last column of
Table 3 seems to suggest that as the cloud fraction decreases, so does the trend of the
slope of the wavelength dependency (progressing from positive, zero to negative slope).
4. Conclusions
This paper has investigated the spectral dependence of the UV spectra that have been
cloud enhanced above that of the corresponding clear sky case. In the UVB waveband
there were cases that showed increasing, decreasing and no spectral dependence towards
the shorter wavelengths. Similarly, for the UVA waveband there was an increasing,
decreasing and no spectral dependence towards the longer wavelengths. The data showed
that on average there are more spectra that are enhanced in the UVB waveband compared
to the spectra that are enhanced in the UVA waveband. This is supported by the findings
11
from previous broadband data (Sabburg and Wong, 2000), but was not supported from
the work of Lovengreen et al. (2005), reported at another southern hemisphere location.
Spectra that corresponded to an unobstructed sun possessed a spectral dependence below
310 nm that was higher towards the shorter wavelengths. The cases of spectral
dependence that decreased with wavelength tended to have their cloud fraction
distributed in the outer FOV of the image when the SZA was usually low.
Due to differences in methodology (e.g. essentially examining cases of an
unobstructed sun), and to some extent the type of sky camera employed (e.g. some
difficulty in cloud type identification across the solar disk), it was not possible to verify
the postulate for maximum cloud induced UVB enhancement, previously proposed by
Sabburg and Wong (2000) and more recently by Parisi et. al. (2004). It is also worth
noting that Lovengreen et al. (2005) found most of their enhancements when cumuliform
clouds were in their dissipation stage and their cloud fringes were crossing over the solar
disk.
For this current research, it is speculated that the reason for the cloud distribution, in
the outer FOV of the image, causing cases of spectral dependence that decreased with
wavelength, is most likely due to an increase of scattered/diffuse UV (which is greater for
shorter wavelengths), compared to cases of increasing trends with wavelength, that would
be accounted for by an increase in reflected/diffuse UV (equivalent to an increase in
direct UV at the sensor), from cloud surfaces (which is greater for longer wavelengths).
From the cloud fraction data it can be speculated that as the mix of cloud and clear sky
changes (e.g. from mostly cloudy with some blue sky, to some cloud with mostly blue
sky), there is a change in the wavelength dependency of the enhanced scans. This could
12
suggest that the wavelength dependency is not just due to the clouds, but also due to the
surrounding Rayleigh scattering of the clear sky (e.g. an apparent neutral dependency
could result from UV interactions with the right ‘mix and distribution’ of cloud and sky).
13
Acknowledgements
The authors acknowledge USQ research assistants Johanna Turner for data preparation
and solar proximity performance, Nathan Downs for development of the photodiode
circuit, USQ technical staff for general assistance, the ARC for a Discovery Grant
enabling purchase of the Bentham Spectroradiometer, and NASA/Goddard Space Flight
Center for TOMS ozone and aerosol index data.
14
References
Bais, A.F., Zerefos, C.S., Meleti, C., Ziomas, I.C. and Tourpali, K., 1993, Spectral
measurements of solar UVB radiation and its relations to total Ozone, SO2, and
Clouds, J. Geophys. Res., 98(D3), 5199-5204.
Bener, P. 1964, Investigation on the Influence of Clouds on the Ultraviolet Sky radiation,
Contract AF 61(052)-618, Tech. Note 3, Davos-Platz, Switzerland.
CIE (International Commission on Illumination) 1987, A reference action spectrum for
ultraviolet induced erythema in human skin, CIE J. 6, 17-22.
Crawford J., Shetter R.E., Lefer B., Cantrell C., Junkermann W., Madronich S. and
Calvert J., 2003, Cloud impacts on UV spectral actinic flux observed during the
International Photolysis Frequency Measurement and Model Intercomparison
(IPMMI), J. Geophys. Res., 108(D14): Art. No. 8545.
Long, C.N., Sabburg, J.M., Calbó, J., and Pagès, D., 2005, Retrieving cloud
characteristics from ground-based color all-sky images, submitted to JAOT.
Lovengreen, C., Fuenzalida, H. A., and Videla, L., 2005, On the spectral dependency of
UV radiation enhancements due to clouds in Valdivia, Chile (39.8°S), J.
Geophys. Res., 110(D14207), doi:10.1029/2004JD005372.
McCormick, P.G. and Suehrcke, H., 1990, Cloud-reflected radiation, Nature, 345, 773.
Mims(III), F.M. and Frederick, J.E., 1994, Cumulus clouds and UV-B, Nature, 371, 291.
Parisi, A.V. and Downs, N., 2004, Cloud Cover and Eye Damaging UV Exposures, Int. J.
Biomet., doi:10.1007/s00484-004-0213-7.
15
Parisi, A. V., Sabburg, J., and Kimlin, M.J., 2004, Scattered and Filtered Solar UV
Measurements, in the ‘Advances in Global Change Research’ series, Kluwer
Academic Publishers, Dordrecht.
Sabburg, J. and Long, C.N., 2004, Improved sky imaging for studies of enhanced UV
irradiance, Atmos. Chem. Phys., 4, 2543-2552.
Sabburg, J.M., Parisi, A.V. and Kimlin, M.G., 2003, Enhanced spectral UV irradiance: a
1 year preliminary study, Atmos. Res., 66(4), 261-272.
Sabburg, J., Parisi, A.V. and Wong, J., 2001, Effect of cloud on UVA and exposure to
humans, Photochem. Photobiol., 74, 412-416.
Sabburg, J. and Wong, J., 2000, The effect of clouds on enhancing UVB irradiance at the
earth's surface: a one year study, Geophys. Res. Lett., 27 (20), 3337-3340.
Schwander, H., Koepke, P., Kaifel, A. and Seckmeyer, G., 2002, Modification of spectral
UV irradiance by clouds, J. Geophys. Res., 107(D16), 10.1029/2001JD00129727.
Seckmeyer, G., Erb, R. and Albold, A., 1996, Transmittance of a cloud is wavelength
dependent in the UV range, Geophys. Res. Lett., 23(20), 2753-2755.
WMO, 1994, Report of the WMO Meeting of Experts on UV-B Measurements, Data
Quality and Standardization of UV Indices, Les Diablerets, Switzerland, 25-28
July 1994, WMO/TD-NO, 625.
16
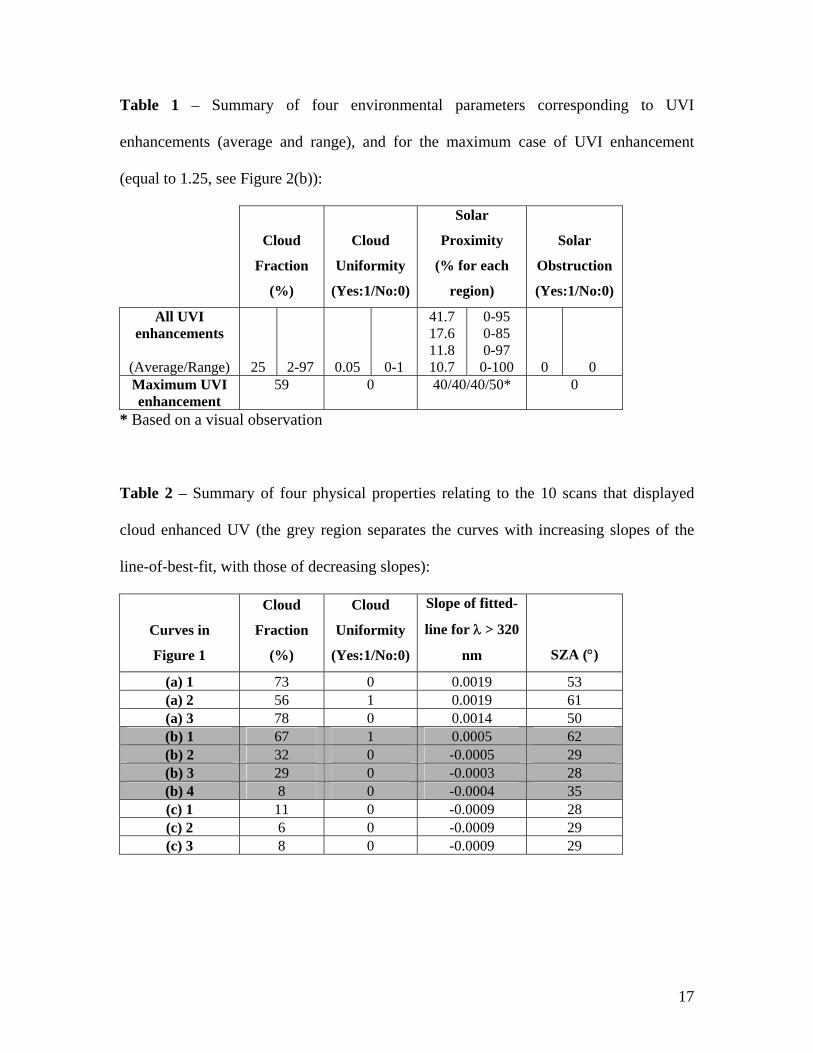
Table 1 – Summary of four environmental parameters corresponding to UVI
enhancements (average and range), and for the maximum case of UVI enhancement
(equal to 1.25, see Figure 2(b)):
Cloud
Fraction
(%)
Cloud
Uniformity
(Yes:1/No:0)
Solar
Proximity
(% for each
region)
Solar
Obstruction
(Yes:1/No:0)
All UVI enhancements
(Average/Range) 25 2-97 0.05 0-1
41.7 17.6 11.8 10.7
0-95 0-85 0-97
0-100 0 0 Maximum UVI enhancement
59 0 40/40/40/50* 0
* Based on a visual observation
Table 2 – Summary of four physical properties relating to the 10 scans that displayed
cloud enhanced UV (the grey region separates the curves with increasing slopes of the
line-of-best-fit, with those of decreasing slopes):
Curves in
Figure 1
Cloud
Fraction
(%)
Cloud
Uniformity
(Yes:1/No:0)
Slope of fitted-
line for λ > 320
nm SZA (°)
(a) 1 73 0 0.0019 53 (a) 2 56 1 0.0019 61 (a) 3 78 0 0.0014 50 (b) 1 67 1 0.0005 62 (b) 2 32 0 -0.0005 29 (b) 3 29 0 -0.0003 28 (b) 4 8 0 -0.0004 35 (c) 1 11 0 -0.0009 28 (c) 2 6 0 -0.0009 29 (c) 3 8 0 -0.0009 29
17
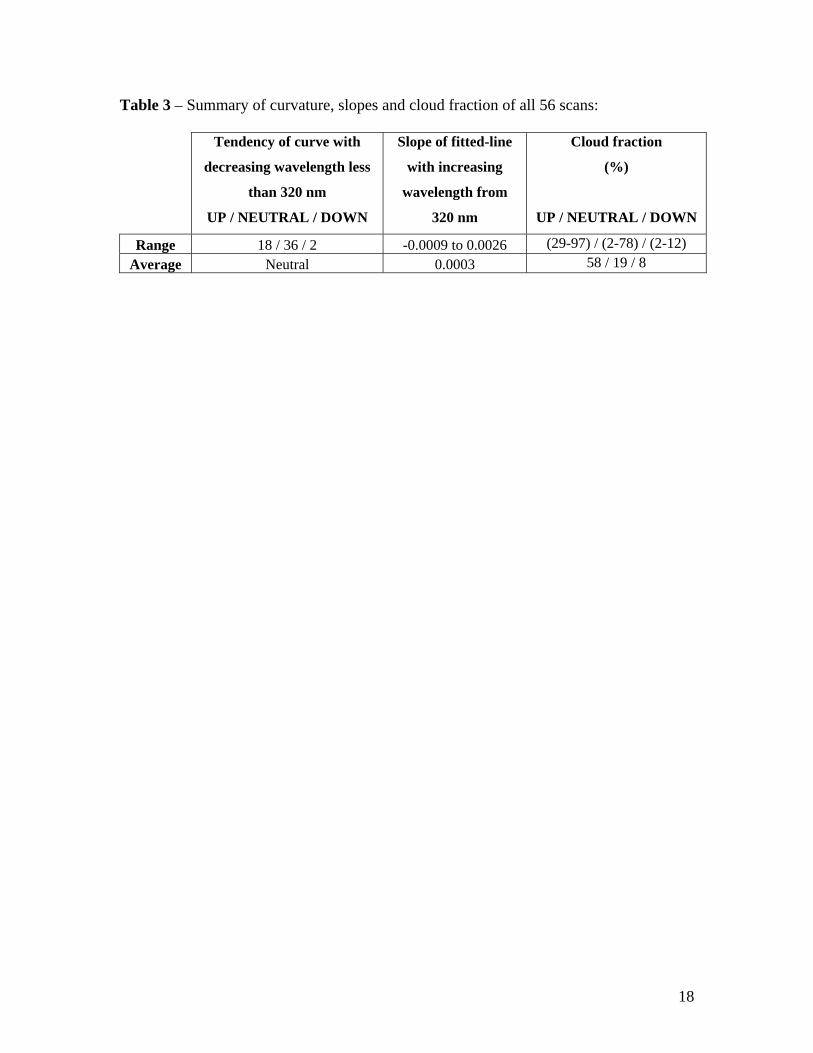
Table 3 – Summary of curvature, slopes and cloud fraction of all 56 scans:
Tendency of curve with
decreasing wavelength less
than 320 nm
UP / NEUTRAL / DOWN
Slope of fitted-line
with increasing
wavelength from
320 nm
Cloud fraction
(%)
UP / NEUTRAL / DOWN
Range 18 / 36 / 2 -0.0009 to 0.0026 (29-97) / (2-78) / (2-12) Average Neutral 0.0003 58 / 19 / 8
18
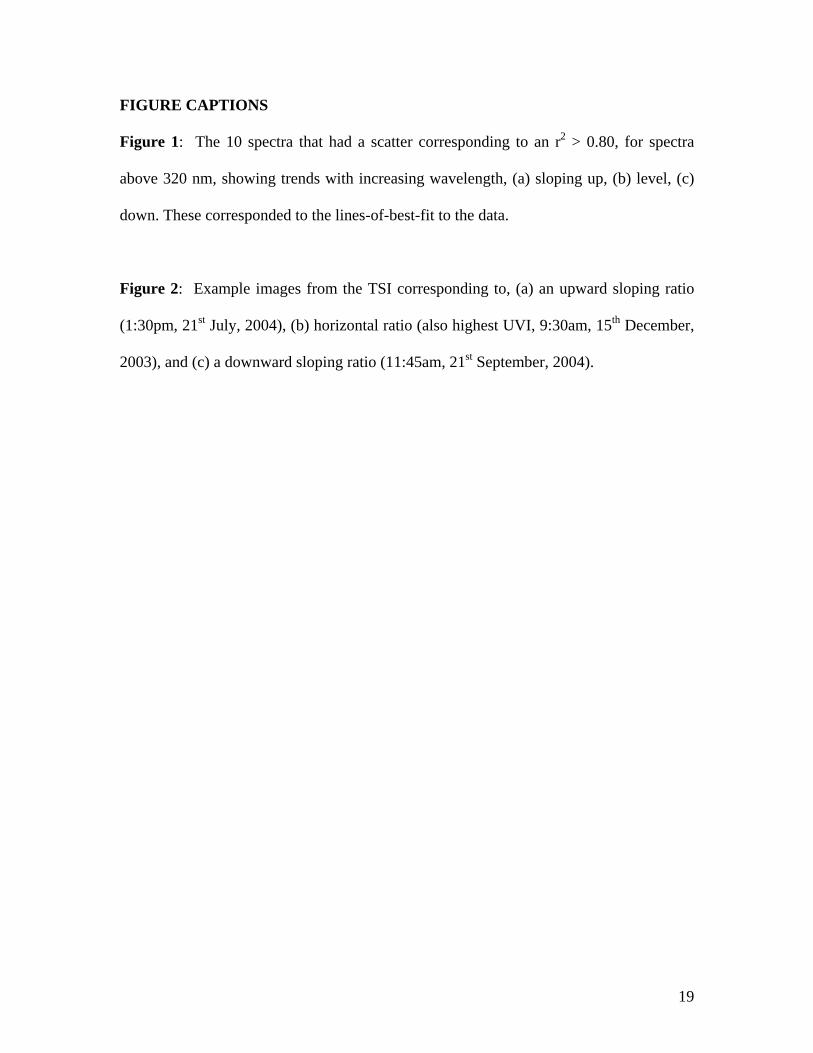
FIGURE CAPTIONS
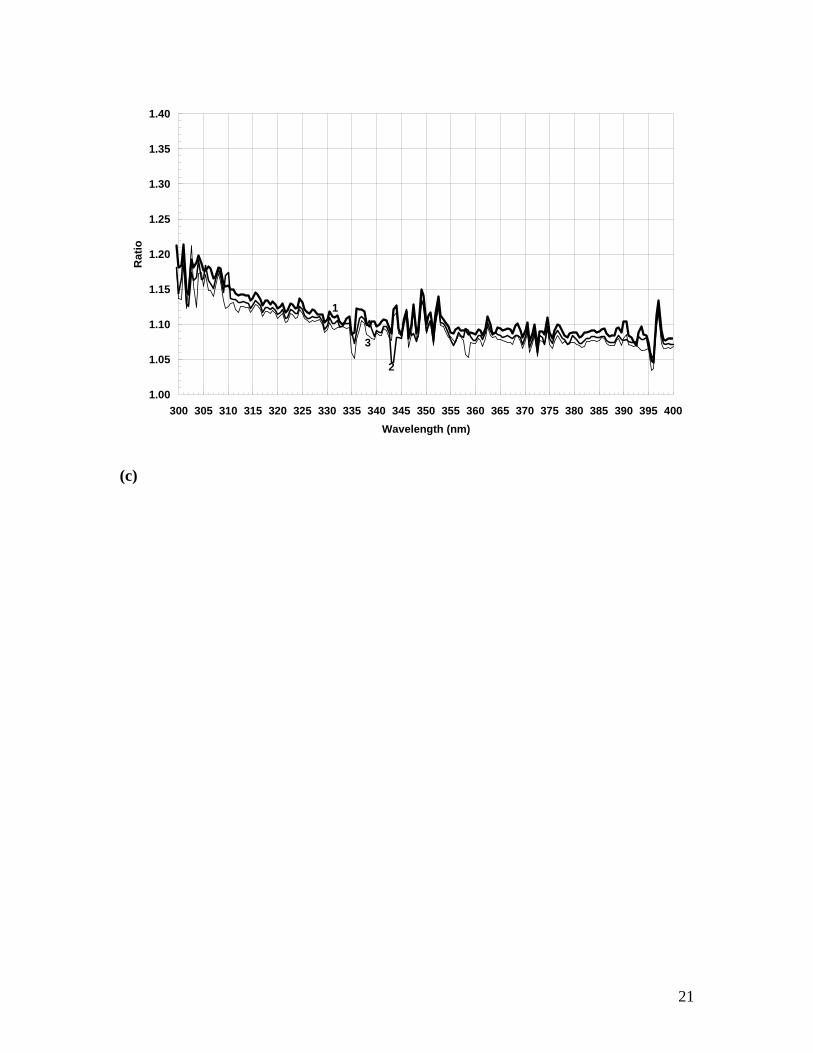
Figure 1: The 10 spectra that had a scatter corresponding to an r2 > 0.80, for spectra
above 320 nm, showing trends with increasing wavelength, (a) sloping up, (b) level, (c)
down. These corresponded to the lines-of-best-fit to the data.
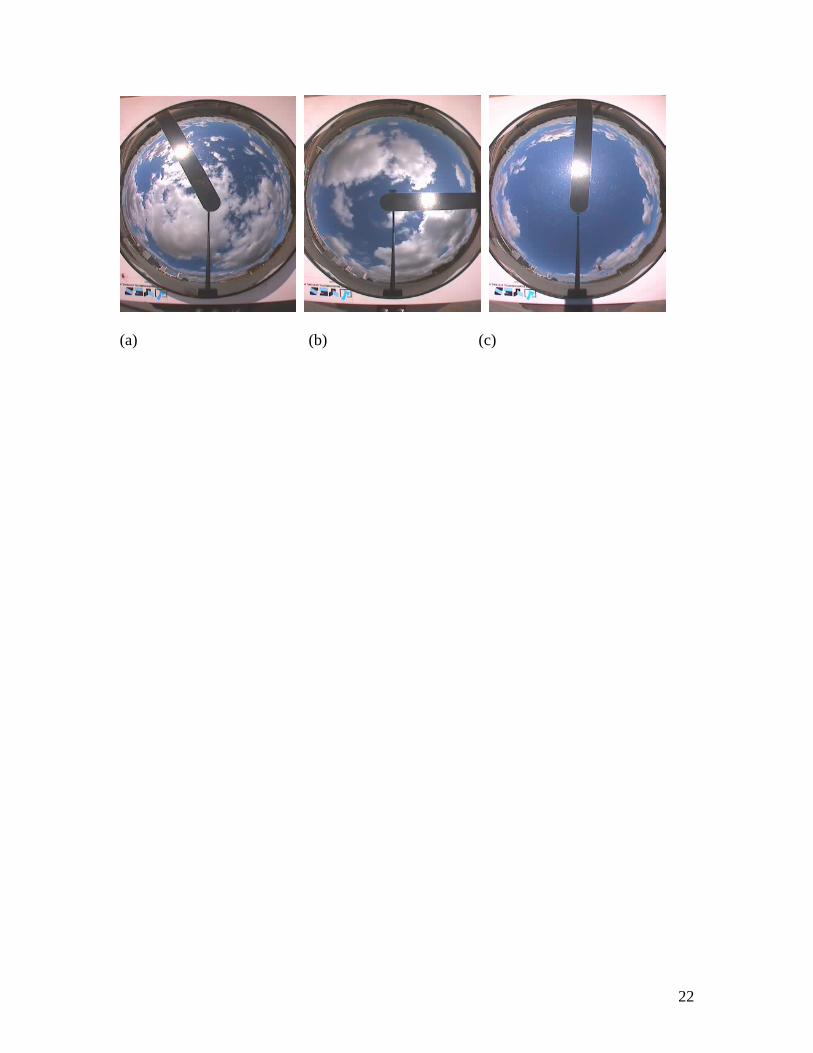
Figure 2: Example images from the TSI corresponding to, (a) an upward sloping ratio
(1:30pm, 21st July, 2004), (b) horizontal ratio (also highest UVI, 9:30am, 15th December,
2003), and (c) a downward sloping ratio (11:45am, 21st September, 2004).
19
1.00
1.05
1.10
1.15
1.20
1.25
1.30
1.35
1.40
300 305 310 315 320 325 330 335 340 345 350 355 360 365 370 375 380 385 390 395 400Wavelength (nm)
Rat
io
2
3
1
(a)
1.00
1.05
1.10
1.15
1.20
1.25
1.30
1.35
1.40
300 305 310 315 320 325 330 335 340 345 350 355 360 365 370 375 380 385 390 395 400Wavelength (nm)
Rat
io 1
2
4
3
(b)
20
1.00
1.05
1.10
1.15
1.20
1.25
1.30
1.35
1.40
300 305 310 315 320 325 330 335 340 345 350 355 360 365 370 375 380 385 390 395 400Wavelength (nm)
Rat
io
2
3
1
(c)
21
(a) (b) (c)
22