Embed Size (px)
Citation preview
This content has been downloaded from IOPscience. Please scroll down to see the full text.
Download details:
IP Address: 131.169.139.235
This content was downloaded on 22/10/2014 at 10:07
Please note that terms and conditions apply.
Spectral CT data acquisition with Medipix3.1
View the table of contents for this issue, or go to the journal homepage for more
2013 JINST 8 P10012
(http://iopscience.iop.org/1748-0221/8/10/P10012)
Home Search Collections Journals About Contact us My IOPscience
2013 JINST 8 P10012
PUBLISHED BY IOP PUBLISHING FOR SISSA MEDIALAB
RECEIVED: August 12, 2013REVISED: September 9, 2013
ACCEPTED: September 15, 2013PUBLISHED: October 11, 2013
Spectral CT data acquisition with Medipix3.1
M.F. Walsh,a,1 S.J. Nik,b S. Procz,c M. Pichotka,c S.T. Bell,d C.J. Bateman,a
R.M.N. Doesburg,b N. De Ruiter,a A.I. Chernoglazov,e R.K. Panta,a A.P.H. Butlera,d,e, f
and P.H. Butlerb,d, f
aCentre for Bioengineering & Nanomedicine, University of Otago Christchurch,2 Riccarton Ave, Christchurch, New Zealand
bDepartment of Physics and Astronomy, University of Canterbury,Private Bag 4800, Christchurch 8140, New Zealand
cFreiburger Materialforschungszentrum FMF, Albert-Ludwigs-Universitat Freiburg,Freiburg, Germany
dMARS BioImaging Ltd,29a Clyde Rd, Christchurch, New Zealand
eHITLabNZ, University of Canterbury,Private Bag 4800, Christchurch, New Zealand
f Organisation Europeenne pour la Recherche Nucleaire (CERN),Geneva, Switzerland
E-mail: [email protected]
ABSTRACT: This paper describes the acquisition of spectral CT imagesusing the Medipix3.1 inspectroscopic mode, in which the chip combines 2×2 pixel clusters to increase the number of en-ergy thresholds and counters from 2 to 8. During preliminarymeasurements, it was observed thatthe temperature, DAC and equalisation stability of the Medipix3.1 outperformed the Medipix3.0,while maintaining similar imaging quality. In this paper, the Medipix3.1 chips were assembled in aquad (2×2) layout, with the four ASICs bump-bonded to a silicon semiconductor doped as an np-junction diode. To demonstrate the biological imaging quality that is possible with the Medipix3.1,an image of a mouse injected with gold nano-particle contrast agent was obtained. CT acquisitionin spectroscopic mode was enabled and examined by imaging a customised phantom containingmultiple contrast agents and biological materials. These acquisitions showed a limitation of imag-ing performance depending on the counter used. Despite this, identification of multiple materials inthe phantom was demonstrated using an in-house material decomposition algorithm. Furthermore,gold nano-particles were separated from biological tissues and bones within the mouse by meansof image rendering.
KEYWORDS: Computerized Tomography (CT) and Computed Radiography (CR); Data acquisitionconcepts
1Corresponding author.
c© CERN 2013, published under the terms of theCreative Commons Attribution 3.0Licenseby IOP Publishing Ltd and Sissa Medialab srl. Any further distribution of this
work must maintain attribution to the author(s) and the published article’s title, journal citation and DOI.doi:10.1088/1748-0221/8/10/P10012
2013 JINST 8 P10012
Contents
1 Introduction 1
2 Materials and methods 3
3 Results 43.1 Gold nano-particles in the kidney of a mouse 43.2 Spectral phantom 5
4 Discussion and conclusions 8
1 Introduction
Spectral CT is a developing field of research. One of the key features of spectral CT is to providematerial separation of CT images by analysing the energy information of transmitted photons. Byutilising K-edges and other characteristic information inthe absorption spectra, materials can beidentified and quantitatively analysed. Some of the applications of spectral CT include: vascu-lar imaging [1], atherosclerotic plaque identification [2], quantitative soft tissue imaging [3] andseparating barium from iodine [4].
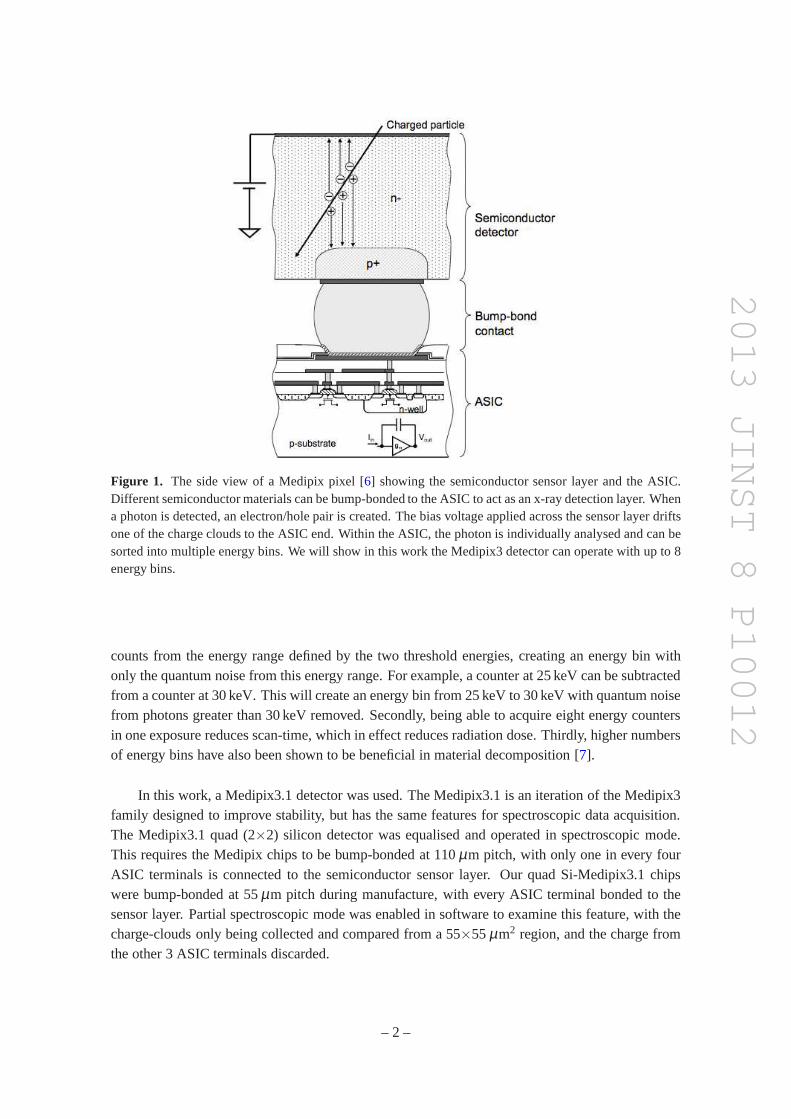
To enable spectral CT, an energy-resolving detector is required. One example of these de-tectors is the Medipix detector. The Medipix family of detectors are a series of hybrid photoncounting detectors that use a semiconductor sensor layer todirectly convert x-ray photons into anelectrical signal (See figure1). When a photon is detected, an electron-hole pair is created whichfurther ionises a charge cloud of electron-hole pairs. A high voltage bias across the sensor drivesthis charge cloud to the pixel terminal in the Application Specific Integrated Circuit (ASIC). Thisinduces an electrical signal with a pulse height proportional to the energy deposited by the pho-ton interaction event. Within the Medipix ASIC, the pulse created by the photon detection eventis individually analysed. Only photons higher than a presetthreshold are recorded by the photoncounter. By using multiple thresholds, Medipix detectors can sort photons into user-programmableenergy bins. The Medipix3 [5] is the newest generation of Medipix detector. The conventionaloperation of the chip is in fine pitch mode (FPM) with 256×256 pixels at 55µm pitch, with eachpixel containing two energy counters. When operated in spectroscopic mode, the Medipix3 detec-tors are capable of inter-pixel communication. This allowsfor 128×128 pixel clusters at 110µmpitch, with each cluster combining a 2×2 pixels to provide eight energy counters.
Spectroscopic mode is important for spectral CT in several ways. Firstly, it increases signalquality. In the Medipix detector, a counter records photonswith energy ranging from a definedenergy threshold to the maximum energy of the x-ray source. Since all eight counters receive andprocess voltage pulses from the same photon events in spectroscopic mode, the quantum noiseacross shared energy ranges is identical. Two counters may be subtracted to obtain the photon
– 1 –
2013 JINST 8 P10012
Figure 1. The side view of a Medipix pixel [6] showing the semiconductor sensor layer and the ASIC.Different semiconductor materials can be bump-bonded to the ASIC to act as an x-ray detection layer. Whena photon is detected, an electron/hole pair is created. The bias voltage applied across the sensor layer driftsone of the charge clouds to the ASIC end. Within the ASIC, the photon is individually analysed and can besorted into multiple energy bins. We will show in this work the Medipix3 detector can operate with up to 8energy bins.
counts from the energy range defined by the two threshold energies, creating an energy bin withonly the quantum noise from this energy range. For example, acounter at 25 keV can be subtractedfrom a counter at 30 keV. This will create an energy bin from 25keV to 30 keV with quantum noisefrom photons greater than 30 keV removed. Secondly, being able to acquire eight energy countersin one exposure reduces scan-time, which in effect reduces radiation dose. Thirdly, higher numbersof energy bins have also been shown to be beneficial in material decomposition [7].
In this work, a Medipix3.1 detector was used. The Medipix3.1is an iteration of the Medipix3family designed to improve stability, but has the same features for spectroscopic data acquisition.The Medipix3.1 quad (2×2) silicon detector was equalised and operated in spectroscopic mode.This requires the Medipix chips to be bump-bonded at 110µm pitch, with only one in every fourASIC terminals is connected to the semiconductor sensor layer. Our quad Si-Medipix3.1 chipswere bump-bonded at 55µm pitch during manufacture, with every ASIC terminal bondedto thesensor layer. Partial spectroscopic mode was enabled in software to examine this feature, with thecharge-clouds only being collected and compared from a 55×55µm2 region, and the charge fromthe other 3 ASIC terminals discarded.
– 2 –
2013 JINST 8 P10012
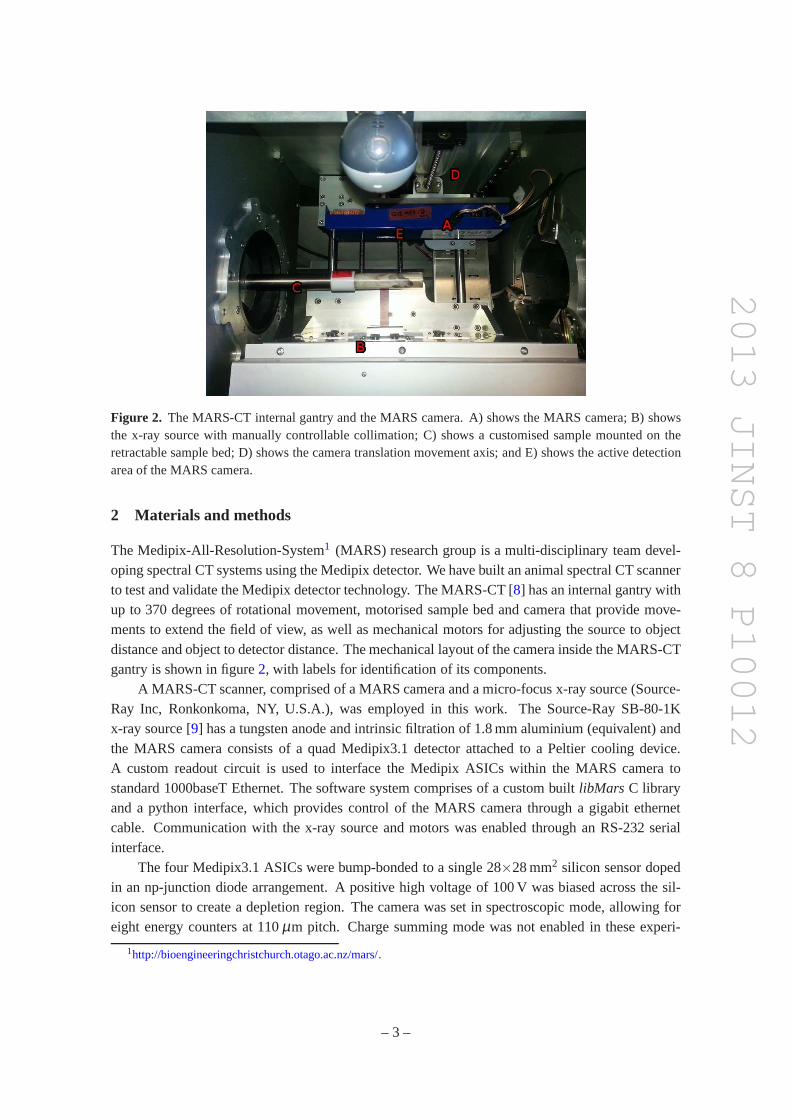
Figure 2. The MARS-CT internal gantry and the MARS camera. A) shows theMARS camera; B) showsthe x-ray source with manually controllable collimation; C) shows a customised sample mounted on theretractable sample bed; D) shows the camera translation movement axis; and E) shows the active detectionarea of the MARS camera.
2 Materials and methods
The Medipix-All-Resolution-System1 (MARS) research group is a multi-disciplinary team devel-oping spectral CT systems using the Medipix detector. We have built an animal spectral CT scannerto test and validate the Medipix detector technology. The MARS-CT [8] has an internal gantry withup to 370 degrees of rotational movement, motorised sample bed and camera that provide move-ments to extend the field of view, as well as mechanical motorsfor adjusting the source to objectdistance and object to detector distance. The mechanical layout of the camera inside the MARS-CTgantry is shown in figure2, with labels for identification of its components.
A MARS-CT scanner, comprised of a MARS camera and a micro-focus x-ray source (Source-Ray Inc, Ronkonkoma, NY, U.S.A.), was employed in this work.The Source-Ray SB-80-1Kx-ray source [9] has a tungsten anode and intrinsic filtration of 1.8 mm aluminium (equivalent) andthe MARS camera consists of a quad Medipix3.1 detector attached to a Peltier cooling device.A custom readout circuit is used to interface the Medipix ASICs within the MARS camera tostandard 1000baseT Ethernet. The software system comprises of a custom builtlibMars C libraryand a python interface, which provides control of the MARS camera through a gigabit ethernetcable. Communication with the x-ray source and motors was enabled through an RS-232 serialinterface.
The four Medipix3.1 ASICs were bump-bonded to a single 28×28 mm2 silicon sensor dopedin an np-junction diode arrangement. A positive high voltage of 100 V was biased across the sil-icon sensor to create a depletion region. The camera was set in spectroscopic mode, allowing foreight energy counters at 110µm pitch. Charge summing mode was not enabled in these experi-
1http://bioengineeringchristchurch.otago.ac.nz/mars/.
– 3 –
2013 JINST 8 P10012
ments. The energy response of all pixels in each chip was calibrated using the MARS thresholdequalisation procedure [10].
To demonstrate the imaging capabilities of the Medipix3.1,two separate spectral CT scanswere obtained. A mouse is presented for the first scan, to allow assessment of performance in a bi-ological imaging application. This mouse had gold nano-particle contrast agent injected and boundto its kidney, and was cast in resin. The second scan is of aspectral phantomcontaining severalelementary solutions at different concentrations. The spectral phantom contains two concentricrings of seven evenly spaced capillaries. The outer ring of capillaries contain calcium chloride,“iodixanol” iodine complex, “Dimeglumine Gadopentetate”gadolinium complex, contrast agentwith gold nano-particles, canola oil (to represent fat), water and air, respectively. The inner ring ofcapillaries were not filled in this measurement.
To measure the mouse and the spectral phantom, the x-ray tubewas set to 50 kVp and 100µA.A series of 720 projections were acquired over 360 degrees toensure sufficient data sampling. Themouse was imaged across the kidneys in FPM and spectroscopicmode. In FPM, the mouse wasonly measured with one counter at 15 keV. Due to the low absorption efficiencies of the siliconsensor layer, the 8 energy thresholds in spectroscopic modewere spread evenly, at intervals of3 keV, up to only 35 keV. The mouse was imaged at thresholds of 15, 18, 20, 23, 26, 29, 32 and35 keV in a single acquisition as a proof-of-concept study for spectroscopic mode.
Images were reconstructed by means of the filtered back projection technique using Octo-pus [11]. Comparisons of image noise at different projection angles can be found in [12]. The15 keV image in spectroscopic mode was colour-coded using a version of ExposureRender [13],which was modified for better interpolation between voxels,to highlight the different materials inthe mouse.
Similarly, for the spectral phantom, eight energy thresholds (15, 17, 19, 21, 23, 25, 27 and29 keV) were measured in a single exposure using the spectroscopic mode. These energy thresholdswere selected arbitrarily low, based on the low energy absorption efficiency of the silicon sensorlayer. The K-edges of iodine (33.17 keV), gadolinium (50.24keV) and gold (80.72 keV) are alloutside the range of energy thresholds, so material decomposition of these elements will be limited.Regardless, an in-house material decomposition algorithmwas applied to the spectral data andan image with materials allocated to colours was created. Inaddition, a simple signal-to-noiseratio assessment was performed to evaluate the performanceof the individual counters upon imagereconstruction using Octopus.
3 Results
3.1 Gold nano-particles in the kidney of a mouse
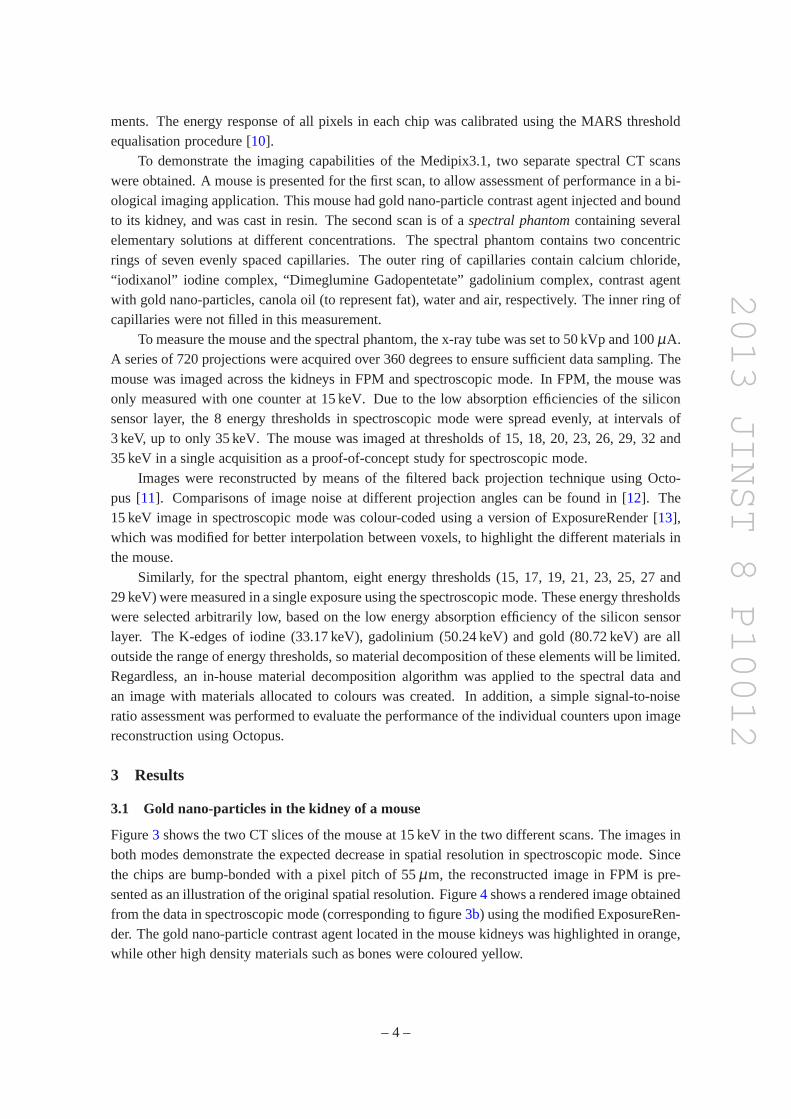
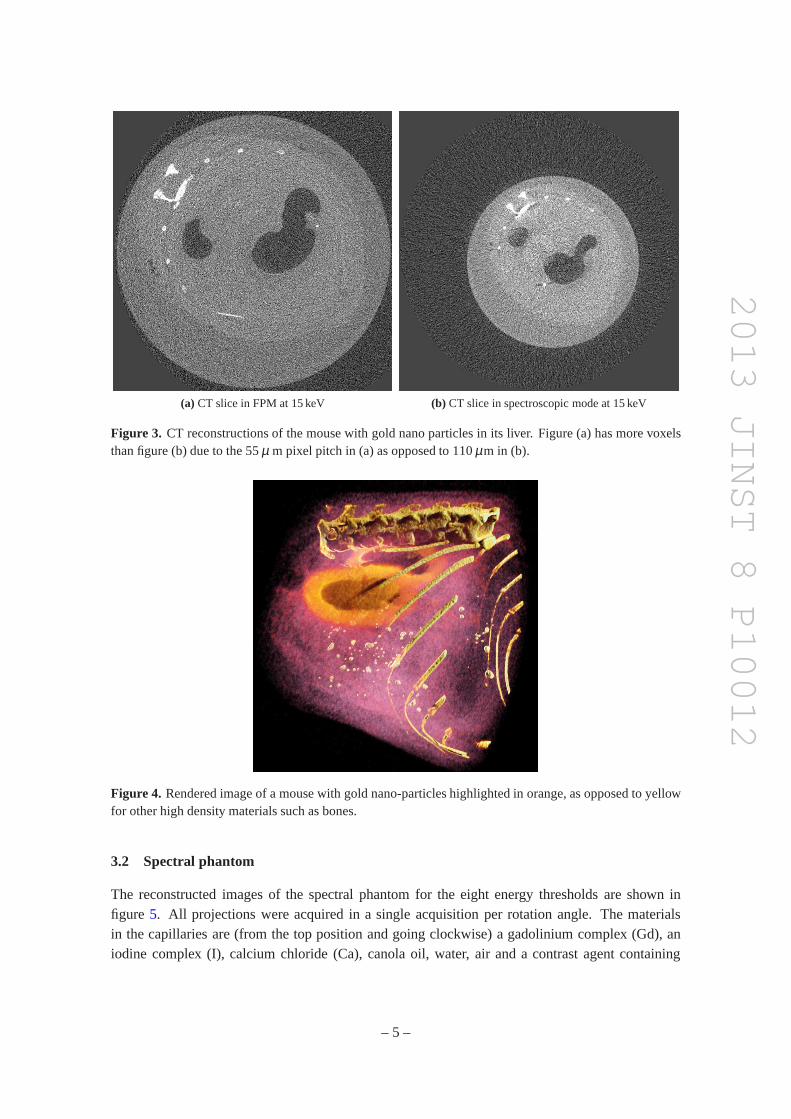
Figure3 shows the two CT slices of the mouse at 15 keV in the two different scans. The images inboth modes demonstrate the expected decrease in spatial resolution in spectroscopic mode. Sincethe chips are bump-bonded with a pixel pitch of 55µm, the reconstructed image in FPM is pre-sented as an illustration of the original spatial resolution. Figure4 shows a rendered image obtainedfrom the data in spectroscopic mode (corresponding to figure3b) using the modified ExposureRen-der. The gold nano-particle contrast agent located in the mouse kidneys was highlighted in orange,while other high density materials such as bones were coloured yellow.
– 4 –
2013 JINST 8 P10012
(a) CT slice in FPM at 15 keV (b) CT slice in spectroscopic mode at 15 keV
Figure 3. CT reconstructions of the mouse with gold nano particles in its liver. Figure (a) has more voxelsthan figure (b) due to the 55µ m pixel pitch in (a) as opposed to 110µm in (b).
Figure 4. Rendered image of a mouse with gold nano-particles highlighted in orange, as opposed to yellowfor other high density materials such as bones.
3.2 Spectral phantom
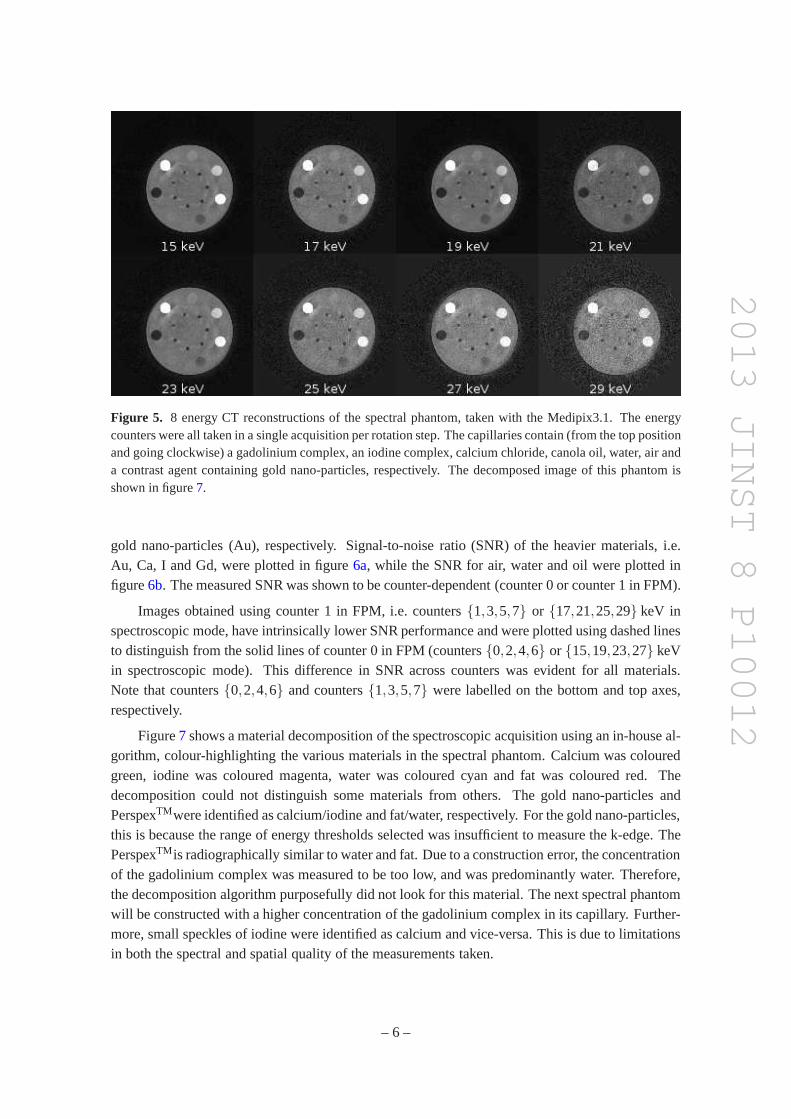
The reconstructed images of the spectral phantom for the eight energy thresholds are shown infigure 5. All projections were acquired in a single acquisition per rotation angle. The materialsin the capillaries are (from the top position and going clockwise) a gadolinium complex (Gd), aniodine complex (I), calcium chloride (Ca), canola oil, water, air and a contrast agent containing
– 5 –
2013 JINST 8 P10012
Figure 5. 8 energy CT reconstructions of the spectral phantom, taken with the Medipix3.1. The energycounters were all taken in a single acquisition per rotationstep. The capillaries contain (from the top positionand going clockwise) a gadolinium complex, an iodine complex, calcium chloride, canola oil, water, air anda contrast agent containing gold nano-particles, respectively. The decomposed image of this phantom isshown in figure7.
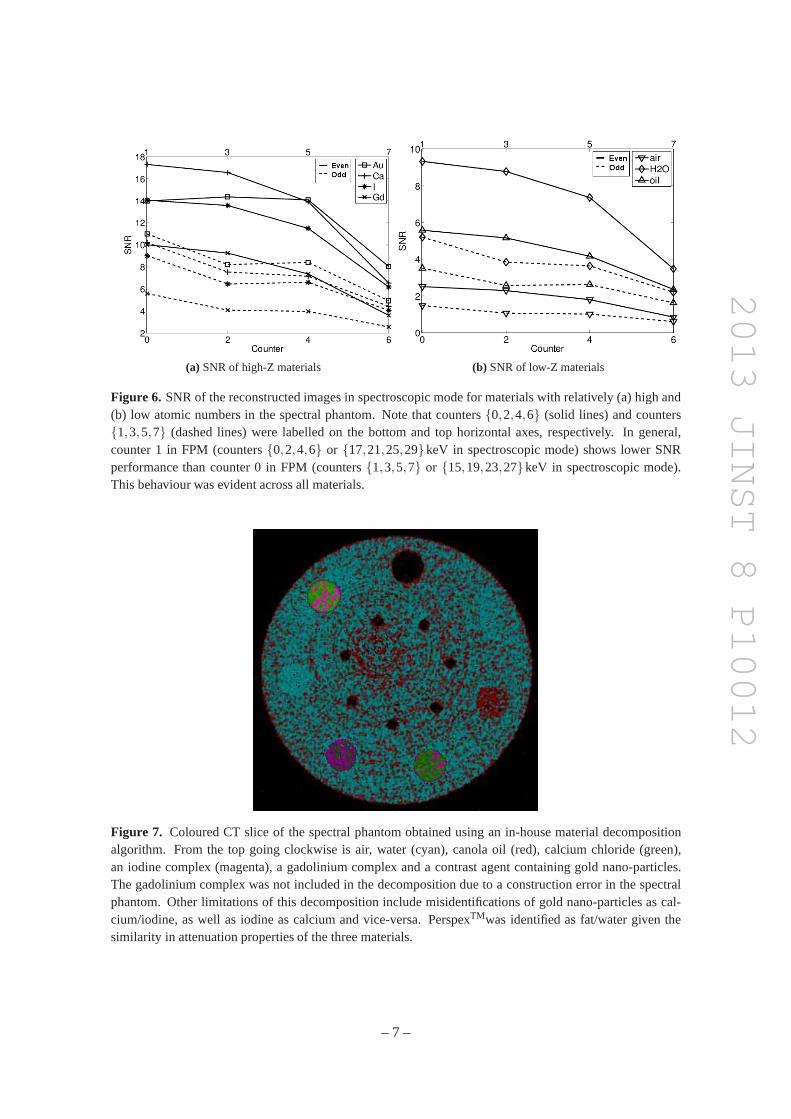
gold nano-particles (Au), respectively. Signal-to-noiseratio (SNR) of the heavier materials, i.e.Au, Ca, I and Gd, were plotted in figure6a, while the SNR for air, water and oil were plotted infigure6b. The measured SNR was shown to be counter-dependent (counter 0 or counter 1 in FPM).
Images obtained using counter 1 in FPM, i.e. counters{1,3,5,7} or {17,21,25,29} keV inspectroscopic mode, have intrinsically lower SNR performance and were plotted using dashed linesto distinguish from the solid lines of counter 0 in FPM (counters{0,2,4,6} or {15,19,23,27} keVin spectroscopic mode). This difference in SNR across counters was evident for all materials.Note that counters{0,2,4,6} and counters{1,3,5,7} were labelled on the bottom and top axes,respectively.
Figure7 shows a material decomposition of the spectroscopic acquisition using an in-house al-gorithm, colour-highlighting the various materials in thespectral phantom. Calcium was colouredgreen, iodine was coloured magenta, water was coloured cyanand fat was coloured red. Thedecomposition could not distinguish some materials from others. The gold nano-particles andPerspexTMwere identified as calcium/iodine and fat/water, respectively. For the gold nano-particles,this is because the range of energy thresholds selected was insufficient to measure the k-edge. ThePerspexTM is radiographically similar to water and fat. Due to a construction error, the concentrationof the gadolinium complex was measured to be too low, and was predominantly water. Therefore,the decomposition algorithm purposefully did not look for this material. The next spectral phantomwill be constructed with a higher concentration of the gadolinium complex in its capillary. Further-more, small speckles of iodine were identified as calcium andvice-versa. This is due to limitationsin both the spectral and spatial quality of the measurementstaken.
– 6 –
2013 JINST 8 P10012
(a) SNR of high-Z materials (b) SNR of low-Z materials
Figure 6. SNR of the reconstructed images in spectroscopic mode for materials with relatively (a) high and(b) low atomic numbers in the spectral phantom. Note that counters{0,2,4,6} (solid lines) and counters{1,3,5,7} (dashed lines) were labelled on the bottom and top horizontal axes, respectively. In general,counter 1 in FPM (counters{0,2,4,6} or {17,21,25,29}keV in spectroscopic mode) shows lower SNRperformance than counter 0 in FPM (counters{1,3,5,7} or {15,19,23,27}keV in spectroscopic mode).This behaviour was evident across all materials.
Figure 7. Coloured CT slice of the spectral phantom obtained using an in-house material decompositionalgorithm. From the top going clockwise is air, water (cyan), canola oil (red), calcium chloride (green),an iodine complex (magenta), a gadolinium complex and a contrast agent containing gold nano-particles.The gadolinium complex was not included in the decomposition due to a construction error in the spectralphantom. Other limitations of this decomposition include misidentifications of gold nano-particles as cal-cium/iodine, as well as iodine as calcium and vice-versa. PerspexTMwas identified as fat/water given thesimilarity in attenuation properties of the three materials.
– 7 –
2013 JINST 8 P10012
4 Discussion and conclusions
On the Medipix3.0, the per-pixel configuration for equalisation was not stable with time, with no-ticeable destabilisation after only two days [10]. The equalisation process ensures that the thresholddispersion in pixel response is minimised for image acquisition by electronically aligning the en-ergy threshold of every pixel. Without equalisation, pixels across a Medipix chip respond unequallywhen exposed to a constant energy, e.g. a homogeneous x-ray flux. The destabilisation in equalisa-tion can therefore affect both the energy response and the spatial quality of the detector. Similarly,Digital to Analogue Converter (DAC) stability was also an issue in the Medipix3.0 across severalkey DAC values [14]. Given that the circuitry in each pixel is dependent on the analogue voltagesand currents controlled by the DAC values, noise and drift inthese parameters can directly affectthe detector performance, leading to pixels that vary in count-rate and energy response. Theseinstabilities may be manifested as ring artifacts in the reconstructed images.
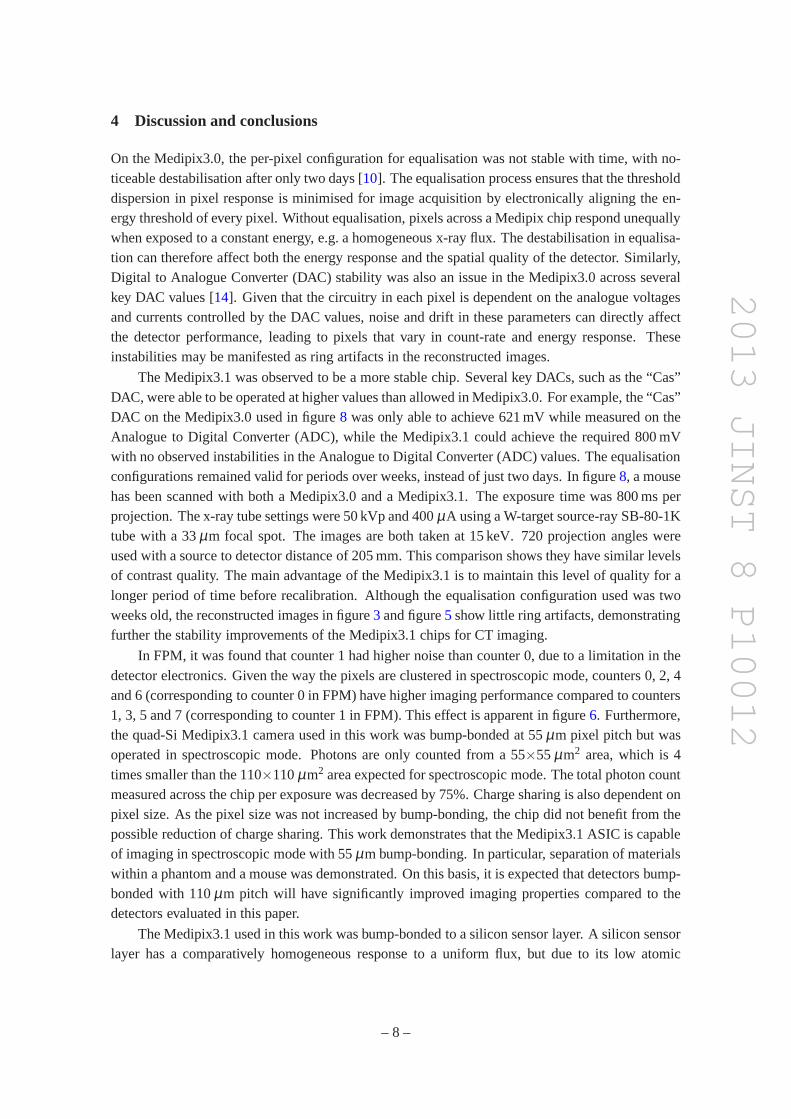
The Medipix3.1 was observed to be a more stable chip. Severalkey DACs, such as the “Cas”DAC, were able to be operated at higher values than allowed inMedipix3.0. For example, the “Cas”DAC on the Medipix3.0 used in figure8 was only able to achieve 621 mV while measured on theAnalogue to Digital Converter (ADC), while the Medipix3.1 could achieve the required 800 mVwith no observed instabilities in the Analogue to Digital Converter (ADC) values. The equalisationconfigurations remained valid for periods over weeks, instead of just two days. In figure8, a mousehas been scanned with both a Medipix3.0 and a Medipix3.1. Theexposure time was 800 ms perprojection. The x-ray tube settings were 50 kVp and 400µA using a W-target source-ray SB-80-1Ktube with a 33µm focal spot. The images are both taken at 15 keV. 720 projection angles wereused with a source to detector distance of 205 mm. This comparison shows they have similar levelsof contrast quality. The main advantage of the Medipix3.1 isto maintain this level of quality for alonger period of time before recalibration. Although the equalisation configuration used was twoweeks old, the reconstructed images in figure3 and figure5 show little ring artifacts, demonstratingfurther the stability improvements of the Medipix3.1 chipsfor CT imaging.
In FPM, it was found that counter 1 had higher noise than counter 0, due to a limitation in thedetector electronics. Given the way the pixels are clustered in spectroscopic mode, counters 0, 2, 4and 6 (corresponding to counter 0 in FPM) have higher imagingperformance compared to counters1, 3, 5 and 7 (corresponding to counter 1 in FPM). This effect is apparent in figure6. Furthermore,the quad-Si Medipix3.1 camera used in this work was bump-bonded at 55µm pixel pitch but wasoperated in spectroscopic mode. Photons are only counted from a 55×55µm2 area, which is 4times smaller than the 110×110µm2 area expected for spectroscopic mode. The total photon countmeasured across the chip per exposure was decreased by 75%. Charge sharing is also dependent onpixel size. As the pixel size was not increased by bump-bonding, the chip did not benefit from thepossible reduction of charge sharing. This work demonstrates that the Medipix3.1 ASIC is capableof imaging in spectroscopic mode with 55µm bump-bonding. In particular, separation of materialswithin a phantom and a mouse was demonstrated. On this basis,it is expected that detectors bump-bonded with 110µm pitch will have significantly improved imaging propertiescompared to thedetectors evaluated in this paper.
The Medipix3.1 used in this work was bump-bonded to a siliconsensor layer. A silicon sensorlayer has a comparatively homogeneous response to a uniformflux, but due to its low atomic
– 8 –
2013 JINST 8 P10012
Figure 8. CT reconstructions with a Medipix3.0 and Medipix3.1. The Contrast to Noise Ratio (CNR)between the fat and the air is 3.61 for the Medipix3.0 and 3.79for the Medipix3.1.
number, has poor photon absorption at energies above 25 keV.Cadmium-telluride [15, 16] orgallium-arsenide [17] are alternatives with higher absorption efficiencies at energies between 30and 120 keV. These sensor materials are not as readily available as silicon, and were not availablewith the Medipix3.1 ASIC to the MARS team at the time of these measurements. Consequently,although the image rendering in figure4shows visible gold nano-particles in the mouse image takenwith the Medipix3.1, this was achieved using the attenuation values rather than from detectingthe gold k-edge. The k-edge of gold occurs outside the range of energies that can be measuredusing a silicon sensor layer. To distinguish gold by its k-edge, a high-Z detector like cadmium-telluride is needed to detect higher energy x-rays. Similarly, in figure 7, the energy thresholdswere selected below the K-edges of iodine, gadolinium and gold. It is expected that using a high-Zsensor such as gallium-arsenide or cadmium-telluride would result in improvements in the materialdecomposition.
The algorithm for decomposition used in figure7 is a prototype algorithm under development.There were several limitations in allocating materials in this study, where some pixels are allocatedincorrect materials from other regions. There are several factors that may have caused this. Theenergy thresholds were selected at lower energies than required for distinguishing the K-edges ofmany of the materials of interest. Spatial quality was low, due to insufficient pixel equalisation.This also affects the spectral resolution of the detector, as does charge sharing. Charge summingmode was not used in these measurements. In the Medipix3.0 and Medipix3.1, it is known tosuffer from an effect called preferential summing [18, 19], where the lowest threshold pixel has ahigher probability of being assigned with the charge in a photon detection event. This made chargesumming mode unsuitable for this work. A study on charge summing mode in the Medipix3detector can be found in [20].
The Medipix3RX is the next version of the Medipix3 detectors. It has a corrected chargesumming mode with a counter dedicated to charge arbitration[21]. This corrects the preferential
– 9 –
2013 JINST 8 P10012
summing problem, making charge summing mode useable and allowing for higher spectroscopicperformance. It is expected that material decomposition will be improved with measurements usinga Medipix3RX chip in charge summing mode.
In conclusion, the Medipix3.1 is an improved chip over the Medipix3.0 for electrical stability.The odd-numbered counters have been shown to be lower quality than the even, due to limitationsin the equalisation of the pixel thresholds. With a sensor layer bump-bonded at 55µm, we haveshown that the Medipix3.1 can still acquire high quality spectroscopic CT images. This workhas enabled us to integrate spectroscopic mode into the MARScamera. Using this spectroscopicdata, we have been able to separate iodine, calcium, fat and water using an in-house materialdecomposition algorithm. In future, similar measurementswill be done in charge summing modeusing a Medipix3RX bump-bonded at 110µm to high-Z sensor materials such as gallium-arsenideor cadmium-telluride.
References
[1] S. Feuerlein et al.,Multienergy photon-counting k-edge imaging: potential for improved luminaldepiction in vascular imaging, Radiology249 (2008) 1010.
[2] D.P. Cormode et al.,Atherosclerotic plaque composition: analysis with multicolor CT and targetedgold nanoparticles, Radiology256 (2010) 774.
[3] J.P. Ronaldson,Quantitative soft-tissue imaging by spectral CT with Medipix3, Ph.D. Thesis,University of Otago, New Zealand (2012) [http://hdl.handle.net/10523/2559].
[4] N.G. Anderson et al.,Spectroscopic (multi-energy) CT distinguishes iodine andbarium contrastmaterial in MICE, Eur. Radiol.20 (2010) 2126.
[5] R. Ballabriga, M. Campbell, E. Heijne, X. Llopart and L. Tlustos,The Medipix3 Prototype, a PixelReadout Chip Working in Single Photon Counting Mode With Improved Spectrometric Performance,IEEE T. Nucl. Sci.54 (2007) 1824.
[6] R. Ballabriga Sune,The Design and Implementation in0.13µm CMOS of an Algorithm PermittingSpectroscopic Imaging with High Spatial Resolution for Hybrid Pixel Detectors. Ph.D. Thesis,Ramon Llull University, Barcelona, Spain (2009) [CERN-THESIS-2010-055].
[7] X. Wang et al.,Microcomputed tomography with a second generation photon-counting x-raydetector: contrast analysis and material separation, SPIE Medical Imaging7622 (2010) 76221B.
[8] M.F. Walsh et al.,First CT using medipix3 and the MARS-CT-3 spectral scanner,2011JINST6 C01095.
[9] Source-Ray Inc.,Model SB-80-1K (Doc. M-SB801K-DI, Rev 1) Installation/Operation Manual, 2002.
[10] M. Walsh, R. Doesburg, J. Mohr, R. Ballabriga, A. Butlerand P. Butler,Improving and characterisingthe threshold equalisation process for multi-chip medipix3 cameras in single pixel mode, IEEENuclear Science Symposium and Medical Imaging Conference(2011) 1718.
[11] M. Dierick, B. Masschaele and L.V. Hoorebeke,Octopus, a fast and user-friendly tomographicreconstruction package developed in labviewR©, Measurement Science and Technology(2004) 1366.
[12] N.D. Tang, N. de Ruiter, J.L. Mohr, A.P.H. Butler, P.H. Butler and R. Aamir,Using algebraicreconstruction in computed tomography, in proceedings of27th Conference on Image and VisionComputing New Zealand(2012), pp. 216–221.
– 10 –
2013 JINST 8 P10012
[13] T. Kroes, F.H. Post and C.P. Botha,Exposure render: an interactive photo-realistic volume renderingframework, PLoS ONE7 (2012) e38586.
[14] J.P. Ronaldson,Characterization of Medipix3 with the MARS readout and software,2011JINST6 C01056.
[15] R. Aamir et al.,Characterization of si and CdTe sensor layers in medipix assemblies using amicrofocus x-ray source, IEEE Nuclear Science Symposium and Medical Imaging Conference(2011)4766.
[16] R. Aamir et al.,Characterization of CdTe x-ray sensor layer on medipix detector chips, Mater. Sci.Forum700 (2011) 170.
[17] L. Tlustos, M. Campbell, C. Frojdh, P. Kostamo and S. Nenonen,Characterisation of an epitaxialGaAs/Medipix2 detector using fluorescence photons, Nucl. Instrum. Meth.A 591 (2008) 42.
[18] D. Pennicard, R. Ballabriga, X. Llopart, M. Campbell and H. Graafsma,Simulations of chargesumming and threshold dispersion effects in medipix3, Nucl. Instrum. Meth.636 (2011) 74.
[19] E.N. Gimenez et al.,Study of charge-sharing in MEDIPIX3 using a micro-focused synchrotron beam,2011JINST6 C01031.
[20] R.M.N. Doesburg et al.,Spectrum measurement using Medipix3 in Charge Summing Mode,2012JINST7 C11004.
[21] P.T. Talla,Investigation of photon counting pixel detectors for X-rayspectroscopy and imaging, Ph.D.Thesis, Friedrich-Alexander-Universitat, Erlangen-N¨urnberg, Germany (2011).
– 11 –