Embed Size (px)
Citation preview
SPECTRAL COLOR INDICES BASED GEOSPATIAL MODELING OF SOILORGANIC MATTER IN CHITWAN DISTRICT, NEPAL
Umesh K MandalProfessor
Central Department of Geography,Tribhuvan University, Kathmandu, Nepal
KEY WORDS: Color Indices, Landsat TM, coefficient of the estimator, Regression, SOM
ABSTRACT
Space Technology provides a resourceful-cost effective means to assess soil nutrients essential for soil management plan. Soilorganic matter (SOM) is one of valuable controlling productivity of crops by providing nutrient in farming systems. Geospatialmodeling of soil organic matter is essential if there is unavailability of soil test laboratories and its strong spatial correlation. In thepresent analysis, soil organic matter is modeled from satellite image derived spectral color indices. Brightness Index (BI), ColorationIndex (CI), Hue Index (HI), Redness Index (RI) and Saturation Index (SI) were calculated by converting DN value to radiance andradiance to reflectance from Thematic Mapper image. Geospatial model was developed by regressing SOM with color indices andproducing multiple regression model using stepwise regression technique. The multiple regression equation between SOM andspectral indices was significant with R = 0. 56 at 95% confidence level. The resulting MLR equation was then used for the spatialprediction for the entire study area. Redness Index was found higher significance in estimating the SOM. It was used to predictSOM as auxiliary variables using cokringing spatial interpolation technique. It was tested in seven VDCs of Chitwan district ofNepal using Thematic Mapper remotely sensed data. SOM was found to be measured ranging from 0.15% to 4.75 %, with a meanof 2.24 %. Remotely sensed data derived spectral color indices have the potential as useful auxiliary variables for estimating SOMcontent to generate soil fertility management plans.
1. INTRODUCTION
Soil is one of the most important natural resources providinglife to all kinds of living beings as plants, animals andorganism. Organic matter is vital soil properties for precisionagriculture and essential macronutrient for increase soil fertilityrequired for plant growth and development that is extremelyassociated with soil physical, chemical, and biologicalprocesses. Not only this, water and nutrient holding capacityare enhanced and soil structure is improved with increasingSOM but it is one of the most deficient soil nutrients interrestrial ecosystems. Nepal’s agriculture land consists of poororganic matter and nitrogen content with the dominance ofacidic soil (Dawadi et al 2015) Proper and efficientmanagement soil organic matter can enhance productivity andenvironmental quality along with reduction of the severity andcosts of natural disasters, such as drought, flood, and disease(Chen and Aviad, 1990 and Stevenson and He, 1990). A partfrom this, increasing SOM can reduce atmospheric CO2 levelscontributing to prevention of global warming (Yadav andMalanson, 2007).
Accurate measurement of soil organic matter content isessential since it is one of the key soil properties controllingnutrient budgets in agricultural production systems and it isdone through soil test laboratories. Government of Nepal haslimited soil test laboratories and recently proposed fifty new tobe set up on PPP mode with a cost of NRs 2.5 million eachalong with strengthening of 16 existing soil test laboratories ( 7under SMD and 9 under NARC) requiring a cost of NRs 5.0million each to cater the demand of farmers and
researchers(.Dawadi et al 2015). Estimation of this soil propertyat an acceptable level of accuracy is important; especially in thecase when SOM exhibits strong spatial dependence and itsmeasurement is a time,cost and labor-consuming procedure.
Remote sensing has been emerged to cater the wider interest ofsoil scientists with the application from soil survey to fertilitymapping and nutrients estimation after the development ofoptical sensor in combination with field measurements ( Ben-Dor, 2002 and. Dehaan and Taylor , 2003 ). Spectral reflectancedata was used to study soil properties started as early in 1980sparticularly using the near infrared reflectance (NIR) for thestudy of SOM ( Krishnan et al. 1981, Pitts et al 1986 ,Dalai andHenry 1986).
The presence of organic matter has a strong influence on soilreflectance significantly affecting the soil color that generallydecreases over the entire short wave region as organic mattercontent increases (Stoner and Baumgardner, 1980, Colemanand Montgomery1987).
The geostatistical method (ordinary kriging (OK), cokriging) ,geometric method (inverse distance Weighting (IDW), localpolynomial), and statistical methods such as the linearregression model (LR) have been the most commonly usedinterpolation technologies (Kravchenko A, Bullock DG1999).
The present attempt was designed to evaluate the potential ofspectral color index analysis of Thematic Mapper reflectivedata as an approach for estimation of soil organic mattercontent using cokringing spatial interpolation technique inseven VDCs namely Mangalpur,Sardanagar,Parwatipur,
The International Archives of the Photogrammetry, Remote Sensing and Spatial Information Sciences, Volume XLI-B2, 2016XXIII ISPRS Congress, 12–19 July 2016, Prague, Czech Republic
This contribution has been peer-reviewed.doi:10.5194/isprsarchives-XLI-B2-43-2016 43
Sibnagar, Patihani ,Fulbari & Gitanagr VDC of ChitwanDistrict of Nepal.
2. MATERIALS AND METHODS
2.1 Study Area
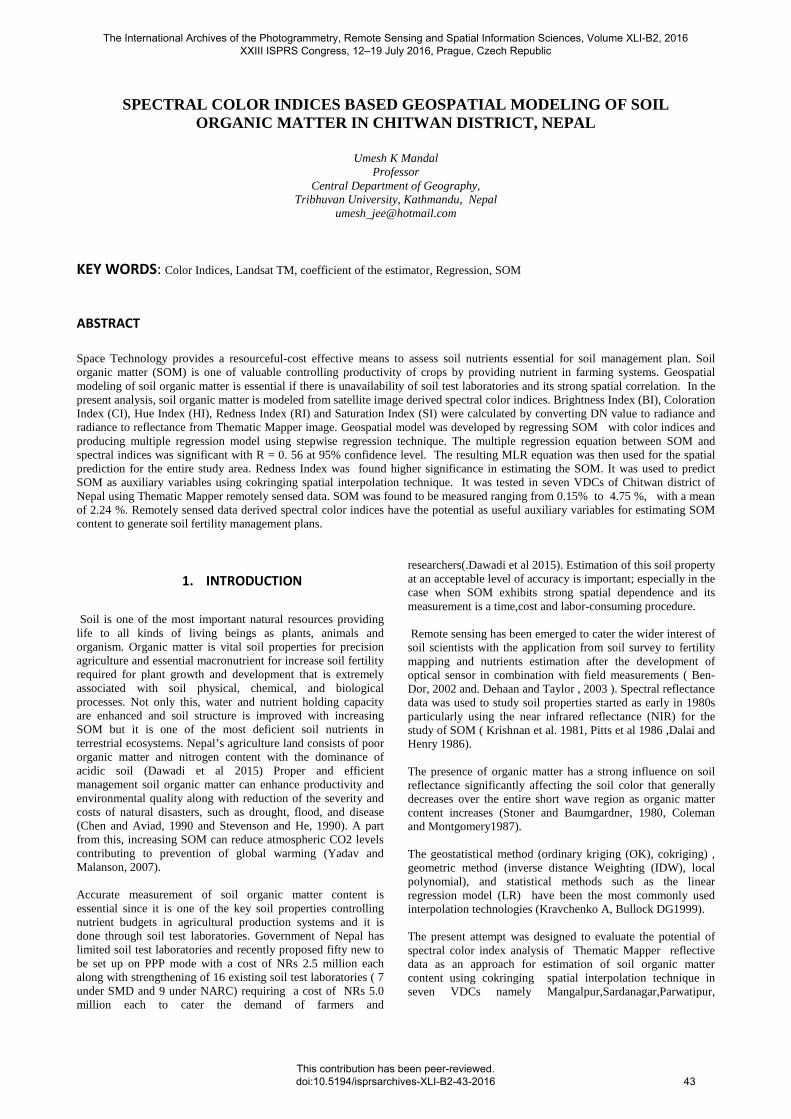
The study area is seven VDCs lying in North-western part ofChitwan district, Nepal (Fig.1), covering total area of 109.81sq.km. The study area is ranging from 170 meter elevationfrom mean see level to 190 m with the average of 180 m andfrom less than 1° to 5° slope predominated by less than 1°.Geologically the study area is originated in tertiary andquaternary period consisting of sandstone, shale,conglomerateand active and recent alluvial plains and river terraces.Tributary of Raptari river is the major river draining lower partof the study area. The average maximum and minimumtemperature of 10 years period (2000-2009) is found to be30.95 °C and 18.18°C respectively with the average annualmean temperature of 24.57 °C. The average annual rainfall is21931.64 mm out of which eighty three percent of annual totalrainfall (1829.24 mm) is received during the months of rainyseason.
Fig 1: location map of study area
2.2 Image processing and generation of radiance andreflectance image and spectral color indices
In order to model/predict Soil organic matter content(SOM)in the study area using remotely sensed data as auxiliaryvariables, Landsat-5 image(row 41& path 142) was acquiredon 7 April, 2010 .7-channel Landsat -5 of Thematic Mapperwas downloaded at ftp://glcf.umiacs.umd.edu from GlobalLand Cover Facility of the University of Maryland, USA.DN
value of each image was converted back to radiance image(L)using the equation 1:
L= "gain" * QCAL + "bias" (1)
Where L = Spectral Radiance at the sensor's aperture inwatts/(meter squared * ster * µm), gain = Rescaled gain (thedata product "gain" contained in the Level 1product header or ancillary data record) in watts/(meter squared
* ster * µm), QCAL = the quantized calibrated pixel value in
DN & bias = Rescaled bias (the data product "offset" containedin the Level 1 product header or ancillary data record ) inwatts/(meter squared * ster * µm). Then, to calculate at-sensorreflectance the equations are given in equation (2) &(3):
Sun_radiance = [Esun * sin(e)] / (PI * d^2) (2)
Reflectance = radiance /sun_radiance (3)
where, d is the earth-sun distance in astronomical units, e isthe solar elevation angle, and Esun is the mean solarexoatmospheric irradiance in W
Normalized difference vegetation index (NDVI), as widelyused as vegetation spectral index in Remote Sensing was usedfor showing abundance of vegetation cover (Chen. andBrutsaert, 1998). Negative NDVI values were dominantindicating that the study area was comprised mostly of bare soilwhen the image was acquired.
Five spectral color indices as brightness index (BI), colourationindex (CI), hue index (HI), redness index (RI) and saturationindex (SI) were derived from Thematic Mapper of Landsat.
Table 1: Technical specification of Thematic Mapper
BandNo
Spectralrange (nm)
SpatialResolution (m)
ImageSwath(km)
7 400-1250 30 185
The method for generating these indices is presented in Table 2using following formula (Mathieu and Pouget, 1998). Threechannels having the center wavelength of Blue (B = 480 nm),Green(G = 545 nm) and Red( R= 660 nm) of Landsat-5 imagedata were used to generate indices and corresponding imagevalues associated to SOM samples were extracted to performthe relations.
Table 2: Spectral color indices of Thematic Mapper sensor
Index Formula Index PropertyBrightnessIndex, BI
(R2+G2+B2)/3)0.5 Average soil reflectancemagnitude
SaturationIndex, SI
(R-B)/(R+B) Spectral Slope
Hue Index,HI
(2*R-G-B)/(G-B)Dominant wavelength,Primary colors
ColorationIndex, C
(R-G)/(R+G)Hematite/hematite+geothite
ratio,Soil ColourRednessIndex,RI
R2/(B*G3) Hematite Content
2.3 Soil Survey and Analysis
The International Archives of the Photogrammetry, Remote Sensing and Spatial Information Sciences, Volume XLI-B2, 2016XXIII ISPRS Congress, 12–19 July 2016, Prague, Czech Republic
This contribution has been peer-reviewed.doi:10.5194/isprsarchives-XLI-B2-43-2016 44

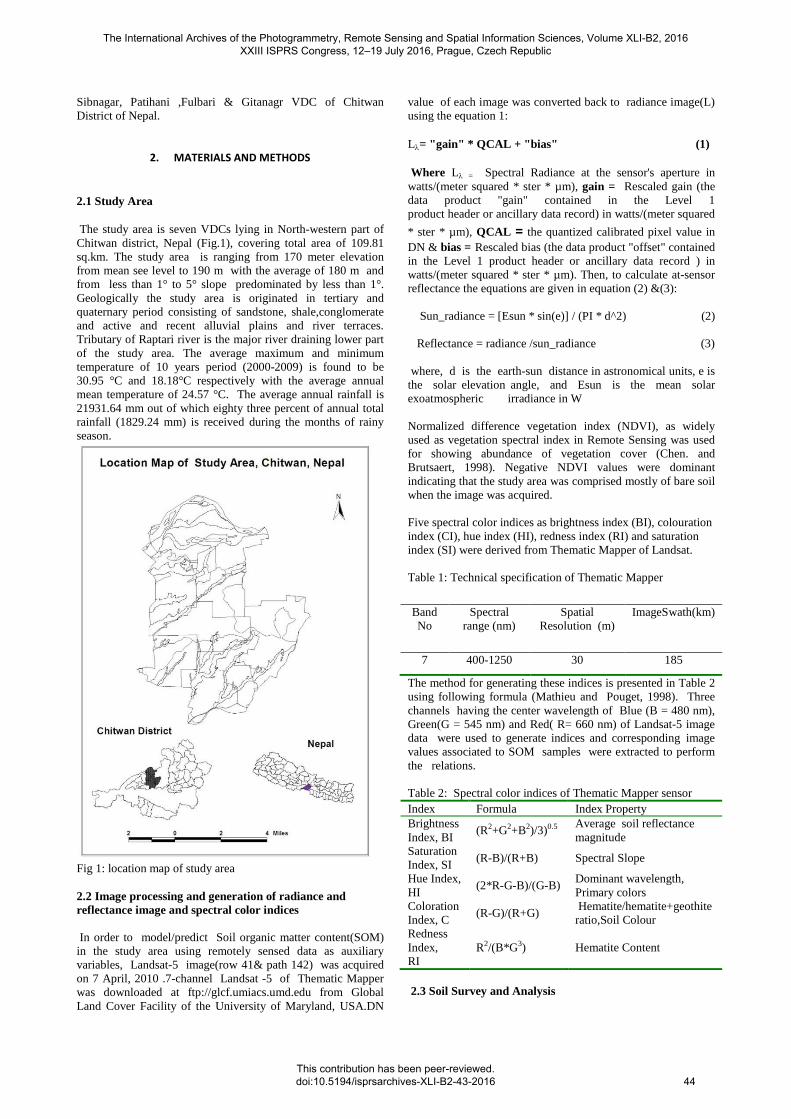
A total of 391 soil samples from epipedon were collected fromdifferent land use mainly from agriculture fields in May 6,2011(Fig 2). Walkley-Black is one of three methods used fororganic matter content determination. The calculation oforganic matter assumes that 77% of the organic carbon isoxidized by the method and that soil organic matter contains58% C. Since both of these factors are averages from a range ofvalues, it would be preferable to omit them and simply reportthe results as "easily oxidizable organic C." (Schulte and Bruce, 2009).
Fig 2: Distribution of soil samples.
2.4 Kriging and Cokriging
Kriging utilizes the spatial dependence of a particular soilcharacteristic. Some attributes such as SOM and RednessIndex(RI) are dependent. This dependence can be used inestimation as well as the spatial dependence. When one or morevariables are estimated by a linear combination using both thespatial and inter-variable dependence, the technique is knownas co-kriging or co-regionalization.
The matrix formulation of cokriging has been described by thescientists (Journeland Huijbregths ,1978 andMyers,1982,1983). The cokriging estimate is a linearcombination of both primary and secondary data values and isgiven by the equation (4).
û = a ∙ u + b . v (4)
where ûo is the estimate of U at location o; u1,…,un are theprimary data at n nearby locations; v1,…,vm are the secondary
data at m nearby locations; a1,…,an and b1,…,bm are thecokriging weights that must be determined.
The development of the cokriging system is identical to thedevelopment of the ordinary kriging system. The definition ofestimation error is given in equation (5)
R = û − u = a ∙ u + b ∙ v − U (5)
Kriging calculates the values of weight, ai by estimating thespatial structure of the variable’s distribution represented by asemivariogram model as spherical in this case as equation(6):
γ(h) =C + C − for 0 ≤ h ≤ a
C + C for h ≥ a(6)
Similarly cokriging calculates the values of weight, ai byestimating the spatial structure of the co-variable’s distributionrepresented by a cross semivariogram model using a Gaussianmodel as equation (7):
γ(h) = C + C 1 − exp −h
a(7)
where γ(h) is semivariogram value, C0 is the nugget value , C1
or s is the sill value , a or a is the range value , and h is thelagged distance or distance between two places.
3. RESULTS AND DISCUSSIONS
3.1 Statistical Modeling
In the present investigation, Statistical modeling has beeninitiated with the performing correlation, and regressionMultivariate correlation and regression analysis was performedto examine the nature, direction and strength of associationbetween soil organic matter content and Thematic Mapperimage derived spectral color indices as variables respectively.Relationship between spectral color indices as independent orpredictor variables and SOM as a dependent or criterionvariable was characterized.
Multiple regression analysis was performed to test the spatialdependency of soil organic matter content on spectral basedcolor indices of Thematic Mapper sensor. A t-test showed thatregression coefficient of Redness Index(RI) among fiveindices were found significant at 5 percent significant levelalong with ANOVA reported that the model is significant atthe 5 percent level indicating that using the model is better thanguessing the mean. As a whole, the regression does a good jobof modeling soil organic matter content (SOM). Nearly thirty-two percent variation in SOM is explained by the model (R2. =0.32). Although multiple correlation coefficient was foundmoderate (R=0.56), individual indices as predictors aresuffering from multi-collinearities problem indicated by lowvalue of percentage of Tolerance and high value of VarianceInflation Factor (VIF) in the regression analysis (Norusis,1993). Multicolinearity is used to describe a situation where the
The International Archives of the Photogrammetry, Remote Sensing and Spatial Information Sciences, Volume XLI-B2, 2016XXIII ISPRS Congress, 12–19 July 2016, Prague, Czech Republic
This contribution has been peer-reviewed.doi:10.5194/isprsarchives-XLI-B2-43-2016 45
predictor variables are highly correlated with each otheraffecting to inflate the coefficient of estimators with theirwrong direction, making unreliable inference and widerconfidence interval (Greene, 2008). Geometric technique,stepwise multiple regression, orthogonalization process andprinciple component analysis (PCA) are various ways oftackling the problem of multicollinearity (Frisch, 1934).Among them, stepwise multiple regression is used foreliminating all redundant indices and producing an underlying
substantial one for estimating SOM.
3.2 Relationship between spectral color indices and soil
organic matter content
Karl Pearson’s correlation coefficient analysis was performedbetween five RS based spectral color indices and the soilorganic matter content (SOM) as dependent variable. Thecorrelation coefficient was revealed negative moderatecorrelation except for the Hue Index (HI) , which may havebeen influenced by the presence of vegetation cover in someregions of the study area (Table 3). Soil organic matter (SOM)content was found significantly negative correlated withBrightness Index (r = -0.408) and Redness Index (r = -0.342) at0.05 significant level (Table 3). Such significant correlationcoefficient was investigated after removal of outliers found infive observations and data transformation did not enhance thecorrelation coefficient rather decrease . Thus it is not requiredbecause of already having symmetric distribution of variate asusually being done in skewed distribution.
Table 3: Pearson’s correlation coefficient between soil organicmatter (SOM) and image color index.
Brightness Index
(BI)
Coloration
Index(CI)
HueIndex(HI)
RednessIndex(R
I)
Saturation
Index(SI
SOM
-0.408 -0.344 0.312 -0.432 -0.344
Stepwise multiple regression was performed among fiveremote sensing based spectral color indices after removingoutliers and multi-colinearity problem by using followingequation(8).
SOM = ¦(a) ( )
Where SOMi is the mean content of Soil Organic Matter(SOM) . a is the Redness Index(RI). In this equation, soilorganic matter (SOM) content is said to be a function ofRedness Index (RI). The resulting least square fit has the form:
SOM = 0.385− 2.736 ∗ RI (9)
The result of stepwise multiple regression analysis as indicatedby t-test shows that only Redness Index(RI) remained as astatistically significant predictor variable (P < 0.05).Thecoefficient of determination, R2 of the model was investigatedof 0.25 , implying that twenty-five percent of the variation inthe mean soil organic matter content of seven VillageDevelopment Committees of Chitwan district, Nepal can beaccounted for by only Redness Index( RI).
3.3 Spatial modeling and prediction of soil organic matter
content
The resulting multiple regression equation was used for spatialmodeling of soil organic matter content. The sample data ofSOM was characterized by the range from 0.150 % to 4.750 %with the mean of 2.241 % and median of 2.260% . The meanand median value of SOM is almost similar that meets therequirement of normal distribution for kringing and cokriningafter removal of extreme value from distribution. After that,second problem in the spatial distribution of SOM is theexistence of global trend or directional effects(non-random thatis depicted by trend analysis and can be addressed by usingmathematical formula like second order polynomial equation.
Th semivariogram of SOM provided a clear description of itsspatial structure with some insight into possible processesaffecting its spatial distribution whether there is spatialautocorrelation. The semivariograms of both SOM and RednessIndex of Thematic Mapper was well fitted with a sphericalmodel. Spherical model of semivariogram is characterized bynugget of 0.538,partial sill of 0.077 and range of 12778.3 forkriging and nugget of 0.555, partial sill of 0.066 and range of12778.3 for cokriging. Range is the distance where fittedsemivariogram( yellow line) levels off indicating that there islittle autocorrelation beyond the range . Sill is the value ofsemivariogram model attaining at the range. Partial sill is thesill minus the nugget.The nugget/sill ratios of the fittedsemivariogram models for SOM and RI of Thematic Mapperwere as low as 0.89 and 0.88, respectively.
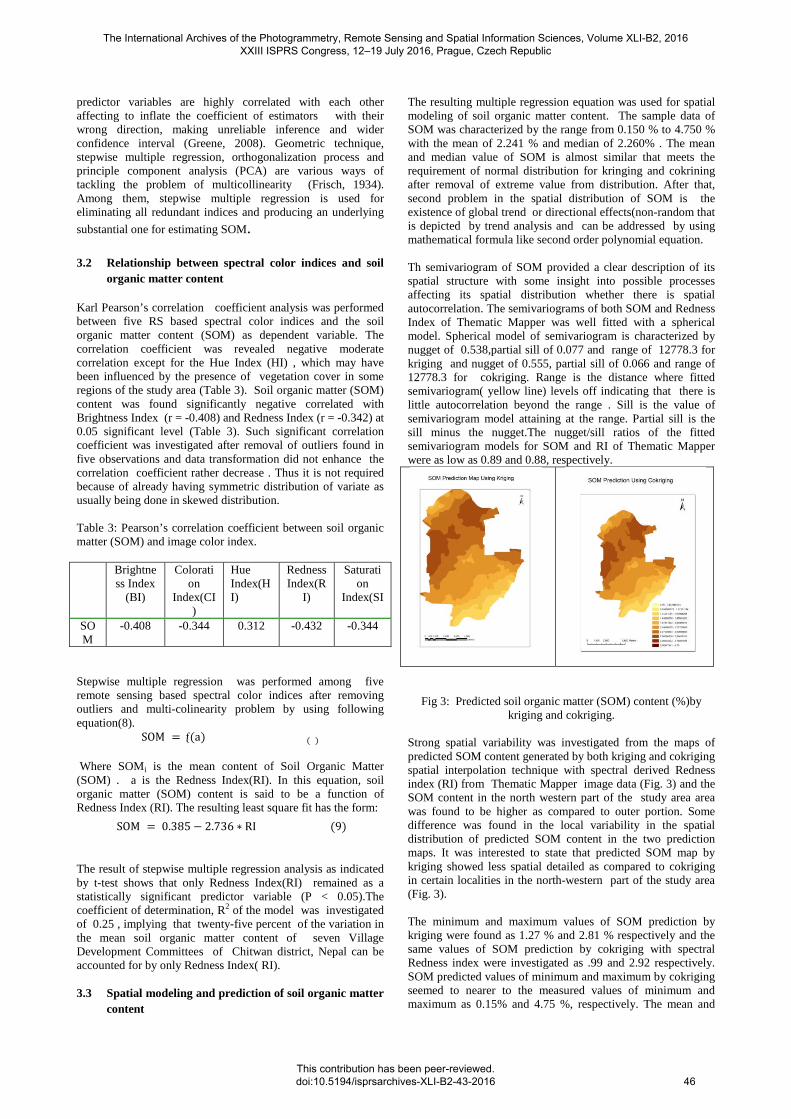
Fig 3: Predicted soil organic matter (SOM) content (%)bykriging and cokriging.
Strong spatial variability was investigated from the maps ofpredicted SOM content generated by both kriging and cokrigingspatial interpolation technique with spectral derived Rednessindex (RI) from Thematic Mapper image data (Fig. 3) and theSOM content in the north western part of the study area areawas found to be higher as compared to outer portion. Somedifference was found in the local variability in the spatialdistribution of predicted SOM content in the two predictionmaps. It was interested to state that predicted SOM map bykriging showed less spatial detailed as compared to cokrigingin certain localities in the north-western part of the study area(Fig. 3).
The minimum and maximum values of SOM prediction bykriging were found as 1.27 % and 2.81 % respectively and thesame values of SOM prediction by cokriging with spectralRedness index were investigated as .99 and 2.92 respectively.SOM predicted values of minimum and maximum by cokrigingseemed to nearer to the measured values of minimum andmaximum as 0.15% and 4.75 %, respectively. The mean and
The International Archives of the Photogrammetry, Remote Sensing and Spatial Information Sciences, Volume XLI-B2, 2016XXIII ISPRS Congress, 12–19 July 2016, Prague, Czech Republic
This contribution has been peer-reviewed.doi:10.5194/isprsarchives-XLI-B2-43-2016 46
standard deviation of SOM prediction by the two methods were2.14% and 0.60 for kriging 2.24% and 0.28 for cokriging,respectively and the mean and standard deviation of SOMcontent from the soil samples were 2.24%and 0.37 respectively.The measured value of mean SOM (2.23 %) was found to becloser to the SOM prediction (2.24%) by cokriging thankriging(2.14%). Similarly, it was found that the standarddeviation of predicted SOM by both kriging and cokriging wereless than that of the soil organic matter measured fromlaboratory and the standard deviation of predicted SOM bycokriging was found less in comparison to kriging.
The mean of predictions and average standard error ofprediction from cross-validation by the two methods were0.032 and 0.765 for kriging and 0.030 and 0.705 for cokriging.It is found that the predicted SOM content by cokriging wasless than that by kriging.
Spatial dependency reflecting variability of soil properties wasinvestigated by the appropriate semivariogram model and itsparameters as nugget and sill. The ratio of nugget/sill wasconsidered to be a basis for the classification of level of thespatial dependence as values lower than 25% for strong ,higher than 75% for weak and between 25% and 75% formoderate spatial dependence (Chang et al., 1998; Chien et al.,1997). In the present analysis, spherical model ofsemivariogram was used and the nugget/sill ratios for bothkriging and cokriging were found lower than 25%, thatdemonstrated strong spatial dependence of SOM and itindicated the importance of quantifying spatial variability forspatially predicting SOM in the study area. This demonstratesthat remote sensing derived spectral color indices as auxiliaryvariables can improve the precision of SOM prediction insimilar landscapes as investigated in this study.
4. CONCLUSIONS
Soil organic matter (SOM) content in the study area was foundsignificantly negative correlated with remote sensing derivedspectral color indices as the Bright Index , and Redness Indexhaving moderate correlation coefficient where as it was foundpositive low correlation with the hue index . The correlationcoefficient between the SOM and redness index was foundhighest among all indices the largest in absolute value. Thestepwise multiple regression model showed that rednessIndex(CI) was found as a statistically significant predictorvariable explaining low coefficient of determination, R2 of0.25 . Thus, it can be inferred that it was unable to obtain asatisfactory SOM prediction using a remote sensing derivedspectral color indices.
In the same time it can be suggested that the predicted SOMmap by cokriging with remote sensing covariates was animprovement over that by ordinary kriging and that by theremote sensing-based color indices in terms of describingspatial variability and reliability of the spatial estimation ofSOM. The cokriging as a spatial interpolation techniqueshowed that remotely sensed data such as Thematic Mapperimagery have the potential as healthy auxiliary variables forimproving the accuracy and reliability of SOM prediction.
The SOM content in the study area had a strong spatialdependency and its spatial concentration was found more (> 2.0
%) in the central part where as it was low (<1.0 %) in themarginal portion. In order to improve fertility status of soil andagricultural productivity, land management options should bedeveloped to enhance SOM content in this area. A valuable anduseful information for improving soil quality and managingnutrient budgets for agricultural production in the area can beprovided by the methods of prediction used in this study.
References
Ben-Dor, E. (2002 ). Quantitative remote sensing of soilproperties. Advances in Agronomy. Israel.
Chen, Y., and T. Aviad. (1990). Eff ect of humic substances onplant growth P 161–186. In P. Maccarthy et al. (ed.) Humicsubstances in soil and cropsciences: Selected readings. ASA,Madison, WI.
Chen, D., and W. Brutsaert. ( 1998). Satellite-senseddistribution and spatialpatterns of vegetation parameters over atallgrass prairie. J. Atmos. Sci. , 55:1225–1238.
Coleman T., Montgomery O. (1987) - Soil moisture, organicmatter and iron content effect on spectral characteristics ofselected Vertisols and Alfisols in Alabama. PhotogrammetricEngineering and Remote Sensing, 53: 1659-1663.
Chang, Y.H., M.D. Scrimshaw, R.H.C. Emmerson, and J.N.Lester. 1998. Geostatistical analysis of sampling uncertainty atthe Tollesbury managed retreat site in Blackwater Estuary,Essex, UK: Kriging and cokriging approach to minimisesampling density. Sci. Total Environ. 221:43–57.
Chien, Y.L., D.Y. Lee, H.Y. Guo, and K.H. Houng. 1997.Geostatistical analysis of soil properties of mid-west Taiwansoils. Soil Sci. 162:291–297.
Dawadi Durga P , Chandra P Risal, Kiran H Maskey, BalaramRijal Tuk B Thapa., 2015. Mobile Soil Test Laboratory:Experience of Soil Management Directorate to aware Farmersabout Soil Health Proceedings of the Second National SoilFertility Research Workshop “Celebrating International Yearof Soils ,2015” Healthy Soils for Healthy Life “ 24-25 March,2015, Organized by: , CIMMYTE, IRRI, Soil Science DivisionNepal Agricultural Research Council(NARC), KhumaltarLalitpur,Nepal
Dehaan, R. L. and Taylor, G. R., 2002, Field-derived spectra ofsalinized soils and vegetation as indicators of irrigation-inducedsoil salinization. Remote Sensing of Environment, 80, p 406-417. (2002).
Frisch, R. (1934). Statistical Confluence Analysis by means ofComplete Regression Systems. Oslo University, Institute ofEconomics, Publication No-5.
Gerritse and Robert G. ( 1988). Role of soil organic matter inthe Geochemical cycling of chloride and bromide. Journal ofHydrology, CSIRO, Wembley, Australia , p 83-95.
Greene W.H. (2008) - Econometric Analysis. Fourth edition,New Delhi: Dorling Kindersley, India, pp. 56-61.
Journel, A.G. and Huijbregts, CH.-J(1978), MiningGeostatistics, Academic Press Inc., London, 600 pp
The International Archives of the Photogrammetry, Remote Sensing and Spatial Information Sciences, Volume XLI-B2, 2016XXIII ISPRS Congress, 12–19 July 2016, Prague, Czech Republic
This contribution has been peer-reviewed.doi:10.5194/isprsarchives-XLI-B2-43-2016 47
Krishnan P., Butler B.J., Hummel J.W. (1981) Close-rangesensing of soil organic matter. Transactions of the AmericanSociety of Agricultural Engineers (ASAE), 24 (2): 306-311.doi: http://dx.doi.org/10.13031/2013.34246.
Kravchenko A, Bullock DG (1999) A comparative study ofinterpolation methods for mapping soil properties. AgronomyJournal 91: 393,400.
MYERS, D.E.1982, Matrix Formulation of Cokriging,Mathematical Geology, vol. 14, no. 3. pp. 249–257.
MYERS, D.E.1983, Estimation of Linear Combinations andCokriging, Mathematical Geology, vol. 1, no. 5. pp. 633–637.
Pitts M.J., Hummel J.W., Butler B.J. (1986) - Sensors utilizinglight reflection to measure soil organic matter. Transactions ofthe American Society of Agricultural Engineers (ASAE), 29(2): 422-428. doi: http://dx.doi.org/10.13031/2013.30166.
R. Mathieu and M. Pouget, 1998, Relationships betweensatellite-based radiometric indices simulated using laboratoryreflectance data and typic soil colour of an arid environment.Remote Sensing of Environment, 66, p 17-28.
R.C. Dalai and R.J. Henry. ( 1986). Simultaneous determinationof moisture, organic carbon and total nitrogen by near infraredreflectance spectroscopy. . Soil Sci Soc Am J, 50, , 120-123.
R. L. Dehaan and G. R. Taylor . ( 2003 ). Image-derivedspectral endmembers as indicators of salinization .International Journal of Remote Sensing 24(4, 20) , p 775-794.
Schulte E. E. and Bruce Hoskins. (2009). Recommended SoilTesting Procedures for the Northeastern UnitedStates:Cooperative Bulletin No. 493.
Stoner. E. R., and M. F. Baumgardner. (1980).Physicochemical, Site, alld Bidirectiollal ReflectanceFactor,Characteristics of Uniformly Moist Soils. LARS Tech.Rep. 111679. Purdue University, West Lafayette, .
Stoner, E. R., and M. F. Baumgardner. (1981). Characteristicvariations in reflectance of surface soils. Soil Sci. Soc. Am. J. 4S, :1161_1165.
Wu, Chunfa, Jiaping Wu,Yongming Luo,Limin Zhang&Stephen D. DeGloria. (2009). Spatial Prediction of SoilOrganic Matter ContentUsing Cokriging with Remotely SensedData. Soil Sci. Soc. Am. J(SSSAJ): Volume 73: Number 4 July–August , p 1206.
Yadav, V., and G. Malanson,. (2007). Progress in soil organicmatter research: Litter decomposition, modeling, monitoringand sequestration. Prog. Phys.Geogr. 31:131–154. Prog.Phys.Geogr , 31:131–154.
The International Archives of the Photogrammetry, Remote Sensing and Spatial Information Sciences, Volume XLI-B2, 2016XXIII ISPRS Congress, 12–19 July 2016, Prague, Czech Republic
This contribution has been peer-reviewed.doi:10.5194/isprsarchives-XLI-B2-43-2016 48