Embed Size (px)
Citation preview

Derivation of Reference Values for Schedule 1 of the REPPIR-2019 Regulations
Specified quantities of inventory holdings for more than 700 radionuclides

About Public Health England
Public Health England exists to protect and improve the nation’s health and wellbeing and reduce
health inequalities. We do this through world-leading science, knowledge and intelligence,
advocacy, partnerships and the delivery of specialist public health services. We are an executive
agency of the Department of Health and Social Care, and a distinct delivery organisation with
operational autonomy. We provide government, local government, the NHS, Parliament, industry
and the public with evidence-based professional, scientific and delivery expertise and support.
Public Health England
133–155 Waterloo Road
Wellington House
London SE1 8UG
T: 020 7654 8000
www.gov.uk/phe
Twitter: @PHE_uk
Facebook: www.facebook.com/PublicHealthEngland
© Crown copyright 2019
You may re-use this information (excluding logos) free of charge in any format or medium, under
the terms of the Open Government Licence v3.0. To view this licence, visit OGL. Where we have
identified any third party copyright information you will need to obtain permission from the
copyright holders concerned.
Any enquiries regarding this publication should be sent to
Centre for Radiation, Chemical and Environmental Hazards
Public Health England
Chilton, Didcot, Oxfordshire OX11 0RQ
Published May 2019
PHE publications PHE supports the UN
Gateway number: GW-387 Sustainable Development Goals

PHE-CRCE-048
This study was funded by the Department for Business, Energy and Industrial Strategy.
Centre for Radiation, Chemical and Environmental Hazards Public Health England Chilton, Didcot Oxfordshire OX11 0RQ
Approval: April 2019 Publication: May 2019
This report from the PHE Centre for Radiation, Chemical and Environmental Hazards reflects understanding and evaluation of the current scientific evidence as presented and referenced in this document.
Derivation of Reference Values for Schedule 1 of the REPPIR-2019 Regulations
Specified quantities of inventory holdings for more than 700 radionuclides
K Mortimer, P Bedwell, S Haywood and A Bexon
Abstract
This report summarises the methodology for derivation of reference values for Schedule 1 of
the REPPIR-2019 regulations. The report also discusses aspects of the underlying
assumptions, including the dose criteria applied, specifies default parameters for the
calculations, and presents the values themselves, for over 700 radionuclides.
The methodology is commensurate with scientific evidence and international good practice,
bearing in mind that simplicity and minimal non-default data inputs should be the aim for the
majority of users. The methodology only includes releases to atmosphere and duty holders
are required to undertake site-specific calculations for other feasible release pathways if these
apply.


iii
This work was undertaken under the Radiation Assessments Department’s Quality
Management System, which has been approved by Lloyd's Register Quality Assurance to
the Quality Management Standard ISO 9001:2015, Approval No: ISO 9001 - 00002655.
Report version 1.0

iv
Contents
Abstract i
1 Introduction 1
2 Content 1
3 Dose criteria used to derive the Schedule 1 values 3
4 A conservative approach 4
5 General assumptions 5
5.1 Protective actions 6
5.2 Location and habits 6
5.3 Meteorology and dispersion modelling 6
5.4 Radionuclides 8
5.5 Radioactive decay 9
5.6 Food 10
5.7 Inhalation and external exposure pathways 12
5.8 Other exposure routes 13
6 Summary table of assumptions 14
7 References 16
Appendix A Schedule 1 REPPIR-2019 values 19
Appendix B Comparison of Schedule 1 REPPIR-2019 values with Schedule 2
REPPIR-2001 values 47

Content
1
1 Introduction
Calculations were undertaken and issued by the National Radiological Protection Board
(Carey et al, 2001) to derive the reference values in Schedule 2 of the REPPIR-2001
regulations (HSE, 2002). The reference values are in the form of specified quantities of
inventory holdings for more than 700 radionuclides, derived by modelling the consequences of
pessimistic release and occupancy scenarios involving the accidental release of radioactive
substances from premises. Compliance with these values represents a simple means of
determining the applicability of REPPIR regulations. Where the quantity of any radionuclide on
the premises exceeds the specified quantity in Becquerels or, if there is more than one
radionuclide on the premises, if the sum of the quantity ratios is greater than one, REPPIR
regulations apply to those premises.
Public Health England, the successor body to NRPB, was asked by Department for Business,
Energy and Industrial Strategy (BEIS) to review the Schedule 2 assessment methodology and,
once approved, to recalculate the values. The new values are issued in Schedule 1 of
REPPIR-2019. In this report, ‘Schedule 2’ refers to the reference values associated with
REPPIR-2001 and ‘Schedule 1’ refers to the reference values associated with REPPIR-2019.
This report summarises the revised methodology, and discusses aspects of the underlying
assumptions, including the dose criteria applied. The aim of the methodology is to define a
process for the calculation of the baseline values, and to specify default parameters for these
calculations. The methodology is commensurate with scientific evidence and international
good practice, bearing in mind that simplicity and minimal non-default data inputs should be
the aim for most users. The methodology only includes releases to atmosphere and duty
holders are required to undertake site-specific calculations for other feasible release pathways
if these apply.
Based on the methodology described here, Schedule 1 values for REPPIR-2019 have been
calculated and are presented in Appendix A. These values have been compared against the
Schedule 2 values of REPPIR-2001, discussed in Appendix B.
2 Content
Department for Business Energy and Industrial Strategy (BEIS), with Health and Safety
Executive (HSE), Ministry of Defence (MOD) and Office for Nuclear Regulation (ONR), have
agreed that the 5 mSv effective dose threshold for offsite emergency planning in the UK is no
longer appropriate, and that there will be no use of a trigger dose in REPPIR-2019, but that
there will instead be an approach based on prioritising preparedness activities around those
sites with the greatest hazard. For all sites, there will be a graded and proportionate approach
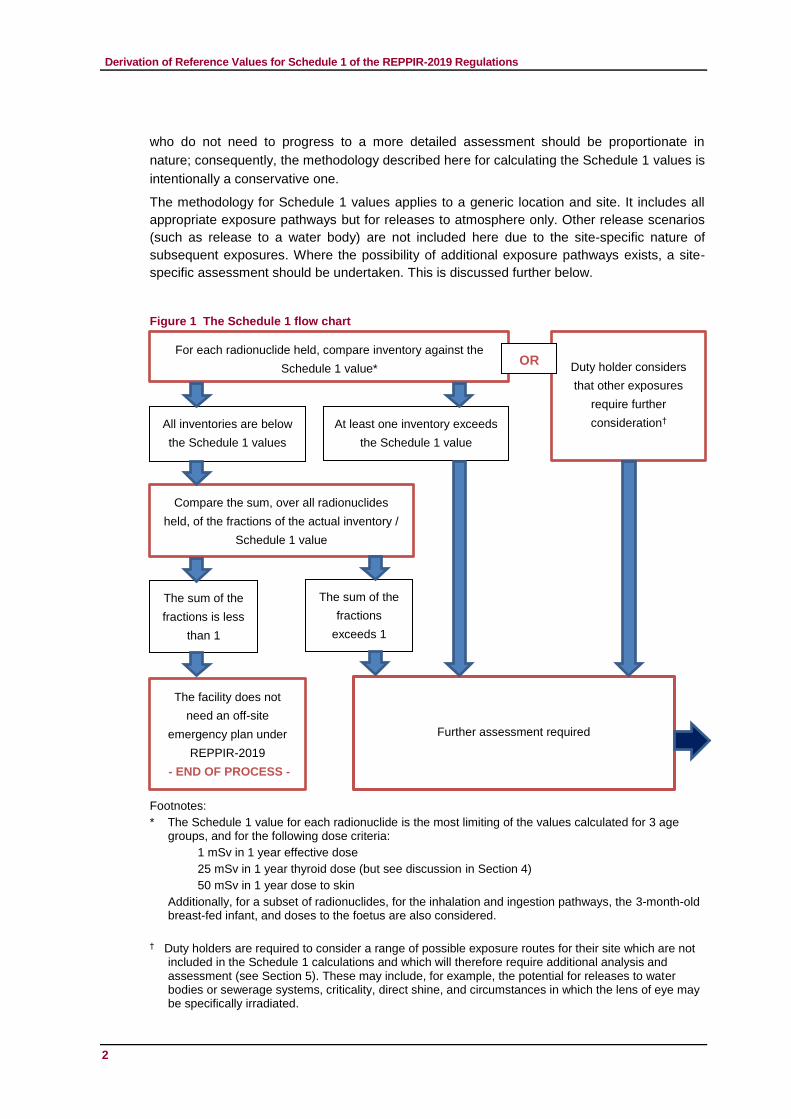
to planning. The flowchart for the process is shown in Figure 1, to clarify where Schedule 1
sits within the REPPIR-2019 process.
The requirement of Schedule 1 values is to consider emergencies resulting in members of the
public off-site receiving exposure to ionising radiation in excess of agreed dose criteria. The
dose criteria have been specified by BEIS for use in this methodology and are discussed in
the section below. The need for a screening value which can determine those duty holders
Derivation of Reference Values for Schedule 1 of the REPPIR-2019 Regulations
2
who do not need to progress to a more detailed assessment should be proportionate in
nature; consequently, the methodology described here for calculating the Schedule 1 values is
intentionally a conservative one.
The methodology for Schedule 1 values applies to a generic location and site. It includes all
appropriate exposure pathways but for releases to atmosphere only. Other release scenarios
(such as release to a water body) are not included here due to the site-specific nature of
subsequent exposures. Where the possibility of additional exposure pathways exists, a site-
specific assessment should be undertaken. This is discussed further below.
Figure 1 The Schedule 1 flow chart
Footnotes:
* The Schedule 1 value for each radionuclide is the most limiting of the values calculated for 3 age groups, and for the following dose criteria:
1 mSv in 1 year effective dose
25 mSv in 1 year thyroid dose (but see discussion in Section 4)
50 mSv in 1 year dose to skin
Additionally, for a subset of radionuclides, for the inhalation and ingestion pathways, the 3-month-old breast-fed infant, and doses to the foetus are also considered.
† Duty holders are required to consider a range of possible exposure routes for their site which are not
included in the Schedule 1 calculations and which will therefore require additional analysis and assessment (see Section 5). These may include, for example, the potential for releases to water bodies or sewerage systems, criticality, direct shine, and circumstances in which the lens of eye may be specifically irradiated.
Further assessment required
For each radionuclide held, compare inventory against the
Schedule 1 value*
Compare the sum, over all radionuclides
held, of the fractions of the actual inventory /
Schedule 1 value
All inventories are below
the Schedule 1 values
At least one inventory exceeds
the Schedule 1 value
The sum of the
fractions is less
than 1
The facility does not
need an off-site
emergency plan under
REPPIR-2019
- END OF PROCESS -
The sum of the
fractions
exceeds 1
Duty holder considers
that other exposures
require further
consideration†
OR

Dose criteria used to derive the Schedule 1 values
3
3 Dose criteria used to derive the Schedule 1 values
In the context of Schedule 1 values, there is a reduction from the previous effective dose basis
of 5 mSv in the first year, as used in Schedule 2 of REPPIR-2001, to 1 mSv in the first year.
The dose criteria have been agreed with BEIS for use in this methodology and are shown in
Table 1 together with the values used previously.
Table 1 Dose criteria (mSv in first year) to derive Schedule 1 values for members of the public
Effective Thyroid Skin Lens of eye
Schedule 1 - REPPIR-2019 1 25 50 *
Schedule 2 - REPPIR-2001 5 † 50 15
Notes:
* Lens of the eye is not included in the default Schedule 1 calculations. If the exposure pathway is deemed plausible
by the duty holder a site-specific calculation must be performed. If this is undertaken, the relevant dose limit would
remain 15 mSv in the first year, as in the 2001 Regulations.
† Thyroid doses were not included in the 2001 Schedule 2 calculations.
This methodology introduces a thyroid dose criterion. The administration of stable iodine has
the potential to reduce doses to the thyroid from radioactive iodine, and hence consideration
of the need for stable iodine planning should be considered through estimation of the dose to
the thyroid from isotopes of iodine. The use of stable iodine will only avert dose from
radionuclides of iodine and not from other radionuclides, hence the thyroid criterion relates
only to radioisotopes of iodine and not to other radionuclides which may also deliver a dose to
the thyroid. Also, the thyroid dose criterion relates only to exposure via inhalation, as stable
iodine is not administered to avert doses from ingestion.
The selection of the dose criterion of 25 mSv for the thyroid approximates to the same level of
risk (considering risk from cancer incidence which includes both fatal and non-fatal cancers,
and other detriments including a weighting for ‘quality of life detriment’) as the effective dose
criterion of 1 mSv, based on the ICRP Publication 103 (ICRP, 2007) tissue weighting factor for
the thyroid of 0.04. It is important to note that because the thyroid criterion relates to the same
level of risk as the criterion for effective dose, it is never limiting for Schedule 1 calculations, in
part because the calculations relating to the 1 mSv effective criterion include consideration of
ingestion pathways, whereas the calculations relating to the thyroid dose criterion consider
only the inhalation pathway, and also because doses to organs other than the thyroid
contribute to effective dose. It is, however, retained as a separate criterion for consistency with
potential applicability in a later or additional site-specific risk assessment (if this is required).
PHE and its predecessor bodies have specified Emergency Reference Levels (ERLs) of
averted dose for use in the planning of emergency protective actions: in particular, evacuation,
sheltering and stable iodine prophylaxis. It is the dose averted or avoided by these protective
actions that determines their benefit. The aim of ERLs is the reduction of early exposures so
that the benefits and drawbacks of each protective action are separately balanced. ERLs
relate to the dose averted in the first few days by a specific protective action from the short-
term exposure pathways only. ERLs are not intended to be limits on dose or indicators of

Derivation of Reference Values for Schedule 1 of the REPPIR-2019 Regulations
4
doses which may be ‘safely’ received by an individual, but indicate the range of levels of dose
(expected to be averted by the protective action) within which the greatest overall benefit of
taking that protective action would be maximised, taking into account the potential for harm
and disruption which arises from it.
The use of the base-line criterion of 1 mSv effective dose over the first year can be considered
in terms of the dose contour it relates to in comparison with the lower ERL for sheltering, and
also the lower ERLs for evacuation and stable iodine. The lower ERL for sheltering is 3 mSv
averted dose, so for a comparison in terms of total dose from the inhalation pathway, the
lower ERL approximates to 5 to 7.5 mSv total dose, over a few days. In general, considering a
range of releases (from very large through to smaller), the base-line criterion of 1 mSv
effective dose over the first year is more conservative in terms of the extent of a dose contour
from a generic release location, for a range of weather conditions, than the lower ERLs for
sheltering, evacuation and stable iodine. This is mostly because the 1 mSv criterion considers
doses over the whole of the first year. The same is not observed for a dose criterion of 5 to 7.5
mSv effective dose over the first year, which although generally conservative may in some
circumstances permit a possibility of a contour not extending far enough to encompass all
locations where urgent protective actions may be needed.
Similarly, the base-line criterion of 1 mSv total effective dose over the first year can be
considered in terms of how it relates to possible values for the Reference Level (ICRP, 2007)
of 20 mSv and 100 mSv effective residual dose in the first year (including doses received in
the emergency phase). Reference Levels are aimed at achieving optimised planning and
response over all exposure pathways and protective actions, encouraging ‘holistic’ planning
for all phases of the emergency, not just the urgent phase. Considering the same range of
releases, as above, the dose contours related to these values of Reference Level would
extend less far from a release location than the contour related to the base-line criterion of
1 mSv.
In summary, broad calculations indicate that the use of a criterion of 1 mSv effective dose over
the first year is likely to result in contours which encompass those resulting from the lower
ERLs and will also encompass contours relating to the national Reference Level if set at
100 mSv effective dose in the first year.
4 A conservative approach
Although the values estimated in the previous methodology (Schedule 2, REPPIR-2001) were
described as being ‘derived by modelling the consequences of a worst-case release and
occupancy accident scenario involving the release of radioactive substances from a premises ’
(Carey et al, 2001) it can be considered that there was some inconsistency in the degree of
pessimism applied in different aspects. For example, very pessimistic assumptions were made
for the amount of food consumed, the percentage of this that is assumed to be locally
obtained, and the distance of green vegetable and milk production to the release point.
Conversely, relatively pessimistic weather conditions prevailing at the time of the release were
not considered; for example, the influence of rain was not included in the calculations.
In the revised methodology, a more uniform and conservative but not extremely pessimistic
approach has been taken, corresponding approximately to the 95th percentile of the likelihood

General assumptions
5
distribution in the values relating to the relevant dose criterion. Taken collectively the resulting
values are appropriate for application as conservative screening quantities.
5 General assumptions
The methodology uses assessment tools that are well established but includes some new
approaches in the context of these calculations, in particular, regarding weather conditions.
The data and approaches recommended in the methodology are summarised in this section,
including those for meteorological data, atmospheric dispersion, food chain modelling, the
modelling appropriate for other exposure pathways (external dose, inhalation) and individual
location and habits. In particular, key assumptions regarding the source of food are discussed.
The key features of the methodology are:
• the revised Schedule 1 values are based on integrating the exposure for a period of
1 year from the time of release (the committed dose)
• the accrued dose is the sum of the annual (first year) direct external radiation dose and
the committed dose from intakes over the first year (ingestion of contaminated food, and
inhalation)
• a release fraction of 1 is assumed (i.e. that all the material in the inventory is released)
• it is assumed that the release is of a representative duration of 30 minutes and occurs at
ground level. A short duration release will give rise to higher concentrations and
depositions at the maximum point than a release which is more prolonged and which may
experience changes in weather
• the values presented are the most restrictive of the values for each radionuclide for the 3
age groups considered (1-year-old infant, 10-year-old child, 20-year-old adult).
Additionally, for a subset of radionuclides, for the inhalation and ingestion pathways, the
3-month-old breast-fed infant, and doses to the foetus were also considered
• the assumed weather conditions relate to the 95th percentile of distributions of air
concentration and deposition observed for UK sites
• the wind is assumed to blow in the direction of the exposed individual (i.e. the individual is
assumed to be at the point of maximum air concentration or deposition – depending on
pathway – at the specified distance from the discharge point)
• it is assumed that the exposed individual spends a significant proportion of their year
located at a distance of 100 m downwind of the discharge point, and it is cautiously
assumed that individuals will be outside during the entire passage of the plume
• it is further assumed that the individual obtains 100% of their green vegetables and milk
from a location 1 km from the discharge point, at the point of maximum deposition at this
distance
• for food consumption, only intakes from milk and green vegetables are considered in the
methodology. This selection is based on: (a) these 2 foodstuffs are most likely to
contribute dose in the short term as a result of releases in an emergency; (b) only a limited
number of foodstuffs are likely to be obtainable from a very close-in distance to the
discharge point (1 km); and (c) the selection of 2 foodstuffs used in the past to calculate
ingestion doses (Smith et al, 2004) – the ‘Top Two’ approach – from agricultural
production close to the site of release

Derivation of Reference Values for Schedule 1 of the REPPIR-2019 Regulations
6
The methodology for Schedule 1 applies to a generic location and site. It includes all
appropriate exposure pathways for atmospheric releases only and is, as described above,
conservative. The previous methodology included calculational methods for releases to river
and into sewers, but the Schedule 2 values in REPPIR-2001 did not actually include the effect
of these scenarios (only including releases to atmosphere). Scenarios other than releases to
atmosphere are not included in the revised methodology. Modelling assumptions and
parameters for releases to water bodies and sewers (for example, water abstraction for public
drinking water very close to the release point, and the use of water for irrigation of foodstuffs)
would vary very significantly from one location to another. Such assumptions applied
generically could result in severe limitations on inventories in circumstances where such
releases cannot arise. For this reason, duty holders are required to consider the feasibility of
pathways other than a release to atmosphere for their site, and to undertake site-specific
calculations should these circumstances be credible. Duty holders are also required to
consider other aspects of exposure which may additionally arise at their site and undertake
site-specific calculations for these circumstances if required.
5.1 Protective actions
Protective actions during the year following the release are disregarded, i.e. there is assumed
to be no sheltering, evacuation or stable iodine protective actions. In addition, no food
restrictions are assumed, even if the levels corresponding to the dose criteria exceed the
European Union maximum permitted levels of radionuclides in marketed foods currently
applicable to the UK. This is to ensure that the potential need for food restrictions should be
planned for, if necessary, through the application of the Schedule 1 values. There is also the
possibility that a person may be consuming non-marketed food from their garden, farm or
allotment; dealing with this situation could also be required in the emergency plan.
5.2 Location and habits
Regarding location assumptions, the person receiving exposure is assumed to be 100 m
downwind from the release point for all of their initial exposures (while the plume is present).
No protection factors are assumed for these exposures i.e. the person is assumed to be
outdoors during this early exposure. For the remainder of the first year the person is assumed
to be at this location 70% of the time, within a solidly-built building, and for 30% of the first
year they are assumed to be at a different location (one where they receive no dose, such as
commuting to work, time in employment or attendance at school). As above, all of the doses
are assumed to be uninfluenced by urgent protective actions (i.e. sheltering or evacuation or
stable iodine).
5.3 Meteorology and dispersion modelling
A significant change from the Schedule 2 REPPIR-2001 methodology is in the treatment of
weather and associated dispersion modelling. The earlier methodology considered only
releases occurring in Pasquill Stability Category D, which typically occurs in the UK around
65% of the time (Clarke, 1979). In addition, only dry conditions were considered. The effect of

General assumptions
7
considering rain during the release varies with exposure pathway and radionuclide. In general,
pathways which primarily depend upon concentrations in air may exhibit lower doses in wet
conditions than in dry, because of the influence of rain in lowering the concentrations in air
due to enhanced deposition. Pathways which depend primarily upon deposition on the ground
will exhibit higher doses due to the increased ground deposition occurring during rain.
There is uncertainty inherent in the choice of dispersion model, which may lead to uncertainty
in predictions greater than those associated with the parameters and assumptions used in
other parts of the methodology. Previous Schedule 2 REPPIR-2001 calculations were based
on the NRPB-R91 model (Clarke, 1979). In NRPB-W54, a short duration release methodology
(Smith et al, 2004), it was estimated that doses predicted by the NRPB-R91 model were
greater by up to a factor of about 5 at close-in distances compared to the ADMS model
(CERC, 2002). Similarly, in Bedwell et al (2011) a factor of 3 was identified between NRPB-
R91 and the NAME model for Pasquill stability category D conditions, at distances of the order
of a few kilometres, with larger factors identified for less frequent weather conditions.
For continuous discharges, it can be assumed that releases will occur in the full range of
meteorological conditions experienced at a particular site. However, for a very short release
over 30 minutes, as considered here, the meteorological conditions experienced by the
dispersing plume will be limited and are likely to result in predicted air concentrations and
depositions significantly different from those expected as a result of average meteorological
conditions. It is important that the meteorological conditions are represented in a way
appropriate to a conservative estimate of dose.
Consequently, this methodology applies a probabilistic approach to meteorology and
dispersion rather than a single atmospheric stability category. The Met Office’s NAME model
(Jones et al, 2007) together with PHE’s probabilistic accident consequence tool (Charnock et
al, 2013) PACE, have been used to analyse historical UK meteorological data to determine
time integrated air concentrations and deposition concentrations per unit release for use in this
methodology. The values selected correspond to the 95th percentile of weather conditions.
Table 2 shows the activity concentrations in air and on the ground applied in this methodology,
based on this analysis.
As described above, the deposited activity concentrations per unit release correspond to the
95th percentile of weather conditions. Precipitation was observed in all scenarios considered in
the derivation of these concentrations, thus the deposition is dominated by wet rather than dry
deposition processes. Wet deposition was modelled using the Met Office’s NAME model.
NAME applies a scavenging coefficient approach (Webster and Thomson, 2014), which is
considered to be a function of precipitation rate, type of precipitation (rain and snow), and
deposition process (rainout and washout); however, the model currently assumes no
dependency on radionuclide or on physical or chemical form. Other than for iodine isotopes,
data describing the wet deposition of chemical forms of radionuclides is very sparse and is
insufficient to justify the use of multiple scavenging coefficients. For iodine, on the basis of the
methods detailed in ADMLC (2001) and the precipitation rates corresponding to the 95th
percentile of weather conditions, assuming 1 µm particles in the modelling of wet deposition is
always at least as cautious as considering the 2 primary chemical forms of iodine (elemental
iodine vapour and methyl iodide). For elemental iodine, the assumption of 1 µm particulate
may be less conservative than for other radionuclides; however, this is smaller in comparison
to the conservatism elsewhere in the overall methodology. For these reasons and for
simplicity, a single scavenging coefficient applicable to 1 µm particles has been assumed for

Derivation of Reference Values for Schedule 1 of the REPPIR-2019 Regulations
8
all radionuclides. Exceptions to this approach are for noble gases, which are assumed not to
be deposited, and for tritium and for carbon isotopes, which are particularly mobile in the
environment, and for which an alternative to the scavenging coefficient method for determining
deposition is employed.
Table 2 Time integrated activity concentration in air and deposited activity concentration used to derive Schedule 1 values for members of the public
100 m from release location* 1000 m from release location*
Time integrated activity concentration
in air (Bq s m-3 per Bq release) 1.1 10-4 1.2 10-5 †
Deposited activity concentration
(Bq m-2 per Bq release) 1.4 10-7 3.0 10-8
Notes:
* The value shown for each distance from the release location represents the maximum activity concentration in air
or on the ground at that distance, based on historical weather data analysed for a selection of UK locations. † Activity concentration in air at 1000 m from the release location, required for ingestion dose estimates for 11C, 14C
and 35S in gaseous or vapour forms (only).
5.4 Radionuclides
The radionuclides for which Schedule 1 values have been calculated are:
• for the purposes of continuity with the previous REPPIR legislation, all the radionuclides
that appeared in Schedule 2 REPPIR-2001 are included
• for consistency with other legislation, all the radionuclides that appear in the Ionising
Radiations Regulations 2017 are included
• the International Commission on Radiological Protection (ICRP) provides public inhalation
and ingestion dose coefficients in its Publication 119 (ICRP, 2012). All the radionuclides in
this publication are included
Since the publication of REPPIR 2001, ICRP has renamed some radionuclides in order to
better identify ground and excited states. In ICRP Publication 119, Table 2.3 shows those
radionuclides that have been renamed. The radionuclides included in this report follow this
naming convention. For example:
• in REPPIR 2001, 89Nb appeared as both a short-lived and long-lived form, with half-lives
of 66 minutes and 122 minutes, respectively. ICRP has renamed these radionuclides, so
that the short-lived form is now 89mNb, and the long-lived form is now 89Nb
• radionuclides which exist in a metastable state are given an “m” suffix e.g. 89mNb. Where a
radionuclide has 2 metastable states, the one with the higher energy is identified with an
“n” suffix, and the one with the lower energy is identified with an “m” suffix, e.g. 190nIr and 190mIr
• new data has been used to identify the ground and excited state of radionuclides. In the
case of 102Rh, what was previously 102Rh is now 102mRh, and what was 102mRh is now 102Rh

General assumptions
9
As potential users of Schedule 1 values may be unfamiliar with this renaming convention, and
to avoid doubt, all the radionuclides are listed below along with their half-life (taken from ICRP
Publication 107 (ICRP, 2008)), thus definitively identifying each radionuclide.
When a radionuclide travels through the environment and interacts with a person’s body, the
dose imparted will depend on the radionuclide physical and chemical form. For example,
isotopes of carbon (11C, 14C) may appear in particulate form, or as carbon dioxide, carbon
monoxide, methane gas, or as carbon vapour. After inhaling particulates, radionuclides may
be absorbed by the lung at different rates: fast, medium, slow. ICRP provides dose
coefficients for radionuclides in their various forms. Schedule 1 values are calculated for all
forms where possible and practical.
The limited availability of data has, in some cases, restricted the range of Schedule 1 values
as a function of chemical form, for single radionuclides. For example, inhalation and ingestion
dose coefficients have not been identified for organically bound tritium in gaseous or vapour
form and therefore such a form has not been included. For some radionuclides, such as 35S,
the limited availability of data has resulted in a discord for different chemical forms and
different exposure pathways. For example, for gaseous forms of 35S, data availability restricts
consideration of sulphur dioxide and carbon disulphide to the inhalation exposure pathway
only, and consideration of hydrogen sulphide and carbonyl sulphide to the ingestion exposure
pathway only. Due to a lack of information describing how these chemical forms behave in the
environment, and more specifically a lack of information describing the transformation
between different chemical forms in the environment, no summation of contributions for
chemically consistent forms over the range of exposure pathways could be performed.
Therefore, in such cases, a conservative approach was applied, whereby the chemical form
resulting in the most conservative contribution to dose for each exposure pathway was
identified and the respective doses summed (even though this may not reflect the chemical
processes which occur in the environment). Thus, for each radionuclide, the most restrictive
value is presented, but following the convention in REPPIR 2001, values for other forms are
sometimes given.
5.5 Radioactive decay
Once radionuclides are released, they will continue to decay according to their radioactive
half-lives (ICRP Publication 107), but any progeny radionuclides that are formed following
radioactive decay of parent radionuclides in the air or on the ground are not taken into
account. So, for example, progeny are not taken into account in the external dose models for
exposure to the plume, or from exposure to radioactive material deposited on the skin or on
the ground. In particular, short-lived progeny, which may be present in the release and
perhaps in equilibrium with their parent (e.g. 137mBa from 137Cs), are not taken into account.
However, once inhaled or ingested, progeny radionuclides that are formed within the body are
taken into account via the various dose coefficients (ICRP Publication 119). Similarly, any
progeny radionuclides that are formed within foods before they are consumed are taken into
account in the food chain model (see below), although the extent of this differs for some
radionuclides due to the underlying modelling.

Derivation of Reference Values for Schedule 1 of the REPPIR-2019 Regulations
10
5.6 Food
To predict the consequences of the deposition of radioactive material onto land, food chain
model results are required. The food chain model results used in this methodology are time
integrated activity concentrations in food per unit deposit. The time integrated concentrations
estimated by the food chain model are then combined with habit data and ingestion dose
coefficients to calculate doses from ingestion of terrestrial foods. The calculation of doses from
the ingestion of foods then requires 3 further assumptions: ingestion rates, local production
rates, and agricultural practices.
The individual ingestion rates of green vegetables and cow’s milk are taken from Smith and
Jones (2003), and are summarised in Table 3. The intake rates are representative of people
who consume at the 95th percentile rate of intake (rather than the previously used 97.5th
percentile) of the individual annual ingestion rates for green vegetables and milk. Smith and
Jones (2003) concluded that it is very unlikely that individuals will consume more than 2 foods
at enhanced rates, and furthermore only a small area will be available for production of food at
the point of maximum deposition at 1 km from the discharge. Hence, in this methodology only
ingestion from green vegetables and cow’s milk are considered.
Table 3 Ingestion rates based on national food surveys used in methodology *
Food Ingestion rates †
Adult Child Infant
Green vegetables (kg y-1) 35 15 9.5
Milk (litres y-1) 210 220 290
Notes
* Smith and Jones (2003) † These ingestion rates may be modified by the fraction of food that is locally produced. The fraction used in the
methodology is 100 percent
The PHE model FARMLAND (Brown and Simmonds, 1995) is used to estimate the transfer
into foodstuffs over a year from the time of deposition, with conservative assumptions
regarding time of harvest and the amount of food assumed to be obtained locally. There is
assumed to be no loss of activity due to food preparation and cooking (so, for example, a
cabbage is assumed to be eaten with all its outside leaves and without either washing or
cooking). FARMLAND predicts the activity (Bq y kg-1 per Bq m-2 deposited) integrated over the
first 365 days after the release for all radionuclides considered (for green vegetable and milk).
Pessimistic estimates of Bq y kg-1 per Bq m-2 values for green vegetables and milk were
estimated for the radionuclides not considered in FARMLAND, except:
• time integrated activity concentrations of tritium (3H) in food per unit deposit have been
taken from the model TRIF (Higgins et al, 1996), conservatively assuming no atmospheric
losses of tritium (i.e. no disparity as a function of weather or distance downwind) and a
single conservative value as a function of the chemical and physical form

General assumptions
11
• an approach detailed in Smith et al (1998) has been used to calculate radioactivity
concentrations of 11C and 14C in green vegetables, scaling by the ratio of green vegetable
versus milk specific activity (as detailed in Smith and Simmonds (2009)) to calculate
radioactivity concentrations of 11C and 14C in milk (assuming equilibrium in the activity
between the 2 foodstuffs). This approach applies to isotopes of carbon in gaseous and
vapour form only
• Smith et al (2004) consider an approach for estimating the uptake of gaseous forms
(specifically CO35S and H235S) of 35S via plant leaves using the SGAS model. This
approach is applied in this methodology to estimate the time integrated activity
concentrations in food per unit time integrated activity concentration in air
It should be noted that the use of the FARMLAND model replaces the approach applied in the
previous methodology for green vegetables, where sophisticated foodchain modelling was not
applied. The simple approach adopted previously was based on the percentage of deposit
intercepted by crops. In the previous methodology, FARMLAND was applied in the estimation
of activity concentrations in milk, but only for a limited number of radionuclides.
It is necessary to consider the percentage of each foodstuff that is assumed to be locally
produced. It is assumed here that only the foods which are of local origin will contain
radionuclides resulting from the release (in this context, ‘local’ means produced at a single
point centred at 1 km of the discharge point, at the point of maximum deposition at this
distance). Clearly, there is a limit to how much food can be produced at one location and in
reality, the foods consumed by the great majority of individuals will come from a much wider
area. There is also the question of the size of the area required to produce the food. In the
case of green vegetables, the area required to sustain a small number of individuals for a
short period may be quite small, but for milk the area will be larger. The assumption in the
previous methodology that an area of approximately 1 km2 is needed to produce enough food
to support a few individuals, with a distance of 0.5 km being used if the food production area
lies immediately adjacent to the point of discharge, does not take into account the minimum
distance of agricultural production from the point of the release, which is likely to be at least a
hundred metres. This methodology adopts a less extreme but still very conservative approach
to the issue of locally sourced food. It is assumed that the exposed individual obtains all of
their milk and green vegetables for the year from a location centred on 1 km downwind of the
discharge point. The methodology implicitly assumes that green vegetables are in harvest
throughout the year, and that the release occurs during the summer months when cows are
outdoors grazing pasture, which is clearly an additional cautious assumption.
Other foods in the diet are assumed to be uncontaminated. It is very unlikely that individuals
will source all their grain, beef and sheep meat from the close-in distance considered (1 km);
inclusion of these would make the ingestion dose estimates extremely unrealistic. In particular,
there is no evidence to indicate that grain in the UK is grown, milled and consumed on a very
local scale. As there has been an increase in recent years in the non-commercial keeping of
hens for egg production, the possible effect of egg-producing hens being located at 1 km from
the release point, obtaining a significant portion of their diet from grass at that point, and then
supplying an individual with eggs throughout the year at a high rate of consumption, has been
investigated. This was found to not significantly alter the Schedule 1 values, for any of the
radionuclides examined (data on the transfer from a hen’s diet to eggs is only available for a
limited number of radionuclides), and this pathway has therefore not been considered further.

Derivation of Reference Values for Schedule 1 of the REPPIR-2019 Regulations
12
Ingestion dose coefficients account for the contribution to ingestion dose made by progeny
following the intake of the parent radionuclide. The growth of progeny in foods prior to
ingestion is only included in FARMLAND if the dose from the subsequent ingestion of the
progeny is a significant fraction of the dose from the parent. It is considered only necessary to
include 2 progeny. These are 125mTe (from 125Sb) which contributes significantly to the
committed effective dose over both the short and longer term, and 241Am (from 241Pu) which
makes a significant contribution over the longer term only.
5.7 Inhalation and external exposure pathways
Non-food exposure routes are external exposure (to the plume or deposited material), and
inhalation of the plume.
For both these pathways it is assumed that the exposed individual is located at a distance of
100 m downwind from the release location. The assumption in the methodology is that the
release occurs at ground level with no associated energy. Under these circumstances, it is
conservative to assume that the individual is located at 100m. For elevated release points, the
peak concentration in air would be further downwind, but that does not apply to the conditions
considered here. Location and habit related assumptions are described below.
The dose from inhalation of the plume is calculated using time integrated activity
concentrations in air, habit data and inhalation dose coefficients. Inhalation rates are
summarised in Table 4.
External exposure to the plume only occurs during the passage of the plume but external
exposure to material deposited on the ground occurs after the plume has passed and may
well persist throughout the first year of exposure for long-lived radionuclides. The external
exposure from a unit deposit of radioactive material will vary with time due to migration
through the soil and radioactive decay. Dose rate per unit deposit values were derived from
Veinot et al (2017). Dose rate coefficients account for the contributions from gamma rays,
annihilation quanta and hard X-rays, assuming a source plane at depth 0.3 cm and accounting
for the presence of vegetation, surface irregularities, and particle movement due to
weathering. Beta doses to skin, and estimation of the bremsstrahlung dose were also
considered. Values of dose rate per unit activity concentration in air were derived from
Bellamy et al (2017). Contributions from gamma rays (photons), beta electrons, discrete
electrons (internal conversion and auger electrons) and bremsstrahlung were all estimated
and summed.
Skin areas were assumed to be those areas of the head plus the areas of the hands that are
usually exposed to ultra-violet radiation (UVR) from the Sun, and were based on values
presented in ICRP Publication 89 (ICRP, 2002) and EPA (EPA, 1997). ICRP Publication 89
considers skin thickness as a function of age and skin region. Conservative (i.e. thinner) skin
thicknesses more akin to the face than the palms of the hands and fingers were considered
and derived. On the basis of such skin thicknesses, skin equivalent dose rates to the basal
layer of the skin epidermis for beta irradiation from Cross et al (1992) and Kocher and
Eckerman (1987) were assumed for adults, and infants and children, respectively. It was also
assumed that material deposits on the skin at the same rate as to the ground and resides on
the skin for a period of 12 hours before being washed off.

General assumptions
13
There is a significant difference between the skin areas considered in this methodology and
those assumed previously. The previous methodology considered the exposure of skin
relative to the total (whole body) skin area and did not differentiate between UVR and non-
UVR exposed skin. This methodology considers the exposure of skin relative to the total UVR
exposed skin area, and therefore does differentiate between UVR and non-UVR exposed skin.
This is considered appropriate because the considered areas of exposed skin are
predominantly UVR exposed skin areas. This difference is compounded by the previous
methodology assuming only a very small skin area is exposed (approximating to the area of
the face). In the new methodology, the area of contaminated skin approximates to the area of
the whole head plus the area of the hands.
5.8 Other exposure routes
The calculations included in the Schedule 1 methodology are explicitly linked to releases to
atmosphere. Other exposure routes have not been included in the revised methodology, as
discussed above, although there was a dose assessment methodology included for several
other exposure routes in NRPB-M1311 (Carey et al, 2001). For example, Table 3 of NRPB-
M1311 (Carey et al, 2001) indicates that the most restrictive exposure pathway and release
scenario for isotopes of cobalt is the external exposure from conditioned soil from the sewage
treatment works to members of the public, if such an exposure pathway is plausible, and
similarly the most restrictive exposure pathway and release scenario for 192Ir is the external
exposure to a sewage treatment worker from the sewage tank. However, in the transposition
of the NRPB-M1311 values into Schedule 2 of REPPIR 2001 only the results of the
atmospheric assessments were included and the results for river exposures, sewer worker
and public sewerage doses were not taken into account in the Schedule 2 values.
Duty holders should consider the possibility of other exposure routes than atmospheric
releases, for example via releases to rivers or sewers. This may require consideration of
potential occupational exposure of (for example) sewerage workers. Also, pathways not
included explicitly in these calculations should be taken into account if the possibility of them
exists, for example exposure of the lens of the eye, exposure by direct shine or criticality. This
includes consideration of the full impact of radionuclide progeny where this may be of
significance in site-specific circumstances (as discussed above, progeny are considered in
parts of the calculations and in the estimation of Schedule 1 values, but not all elements of the
calculation fully consider all progeny and in specific circumstances this may influence the dose
received).
If required, an assessment of potential exposure of members of the public from a release to
sewers should consider inadvertent ingestion of conditioned soil, inhalation of resuspended
conditioned soil, external irradiation from conditioned soil and ingestion of animal products
from sewage sludge applied to farmland. An assessment of potential dose to sewage workers
should consider the inadvertent ingestion of sewage sludge, inhalation of resuspended sludge
and external irradiation above the sewage tanks.

Derivation of Reference Values for Schedule 1 of the REPPIR-2019 Regulations
14
6 Summary table of assumptions
Table 4 shows a summary of the assumptions in this methodology, together with differences
between this methodology and the Schedule 2 REPPIR-2001 methodology.
Table 4 Tabulated summary of the Schedule 1 REPPIR-2019 assessment methodology and comparison with Schedule 2 REPPIR-2001 method and values
Calculation of Schedule 2 values for REPPIR-2001
Calculation of Schedule 1 values for REPPIR-2019
Dose criteria (mSv y-1)
Effective dose threshold (mSv y-1) 5 1
Thyroid dose threshold (mSv y-1) none 25
Skin dose threshold (mSv y-1) 50 50
Lens of the eye dose threshold
(mSv y-1)
15 (but not reported as limiting in
the Schedule 2 values)
Calculations no longer in the default
Schedule 1 values
Locations
Location of the individual 100 m throughout plume
passage, and 100 m for 10% of
the first year thereafter
100 m throughout plume passage,
and 100 m for 70% of the first year
thereafter
Location of food production 500 m 1 km
Atmospheric Dispersion Model (ADM) Approach
Gaussian, NRPB-R91:
Pasquill stability category D
without rain
Probabilistic analysis of historical UK
meteorological data using NAME and
PACE, to estimate 95th percentile
concentrations
Habit Data
Inhalation rate Infant: 6.0 x 10⁻⁵ m3 s-1
Child: 1.8 x 10⁻⁴ m3 s-1
Adult: 2.3 x 10⁻⁴ m3 s-1
(Robinson, 1996)
Infant: 8.6 x 10⁻⁵ m3 s-1
Child: 2.4 x 10⁻⁴ m3 s-1
Adult: 3.0 x 10⁻⁴ m3 s-1
Breast-fed infant: 5.3 x 10⁻⁵ m3 s-1
(ICRP, 1994)
Occupancy (% of time spent at
location)
10% occupancy assumed for
groundshine calculation
100% occupancy assumed for all
other exposure pathways
70% occupancy assumed for
groundshine calculation
100% occupancy assumed for all
other exposure pathways
Location/shielding factors
(protection offered at the location)
None No protection assumed during plume
passage
For the remainder of the 1st year, 0.1
assumed for groundshine calculation
while at 100 m; corresponding to
residence in a solidly built building
No protection assumed for all other
pathways for the remainder of the 1st
year while at 100 m
Area of contaminated skin Adult face: 100 cm2
Child face: 53 cm2
Infant face: 22 cm2
(ICRP, 1975)
Adult: 2325 cm2
Child: 1811 cm2
Infant: 1106 cm2
(ICRP, 2002) and (EPA, 1997)
Total (UVR-exposed) skin area Total skin area:
Adult: 1.8 x 104 cm2
Child: 9.6 x 103 cm2
Infant: 3.9 x 103 cm2
Total UVR-exposed skin area:
Adult: 3000 cm2
Child: 2100 cm2
Infant: 1100 cm2

Summary table of assumptions
15
Calculation of Schedule 2 values for REPPIR-2001
Calculation of Schedule 1 values for REPPIR-2019
(ICRP, 1975) (ICRP, 2002)
Interception factor and
subsequent weathering of activity
on green vegetables
0.016
(Brown and Simmonds, 1995)
Included via the FARMLAND model
(Brown and Simmonds, 1995)
Fraction of activity remaining on
and in food following preparation
Assume there are no preparation
losses
Included via the FARMLAND model
(Brown and Simmonds, 1995)
Ingestion rate Green veg: - Adult: 80 kg y-1
- Child: 35 kg y-1
- Infant: 15 kg y-1
Milk: - Adult: 240 L y-1
- Child: 240 L y-1
- Infant: 320 L y-1
Byrom et al (1995) – 97.5th
percentile ingestion rate
Green veg: - Adult: 35 kg y-1
- Child: 15 kg y-1
- Infant: 9.5 kg y-1
Milk: - Adult: 210 L y-1
- Child: 220 L y-1
- Infant: 290 L y-1
Smith and Jones (2003)– 95th
percentile ingestion rate
Dose Calculations
Inhalation & ingestion dose
coefficients
ICRP (1996) (for members of the
public)
ICRP (2012) for effective dose
coefficients, ICRP (1996) for thyroid
dose coefficients, ICRP (2001) for
dose coefficients to the foetus and
ICRP (2004) for dose coefficients to
the breast fed infant (all for members
of the public)
Lung absorption types F, M & S F, M & S
External from cloud dose
coefficients
Average beta and gamma
energies per disintegration, and
dose per activity concentrations
per energy (Harvey et al, 1993) –
however this reference,
references NRPB/CEA (1979) as
the source of the dose (rate) per
activity concentrations per energy
Adult, 10 year old child and 1 year old
infant effective dose rate per unit
activity concentration in air values
derived from (Bellamy et al, 2017)
External from ground dose
coefficients
Effective dose rate 1 m above an
infinite plane for beta and gamma
radiation. From: (Kocher, 1983)
and Federal Guidance Report 12
(Eckerman and Ryman, 1993)
Adult, 10 year old child and 1 year old
infant effective dose rate per unit
deposit values derived from (Veinot et
al, 2017)
Skin dose coefficients Gamma and beta dose rate for
skin (Harvey et al, 1993) –
however this references Chaptinel
et al (1988) and Kocher and
Eckerman (1987) as the source of
the dose rates per unit deposit for
gamma irradiation and beta
irradiation, respectively
Skin equivalent dose rates for beta
irradiation only. Cross et al (1992) is
the primary reference for adult
coefficients; Kocher and Eckerman
(1987) is the primary reference for 10
year old child and 1 year old infant
coefficients)
Organ/tissues Effective and skin Effective, skin & thyroid
Age groups 1 year old, 10 year old and adult
only
Primarily adult, 10 year old child and
1 year old infant, but also foetus and
breast fed infant for a subset of
radionuclides
Dose integration period Inhalation & external from cloud:
30 minutes
External from ground and
ingestion: 1 year
Skin: 12 hours
Inhalation & external from cloud:
30 minutes
External from ground & ingestion:
1 year
Skin: 12 hours
Dose description Committed dose (assumed to age
70) and equivalent dose to skin
Committed effective dose to age 70
years and committed equivalent dose
to age 70 years

Derivation of Reference Values for Schedule 1 of the REPPIR-2019 Regulations
16
7 References
ADMLC (2001). Annual Report 1998/99. Atmospheric Dispersion Modelling Liaison Committee, Chilton, NRPB-R322.
Bedwell P, Wellings J, Haywood SM, Hort M, Jones AR and Thomson DJ (2011). Intercomparison of the R91
Gaussian Plume Model and the UK Met Office's Lagrangian Particle NAME III Model in the Context of a Short-
duration Release. Health Protection Agency, Chilton, HPA-CRCE-029.
Bellamy MB, Veinot KG, Hiller MM, Dewji SA, Eckerman KF, Easterly CE, Hertel NE and Leggett RW (2017).
Effective Dose Rate Coefficients for Immersions in Radioactive Air and Water. Radiation Protection Dosimetry
174(2), 275-286.
Brown J and Simmonds JR (1995). FARMLAND: A Dynamic Model for the Transfer of Radionuclides through
Terrestrial Foodchains. NRPB, Chilton, NRPB-R273.
Byrom J, Robinson CA, Simmonds JR, Walters B and Taylor RR (1995). Food Intake Rates for use in Generalised
Radiological Dose Assessments. Journal of Radiological Protection 15(4), 335-341.
Carey AD, Smith KR, McDonnell CE, Mobbs SF, Mansfield PA and Oatway WB (2001). Calculations to assist in the
revision of IRR-85 with respect to special hazard assessments (REPPIR Schedule 2). NRPB, Chilton, NRPB-
M1311.
CERC (2002). ADMS Version 3.1. Cambridge Environmental Research Consultants.
Chaptinel Y, Durand F, Piechowski J and Menoux B (1988). Dosimetry and therapy of skin contamination. CEA-R-
5441.
Charnock TW, Bexon A, Sherwood JC, Higgins N and Field SJ (2013). PACE: A geographic information system
based level 3 probabilistic accident consequence evaluation program. ANS PSA 2013 International Topic
Meeting on Probabilistic Safety Assessment and Analysis. Columbia, SC, American Nuclear Society.
Clarke RH (1979). The first report of a Working Group on Atmospheric Dispersion: A model for short and medium
range dispersion of radionuclides released to the atmosphere. NRPB, Chilton, NRPB-R91.
Cross WG, Freedman NO and Wong PY (1992). Beta ray dose distributions from skin contamination. Radiation
Protection Dosimetry 40(3), 149-168.
Eckerman KF and Ryman JC (1993). External exposure to radionuclides in air, water and soil. US EPA, Federal
Guidance Report No 12, EPA-402-R-93-081.
EPA (1997). Exposure Factors Handbook: general factors. EPA/600/P-95/002Fa.
Harvey MP, Mobbs SF, Cooper JR, Chapuis AM, Sugier A, Schneider T, Lochard J and Janssens A (1993). Principles
and methods for establishing concentrations and quantities (exemption values) below which reporting is not
required in the European Directive. E. Commission, Luxembourg.
Higgins NA, Shaw PV, Haywood SM and Jones JA (1996). TRIF: A Dynamic Model for Predicting the transfer of
Tritium through the Terrestrial Foodchain. Chilton, NRPB-R278.
HSE (2002). A guide to the Radiation (Emergency Preparedness and Public Information) Regulations 2001.
ICRP (1975). Reference Man: Anatomical, Physiological and Metabolic Characteristics. ICRP Publication 23. Report
of the Task Group on Reference Man.
ICRP (1994). Human respiratory tract model for radiological protection. ICRP Publication 66. Annals of the ICRP 24(1-
3).
ICRP (1996). Age-dependent doses to members of the public from intake of radionuclides: Part 5 Compilation of
ingestion and inhalation dose coefficients. ICRP Publication 72. Annals of the ICRP 26(1).
ICRP (2001). Doses to the Embryo and Fetus from Intakes of Radionuclides by the Mother. ICRP Publication 88.
Annals of the ICRP 31(1-3).
ICRP (2002). Basic Anatomical and Physiological Data for Use in Radiological Protection: Reference Values. ICRP
Publication 89. Annals of the ICRP 32(3-4).
ICRP (2004). Doses to Infants from Ingestion of Radionuclides in Mothers' Milk. ICRP Publication 95. Annals of the
ICRP 34(3-4).
ICRP (2007). The 2007 Recommendations of the International Commission on Radiological Protection. Publication
103. Annals of the ICRP 37(2-4).
ICRP (2008). Nuclear Decay Data for Dosimetric Calculations. ICRP Publication 107. Annals of the ICRP 38(3), 1.
ICRP (2012). Compendium of dose coefficients based on ICRP Publication 60. Publication 119. Annals of the ICRP
41(Suppl.).
Jones AR, Thomson DJ, Hort M and Devenish B (2007). The U.K. Met Office's next-generation atmospheric
dispersion model, NAME III. Proceedings of the 27th NATO/CCMS International Technical Meeting on Air
Pollution Modelling and its Application. C. Borrego and A.-L. Norman, Springer: 580-589.
Kocher DC (1983). Dose rate conversion factors for external exposure to photons and electrons. Health Physics
45(3), 665-686.

References
17
Kocher DC and Eckerman KF (1987). Electron dose rate conversion factors for external exposure of the skin from
uniformly deposited activity on the body surface. Health Physics 53(2), 135-141.
NRPB/CEA (1979). Methodology for evaluating the radiological consequences of radioactive effluents released in
normal operations. Luxembourg, Doc No V/3865/1/79.
Robinson CA (1996). Generalised Habit Data for Radiological Assessments. Chilton. NRPB-M636
Smith JG, Bedwell P, Walsh C and Haywood SM (2004). A Methodology for Assessing Doses from Short-Term
Planned Discharges to Atmosphere. NRPB-W54.
Smith JG and Simmonds JR (2009). The methodology for assessing the radiological consequences of routine
releases of radionuclides to the environment used in PC-CREAM 08. HPA, Chilton, HPA-RPD-058.
Smith KR, Brown J, Jones JA, Mansfield PA, Smith JG and Haywood SM (1998). Uncertainties in the assessment of
terrestrial foodchain doses. Chilton. NRPB-M922
Smith KR and Jones AL (2003). Generalised Habit Data for Radiological Assessments. NRPB, Chilton, UK, NRPB-
W41.
Veinot KG, Eckerman KF, Bellamy MB, Hiller MM, Dewji SA, Easterly CE, Hertel NE and Manger R (2017). Effective
dose rate coefficients for exposure to contaminated soil. Radiat Environ Biophys 56(3), 255-267.
Webster HN and Thomson DJ (2014). The NAME wet deposition scheme. Forecasting Research Technical Report
584.


Appendix A
19
Appendix A Schedule 1 REPPIR-2019 values
Notes
Radionuclide: named according to the ICRP publication 107 naming convention. In particular, “m” and “n” suffixes are used to
identify radionuclides with multiple metastable states. If a radionuclide has changed its name since REPPIR 2001, its previous
name is additionally given.
Half life: from ICRP publication 107 - given to definitively identify each radionuclide. Mixed units are used: (y)ears, (d)ays,
(h)ours, (m)inutes, (s)econds.
Form: where ICRP provides a dose coefficient for a radionuclide in a particular chemical form, an activity (Bq) for that chemical
form has been additionally listed.
Radionuclide Half-life Form Revised value (Bq)
REPPIR 2001 value (Bq)
REPPIR2001
radionuclide
name (if
different)
Factor by which value has increased or decreased
(rounded to nearest
whole number)
Actinium
Ac-224 2.78 h
2 x 10¹¹ 2 x 10¹¹
Same
Ac-225 10.0 d
3 x 1009 3 x 1009
Same
Ac-226 29.37 h
2 x 10¹⁰ 2 x 10¹⁰
Same
Ac-227 21.772 y
5 x 1007 4 x 1007
1
Ac-228 6.15 h
7 x 10¹¹ 5 x 10¹¹
1
Aluminium
Al-26 7.17 x 10⁵ y
6 x 10¹¹ 7 x 10¹⁰
9
Americium
Am-237 73.0 m
2 x 10¹⁴ 4 x 10¹²
50
Am-238 98 m
9 x 10¹³ 6 x 10¹²
15
Am-239 11.9 h
3 x 10¹³ 2 x 10¹²
15
Am-240 50.8 h
1 x 10¹³ 4 x 10¹²
3
Am-241 432.2 y
3 x 1008 3 x 1008
Same
Am-242 16.02 h
1 x 10¹² 1 x 10¹²
Same
Am-242m 141 y
3 x 1008 3 x 1008
Same
Am-243 7.37 x 10³ y
3 x 1008 3 x 1008
Same
Am-244 10.1 h
7 x 10¹² 2 x 10¹²
4
Am-244m 26 m
2 x 10¹⁴ 2 x 10¹⁴
Same
Am-245 2.05 h
1 x 10¹⁴ 2 x 10¹²
50
Am-246 39 m
9 x 10¹³ 1 x 10¹²
90
Am-246m 25.0 m
1 x 10¹⁴ 2 x 10¹²
50
Antimony
Sb-115 32.1 m
2 x 10¹⁴ 2 x 10¹²
100
Sb-116 15.8 m
9 x 10¹³ 2 x 10¹²
45
Sb-116m 60.3 m
4 x 10¹³ 2 x 10¹²
20
Sb-117 2.80 h
3 x 10¹⁴ 1 x 10¹³
30

Derivation of Reference Values for Schedule 1 of the REPPIR-2019 Regulations
20
Radionuclide Half-life Form Revised value (Bq)
REPPIR 2001 value (Bq)
REPPIR2001
radionuclide
name (if
different)
Factor by which value has increased or decreased (rounded to nearest
whole number)
Sb-118m 5.00 h
3 x 10¹³ 7 x 10¹²
4
Sb-119 38.19 h
1 x 10¹⁴ 1 x 10¹³
10
Sb-120 15.89 m
3 x 10¹⁴ 2 x 10¹² Sb-120s 150
Sb-120m 5.76 d
7 x 10¹² 3 x 10¹² Sb-120l 2
Sb-122 2.7238 d
5 x 10¹² 2 x 10¹²
3
Sb-124 60.20 d
2 x 10¹² 4 x 10¹¹
5
Sb-124n 20.2 m
1 x 10¹⁵ 4 x 10¹² Sb-124ml 250
Sb-125 2.75856 y
2 x 10¹² 4 x 10¹¹
5
Sb-126 12.35 d
3 x 10¹² 1 x 10¹²
3
Sb-126m 19.15 m
1 x 10¹⁴ 2 x 10¹²
50
Sb-127 3.85 d
4 x 10¹² 2 x 10¹²
2
Sb-128 9.01 h
1 x 10¹³ 2 x 10¹² Sb-128l 5
Sb-128m 10.4 m
1 x 10¹⁴ 1 x 10¹² Sb-128s 100
Sb-129 4.40 h
2 x 10¹³ 2 x 10¹²
10
Sb-130 39.5 m
4 x 10¹³ 1 x 10¹²
40
Sb-131 23.03 m
5 x 10¹³ 2 x 10¹²
25
Argon
Ar-37 35.04 d
2 x 10²⁰ 4 x 10¹⁷
500
Ar-39 269 y
4 x 10¹⁶ 2 x 10¹⁶
2
Ar-41 109.61 m
7 x 10¹³ 4 x 10¹³
2
Arsenic
As-69 15.23 m
1 x 10¹⁴ 7 x 10¹¹
143
As-70 52.6 m
3 x 10¹³ 1 x 10¹²
30
As-71 65.28 h
2 x 10¹³ 3 x 10¹²
7
As-72 26.0 h
5 x 10¹² 9 x 10¹¹
6
As-73 80.30 d
2 x 10¹³ 8 x 10¹²
3
As-74 17.77 d
5 x 10¹² 2 x 10¹²
3
As-76 1.0778 d
5 x 10¹² 9 x 10¹¹
6
As-77 38.83 h
2 x 10¹³ 2 x 10¹²
10
As-78 90.7 m
3 x 10¹³ 7 x 10¹¹
43
Astatine
At-207 1.80 h
1 x 10¹³ 4 x 10¹²
3
At-211 7.214 h
2 x 10¹¹ 2 x 10¹¹
Same
Barium
Ba-126 100 m
3 x 10¹³ 2 x 10¹³
2
Ba-128 2.43 d
4 x 10¹² 1 x 10¹³
3

Appendix A
21
Radionuclide Half-life Form Revised value (Bq)
REPPIR 2001 value (Bq)
REPPIR2001
radionuclide
name (if
different)
Factor by which value has increased or decreased (rounded to nearest
whole number)
Ba-131 11.50 d
1 x 10¹³ 6 x 10¹²
2
Ba-131m 14.6 m
1 x 10¹⁵ 3 x 10¹²
333
Ba-133 10.52 y
2 x 10¹² 4 x 10¹¹
5
Ba-133m 38.9 h
1 x 10¹³ 2 x 10¹²
5
Ba-135m 28.7 h
2 x 10¹³ 2 x 10¹²
10
Ba-139 83.06 m
7 x 10¹³ 1 x 10¹²
70
Ba-140 12.752 d
3 x 10¹² 2 x 10¹²
2
Ba-141 18.27 m
1 x 10¹⁴ 1 x 10¹²
100
Ba-142 10.6 m
2 x 10¹⁴ 2 x 10¹²
100
Berkelium
Bk-245 4.94 d
9 x 10¹² 3 x 10¹²
3
Bk-246 1.80 d
2 x 10¹³ 6 x 10¹²
3
Bk-247 1.38 x 10³ y
4 x 1008 3 x 1008
1
Bk-249 330 d
2 x 10¹¹ 2 x 10¹¹
Same
Bk-250 3.212 h
2 x 10¹³ 2 x 10¹²
10
Beryllium
Be-7 53.22 d
2 x 10¹⁴ 2 x 10¹³
10
Be-10 1.51 x 10⁶ y
8 x 10¹¹ 6 x 10¹¹
1
Bismuth
Bi-200 36.4 m
6 x 10¹³ 2 x 10¹²
30
Bi-201 108 m
4 x 10¹³ 2 x 10¹²
20
Bi-202 1.72 h
4 x 10¹³ 3 x 10¹²
13
Bi-203 11.76 h
2 x 10¹³ 4 x 10¹²
5
Bi-205 15.31 d
8 x 10¹² 2 x 10¹²
4
Bi-206 6.243 d
4 x 10¹² 2 x 10¹²
2
Bi-207 32.9 y
2 x 10¹² 1 x 10¹¹
20
Bi-210 5.013 d
3 x 10¹¹ 2 x 10¹¹
2
Bi-210m 3.04 x 10⁶ y
8 x 1009 6 x 1009
1
Bi-212 60.55 m
1 x 10¹² 7 x 10¹¹
1
Bi-213 45.59 m
1 x 10¹² 7 x 10¹¹
1
Bi-214 19.9 m
3 x 10¹² 1 x 10¹²
3
Bromine
Br-74 25.4 m
3 x 10¹³ 8 x 10¹¹
38
Br-74m 46 m
3 x 10¹³ 6 x 10¹¹
50
Br-75 96.7 m
6 x 10¹³ 2 x 10¹²
30

Derivation of Reference Values for Schedule 1 of the REPPIR-2019 Regulations
22
Radionuclide Half-life Form Revised value (Bq)
REPPIR 2001 value (Bq)
REPPIR2001
radionuclide
name (if
different)
Factor by which value has increased or decreased (rounded to nearest
whole number)
Br-76 16.2 h
1 x 10¹³ 1 x 10¹²
10
Br-77 57.036 h
8 x 10¹³ 4 x 10¹³
2
Br-80 17.68 m
3 x 10¹⁴ 1 x 10¹²
300
Br-80m 4.4205 h
7 x 10¹³ 5 x 10¹²
14
Br-82 35.30 h
1 x 10¹³ 3 x 10¹²
3
Br-83 2.40 h
1 x 10¹⁴ 2 x 10¹²
50
Br-84 31.80 m
6 x 10¹³ 7 x 10¹¹
86
Cadmium
Cd-104 57.7 m
2 x 10¹⁴ 1 x 10¹³
20
Cd-107 6.50 h
1 x 10¹⁴ 4 x 10¹²
25
Cd-109 461.4 d
2 x 10¹² 2 x 10¹²
Same
Cd-113 7.7 x 10¹⁵ y
2 x 10¹¹ 2 x 10¹¹
Same
Cd-113m 14.1 y
2 x 10¹¹ 1 x 10¹¹
2
Cd-115 53.46 h
6 x 10¹² 2 x 10¹²
3
Cd-115m 44.6 d
2 x 10¹² 2 x 10¹²
Same
Cd-117 2.49 h
3 x 10¹³ 2 x 10¹²
15
Cd-117m 3.36 h
2 x 10¹³ 2 x 10¹²
10
Caesium
Cs-125 45 m
1 x 10¹⁴ 2 x 10¹²
50
Cs-127 6.25 h
2 x 10¹⁴ 1 x 10¹³
20
Cs-129 32.06 h
1 x 10¹⁴ 2 x 10¹³
5
Cs-130 29.21 m
2 x 10¹⁴ 2 x 10¹²
100
Cs-131 9.689 d
2 x 10¹⁴ 6 x 10¹³
3
Cs-132 6.479 d
2 x 10¹³ 9 x 10¹²
2
Cs-134 2.0648 y
4 x 10¹¹ 7 x 10¹⁰
6
Cs-134m 2.903 h
2 x 10¹⁴ 4 x 10¹²
50
Cs-135 2.3 x 10⁶ y
3 x 10¹² 9 x 10¹¹
3
Cs-135m 53 m
1 x 10¹⁴ 8 x 10¹²
13
Cs-136 13.16 d
5 x 10¹² 8 x 10¹¹
6
Cs-137 30.1671 y
4 x 10¹¹ 1 x 10¹¹
4
Cs-138 33.41 m
5 x 10¹³ 8 x 10¹¹
63
Calcium
Ca-41 1.02 x 10⁵ y
6 x 10¹³ 3 x 10¹³
2
Ca-45 162.67 d
2 x 10¹² 3 x 10¹²
2
Ca-47 4.536 d
2 x 10¹² 2 x 10¹²
Same

Appendix A
23
Radionuclide Half-life Form Revised value (Bq)
REPPIR 2001 value (Bq)
REPPIR2001
radionuclide
name (if
different)
Factor by which value has increased or decreased (rounded to nearest
whole number)
Californium
Cf-244 19.4 m
3 x 10¹² 2 x 10¹²
2
Cf-246 35.7 h
6 x 10¹⁰ 5 x 10¹⁰
1
Cf-248 334 d
3 x 1009 2 x 1009
2
Cf-249 351 y
4 x 1008 3 x 1008
1
Cf-250 13.08 y
9 x 1008 7 x 1008
1
Cf-251 900 y
4 x 1008 3 x 1008
1
Cf-252 2.645 y
1 x 1009 1 x 1009
Same
Cf-253 17.81 d
2 x 10¹⁰ 2 x 10¹⁰
Same
Cf-254 60.5 d
5 x 1008 4 x 1008
1
Carbon
C-11 20.39 m
2 x 10¹⁴ 2 x 10¹²
100
carbon
dioxide 2 x 10¹⁴
1 x 10¹⁴
2
carbon
monoxide 3 x 10¹⁴
1 x 10¹⁴
3
methane 3 x 10¹⁴
New
vapour 2 x 10¹⁴ 1 x 10¹⁴
2
C-14 5.70 x 10³ y
5 x 10¹² 3 x 10¹²
2
carbon
dioxide 3 x 10¹²
3 x 10¹⁵
1000
carbon
monoxide 3 x 10¹²
1 x 10¹⁶
3333
methane 3 x 10¹²
New
vapour 3 x 10¹² 4 x 10¹³
13
Cerium
Ce-134 3.16 d
3 x 10¹² 1 x 10¹³
3
Ce-135 17.7 h
1 x 10¹³ 2 x 10¹²
5
Ce-137 9.0 h
3 x 10¹⁴ 2 x 10¹³
15
Ce-137m 34.4 h
1 x 10¹³ 2 x 10¹²
5
Ce-139 137.641 d
9 x 10¹² 2 x 10¹²
5
Ce-141 32.508 d
5 x 10¹² 2 x 10¹²
3
Ce-143 33.039 h
7 x 10¹² 2 x 10¹²
4
Ce-144 284.91 d
4 x 10¹¹ 3 x 10¹¹
1
Chlorine
Cl-36 3.01 x 10⁵ y
3 x 10¹² 2 x 10¹²
2
Cl-38 37.24 m
5 x 10¹³ 6 x 10¹¹
83
Cl-39 55.6 m
6 x 10¹³ 1 x 10¹²
60

Derivation of Reference Values for Schedule 1 of the REPPIR-2019 Regulations
24
Radionuclide Half-life Form Revised value (Bq)
REPPIR 2001 value (Bq)
REPPIR2001
radionuclide
name (if
different)
Factor by which value has increased or decreased (rounded to nearest
whole number)
Chromium
Cr-48 21.56 h
4 x 10¹³ 4 x 10¹³
Same
Cr-49 42.3 m
9 x 10¹³ 2 x 10¹²
45
Cr-51 27.7025 d
2 x 10¹⁴ 3 x 10¹³
7
Cobalt
Co-55 17.53 h
9 x 10¹² 2 x 10¹²
5
Co-56 77.23 d
1 x 10¹² 2 x 10¹¹
5
Co-57 271.74 d
1 x 10¹³ 1 x 10¹²
10
Co-58 70.86 d
5 x 10¹² 6 x 10¹¹
8
Co-58m 9.04 h
4 x 10¹⁴ 2 x 10¹³
20
Co-60 5.2713 y
6 x 10¹¹ 6 x 10¹⁰
10
Co-60m 10.467 m
5 x 10¹⁵ 7 x 10¹²
714
Co-61 1.650 h
1 x 10¹⁴ 2 x 10¹²
50
Co-62m 13.91 m
7 x 10¹³ 9 x 10¹¹
78
Copper
Cu-60 23.7 m
4 x 10¹³ 1 x 10¹²
40
Cu-61 3.333 h
5 x 10¹³ 2 x 10¹²
25
Cu-64 12.700 h
6 x 10¹³ 4 x 10¹²
15
Cu-67 61.83 h
2 x 10¹³ 3 x 10¹²
7
Curium
Cm-238 2.4 h
6 x 10¹² 5 x 10¹²
1
Cm-240 27 d
8 x 1009 7 x 1009
1
Cm-241 32.8 d
7 x 10¹¹ 5 x 10¹¹
1
Cm-242 162.8 d
5 x 1009 4 x 1009
1
Cm-243 29.1 y
4 x 1008 4 x 1008
Same
Cm-244 18.10 y
5 x 1008 4 x 1008
1
Cm-245 8.5 x 10³ y
3 x 1008 2 x 1008
2
Cm-246 4.76 x 10³ y
3 x 1008 2 x 1008
2
Cm-247 1.56 x 10⁷ y
3 x 1008 3 x 1008
Same
Cm-248 3.48 x 10⁵ y
8 x 1007 7 x 1007
1
Cm-249 64.15 m
2 x 10¹⁴ 2 x 10¹²
100
Cm-250 8300 y
1 x 1007 1 x 1007
Same
Dysprosium
Dy-155 9.9 h
6 x 10¹³ 1 x 10¹³
6
Dy-157 8.14 h
1 x 10¹⁴ 1 x 10¹⁴
Same

Appendix A
25
Radionuclide Half-life Form Revised value (Bq)
REPPIR 2001 value (Bq)
REPPIR2001
radionuclide
name (if
different)
Factor by which value has increased or decreased (rounded to nearest
whole number)
Dy-159 144.4 d
4 x 10¹³ 8 x 10¹²
5
Dy-165 2.334 h
7 x 10¹³ 2 x 10¹²
35
Dy-166 81.6 h
5 x 10¹² 3 x 10¹²
2
Einsteinium
Es-250m 2.22 h
4 x 10¹³ 1 x 10¹³ Es-250 4
Es-251 33 h
1 x 10¹³ 6 x 10¹²
2
Es-253 20.47 d
1 x 10¹⁰ 8 x 1009
1
Es-254 275.7 d
3 x 1009 2 x 1009
2
Es-254m 39.3 h
6 x 10¹⁰ 5 x 10¹⁰
1
Erbium
Er-161 3.21 h
7 x 10¹³ 6 x 10¹²
12
Er-165 10.36 h
5 x 10¹⁴ 2 x 10¹⁴
3
Er-169 9.40 d
1 x 10¹³ 3 x 10¹²
3
Er-171 7.516 h
2 x 10¹³ 2 x 10¹²
10
Er-172 49.3 h
8 x 10¹² 3 x 10¹²
3
Europium
Eu-145 5.93 d
1 x 10¹³ 4 x 10¹²
3
Eu-146 4.61 d
7 x 10¹² 3 x 10¹²
2
Eu-147 24.1 d
1 x 10¹³ 4 x 10¹²
3
Eu-148 54.5 d
3 x 10¹² 4 x 10¹¹
8
Eu-149 93.1 d
4 x 10¹³ 8 x 10¹²
5
Eu-150 36.9 y
5 x 10¹¹ 1 x 10¹¹ Eu-150l 5
Eu-150m 12.8 h
2 x 10¹³ 2 x 10¹² Eu-150s 10
Eu-152 13.537 y
6 x 10¹¹ 1 x 10¹¹
6
Eu-152m 9.3116 h
2 x 10¹³ 2 x 10¹²
10
Eu-154 8.593 y
5 x 10¹¹ 1 x 10¹¹
5
Eu-155 4.7611 y
4 x 10¹² 2 x 10¹²
2
Eu-156 15.19 d
3 x 10¹² 2 x 10¹²
2
Eu-157 15.18 h
1 x 10¹³ 2 x 10¹²
5
Eu-158 45.9 m
6 x 10¹³ 1 x 10¹²
60
Fermium
Fm-252 25.39 h
9 x 10¹⁰ 7 x 10¹⁰
1
Fm-253 3.00 d
7 x 10¹⁰ 6 x 10¹⁰
1
Fm-254 3.240 h
4 x 10¹¹ 3 x 10¹¹
1
Fm-255 20.07 h
1 x 10¹¹ 9 x 10¹⁰
1
Fm-257 100.5 d
3 x 1009 3 x 1009
Same

Derivation of Reference Values for Schedule 1 of the REPPIR-2019 Regulations
26
Radionuclide Half-life Form Revised value (Bq)
REPPIR 2001 value (Bq)
REPPIR2001
radionuclide
name (if
different)
Factor by which value has increased or decreased (rounded to nearest
whole number)
Fluorine
F-18 109.77 m
8 x 10¹³ 2 x 10¹²
40
Francium
Fr-222 14.2 m
3 x 10¹² 1 x 10¹²
3
Fr-223 22.00 m
4 x 10¹² 2 x 10¹²
2
Gadolinium
Gd-145 23.0 m
7 x 10¹³ 2 x 10¹²
35
Gd-146 48.27 d
3 x 10¹² 2 x 10¹²
2
Gd-147 38.1 h
1 x 10¹³ 5 x 10¹²
2
Gd-148 74.6 y
1 x 1009 9 x 1008
1
Gd-149 9.28 d
1 x 10¹³ 6 x 10¹²
2
Gd-151 124 d
1 x 10¹³ 5 x 10¹²
2
Gd-152 1.08 x 10¹⁴ y
2 x 1009 1 x 1009
2
Gd-153 240.4 d
7 x 10¹² 2 x 10¹²
4
Gd-159 18.479 h
2 x 10¹³ 2 x 10¹²
10
Gallium
Ga-65 15.2 m
1 x 10¹⁴ 1 x 10¹²
100
Ga-66 9.49 h
7 x 10¹² 9 x 10¹¹
8
Ga-67 3.2612 d
4 x 10¹³ 5 x 10¹²
8
Ga-68 67.71 m
6 x 10¹³ 2 x 10¹²
30
Ga-70 21.14 m
3 x 10¹⁴ 1 x 10¹²
300
Ga-72 14.10 h
8 x 10¹² 2 x 10¹²
4
Ga-73 4.86 h
3 x 10¹³ 2 x 10¹²
15
Germanium
Ge-66 2.26 h
7 x 10¹³ 3 x 10¹²
23
Ge-67 18.9 m
9 x 10¹³ 7 x 10¹¹
129
Ge-68 270.95 d
2 x 10¹² 1 x 10¹²
2
Ge-69 39.05 h
3 x 10¹³ 2 x 10¹²
15
Ge-71 11.43 d
6 x 10¹⁴ 7 x 10¹⁴
1
Ge-75 82.78 m
2 x 10¹⁴ 2 x 10¹²
100
Ge-77 11.30 h
2 x 10¹³ 1 x 10¹²
20
Ge-78 88 m
7 x 10¹³ 2 x 10¹²
35
Gold
Au-193 17.65 h
6 x 10¹³ 7 x 10¹²
9
Au-194 38.02 h
2 x 10¹³ 1 x 10¹³
2

Appendix A
27
Radionuclide Half-life Form Revised value (Bq)
REPPIR 2001 value (Bq)
REPPIR2001
radionuclide
name (if
different)
Factor by which value has increased or decreased (rounded to nearest
whole number)
Au-195 186.098 d
1 x 10¹³ 3 x 10¹²
3
Au-198 2.69517 d
7 x 10¹² 2 x 10¹²
4
Au-198m 2.27 d
6 x 10¹² 2 x 10¹²
3
Au-199 3.139 d
2 x 10¹³ 3 x 10¹²
7
Au-200 48.4 m
1 x 10¹⁴ 1 x 10¹²
100
Au-200m 18.7 h
8 x 10¹² 2 x 10¹²
4
Au-201 26 m
3 x 10¹⁴ 2 x 10¹²
150
Hafnium
Hf-170 16.01 h
2 x 10¹³ 4 x 10¹²
5
Hf-172 1.87 y
7 x 10¹¹ 5 x 10¹¹
1
Hf-173 23.6 h
4 x 10¹³ 6 x 10¹²
7
Hf-175 70 d
1 x 10¹³ 2 x 10¹²
5
Hf-177m 51.4 m
5 x 10¹³ 2 x 10¹²
25
Hf-178m 31 y
1 x 10¹¹ 4 x 10¹⁰
3
Hf-179m 25.05 d
4 x 10¹² 2 x 10¹²
2
Hf-180m 5.5 h
4 x 10¹³ 2 x 10¹²
20
Hf-181 42.39 d
4 x 10¹² 1 x 10¹²
4
Hf-182 9 x 10⁶ y
1 x 10¹¹ 7 x 10¹⁰
1
Hf-182m 61.5 m
1 x 10¹⁴ 2 x 10¹²
50
Hf-183 1.067 h
8 x 10¹³ 2 x 10¹²
40
Hf-184 4.12 h
2 x 10¹³ 2 x 10¹²
10
Holmium
Ho-155 48 m
1 x 10¹⁴ 2 x 10¹²
50
Ho-157 12.6 m
4 x 10¹⁴ 4 x 10¹²
100
Ho-159 33.05 m
4 x 10¹⁴ 6 x 10¹²
67
Ho-161 2.48 h
6 x 10¹⁴ 1 x 10¹³
60
Ho-162 15.0 m
1 x 10¹⁵ 5 x 10¹²
200
Ho-162m 67.0 m
2 x 10¹⁴ 4 x 10¹²
50
Ho-164 29 m
7 x 10¹⁴ 2 x 10¹²
350
Ho-164m 38.0 m
5 x 10¹⁴ 4 x 10¹²
125
Ho-166 26.80 h
6 x 10¹² 1 x 10¹²
6
Ho-166m 1.20 x 10³ y
2 x 10¹¹ 8 x 10¹⁰
3
Ho-167 3.1 h
7 x 10¹³ 2 x 10¹²
35
Hydrogen
H-3 12.32 y
1 x 10¹⁴ 7 x 10¹³
1

Derivation of Reference Values for Schedule 1 of the REPPIR-2019 Regulations
28
Radionuclide Half-life Form Revised value (Bq)
REPPIR 2001 value (Bq)
REPPIR2001
radionuclide
name (if
different)
Factor by which value has increased or decreased (rounded to nearest
whole number)
organically
bound tritium 3 x 10¹⁴ 1 x 10¹⁴
3
elemental
gas 7 x 10¹⁴ 1 x 10¹⁸
1429
tritiated
methane 2 x 10¹⁵ 1 x 10¹⁷
50
tritiated water
vapour 7 x 10¹⁴ 1 x 10¹⁵
1
Indium
In-109 4.2 h
9 x 10¹³ 7 x 10¹²
13
In-110 4.9 h
3 x 10¹³ 2 x 10¹³ In-110l 2
In-110m 69.1 m
5 x 10¹³ 1 x 10¹² In-110s 50
In-111 2.8047 d
3 x 10¹³ 9 x 10¹²
3
In-112 14.97 m
5 x 10¹⁴ 2 x 10¹²
250
In-113m 1.6579 h
2 x 10¹⁴ 5 x 10¹²
40
In-114 71.9 s
4 x 10¹⁵ 1 x 10¹²
4000
In-114m 49.51 d
9 x 10¹¹ 9 x 10¹¹
Same
In-115 4.41 x 10¹⁴ y
7 x 10¹⁰ 6 x 10¹⁰
1
In-115m 4.486 h
8 x 10¹³ 3 x 10¹²
27
In-116m 54.41 m
5 x 10¹³ 2 x 10¹²
25
In-117 43.2 m
1 x 10¹⁴ 2 x 10¹²
50
In-117m 116.2 m
7 x 10¹³ 2 x 10¹²
35
In-119m 18.0 m
2 x 10¹⁴ 9 x 10¹¹
222
Iodine
I-120 81.6 m
2 x 10¹³ 6 x 10¹¹
33
methyl iodide 2 x 10¹³ 2 x 10¹³
Same
elemental 1 x 10¹³ 2 x 10¹³
2
I-120m 53 m
2 x 10¹³ 7 x 10¹¹
29
methyl iodide 2 x 10¹³ 2 x 10¹³
Same
elemental 2 x 10¹³ 2 x 10¹³
Same
I-121 2.12 h
9 x 10¹³ 4 x 10¹²
23
methyl iodide 9 x 10¹³ 1 x 10¹⁴
1
elemental 8 x 10¹³ 1 x 10¹⁴
1
I-123 13.27 h
3 x 10¹³ 9 x 10¹²
3
methyl iodide 3 x 10¹³ 6 x 10¹³
2
elemental 3 x 10¹³ 5 x 10¹³
2
I-124 4.1760 d
6 x 10¹¹ 2 x 10¹²
3
methyl iodide 5 x 10¹¹ 1 x 10¹²
2

Appendix A
29
Radionuclide Half-life Form Revised value (Bq)
REPPIR 2001 value (Bq)
REPPIR2001
radionuclide
name (if
different)
Factor by which value has increased or decreased (rounded to nearest
whole number)
elemental 4 x 10¹¹ 9 x 10¹¹
2
I-125 59.400 d
1 x 10¹² 1 x 10¹¹
10
methyl iodide 1 x 10¹² 1 x 10¹²
Same
elemental 8 x 10¹¹ 1 x 10¹²
1
I-126 12.93 d
3 x 10¹¹ 8 x 10¹¹
3
methyl iodide 3 x 10¹¹ 6 x 10¹¹
2
elemental 2 x 10¹¹ 5 x 10¹¹
3
I-128 24.99 m
2 x 10¹⁴ 1 x 10¹²
200
methyl iodide 2 x 10¹⁴ 5 x 10¹⁴
3
elemental 2 x 10¹⁴ 2 x 10¹⁴
Same
I-129 1.57 x 10⁷ y
2 x 10¹¹ 1 x 10¹⁰
20
methyl iodide 2 x 10¹¹ 2 x 10¹¹
Same
elemental 1 x 10¹¹ 2 x 10¹¹
2
I-130 12.36 h
3 x 10¹² 3 x 10¹²
Same
methyl iodide 3 x 10¹² 6 x 10¹²
2
elemental 3 x 10¹² 5 x 10¹²
2
I-131 8.02070 d
3 x 10¹¹ 9 x 10¹⁰
3
methyl iodide 2 x 10¹¹ 7 x 10¹¹
4
elemental 2 x 10¹¹ 6 x 10¹¹
3
I-132 2.295 h
4 x 10¹³ 2 x 10¹²
20
methyl iodide 3 x 10¹³ 3 x 10¹³
Same
elemental 3 x 10¹³ 2 x 10¹³
2
I-132m 1.387 h
3 x 10¹³ 2 x 10¹²
15
methyl iodide 3 x 10¹³ 5 x 10¹³
2
elemental 2 x 10¹³ 4 x 10¹³
2
I-133 20.8 h
4 x 10¹² 2 x 10¹²
2
methyl iodide 3 x 10¹² 3 x 10¹²
Same
elemental 2 x 10¹² 2 x 10¹²
Same
I-134 52.5 m
4 x 10¹³ 2 x 10¹²
20
methyl iodide 4 x 10¹³ 4 x 10¹³
Same
elemental 4 x 10¹³ 3 x 10¹³
1
I-135 6.57 h
2 x 10¹³ 2 x 10¹²
10
methyl iodide 1 x 10¹³ 1 x 10¹³
Same
elemental 1 x 10¹³ 9 x 10¹²
1
Iridium
Ir-182 15 m
1 x 10¹⁴ 1 x 10¹²
100

Derivation of Reference Values for Schedule 1 of the REPPIR-2019 Regulations
30
Radionuclide Half-life Form Revised value (Bq)
REPPIR 2001 value (Bq)
REPPIR2001
radionuclide
name (if
different)
Factor by which value has increased or decreased (rounded to nearest
whole number)
Ir-184 3.09 h
3 x 10¹³ 2 x 10¹²
15
Ir-185 14.4 h
3 x 10¹³ 3 x 10¹²
10
Ir-186 16.64 h
2 x 10¹³ 3 x 10¹² Ir-186l 7
Ir-186m 1.92 h
7 x 10¹³ 2 x 10¹² Ir-186s 35
Ir-187 10.5 h
6 x 10¹³ 6 x 10¹²
10
Ir-188 41.5 h
1 x 10¹³ 5 x 10¹²
2
Ir-189 13.2 d
2 x 10¹³ 9 x 10¹²
2
Ir-190 11.78 d
5 x 10¹² 2 x 10¹²
3
Ir-190m 1.120 h
1 x 10¹⁵ 1 x 10¹³ Ir-190ms 100
Ir-190n 3.087 h
8 x 10¹³ 3 x 10¹² Ir-190ml 27
Ir-192 73.827 d
3 x 10¹² 6 x 10¹¹
5
Ir-192n 241 y
8 x 10¹¹ 4 x 10¹¹ Ir-192m 2
Ir-193m 10.53 d
2 x 10¹³ 4 x 10¹²
5
Ir-194 19.28 h
6 x 10¹² 1 x 10¹²
6
Ir-194m 171 d
1 x 10¹² 1 x 10¹¹
10
Ir-195 2.5 h
7 x 10¹³ 2 x 10¹²
35
Ir-195m 3.8 h
3 x 10¹³ 2 x 10¹²
15
Iron
Fe-52 8.275 h
7 x 10¹² 2 x 10¹²
4
Fe-55 2.737 y
2 x 10¹³ 8 x 10¹²
3
Fe-59 44.495 d
3 x 10¹² 8 x 10¹¹
4
Fe-60 1.5 x 10⁶ y
8 x 10¹⁰ 4 x 10¹⁰
2
Krypton
Kr-74 11.50 m
2 x 10¹⁴ 5 x 10¹³
4
Kr-76 14.8 h
2 x 10¹⁴ 1 x 10¹⁴
2
Kr-77 74.4 m
1 x 10¹⁴ 6 x 10¹³
2
Kr-79 35.04 h
4 x 10¹⁴ 2 x 10¹⁴
2
Kr-81 2.29 x 10⁵ y
3 x 10¹⁶ 7 x 10¹⁵
4
Kr-81m 13.10 s
7 x 10¹⁶ 5 x 10¹⁴
140
Kr-83m 1.83 h
3 x 10¹⁸ 3 x 10¹⁶
100
Kr-85 10.756 y
2 x 10¹⁶ 1 x 10¹⁶
2
Kr-85m 4.480 h
6 x 10¹⁴ 4 x 10¹⁴
2
Kr-87 76.3 m
1 x 10¹⁴ 7 x 10¹³
1
Kr-88 2.84 h
5 x 10¹³ 3 x 10¹³
2
Lanthanum
La-131 59 m
1 x 10¹⁴ 2 x 10¹²
50

Appendix A
31
Radionuclide Half-life Form Revised value (Bq)
REPPIR 2001 value (Bq)
REPPIR2001
radionuclide
name (if
different)
Factor by which value has increased or decreased (rounded to nearest
whole number)
La-132 4.8 h
2 x 10¹³ 2 x 10¹²
10
La-135 19.5 h
3 x 10¹⁴ 2 x 10¹⁴
2
La-137 6.0 x 10⁴ y
3 x 10¹² 2 x 10¹²
2
La-138 1.02 x 10¹¹ y
2 x 10¹¹ 2 x 10¹¹
Same
La-140 1.6781 d
1 x 10¹³ 2 x 10¹²
5
La-141 3.92 h
2 x 10¹³ 1 x 10¹²
20
La-142 91.1 m
3 x 10¹³ 1 x 10¹²
30
La-143 14.2 m
2 x 10¹⁴ 7 x 10¹¹
286
Lead
Pb-195m 15 m
1 x 10¹⁴ 2 x 10¹²
50
Pb-198 2.4 h
8 x 10¹³ 4 x 10¹²
20
Pb-199 90 m
9 x 10¹³ 6 x 10¹²
15
Pb-200 21.5 h
2 x 10¹³ 3 x 10¹²
7
Pb-201 9.33 h
5 x 10¹³ 8 x 10¹²
6
Pb-202 5.25 x 10⁴ y
2 x 10¹² 6 x 10¹¹
3
Pb-202m 3.53 h
4 x 10¹³ 4 x 10¹²
10
Pb-203 51.873 h
3 x 10¹³ 9 x 10¹²
3
Pb-205 1.53 x 10⁷ y
3 x 10¹³ 1 x 10¹³
3
Pb-209 3.253 h
1 x 10¹⁴ 2 x 10¹²
50
Pb-210 22.20 y
5 x 1009 3 x 1009
2
Pb-211 36.1 m
2 x 10¹² 2 x 10¹²
Same
Pb-212 10.64 h
1 x 10¹¹ 1 x 10¹¹
Same
Pb-214 26.8 m
3 x 10¹² 1 x 10¹²
3
Lutetium
Lu-169 34.06 h
2 x 10¹³ 6 x 10¹²
3
Lu-170 2.012 d
9 x 10¹² 3 x 10¹²
3
Lu-171 8.24 d
1 x 10¹³ 4 x 10¹²
3
Lu-172 6.70 d
6 x 10¹² 3 x 10¹²
2
Lu-173 1.37 y
7 x 10¹² 2 x 10¹²
4
Lu-174 3.31 y
5 x 10¹² 1 x 10¹²
5
Lu-174m 142 d
5 x 10¹² 3 x 10¹²
2
Lu-176 3.85 x 10¹⁰ y
4 x 10¹¹ 3 x 10¹¹
1
Lu-176m 3.635 h
5 x 10¹³ 2 x 10¹²
25
Lu-177 6.647 d
1 x 10¹³ 3 x 10¹²
3
Lu-177m 160.4 d
1 x 10¹² 3 x 10¹¹
3

Derivation of Reference Values for Schedule 1 of the REPPIR-2019 Regulations
32
Radionuclide Half-life Form Revised value (Bq)
REPPIR 2001 value (Bq)
REPPIR2001
radionuclide
name (if
different)
Factor by which value has increased or decreased (rounded to nearest
whole number)
Lu-178 28.4 m
2 x 10¹⁴ 1 x 10¹²
200
Lu-178m 23.1 m
1 x 10¹⁴ 1 x 10¹²
100
Lu-179 4.59 h
4 x 10¹³ 2 x 10¹²
20
Magnesium
Mg-28 20.915 h
4 x 10¹² 5 x 10¹²
1
Manganese
Mn-51 46.2 m
7 x 10¹³ 1 x 10¹²
70
Mn-52 5.591 d
5 x 10¹² 2 x 10¹²
3
Mn-52m 21.1 m
6 x 10¹³ 8 x 10¹¹
75
Mn-53 3.7 x 10⁶ y
2 x 10¹⁴ 1 x 10¹⁴
2
Mn-54 312.12 d
4 x 10¹² 3 x 10¹¹
13
Mn-56 2.5789 h
3 x 10¹³ 1 x 10¹²
30
Mendelevium
Md-257 5.2 h
1 x 10¹² 9 x 10¹¹
1
Md-258 55 d
4 x 1009 4 x 1009
Same
Mercury
Hg-193 3.80 h inorganic 6 x 10¹³ 3 x 10¹²
20
organic 8 x 10¹³ 3 x 10¹²
27
vapour 2 x 10¹³ 2 x 10¹³
Same
Hg-193m 11.8 h inorganic 2 x 10¹³ 2 x 10¹²
10
organic 3 x 10¹³ 2 x 10¹²
15
vapour 7 x 10¹² 6 x 10¹²
1
Hg-194 440 y inorganic 2 x 10¹² 1 x 10¹²
2
organic 9 x 10¹¹ 3 x 10¹¹
3
vapour 7 x 10¹¹ 6 x 10¹¹
1
Hg-195 10.53 h inorganic 8 x 10¹³ 5 x 10¹²
16
organic 1 x 10¹⁴ 5 x 10¹²
20
vapour 2 x 10¹³ 1 x 10¹³
2
Hg-195m 41.6 h inorganic 1 x 10¹³ 3 x 10¹²
3
organic 2 x 10¹³ 3 x 10¹²
7
vapour 3 x 10¹² 3 x 10¹²
Same
Hg-197 64.94 h inorganic 3 x 10¹³ 7 x 10¹²
4
organic 5 x 10¹³ 7 x 10¹²
7
vapour 6 x 10¹² 5 x 10¹²
1
Hg-197m 23.8 h inorganic 1 x 10¹³ 2 x 10¹²
5

Appendix A
33
Radionuclide Half-life Form Revised value (Bq)
REPPIR 2001 value (Bq)
REPPIR2001
radionuclide
name (if
different)
Factor by which value has increased or decreased (rounded to nearest
whole number)
organic 2 x 10¹³ 2 x 10¹²
10
vapour 4 x 10¹² 5 x 10¹²
1
Hg-199m 42.66 m inorganic 2 x 10¹⁴ 2 x 10¹²
100
organic 2 x 10¹⁴ 2 x 10¹²
100
vapour 1 x 10¹⁴ 1 x 10¹⁴
Same
Hg-203 46.612 d inorganic 8 x 10¹² 3 x 10¹²
3
organic 8 x 10¹² 3 x 10¹²
3
vapour 3 x 10¹² 3 x 10¹²
Same
Molybdenum
Mo-90 5.56 h
2 x 10¹³ 2 x 10¹²
10
Mo-93 4.0 x 10³ y
6 x 10¹² 2 x 10¹²
3
Mo-93m 6.85 h
3 x 10¹³ 4 x 10¹²
8
Mo-99 65.94 h
1 x 10¹³ 2 x 10¹²
5
Mo-101 14.61 m
1 x 10¹⁴ 2 x 10¹²
50
Neodymium
Nd-136 50.65 m
9 x 10¹³ 4 x 10¹²
23
Nd-138 5.04 h
1 x 10¹³ 5 x 10¹³
5
Nd-139 29.7 m
2 x 10¹⁴ 2 x 10¹²
100
Nd-139m 5.50 h
3 x 10¹³ 3 x 10¹²
10
Nd-141 2.49 h
8 x 10¹⁴ 2 x 10¹³
40
Nd-147 10.98 d
6 x 10¹² 2 x 10¹²
3
Nd-149 1.728 h
6 x 10¹³ 2 x 10¹²
30
Nd-151 12.44 m
2 x 10¹⁴ 1 x 10¹²
200
Neon
Ne-19 17.22 s
1 x 10¹⁶ 6 x 10¹³
167
Neptunium
Np-232 14.7 m
2 x 10¹⁴ 3 x 10¹²
67
Np-233 36.2 m
2 x 10¹⁵ 2 x 10¹⁴
10
Np-234 4.4 d
1 x 10¹³ 5 x 10¹²
2
Np-235 396.1 d
3 x 10¹³ 2 x 10¹³
2
Np-236 1.54 x 10⁵ y
4 x 1009 3 x 1009 Np-236l 1
Np-236m 22.5 h
3 x 10¹² 3 x 10¹² Np-236s Same
Np-237 2.144 x 10⁶ y
6 x 1008 5 x 1008
1
Np-238 2.117 d
6 x 10¹² 2 x 10¹²
3
Np-239 2.3565 d
9 x 10¹² 1 x 10¹²
9

Derivation of Reference Values for Schedule 1 of the REPPIR-2019 Regulations
34
Radionuclide Half-life Form Revised value (Bq)
REPPIR 2001 value (Bq)
REPPIR2001
radionuclide
name (if
different)
Factor by which value has increased or decreased (rounded to nearest
whole number)
Np-240 61.9 m
6 x 10¹³ 7 x 10¹¹
86
Nickel
Ni-56 6.075 d
9 x 10¹² 4 x 10¹²
2
nickel
carbonyl 9 x 10¹²
1 x 10¹³
1
Ni-57 35.60 h
1 x 10¹³ 2 x 10¹²
5
nickel
carbonyl 1 x 10¹³
2 x 10¹³
2
Ni-59 1.01 x 10⁵ y
6 x 10¹³ 4 x 10¹³
2
nickel
carbonyl 3 x 10¹³
2 x 10¹³
2
Ni-63 100.1 y
2 x 10¹³ 1 x 10¹³
2
nickel
carbonyl 1 x 10¹³
1 x 10¹³
Same
Ni-65 2.51719 h
4 x 10¹³ 1 x 10¹²
40
nickel
carbonyl 3 x 10¹³
4 x 10¹³
1
Ni-66 54.6 h
3 x 10¹² 5 x 10¹²
2
nickel
carbonyl 3 x 10¹²
1 x 10¹³
3
Nitrogen
N-13 9.965 m gas 4 x 10¹⁴ 6 x 10¹³
7
Niobium
Nb-88 14.5 m
5 x 10¹³ 7 x 10¹¹
71
Nb-89 2.03 h
2 x 10¹³ 1 x 10¹² Nb-89l 20
Nb-89m 66 m
5 x 10¹³ 8 x 10¹¹ Nb-89s 63
Nb-90 14.60 h
7 x 10¹² 2 x 10¹²
4
Nb-93m 16.13 y
1 x 10¹³ 1 x 10¹³
Same
Nb-94 2.03 x 10⁴ y
5 x 10¹¹ 1 x 10¹¹
5
Nb-95 34.991 d
9 x 10¹² 2 x 10¹²
5
Nb-95m 3.61 d
1 x 10¹³ 2 x 10¹²
5
Nb-96 23.35 h
8 x 10¹² 2 x 10¹²
4
Nb-97 72.1 m
9 x 10¹³ 2 x 10¹²
45
Nb-98m 51.3 m
4 x 10¹³ 1 x 10¹² Nb-98 40
Osmium
Os-180 21.5 m
5 x 10¹⁴ 1 x 10¹³
50
Os-181 105 m
6 x 10¹³ 3 x 10¹²
20
Os-182 22.10 h
2 x 10¹³ 6 x 10¹²
3
Os-185 93.6 d
7 x 10¹² 7 x 10¹¹
10

Appendix A
35
Radionuclide Half-life Form Revised value (Bq)
REPPIR 2001 value (Bq)
REPPIR2001
radionuclide
name (if
different)
Factor by which value has increased or decreased (rounded to nearest
whole number)
Os-189m 5.8 h
4 x 10¹⁴ 1 x 10¹³
40
Os-191 15.4 d
9 x 10¹² 4 x 10¹²
2
Os-191m 13.10 h
7 x 10¹³ 7 x 10¹²
10
Os-193 30.11 h
1 x 10¹³ 2 x 10¹²
5
Os-194 6.0 y
3 x 10¹¹ 2 x 10¹¹
2
Oxygen
O-15 122.24 s gas 2 x 10¹⁵
New
Palladium
Pd-100 3.63 d
1 x 10¹³ 7 x 10¹²
1
Pd-101 8.47 h
8 x 10¹³ 8 x 10¹²
10
Pd-103 16.991 d
3 x 10¹³ 4 x 10¹³
1
Pd-107 6.5 x 10⁶ y
5 x 10¹³ 3 x 10¹³
2
Pd-109 13.7012 h
1 x 10¹³ 2 x 10¹²
5
Phosphorus
P-32 14.263 d
7 x 10¹¹ 1 x 10¹¹
7
P-33 25.34 d
4 x 10¹² 3 x 10¹²
1
Platinum
Pt-186 2.08 h
8 x 10¹³ 9 x 10¹³
1
Pt-188 10.2 d
1 x 10¹³ 6 x 10¹²
2
Pt-189 10.87 h
7 x 10¹³ 6 x 10¹²
12
Pt-191 2.802 d
3 x 10¹³ 7 x 10¹²
4
Pt-193 50 y
2 x 10¹⁴ 1 x 10¹⁴
2
Pt-193m 4.33 d
2 x 10¹³ 3 x 10¹²
7
Pt-195m 4.02 d
1 x 10¹³ 3 x 10¹²
3
Pt-197 19.8915 h
2 x 10¹³ 2 x 10¹²
10
Pt-197m 95.41 m
1 x 10¹⁴ 2 x 10¹²
50
Pt-199 30.80 m
2 x 10¹⁴ 2 x 10¹²
100
Pt-200 12.5 h
8 x 10¹² 2 x 10¹²
4
Plutonium
Pu-234 8.8 h
1 x 10¹² 1 x 10¹²
Same
Pu-235 25.3 m
2 x 10¹⁵ 2 x 10¹³
100
Pu-236 2.858 y
8 x 1008 6 x 1008
1
Pu-237 45.2 d
4 x 10¹³ 1 x 10¹³
4
Pu-238 87.7 y
3 x 1008 2 x 1008
2
Pu-239 2.411 x 10⁴ y
3 x 1008 2 x 1008
2

Derivation of Reference Values for Schedule 1 of the REPPIR-2019 Regulations
36
Radionuclide Half-life Form Revised value (Bq)
REPPIR 2001 value (Bq)
REPPIR2001
radionuclide
name (if
different)
Factor by which value has increased or decreased (rounded to nearest
whole number)
Pu-240 6564 y
3 x 1008 2 x 1008
2
Pu-241 14.35 y
1 x 10¹⁰ 1 x 10¹⁰
Same
Pu-242 3.75 x 10⁵ y
3 x 1008 2 x 1008
2
Pu-243 4.956 h
8 x 10¹³ 2 x 10¹²
40
Pu-244 8.00 x 10⁷ y
3 x 1008 2 x 1008
2
Pu-245 10.5 h
1 x 10¹³ 2 x 10¹²
5
Pu-246 10.84 d
2 x 10¹² 2 x 10¹²
Same
Polonium
Po-203 36.7 m
8 x 10¹³ 3 x 10¹²
27
Po-205 1.66 h
7 x 10¹³ 7 x 10¹²
10
Po-206 8.8 d
1 x 10¹¹ 1 x 10¹¹
Same
Po-207 5.80 h
5 x 10¹³ 8 x 10¹²
6
Po-208 2.898 y
3 x 1009 2 x 1009
2
Po-209 102 y
2 x 1009 2 x 1009
Same
Po-210 138.376 d
4 x 1009 4 x 1009
Same
Potassium
K-40 1.251 x 10⁹ y
1 x 10¹² 2 x 10¹²
2
K-42 12.360 h
2 x 10¹³ 7 x 10¹¹
29
K-43 22.3 h
3 x 10¹³ 2 x 10¹²
15
K-44 22.13 m
5 x 10¹³ 6 x 10¹¹
83
K-45 17.3 m
8 x 10¹³ 9 x 10¹¹
89
Praseodymium
Pr-136 13.1 m
1 x 10¹⁴ 1 x 10¹²
100
Pr-137 1.28 h
1 x 10¹⁴ 2 x 10¹²
50
Pr-138m 2.12 h
4 x 10¹³ 2 x 10¹²
20
Pr-139 4.41 h
2 x 10¹⁴ 7 x 10¹²
29
Pr-142 19.12 h
6 x 10¹² 1 x 10¹²
6
Pr-142m 14.6 m
6 x 10¹⁴ 2 x 10¹⁵
3
Pr-143 13.57 d
5 x 10¹² 2 x 10¹²
3
Pr-144 17.28 m
2 x 10¹⁴ 2 x 10¹²
100
Pr-145 5.984 h
2 x 10¹³ 1 x 10¹²
20
Pr-147 13.4 m
2 x 10¹⁴ 1 x 10¹²
200
Promethium
Pm-141 20.90 m
2 x 10¹⁴ 1 x 10¹²
200
Pm-143 265 d
9 x 10¹² 9 x 10¹¹
10

Appendix A
37
Radionuclide Half-life Form Revised value (Bq)
REPPIR 2001 value (Bq)
REPPIR2001
radionuclide
name (if
different)
Factor by which value has increased or decreased (rounded to nearest
whole number)
Pm-144 363 d
2 x 10¹² 2 x 10¹¹
10
Pm-145 17.7 y
8 x 10¹² 3 x 10¹²
3
Pm-146 5.53 y
1 x 10¹² 2 x 10¹¹
5
Pm-147 2.6234 y
5 x 10¹² 4 x 10¹²
1
Pm-148 5.368 d
3 x 10¹² 1 x 10¹²
3
Pm-148m 41.29 d
2 x 10¹² 5 x 10¹¹
4
Pm-149 53.08 h
8 x 10¹² 2 x 10¹²
4
Pm-150 2.68 h
3 x 10¹³ 1 x 10¹²
30
Pm-151 28.40 h
1 x 10¹³ 2 x 10¹²
5
Protactinium
Pa-227 38.3 m
4 x 10¹¹ 3 x 10¹¹
1
Pa-228 22 h
4 x 10¹¹ 3 x 10¹¹
1
Pa-230 17.4 d
4 x 10¹⁰ 3 x 10¹⁰
1
Pa-231 3.276 x 10⁴ y
2 x 1008 2 x 1008
Same
Pa-232 1.31 d
3 x 10¹² 2 x 10¹²
2
Pa-233 26.967 d
5 x 10¹² 2 x 10¹²
3
Pa-234 6.70 h
1 x 10¹³ 5 x 10¹¹
20
Radium
Ra-223 11.43 d
3 x 1009 3 x 1009
Same
Ra-224 3.66 d
8 x 1009 7 x 1009
1
Ra-225 14.9 d
4 x 1009 3 x 1009
1
Ra-226 1600 y
3 x 1009 2 x 1009
2
Ra-227 42.2 m
6 x 10¹³ 2 x 10¹²
30
Ra-228 5.75 y
2 x 1009 1 x 1009
2
Rhenium
Re-177 14.0 m
5 x 10¹⁴ 2 x 10¹²
250
Re-178 13.2 m
1 x 10¹⁴ 2 x 10¹²
50
Re-181 19.9 h
2 x 10¹³ 3 x 10¹²
7
Re-182 64.0 h
5 x 10¹² 2 x 10¹² Re-182l 3
Re-182m 12.7 h
3 x 10¹³ 4 x 10¹² Re-182s 8
Re-184 38.0 d
6 x 10¹² 1 x 10¹²
6
Re-184m 169 d
3 x 10¹² 7 x 10¹¹
4
Re-186 3.7183 d
5 x 10¹² 2 x 10¹²
3
Re-186m 2.00 x 10⁵ y
2 x 10¹² 1 x 10¹²
2
Re-187 4.12 x 10¹⁰ y
1 x 10¹⁵ 5 x 10¹⁴
2

Derivation of Reference Values for Schedule 1 of the REPPIR-2019 Regulations
38
Radionuclide Half-life Form Revised value (Bq)
REPPIR 2001 value (Bq)
REPPIR2001
radionuclide
name (if
different)
Factor by which value has increased or decreased (rounded to nearest
whole number)
Re-188 17.0040 h
6 x 10¹² 1 x 10¹²
6
Re-188m 18.59 m
3 x 10¹⁴ 3 x 10¹²
100
Re-189 24.3 h
1 x 10¹³ 2 x 10¹²
5
Rhodium
Rh-99 16.1 d
1 x 10¹³ 4 x 10¹²
3
Rh-99m 4.7 h
9 x 10¹³ 9 x 10¹²
10
Rh-100 20.8 h
1 x 10¹³ 4 x 10¹²
3
Rh-101 3.3 y
4 x 10¹² 7 x 10¹¹
6
Rh-101m 4.34 d
4 x 10¹³ 2 x 10¹³
2
Rh-102 207 d
2 x 10¹² 6 x 10¹¹ Rh-102m 3
Rh-102m 3.742 y
9 x 10¹¹ 1 x 10¹¹ Rh-102 9
Rh-103m 56.114 m
2 x 10¹⁵ 3 x 10¹⁵
2
Rh-105 35.36 h
2 x 10¹³ 2 x 10¹²
10
Rh-106m 131 m
3 x 10¹³ 2 x 10¹²
15
Rh-107 21.7 m
3 x 10¹⁴ 2 x 10¹²
150
Rubidium
Rb-79 22.9 m
9 x 10¹³ 1 x 10¹²
90
Rb-81 4.576 h
9 x 10¹³ 2 x 10¹²
45
Rb-81m 30.5 m
8 x 10¹⁴ 4 x 10¹²
200
Rb-82m 6.472 h
3 x 10¹³ 3 x 10¹²
10
Rb-83 86.2 d
6 x 10¹² 1 x 10¹²
6
Rb-84 32.77 d
4 x 10¹² 1 x 10¹²
4
Rb-86 18.642 d
3 x 10¹² 2 x 10¹¹
15
Rb-87 4.923 x 10¹⁰
y 6 x 10¹²
4 x 10¹²
2
Rb-88 17.78 m
9 x 10¹³ 5 x 10¹¹
180
Rb-89 15.15 m
8 x 10¹³ 9 x 10¹¹
89
Ruthenium
Ru-94 51.8 m
9 x 10¹³ 1 x 10¹⁴
1
ruthenium
tetroxide 8 x 10¹³
1 x 10¹⁴
1
Ru-97 2.9 d
6 x 10¹³ 3 x 10¹³
2
ruthenium
tetroxide 6 x 10¹³
1 x 10¹⁴
2
Ru-103 39.26 d
7 x 10¹² 2 x 10¹²
4
ruthenium
tetroxide 1 x 10¹³
1 x 10¹³
Same
Ru-105 4.44 h
3 x 10¹³ 2 x 10¹²
15

Appendix A
39
Radionuclide Half-life Form Revised value (Bq)
REPPIR 2001 value (Bq)
REPPIR2001
radionuclide
name (if
different)
Factor by which value has increased or decreased (rounded to nearest
whole number)
ruthenium
tetroxide 3 x 10¹³
6 x 10¹³
2
Ru-106 373.59 d
4 x 10¹¹ 3 x 10¹¹
1
ruthenium
tetroxide 8 x 10¹¹
8 x 10¹¹
Same
Samarium
Sm-141 10.2 m
1 x 10¹⁴ 1 x 10¹²
100
Sm-141m 22.6 m
7 x 10¹³ 2 x 10¹²
35
Sm-142 72.49 m
5 x 10¹³ 9 x 10¹²
6
Sm-145 340 d
1 x 10¹³ 3 x 10¹²
3
Sm-146 1.03 x 10⁸ y
3 x 1009 2 x 1009
2
Sm-147 1.060 x 10¹¹
y 3 x 1009
3 x 1009
Same
Sm-151 90 y
7 x 10¹² 6 x 10¹²
1
Sm-153 46.50 h
1 x 10¹³ 2 x 10¹²
5
Sm-155 22.3 m
3 x 10¹⁴ 2 x 10¹²
150
Sm-156 9.4 h
3 x 10¹³ 2 x 10¹²
15
Scandium
Sc-43 3.891 h
4 x 10¹³ 2 x 10¹²
20
Sc-44 3.97 h
2 x 10¹³ 2 x 10¹²
10
Sc-44m 58.61 h
4 x 10¹² 9 x 10¹²
2
Sc-46 83.79 d
2 x 10¹² 3 x 10¹¹
7
Sc-47 3.3492 d
1 x 10¹³ 3 x 10¹²
3
Sc-48 43.67 h
5 x 10¹² 2 x 10¹²
3
Sc-49 57.2 m
1 x 10¹⁴ 1 x 10¹²
100
Selenium
Se-70 41.1 m
6 x 10¹³ 2 x 10¹²
30
Se-73 7.15 h
3 x 10¹³ 2 x 10¹²
15
Se-73m 39.8 m
2 x 10¹⁴ 2 x 10¹²
100
Se-75 119.779 d
4 x 10¹² 2 x 10¹¹
20
Se-79 2.95 x 10⁵ y
2 x 10¹² 5 x 10¹⁰
40
Se-81 18.45 m
3 x 10¹⁴ 2 x 10¹²
150
Se-81m 57.28 m
1 x 10¹⁴ 4 x 10¹²
25
Se-83 22.3 m
6 x 10¹³ 2 x 10¹²
30
Silicon
Si-31 157.3 m
6 x 10¹³ 2 x 10¹²
30
Si-32 132 y
3 x 10¹¹ 2 x 10¹¹
2

Derivation of Reference Values for Schedule 1 of the REPPIR-2019 Regulations
40
Radionuclide Half-life Form Revised value (Bq)
REPPIR 2001 value (Bq)
REPPIR2001
radionuclide
name (if
different)
Factor by which value has increased or decreased (rounded to nearest
whole number)
Silver
Ag-102 12.9 m
7 x 10¹³ 1 x 10¹²
70
Ag-103 65.7 m
1 x 10¹⁴ 2 x 10¹²
50
Ag-104 69.2 m
5 x 10¹³ 3 x 10¹²
17
Ag-104m 33.5 m
7 x 10¹³ 2 x 10¹²
35
Ag-105 41.29 d
1 x 10¹³ 2 x 10¹²
5
Ag-106 23.96 m
2 x 10¹⁴ 2 x 10¹²
100
Ag-106m 8.28 d
6 x 10¹² 2 x 10¹²
3
Ag-108m 418 y
6 x 10¹¹ 1 x 10¹¹
6
Ag-110m 249.76 d
1 x 10¹² 3 x 10¹⁰
33
Ag-111 7.45 d
6 x 10¹² 2 x 10¹²
3
Ag-112 3.130 h
2 x 10¹³ 7 x 10¹¹
29
Ag-115 20.0 m
1 x 10¹⁴ 9 x 10¹¹
111
Sodium
Na-22 2.6019 y
1 x 10¹² 1 x 10¹¹
10
Na-24 14.9590 h
1 x 10¹³ 2 x 10¹²
5
Strontium
Sr-80 106.3 m
3 x 10¹³ 1 x 10¹⁴
3
Sr-81 22.3 m
8 x 10¹³ 9 x 10¹¹
89
Sr-82 25.36 d
1 x 10¹² 2 x 10¹²
2
Sr-83 32.41 h
2 x 10¹³ 3 x 10¹²
7
Sr-85 64.84 d
1 x 10¹³ 1 x 10¹²
10
Sr-85m 67.63 m
6 x 10¹⁴ 3 x 10¹³
20
Sr-87m 2.815 h
2 x 10¹⁴ 7 x 10¹²
29
Sr-89 50.53 d
2 x 10¹² 1 x 10¹²
2
Sr-90 28.79 y
2 x 10¹¹ 8 x 10¹⁰
3
Sr-91 9.63 h
1 x 10¹³ 2 x 10¹²
5
Sr-92 2.66 h
2 x 10¹³ 2 x 10¹²
10
Sulphur
S-35 87.51 d inorganic 1 x 10¹³ 1 x 10¹²
10
organic 1 x 10¹³ 2 x 10¹¹
50
gas / vapour 1 x 10¹¹
New
Tantalum
Ta-172 36.8 m
7 x 10¹³ 2 x 10¹²
35
Ta-173 3.14 h
4 x 10¹³ 2 x 10¹²
20

Appendix A
41
Radionuclide Half-life Form Revised value (Bq)
REPPIR 2001 value (Bq)
REPPIR2001
radionuclide
name (if
different)
Factor by which value has increased or decreased (rounded to nearest
whole number)
Ta-174 1.14 h
8 x 10¹³ 2 x 10¹²
40
Ta-175 10.5 h
4 x 10¹³ 2 x 10¹²
20
Ta-176 8.09 h
2 x 10¹³ 3 x 10¹²
7
Ta-177 56.56 h
7 x 10¹³ 1 x 10¹³
7
Ta-178m 2.36 h
7 x 10¹³ 3 x 10¹² Ta-178l 23
Ta-179 1.82 y
3 x 10¹³ 6 x 10¹²
5
Ta-180 8.152 h
1 x 10¹⁴ 6 x 10¹² Ta-180m 17
Ta-182 114.43 d
2 x 10¹² 3 x 10¹¹
7
Ta-182m 15.84 m
4 x 10¹⁴ 2 x 10¹²
200
Ta-183 5.1 d
5 x 10¹² 2 x 10¹²
3
Ta-184 8.7 h
1 x 10¹³ 2 x 10¹²
5
Ta-185 49.4 m
1 x 10¹⁴ 1 x 10¹²
100
Ta-186 10.5 m
1 x 10¹⁴ 9 x 10¹¹
111
Technetium
Tc-93 2.75 h
7 x 10¹³ 5 x 10¹³
1
Tc-93m 43.5 m
1 x 10¹⁴ 4 x 10¹²
25
Tc-94 293 m
3 x 10¹³ 6 x 10¹²
5
Tc-94m 52.0 m
5 x 10¹³ 1 x 10¹²
50
Tc-95 20.0 h
4 x 10¹³ 4 x 10¹³
Same
Tc-95m 61 d
8 x 10¹² 1 x 10¹²
8
Tc-96 4.28 d
8 x 10¹² 4 x 10¹²
2
Tc-96m 51.5 m
7 x 10¹⁴ 2 x 10¹³
35
Tc-97 2.6 x 10⁶ y
2 x 10¹³ 9 x 10¹²
2
Tc-97m 90.1 d
6 x 10¹² 5 x 10¹²
1
Tc-98 4.2 x 10⁶ y
5 x 10¹¹ 1 x 10¹¹
5
Tc-99 2.111 x 10⁵ y
2 x 10¹² 5 x 10¹⁰
40
Tc-99m 6.015 h
3 x 10¹⁴ 1 x 10¹³
30
Tc-101 14.2 m
3 x 10¹⁴ 2 x 10¹²
150
Tc-104 18.3 m
6 x 10¹³ 6 x 10¹¹
100
Tellurium
Te-116 2.49 h
5 x 10¹³ 6 x 10¹²
8
vapour 6 x 10¹³ 2 x 10¹⁴
3
Te-121 19.16 d
2 x 10¹³ 4 x 10¹²
5
vapour 2 x 10¹³ 3 x 10¹³
2
Te-121m 154 d
3 x 10¹² 1 x 10¹²
3
vapour 2 x 10¹² 3 x 10¹²
2

Derivation of Reference Values for Schedule 1 of the REPPIR-2019 Regulations
42
Radionuclide Half-life Form Revised value (Bq)
REPPIR 2001 value (Bq)
REPPIR2001
radionuclide
name (if
different)
Factor by which value has increased or decreased (rounded to nearest
whole number)
Te-123 6.00 x 10¹⁴ y
4 x 10¹² 6 x 10¹²
2
vapour 2 x 10¹² 2 x 10¹²
Same
Te-123m 119.25 d
4 x 10¹² 2 x 10¹²
2
vapour 3 x 10¹² 5 x 10¹²
2
Te-125m 57.40 d
5 x 10¹² 2 x 10¹²
3
vapour 6 x 10¹² 8 x 10¹²
1
Te-127 9.35 h
4 x 10¹³ 2 x 10¹²
20
vapour 5 x 10¹³ 2 x 10¹⁴
4
Te-127m 109 d
2 x 10¹² 1 x 10¹²
2
vapour 2 x 10¹² 2 x 10¹²
Same
Te-129 69.6 m
1 x 10¹⁴ 2 x 10¹²
50
vapour 1 x 10¹⁴ 4 x 10¹⁴
4
Te-129m 33.6 d
2 x 10¹² 1 x 10¹²
2
vapour 2 x 10¹² 3 x 10¹²
2
Te-131 25.0 m
9 x 10¹³ 1 x 10¹²
90
vapour 8 x 10¹³ 1 x 10¹⁴
1
Te-131m 30 h
4 x 10¹² 2 x 10¹²
2
vapour 3 x 10¹² 5 x 10¹²
2
Te-132 3.204 d
4 x 10¹² 3 x 10¹²
1
vapour 2 x 10¹² 2 x 10¹²
Same
Te-133 12.5 m
8 x 10¹³ 1 x 10¹²
80
vapour 8 x 10¹³ 7 x 10¹³
1
Te-133m 55.4 m
2 x 10¹³ 1 x 10¹²
20
vapour 2 x 10¹³ 2 x 10¹³
Same
Te-134 41.8 m
6 x 10¹³ 3 x 10¹²
20
vapour 6 x 10¹³ 7 x 10¹³
1
Terbium
Tb-147 1.64 h
3 x 10¹³ 2 x 10¹²
15
Tb-149 4.118 h
5 x 10¹² 2 x 10¹²
3
Tb-150 3.48 h
2 x 10¹³ 2 x 10¹²
10
Tb-151 17.609 h
2 x 10¹³ 4 x 10¹²
5
Tb-153 2.34 d
1 x 10¹³ 7 x 10¹²
1
Tb-154 21.5 h
1 x 10¹³ 4 x 10¹²
3
Tb-155 5.32 d
4 x 10¹³ 1 x 10¹³
4
Tb-156 5.35 d
7 x 10¹² 3 x 10¹²
2
Tb-156m 24.4 h
5 x 10¹³ 1 x 10¹³ Tb-156ml 5

Appendix A
43
Radionuclide Half-life Form Revised value (Bq)
REPPIR 2001 value (Bq)
REPPIR2001
radionuclide
name (if
different)
Factor by which value has increased or decreased (rounded to nearest
whole number)
Tb-156n 5.3 h
9 x 10¹³ 4 x 10¹² Tb-156ms 23
Tb-157 71 y
2 x 10¹³ 1 x 10¹³
2
Tb-158 180 y
6 x 10¹¹ 2 x 10¹¹
3
Tb-160 72.3 d
2 x 10¹² 5 x 10¹¹
4
Tb-161 6.906 d
9 x 10¹² 2 x 10¹²
5
Thallium
Tl-194 33.0 m
2 x 10¹⁴ 1 x 10¹³
20
Tl-194m 32.8 m
7 x 10¹³ 2 x 10¹²
35
Tl-195 1.16 h
1 x 10¹⁴ 4 x 10¹²
25
Tl-197 2.84 h
2 x 10¹⁴ 5 x 10¹²
40
Tl-198 5.3 h
5 x 10¹³ 7 x 10¹²
7
Tl-198m 1.87 h
7 x 10¹³ 2 x 10¹²
35
Tl-199 7.42 h
2 x 10¹⁴ 6 x 10¹²
33
Tl-200 26.1 h
3 x 10¹³ 1 x 10¹³
3
Tl-201 72.912 h
9 x 10¹³ 7 x 10¹²
13
Tl-202 12.23 d
2 x 10¹³ 7 x 10¹²
3
Tl-204 3.78 y
6 x 10¹² 2 x 10¹²
3
Thorium
Th-226 30.57 m
6 x 10¹¹ 4 x 10¹¹
2
Th-227 18.68 d
3 x 1009 2 x 1009
2
Th-228 1.9116 y
7 x 1008 6 x 1008
1
Th-229 7.34 x 10³ y
1 x 1008 1 x 1008
Same
Th-230 7.538 x 10⁴ y
3 x 1008 2 x 1008
2
Th-231 25.52 h
2 x 10¹³ 2 x 10¹²
10
Th-232 1.405 x10¹⁰ y
3 x 1008 2 x 1008
2
Th-234 24.10 d
2 x 10¹² 3 x 10¹²
2
Thulium
Tm-162 21.70 m
9 x 10¹³ 2 x 10¹²
45
Tm-166 7.70 h
2 x 10¹³ 3 x 10¹²
7
Tm-167 9.25 d
1 x 10¹³ 4 x 10¹²
3
Tm-170 128.6 d
2 x 10¹² 2 x 10¹²
Same
Tm-171 1.92 y
2 x 10¹³ 1 x 10¹³
2
Tm-172 63.6 h
5 x 10¹² 2 x 10¹²
3
Tm-173 8.24 h
3 x 10¹³ 2 x 10¹²
15
Tm-175 15.2 m
2 x 10¹⁴ 2 x 10¹²
100

Derivation of Reference Values for Schedule 1 of the REPPIR-2019 Regulations
44
Radionuclide Half-life Form Revised value (Bq)
REPPIR 2001 value (Bq)
REPPIR2001
radionuclide
name (if
different)
Factor by which value has increased or decreased (rounded to nearest
whole number)
Tin
Sn-110 4.11 h
3 x 10¹³ 6 x 10¹³
2
Sn-111 35.3 m
2 x 10¹⁴ 2 x 10¹²
100
Sn-113 115.09 d
6 x 10¹² 5 x 10¹²
1
Sn-117m 13.76 d
7 x 10¹² 3 x 10¹²
2
Sn-119m 293.1 d
9 x 10¹² 5 x 10¹²
2
Sn-121 27.03 h
3 x 10¹³ 3 x 10¹²
10
Sn-121m 43.9 y
5 x 10¹² 4 x 10¹²
1
Sn-123 129.2 d
2 x 10¹² 2 x 10¹²
Same
Sn-123m 40.06 m
2 x 10¹⁴ 2 x 10¹²
100
Sn-125 9.64 d
2 x 10¹² 1 x 10¹²
2
Sn-126 2.30 x 10⁵ y
8 x 10¹¹ 5 x 10¹¹
2
Sn-127 2.10 h
3 x 10¹³ 2 x 10¹²
15
Sn-128 59.07 m
5 x 10¹³ 2 x 10¹²
25
Titanium
Ti-44 60.0 y
2 x 10¹¹ 2 x 10¹¹
Same
Ti-45 184.8 m
4 x 10¹³ 2 x 10¹²
20
Tungsten
W-176 2.3 h
1 x 10¹⁴ 5 x 10¹²
20
W-177 132 m
9 x 10¹³ 3 x 10¹²
30
W-178 21.6 d
5 x 10¹³ 6 x 10¹³
1
W-179 37.05 m
2 x 10¹⁵ 1 x 10¹³
200
W-181 121.2 d
9 x 10¹³ 1 x 10¹³
9
W-185 75.1 d
2 x 10¹³ 4 x 10¹²
5
W-187 23.72 h
1 x 10¹³ 2 x 10¹²
5
W-188 69.78 d
4 x 10¹² 3 x 10¹²
1
Uranium
U-230 20.8 d
2 x 1009 2 x 1009
Same
U-231 4.2 d
2 x 10¹³ 7 x 10¹²
3
U-232 68.9 y
8 x 1008 6 x 1008
1
U-233 1.592 x 10⁵ y
3 x 1009 3 x 1009
Same
U-234 2.455 x 10⁵ y
3 x 1009 3 x 1009
Same
U-235 7.04 x 10⁸ y
3 x 1009 3 x 1009
Same
U-236 2.342 x 10⁷ y
3 x 1009 3 x 1009
Same
U-237 6.75 d
8 x 10¹² 2 x 10¹²
4

Appendix A
45
Radionuclide Half-life Form Revised value (Bq)
REPPIR 2001 value (Bq)
REPPIR2001
radionuclide
name (if
different)
Factor by which value has increased or decreased (rounded to nearest
whole number)
U-238 4.468 x 10⁹ y
4 x 1009 3 x 1009
1
U-239 23.45 m
3 x 10¹⁴ 2 x 10¹²
150
U-240 14.1 h
8 x 10¹² 2 x 10¹²
4
Vanadium
V-47 32.6 m
9 x 10¹³ 1 x 10¹²
90
V-48 15.9735 d
3 x 10¹² 1 x 10¹²
3
V-49 330 d
3 x 10¹⁴ 2 x 10¹⁴
2
Xenon
Xe-120 40 m
3 x 10¹⁴ 1 x 10¹⁴
3
Xe-121 40.1 m
7 x 10¹³ 3 x 10¹³
2
Xe-122 20.1 h
2 x 10¹⁵ 1 x 10¹⁵
2
Xe-123 2.08 h
2 x 10¹⁴ 9 x 10¹³
2
Xe-125 16.9 h
4 x 10¹⁴ 2 x 10¹⁴
2
Xe-127 36.4 d
4 x 10¹⁴ 2 x 10¹⁴
2
Xe-129m 8.88 d
4 x 10¹⁵ 2 x 10¹⁵
2
Xe-131m 11.84 d
1 x 10¹⁶ 4 x 10¹⁵
3
Xe-133 5.243 d
3 x 10¹⁵ 1 x 10¹⁵
3
Xe-133m 2.19 d
3 x 10¹⁵ 2 x 10¹⁵
2
Xe-135 9.14 h
4 x 10¹⁴ 2 x 10¹⁴
2
Xe-135m 15.29 m
4 x 10¹⁴ 1 x 10¹⁴
4
Xe-138 14.08 m
1 x 10¹⁴ 5 x 10¹³
2
Ytterbium
Yb-162 18.87 m
3 x 10¹⁴ 1 x 10¹³
30
Yb-166 56.7 h
1 x 10¹³ 8 x 10¹²
1
Yb-167 17.5 m
6 x 10¹⁴ 4 x 10¹²
150
Yb-169 32.026 d
6 x 10¹² 3 x 10¹²
2
Yb-175 4.185 d
2 x 10¹³ 4 x 10¹²
5
Yb-177 1.911 h
8 x 10¹³ 2 x 10¹²
40
Yb-178 74 m
7 x 10¹³ 2 x 10¹²
35
Yttrium
Y-86 14.74 h
9 x 10¹² 2 x 10¹²
5
Y-86m 48 m
2 x 10¹⁴ 1 x 10¹³
20
Y-87 79.8 h
2 x 10¹³ 2 x 10¹³
Same
Y-88 106.65 d
2 x 10¹² 2 x 10¹¹
10
Y-90 64.10 h
3 x 10¹² 2 x 10¹²
2

Derivation of Reference Values for Schedule 1 of the REPPIR-2019 Regulations
46
Radionuclide Half-life Form Revised value (Bq)
REPPIR 2001 value (Bq)
REPPIR2001
radionuclide
name (if
different)
Factor by which value has increased or decreased (rounded to nearest
whole number)
Y-90m 3.19 h
4 x 10¹³ 7 x 10¹²
6
Y-91 58.51 d
2 x 10¹² 2 x 10¹²
Same
Y-91m 49.71 m
3 x 10¹⁴ 2 x 10¹³
15
Y-92 3.54 h
2 x 10¹³ 6 x 10¹¹
33
Y-93 10.18 h
7 x 10¹² 8 x 10¹¹
9
Y-94 18.7 m
9 x 10¹³ 6 x 10¹¹
150
Y-95 10.3 m
1 x 10¹⁴ 6 x 10¹¹
167
Zinc
Zn-62 9.186 h
9 x 10¹² 1 x 10¹³
1
Zn-63 38.47 m
7 x 10¹³ 1 x 10¹²
70
Zn-65 244.06 d
3 x 10¹² 5 x 10¹⁰
60
Zn-69 56.4 m
2 x 10¹⁴ 2 x 10¹²
100
Zn-69m 13.76 h
2 x 10¹³ 2 x 10¹³
Same
Zn-71m 3.96 h
3 x 10¹³ 2 x 10¹²
15
Zn-72 46.5 h
6 x 10¹² 3 x 10¹²
2
Zirconium
Zr-86 16.5 h
1 x 10¹³ 2 x 10¹³
2
Zr-88 83.4 d
6 x 10¹² 1 x 10¹²
6
Zr-89 78.41 h
1 x 10¹³ 4 x 10¹²
3
Zr-93 1.53 x 10⁶ y
1 x 10¹² 8 x 10¹¹
1
Zr-95 64.032 d
3 x 10¹² 8 x 10¹¹
4
Zr-97 16.744 h
4 x 10¹² 2 x 10¹²
2

Appendix B
47
Appendix B Comparison of Schedule 1 REPPIR-2019 values with Schedule 2
REPPIR-2001 values
B1 Summary of changes
Using the revised methodology, 862 Schedule 1 REPPIR-2019 values have been calculated
for 771 radionuclides. Some radionuclides have several chemical forms, each of which has a
separate Schedule 1 value. In Schedule 2 REPPIR-2001, there were 863 values for 761
radionuclides.
In Schedule 2 REPPIR-2001, the maximum value was 1 x 10¹⁸ Bq (for tritium, 3H) – elemental
gas), and the minimum value was 1 x 10⁷ Bq for 250Cm. The maximum revised value is
2 x 10²⁰ Bq (for 37Ar), and the minimum value remains 1 x 10⁷ Bq (for 250Cm). In order to gain
a better understanding of the spread of the results, the cumulative number of values in each
power-of-ten band are detailed below.
Value (Bq) Number of values
Schedule 2 REPPIR-2001 Schedule 1 REPPIR-2019
< 107 0 0
107 – 108 3 3
108 – 109 27 26
109 – 1010 30 30
1010 – 1011 24 11
1011 – 1012 120 61
1012 – 1013 502 207
1013 – 1014 101 351
1014 – 1015 39 148
1015 – 1016 10 17
1016 – 1017 4 6
1017 – 1018 2 0
1018 – 1019 1 1
1019 – 1020 0 0
1020 – 1021 0 1
> 1021 0 0
Total 863 862
Since the publication of REPPIR-2001, ICRP has changed the name of 28 radionuclides, and
has removed tantalum-180m (180mTa). In REPPIR-2001, values were provided for 180Ta and 180mTa. ICRP has changed the name of 180Ta to 180mTa, and 180mTa to 180Ta. Also, ICRP
describes (what is now) 180mTa as “observationally stable”, and therefore provides no dose
coefficients for it. Hence, there is now a Schedule 1 value provided for 180Ta (previously called 180mTa), but not for 180mTa (previously called 180Ta).

Derivation of Reference Values for Schedule 1 of the REPPIR-2019 Regulations
48
Compared with Schedule 2 REPPIR-2001, Schedule 1 REPPIR-2019 now has:
• 3 entirely new values added: for 11C (methane form), 14C (methane form), and 15O
• a single value for organically bound tritium (3H, OBT), instead of separate values for OBT
and OBT gas/vapour
• no specific value for tritiated water; instead, a generic tritium (3H) value is provided
• a single value for 35S gas/vapour; instead of separate values for the vapour form of 35S,
carbon disulphide vapour, and sulphur dioxide gas
Where direct comparisons can be made between the Schedule 2 REPPIR-2001 values and
the newly calculated Schedule 1 values (taking into account ICRP name changes), 74 values
have not changed, 67 have decreased, and 717 have increased.
For every value, it is the effective dose criterion that determines the new Schedule 1 value.
This criterion was 5 mSv in the first year for REPPIR-2001, and is now 1 mSv in the first year.
Consequently, all other things being equal, one might expect all values to have decreased,
less activity being required to be released to reach 1 mSv than 5 mSv. However, not all things
are equal as a new dose calculation methodology has also been implemented. This new
methodology is more realistic (i.e. less highly conservative), and so in the majority of cases,
the new methodology leads to decrease the effective dose resulting from each becquerel
released, and therefore more activity can be released before the dose criterion is exceeded
(even though the dose criterion is lower), i.e. the majority of Schedule 1 values have
increased.
B2 A minority of values have decreased
Of the 67 values that have decreased, the majority are for radionuclides in gas/vapour forms
for which a greater range of dose pathways have now been included in the calculation
methodology. Of those values that have decreased, only 5 values have decreased by more
than a factor of 10, as follows:
Radionuclide (form) Schedule 2 REPPIR-2001 (Bq) Schedule 1 REPPIR-2019 (Bq)
C-14 (carbon dioxide) 3 x 10¹⁵ 3 x 10¹²
C-14 (carbon monoxide) 1 x 10¹⁶ 3 x 10¹²
C-14 (vapour) 4 x 10¹³ 3 x 10¹²
H-3 (elemental gas) 1 x 10¹⁸ 7 x 10¹⁴
H-3 (tritiated methane) 1 x 10¹⁷ 2 x 10¹⁵
All these tabulated radionuclide forms are gases/vapours, for which only the inhalation dose
and external dose from the cloud pathways were included in the Schedule 2 REPPIR-2001
calculation. Under the new methodology, additional pathways have been included, most
notably the ingestion of milk by infants, which dominates the total effective dose for all of these
radionuclides, except for 3H (elemental gas). The total effective dose from 3H (elemental gas)
is dominated by the dose received by the fetus following inhalation of material by its mother;
this is another pathway not included in the Schedule 2 REPPIR-2001 methodology. Hence for
these radionuclides, more dose (from more pathways) results for each becquerel released,

Appendix B
49
and hence less activity can be released before the dose criterion is exceeded, and therefore
the Schedule 1 values have decreased.
B3 The majority of values have increased
A total of 717 values have increased. These are:
• 399 values have increased by less than a factor of 10
• 246 values have increased by a factor of 10 or more, but less than a factor of 100
• 71 values have increased by a factor of 100 or more, but less than a factor of 1000
• 1 value (for 114In), has increased by a factor of more than 1000
As an illustration, the values for the following radionuclides have increased by more than a
factor of 300.
Radionuclide Schedule 2 REPPIR-2001 (Bq) Schedule 1 REPPIR-2019 (Bq)
In-114 1 x 10¹² 4 x 10¹⁵
Co-60m 7 x 10¹² 5 x 10¹⁵
Ar-37 4 x 10¹⁷ 2 x 10²⁰
Ho-164 2 x 10¹² 7 x 10¹⁴
Ba-131m 3 x 10¹² 1 x 10¹⁵
Br-80 1 x 10¹² 3 x 10¹⁴
Ga-70 1 x 10¹² 3 x 10¹⁴
As mentioned above, in the majority of cases, the new methodology works to decrease the
effective dose resulting from each becquerel released, and therefore more activity can be
released before the dose criterion is exceeded, i.e. the majority of Schedule 1 values have
increased. The following features of the methodology are examples of why less dose results
from the Schedule 1 REPPIR-2019 methodology than the one for Schedule 2 REPPIR-2001.
• Under the new methodology, the calculation of equivalent dose to skin is more
accurate and less highly conservative than before. For example, although the period of
skin exposure is the same (12 hours), the decay of activity on skin has been added to the
new methodology. Therefore, particularly for radionuclides with a very short half-life, less
equivalent dose to skin will result. For example, in the case of 114In, which has a half-life of
just 71.9 seconds, 12 hours of decay introduces a dose reduction factor of 0.0024. This
difference has a significant effect, as in REPPIR-2001 it was the large equivalent dose to
skin compared with the respective criterion that determined the Schedule 2 value for many
radionuclides. For Schedule 1 REPPIR-2019, the equivalent dose to skin never exceeds
the respective criterion; all Schedule 1 values are determined by the effective dose
criterion. To return to the example of 114In, it is now the effective dose from ingestion of
green vegetables that dominates, rather than the dose to skin. For all radionuclides listed
in the table above, which show the largest increase in value, it is the difference in the dose
to skin methodology that accounts for the increase.
• Also, under the new methodology, the calculation of effective ingestion dose from the
consumption of milk is less highly conservative than before. Several factors are
important here:

Derivation of Reference Values for Schedule 1 of the REPPIR-2019 Regulations
50
o In the previous methodology, dose from ingestion of milk was only calculated for
about 60 radionuclides, with the emphasis placed on those thought to be
important for milk consumption. Under the new Schedule 1 REPPIR-2019
methodology, milk concentration factors have been applied for nearly all
radionuclides based on new improved food chain modelling capability. For some
radionuclides, lower milk concentration factors than those used previously are
now appropriate. For example, for 79Se there is a factor of 40 difference between
the new concentration factor and the previous one, which acts to reduce the dose
from this pathway under the new methodology. However, for the majority of
radionuclides, an increased dose from this pathway results under the new
methodology, due to the dose from milk ingestion having not previously been
calculated at all for these radionuclides.
o Under the previous methodology, it was assumed that foodstuffs were located at
500m from the release point (for both milk and green vegetables). Under the new
methodology, foodstuffs are assumed to be located at 1 km from the release.
Activity concentration on the ground, which is the basis for all ingestion dose
calculations, decreases with distance from the release point for the release
modelled in this scenario. The change in the location of foodstuffs means that the
activity concentrations on the ground are less under the new methodology than
the old one, and this will act to reduce the ingestion doses. The activity
concentration on the ground at 500 m used for Schedule 2 REPPIR-2001 was
5 x 10⁻⁷ Bq m-2 per Bq released, compared with the activity concentration on the
ground at 1 km used for Schedule 1 REPPIR-2019 of 3 x 10⁻⁸ Bq m-2 per Bq
released.
o Under the new methodology, consumption rates are based on the 95th percentile
rate, rather than the 97th percentile rate. For example, under the new
methodology, infants consume 290 litres of milk per year, but under the previous
methodology they consume 320 litres per year. This acts to decrease the
ingestion dose calculated under the new methodology.
• Updated dispersion modelling (NRPB-R91 in Schedule 2 REPPIR 2001 is replaced by
the use of NAME in Schedule 1 REPPIR-2019) leads to a reduction in the time integrated
activity concentration in the air and on the ground. As these values are the foundations for
the calculation of dose from the various pathways, the lower values in the new
methodology result in lower doses.
Time integrated activity concentration in air and deposited activity concentration at 100m from release location
Schedule 2 REPPIR-2001* Schedule 1 REPPIR-2019†
Time integrated activity concentration
in air (Bq s m-3 per Bq release) 9.0 10-4 1.1 10-4
Deposited activity concentration
(Bq m-2 per Bq release) 9.0 10-6 1.4 10-7
Notes:
* From Gaussian, NRPB-R91 model. † From probabilistic analysis of historical UK meteorological data using NAME and PACE to estimate 95th percentile
concentrations.

Appendix B
51
The differences in skin dose, ingestion of milk, and dispersion factors described above are the
key factors which result in the majority of Schedule 1 REPPIR-2019 values being larger and
hence less restrictive than those in Schedule 2 REPPIR-2001. All differences in the
methodologies combine to affect the magnitude of the differences seen. In the majority of
cases, the decrease in the effective dose criterion, which should act to decrease the values, is
outweighed by the effect of the new methodology, which acts to decrease the majority of
doses, and therefore increase the Schedule 1 REPPIR-2019 values.
To illustrate the combination of factors, take the case of 75Se. The new Schedule 1
REPPIR-2019 value is 4 x 10¹² Bq. The previous Schedule 2 REPPIR-2001 value was
2 x 10¹¹ Bq. The new value is 20 times greater than the previous one. The factors which
contribute to this difference are:
• the activity concentrations in milk (per unit deposit) are greater in Schedule 2 by a factor
of ~20
• the activity concentration on the ground is greater in Schedule 2 by a factor of ~16
• these 2 factors result in the effective dose from milk being greater in Schedule 2 by a
factor of ~320
• in Schedule 2, the ingestion of milk is the only significant pathway for 75Se
• however, in Schedule 1, the following exposure pathways all make significant
contributions to the total effective dose: ingestion of contaminated green vegetables,
external exposure from the plume, and inhalation of the plume
• the total effective dose in Schedule 2 (mainly from ingestion of milk), is ~85 times greater
than the total effective dose in Schedule 1 (from all pathways)
• taking into account the change in effective dose criteria (5 mSv in Schedule 2, and 1 mSv
in Schedule 1), the 75Se value in Schedule 1 is 20 times that in Schedule 2