Embed Size (px)
Citation preview
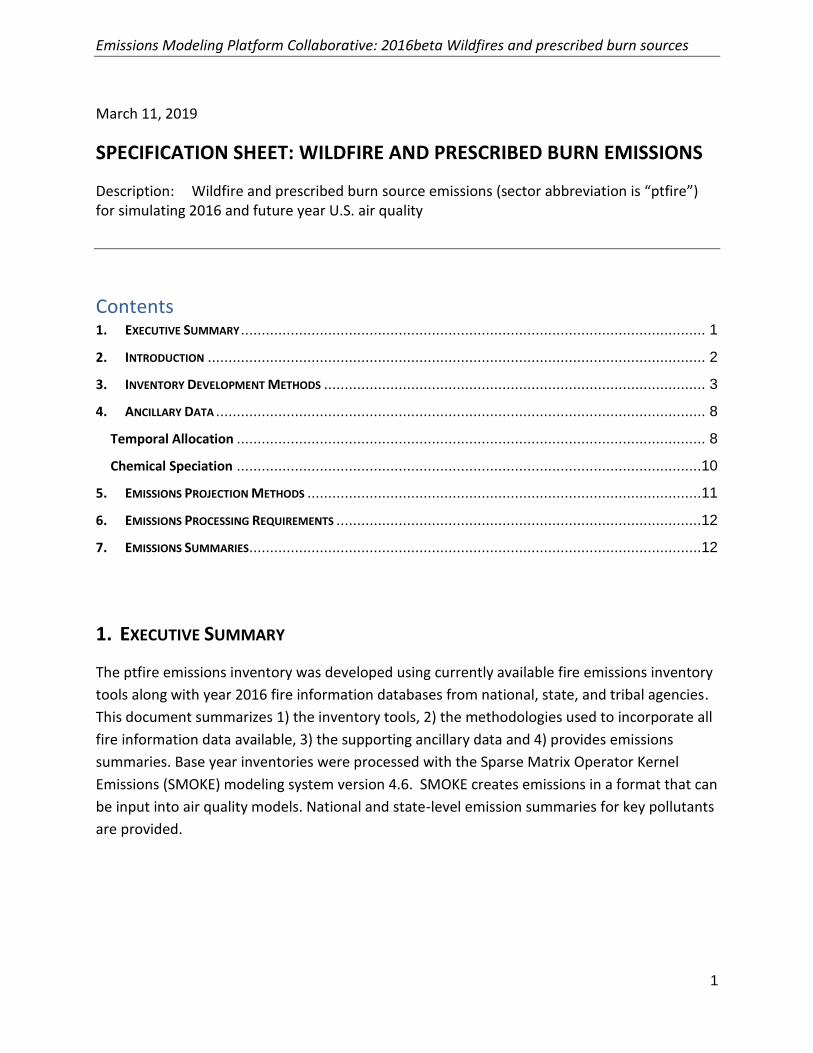
Emissions Modeling Platform Collaborative: 2016beta Wildfires and prescribed burn sources
1
March 11, 2019
SPECIFICATION SHEET: WILDFIRE AND PRESCRIBED BURN EMISSIONS
Description: Wildfire and prescribed burn source emissions (sector abbreviation is “ptfire”) for simulating 2016 and future year U.S. air quality
Contents 1. EXECUTIVE SUMMARY ................................................................................................................ 1
2. INTRODUCTION ........................................................................................................................ 2
3. INVENTORY DEVELOPMENT METHODS ............................................................................................ 3
4. ANCILLARY DATA ...................................................................................................................... 8
Temporal Allocation ................................................................................................................. 8
Chemical Speciation ................................................................................................................10
5. EMISSIONS PROJECTION METHODS ...............................................................................................11
6. EMISSIONS PROCESSING REQUIREMENTS ........................................................................................12
7. EMISSIONS SUMMARIES.............................................................................................................12
1. EXECUTIVE SUMMARY
The ptfire emissions inventory was developed using currently available fire emissions inventory
tools along with year 2016 fire information databases from national, state, and tribal agencies.
This document summarizes 1) the inventory tools, 2) the methodologies used to incorporate all
fire information data available, 3) the supporting ancillary data and 4) provides emissions
summaries. Base year inventories were processed with the Sparse Matrix Operator Kernel
Emissions (SMOKE) modeling system version 4.6. SMOKE creates emissions in a format that can
be input into air quality models. National and state-level emission summaries for key pollutants
are provided.
Emissions Modeling Platform Collaborative: 2016beta Wildfires and prescribed burn sources
2
2. INTRODUCTION
Wildfires and prescribed burns that occur during the inventory year are included in the year
2016 beta version as event and point sources. The agricultural fires (ptagfire) are described in a
separate document. Estimated emissions from wildfires and prescribed burns are calculated
from burned area data. Input data sets were collected from state/local/tribal (S/L/T) agencies
and from national agencies and organizations. Raw burned area data compiled from S/L/T
agencies and national data sources are organized and combined to produce a comprehensive
burned area data set. Emissions are calculated using fire emission models that rely on burned
area as well as fuel and weather information. The resulting emissions are then compiled by
date and location.
For purposes of emission inventory preparation, wildland fire (WLF) is defined as “any non-
structure fire that occurs in the wildland” (an area in which human activity and development
are essentially non-existent, except for roads, railroads, power lines, and similar transportation
facilities). Wildland fire activity is categorized by the conditions under which the fire occurs.
These conditions influence important aspects of fire behavior, including smoke emissions. In
the 2016 beta inventory, data processing is conducted differently depending on the fire type, as
defined below:
• Wildfire (WF): “any fire started by an unplanned ignition caused by lightning; volcanoes;
other acts of nature; unauthorized activity; or accidental, human-caused actions, or a
prescribed fire that has developed into a wildfire.”
• Prescribed (Rx) fire: “any fire intentionally ignited by management actions in accordance
with applicable laws, policies, and regulations to meet specific land or resource
management objectives.” Prescribed fire is one type of fuels treatment. Fuels
treatments are vegetation management activities intended to modify or reduce
hazardous fuels. Fuels treatments include prescribed fires, wildland fire use, and
mechanical treatment.
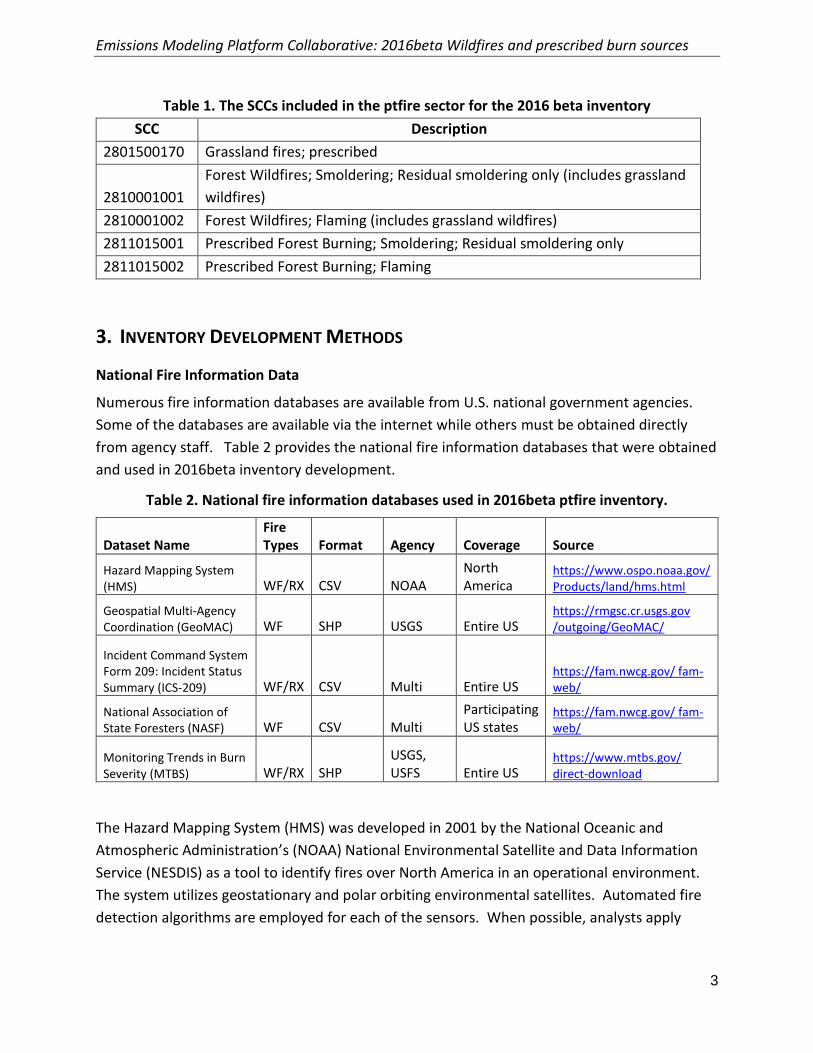
The SCC used and SCC descriptions for the ptfire sources are shown in Table 1 and include
separate SCCs for the flaming and smoldering combustion phases for wildfire and prescribed
burns. Also, note that prescribed grassland fires specifically for Flint Hills, Kansas have its own
SCC in the 2016 beta inventory. The year 2016 fire season also included some major wild
grassland fires. These wild grassland fires were assigned the standard Wildfire SCCs shown in
Table 1.
Emissions Modeling Platform Collaborative: 2016beta Wildfires and prescribed burn sources
3
Table 1. The SCCs included in the ptfire sector for the 2016 beta inventory
SCC Description
2801500170 Grassland fires; prescribed
2810001001
Forest Wildfires; Smoldering; Residual smoldering only (includes grassland
wildfires)
2810001002 Forest Wildfires; Flaming (includes grassland wildfires)
2811015001 Prescribed Forest Burning; Smoldering; Residual smoldering only
2811015002 Prescribed Forest Burning; Flaming
3. INVENTORY DEVELOPMENT METHODS
National Fire Information Data
Numerous fire information databases are available from U.S. national government agencies.
Some of the databases are available via the internet while others must be obtained directly
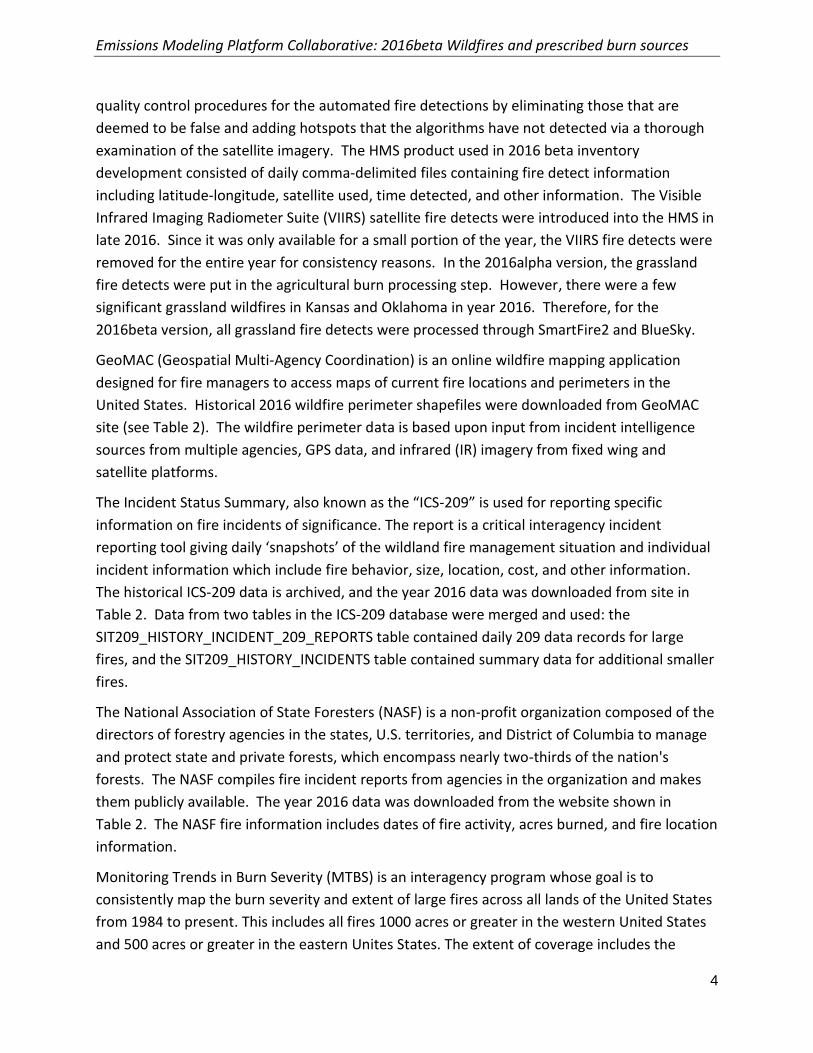
from agency staff. Table 2 provides the national fire information databases that were obtained
and used in 2016beta inventory development.
Table 2. National fire information databases used in 2016beta ptfire inventory.
Dataset Name Fire Types Format Agency Coverage Source
Hazard Mapping System (HMS) WF/RX CSV NOAA
North America
https://www.ospo.noaa.gov/ Products/land/hms.html
Geospatial Multi-Agency Coordination (GeoMAC) WF SHP USGS Entire US
https://rmgsc.cr.usgs.gov /outgoing/GeoMAC/
Incident Command System Form 209: Incident Status Summary (ICS-209) WF/RX CSV Multi Entire US
https://fam.nwcg.gov/ fam-web/
National Association of State Foresters (NASF) WF CSV Multi
Participating US states
https://fam.nwcg.gov/ fam-web/
Monitoring Trends in Burn Severity (MTBS) WF/RX SHP
USGS, USFS Entire US
https://www.mtbs.gov/ direct-download
The Hazard Mapping System (HMS) was developed in 2001 by the National Oceanic and
Atmospheric Administration’s (NOAA) National Environmental Satellite and Data Information
Service (NESDIS) as a tool to identify fires over North America in an operational environment.
The system utilizes geostationary and polar orbiting environmental satellites. Automated fire
detection algorithms are employed for each of the sensors. When possible, analysts apply
Emissions Modeling Platform Collaborative: 2016beta Wildfires and prescribed burn sources
4
quality control procedures for the automated fire detections by eliminating those that are
deemed to be false and adding hotspots that the algorithms have not detected via a thorough
examination of the satellite imagery. The HMS product used in 2016 beta inventory
development consisted of daily comma-delimited files containing fire detect information
including latitude-longitude, satellite used, time detected, and other information. The Visible
Infrared Imaging Radiometer Suite (VIIRS) satellite fire detects were introduced into the HMS in
late 2016. Since it was only available for a small portion of the year, the VIIRS fire detects were
removed for the entire year for consistency reasons. In the 2016alpha version, the grassland
fire detects were put in the agricultural burn processing step. However, there were a few
significant grassland wildfires in Kansas and Oklahoma in year 2016. Therefore, for the
2016beta version, all grassland fire detects were processed through SmartFire2 and BlueSky.
GeoMAC (Geospatial Multi-Agency Coordination) is an online wildfire mapping application
designed for fire managers to access maps of current fire locations and perimeters in the
United States. Historical 2016 wildfire perimeter shapefiles were downloaded from GeoMAC
site (see Table 2). The wildfire perimeter data is based upon input from incident intelligence
sources from multiple agencies, GPS data, and infrared (IR) imagery from fixed wing and
satellite platforms.
The Incident Status Summary, also known as the “ICS-209” is used for reporting specific
information on fire incidents of significance. The report is a critical interagency incident
reporting tool giving daily ‘snapshots’ of the wildland fire management situation and individual
incident information which include fire behavior, size, location, cost, and other information.
The historical ICS-209 data is archived, and the year 2016 data was downloaded from site in
Table 2. Data from two tables in the ICS-209 database were merged and used: the
SIT209_HISTORY_INCIDENT_209_REPORTS table contained daily 209 data records for large
fires, and the SIT209_HISTORY_INCIDENTS table contained summary data for additional smaller
fires.
The National Association of State Foresters (NASF) is a non-profit organization composed of the
directors of forestry agencies in the states, U.S. territories, and District of Columbia to manage
and protect state and private forests, which encompass nearly two-thirds of the nation's
forests. The NASF compiles fire incident reports from agencies in the organization and makes
them publicly available. The year 2016 data was downloaded from the website shown in
Table 2. The NASF fire information includes dates of fire activity, acres burned, and fire location
information.
Monitoring Trends in Burn Severity (MTBS) is an interagency program whose goal is to
consistently map the burn severity and extent of large fires across all lands of the United States
from 1984 to present. This includes all fires 1000 acres or greater in the western United States
and 500 acres or greater in the eastern Unites States. The extent of coverage includes the
Emissions Modeling Platform Collaborative: 2016beta Wildfires and prescribed burn sources
5
continental U.S., Alaska, Hawaii and Puerto Rico. Fire occurrence and satellite data from
various sources are compiled to create numerous MTBS fire products. The MTBS Burned Areas
Boundaries Dataset shapefiles were downloaded. The shapefiles include year 2016 fires and
the shapefiles are classified as either wildfires, prescribed burns or unknown fire types. The
unknown fire type shapes were omitted in the 2016beta inventory development due to
temporal and spatial problems found when trying to use these data.
State/Local/Tribal fire information
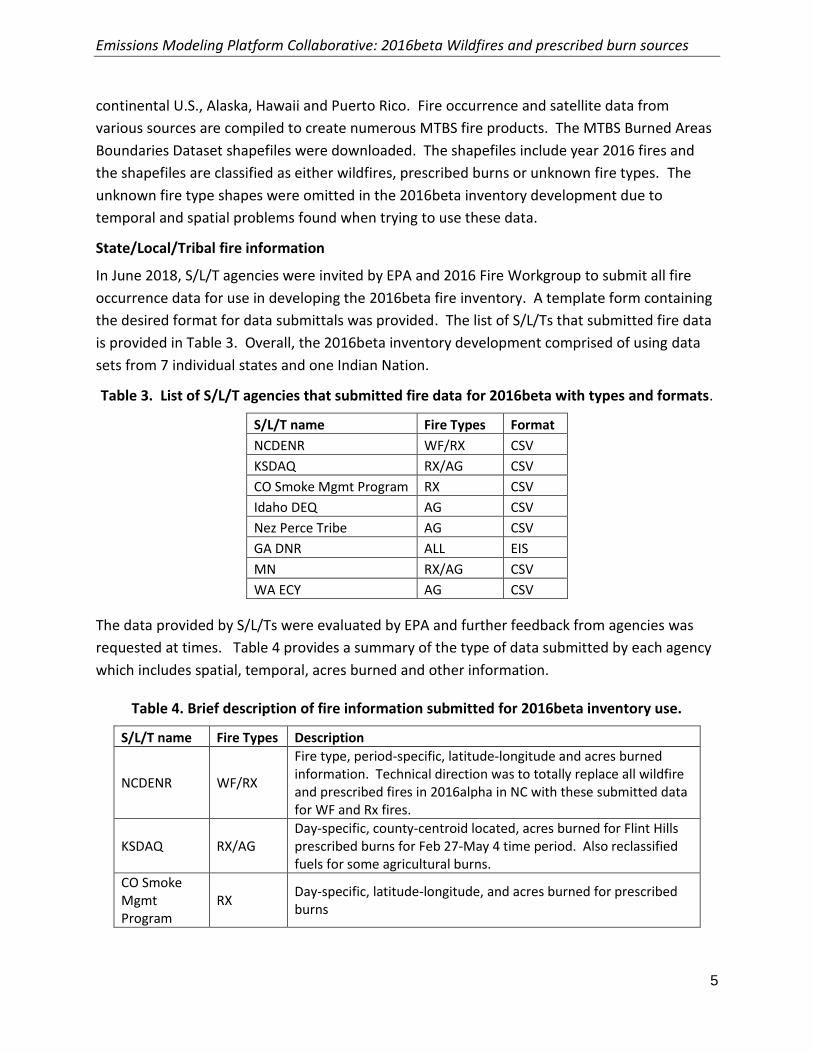
In June 2018, S/L/T agencies were invited by EPA and 2016 Fire Workgroup to submit all fire
occurrence data for use in developing the 2016beta fire inventory. A template form containing
the desired format for data submittals was provided. The list of S/L/Ts that submitted fire data
is provided in Table 3. Overall, the 2016beta inventory development comprised of using data
sets from 7 individual states and one Indian Nation.
Table 3. List of S/L/T agencies that submitted fire data for 2016beta with types and formats.
S/L/T name Fire Types Format
NCDENR WF/RX CSV
KSDAQ RX/AG CSV
CO Smoke Mgmt Program RX CSV
Idaho DEQ AG CSV
Nez Perce Tribe AG CSV
GA DNR ALL EIS
MN RX/AG CSV
WA ECY AG CSV
The data provided by S/L/Ts were evaluated by EPA and further feedback from agencies was
requested at times. Table 4 provides a summary of the type of data submitted by each agency
which includes spatial, temporal, acres burned and other information.
Table 4. Brief description of fire information submitted for 2016beta inventory use.
S/L/T name Fire Types Description
NCDENR WF/RX
Fire type, period-specific, latitude-longitude and acres burned information. Technical direction was to totally replace all wildfire and prescribed fires in 2016alpha in NC with these submitted data for WF and Rx fires.
KSDAQ RX/AG Day-specific, county-centroid located, acres burned for Flint Hills prescribed burns for Feb 27-May 4 time period. Also reclassified fuels for some agricultural burns.
CO Smoke Mgmt Program
RX Day-specific, latitude-longitude, and acres burned for prescribed burns
Emissions Modeling Platform Collaborative: 2016beta Wildfires and prescribed burn sources
6
S/L/T name Fire Types Description
Idaho DEQ AG Day-specific, latitude-longitude, acres burned for agricultural burns. Total replacement of 2016 alpha fires for Idaho.
Nez Perce Tribe
AG Day-specific, latitude-longitude, acres burned for agricultural burns. Total replacement of 2016 alpha fires for this tribal region.
GA DNR ALL
Data submitted included all fires types via EIS. The wildfire and prescribed burn data were provided as daily, point emissions sources. The agricultural burns were provided as annual, non-point emissions sources.
MN RX/AG Corrected latitude-longitude, day-specific and acres burned for some prescribed and agricultural burns.
WA ECY AG
Month-specific, latitude-longitude, acres burned, fuel loading and emissions for agricultural burns. Not day-specific so allocation to daily implemented by EPA. Also note WA state direction included to continue to use the 2014NEIv2 pile burns that were included in the non-point sector for 2016 beta.
Emissions Estimation Methodology
Preparation of the 2016beta wildfire and prescribed burn emissions begins with the national
and S/L/T data mentioned earlier and ends with daily estimates of emissions from flaming
combustion and smoldering combustion phases. Flaming combustion is combustion that occurs
with a flame. Flaming combustion is more complete combustion and is more prevalent with
fuels that have a high surface-to-volume ratio, a low bulk density, and low moisture content.
Smoldering combustion is combustion that occurs without a flame. Smoldering combustion is
less complete and produces some pollutants, such as PM2.5, VOCs, and CO at higher rates than
flaming combustion. Smoldering combustion is more prevalent with fuels that have low
surface–to-volume ratios, high bulk density, and high moisture content. Models sometimes
differentiate between smoldering emissions that are lofted with a smoke plume and those that
remain near the ground (residual emissions), but for the purposes of the 2016 beta inventory
the residual smoldering emissions were allocated to the smoldering SCCs mentioned in Table 1.
The lofted smoldering emissions were allocated along with the flaming emissions to the flaming
emissions SCCs in Table 1.
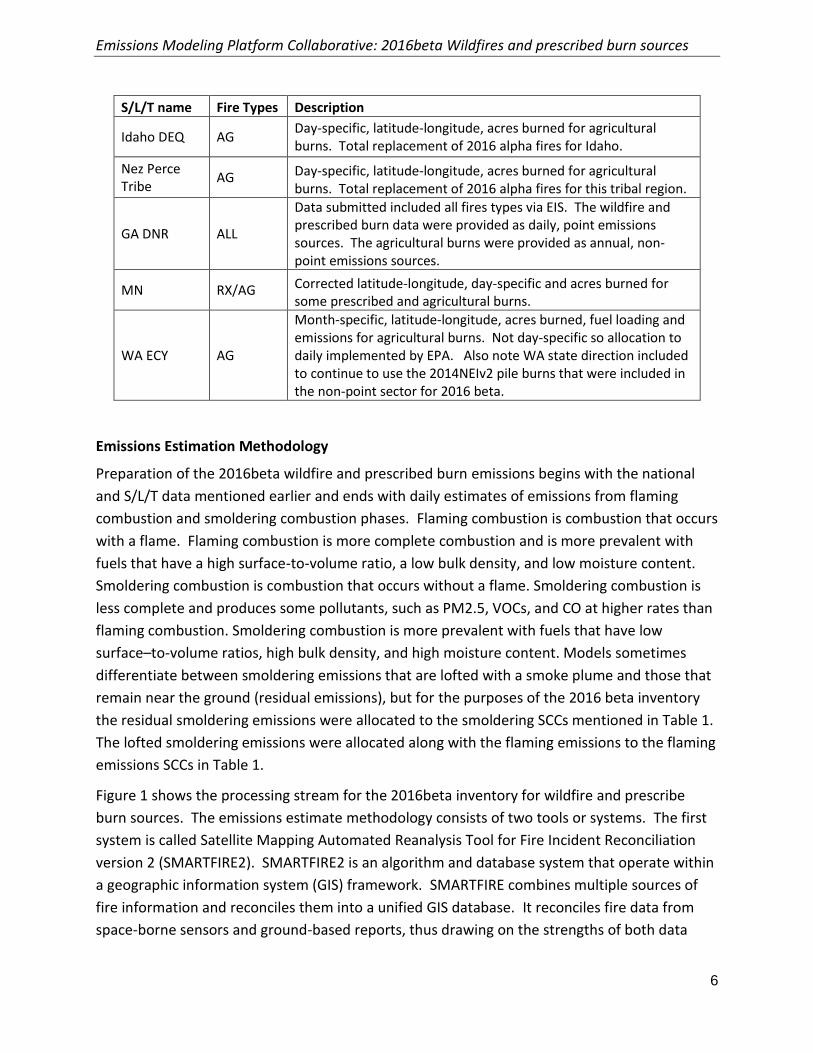
Figure 1 shows the processing stream for the 2016beta inventory for wildfire and prescribe
burn sources. The emissions estimate methodology consists of two tools or systems. The first
system is called Satellite Mapping Automated Reanalysis Tool for Fire Incident Reconciliation
version 2 (SMARTFIRE2). SMARTFIRE2 is an algorithm and database system that operate within
a geographic information system (GIS) framework. SMARTFIRE combines multiple sources of
fire information and reconciles them into a unified GIS database. It reconciles fire data from
space-borne sensors and ground-based reports, thus drawing on the strengths of both data
Emissions Modeling Platform Collaborative: 2016beta Wildfires and prescribed burn sources
7
types while avoiding double-counting. At its core, SMARTFIRE2 is an association engine that
links reports covering the same fire in any number of multiple databases. In this process, all
input information is preserved, and no attempt is made to reconcile conflicting or potentially
contradictory information (for example, the existence of a fire in one database but not
another). In the 2016beta inventory case, the national and S/L/T fire information is input into
SMARTFIRE2 and then all information is merged and associated together based on user-defined
weights for each fire information dataset. The output from SMARTFIRE2 is daily acres burned
and latitude-longitude coordinates for each fire.
Figure 1. Processing flow for fire emission estimates in the 2016beta inventory
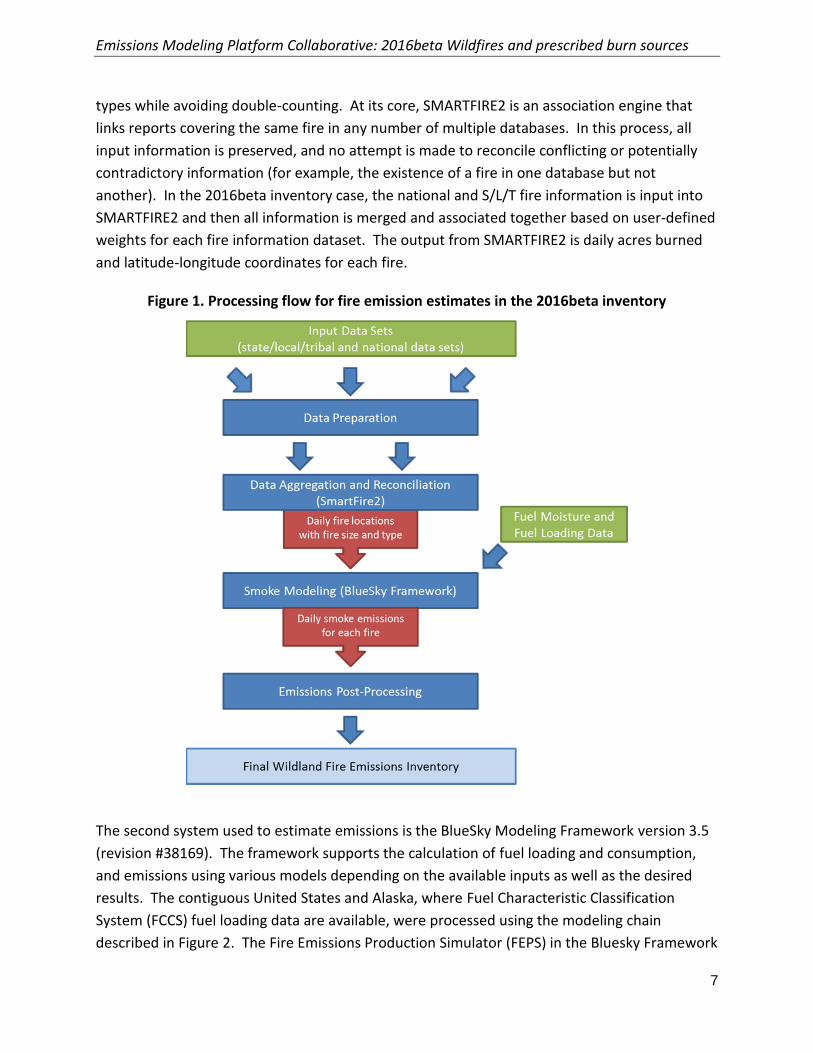
The second system used to estimate emissions is the BlueSky Modeling Framework version 3.5
(revision #38169). The framework supports the calculation of fuel loading and consumption,
and emissions using various models depending on the available inputs as well as the desired
results. The contiguous United States and Alaska, where Fuel Characteristic Classification
System (FCCS) fuel loading data are available, were processed using the modeling chain
described in Figure 2. The Fire Emissions Production Simulator (FEPS) in the Bluesky Framework
Emissions Modeling Platform Collaborative: 2016beta Wildfires and prescribed burn sources
8
generates all the CAP emission factors for wildland fires used in the 2016beta inventory (need
note about HAPS factors).
Figure 2. Blue Sky Modeling Framework
For the 2016beta inventory, the FCCSv2 was upgraded to the LANDFIRE v1.4 fuel bed
information (See: https://www.landfire.gov/fccs.php). The FCCSv3 module was implemented
along with the LANDFIREv1.4 (at 200 meter resolution) to provide better fuel bed information
for the BlueSky Framework. The LANDFIREv1.4 was aggregated from the native resolution and
projection to 200 meter using a nearest-neighbor methodology. Aggregation and reprojection
was required for the proper function on BSF.
4. ANCILLARY DATA
Temporal Allocation
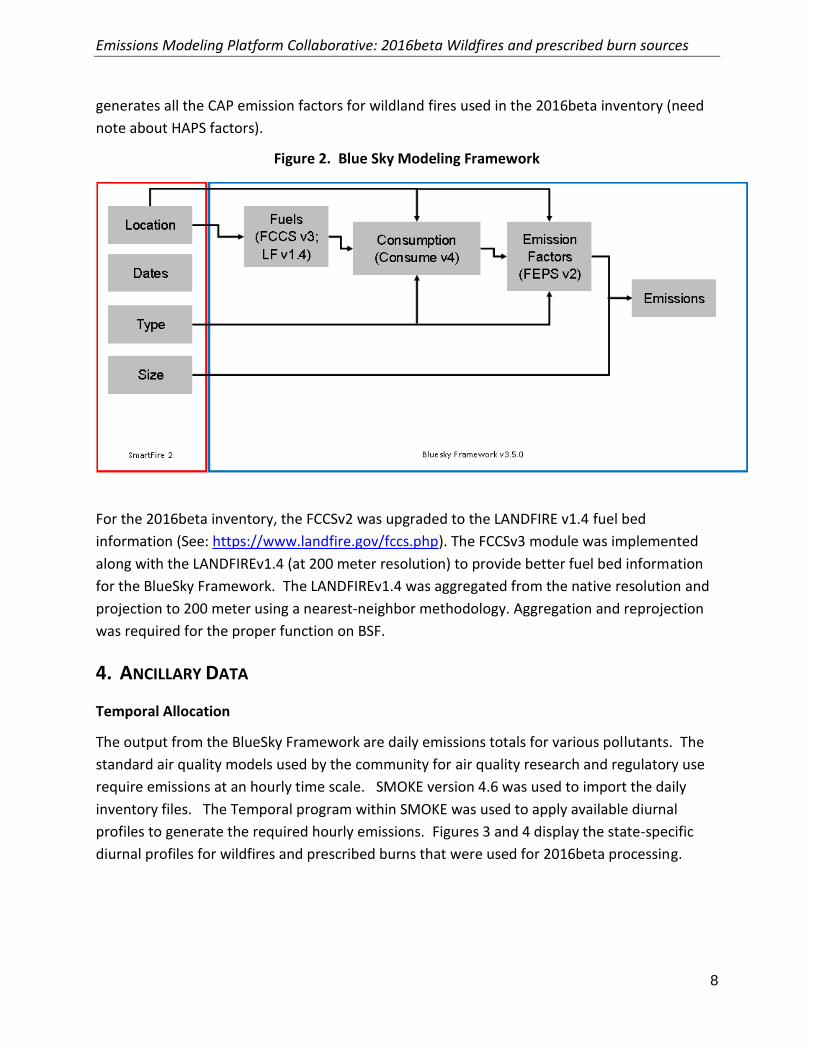
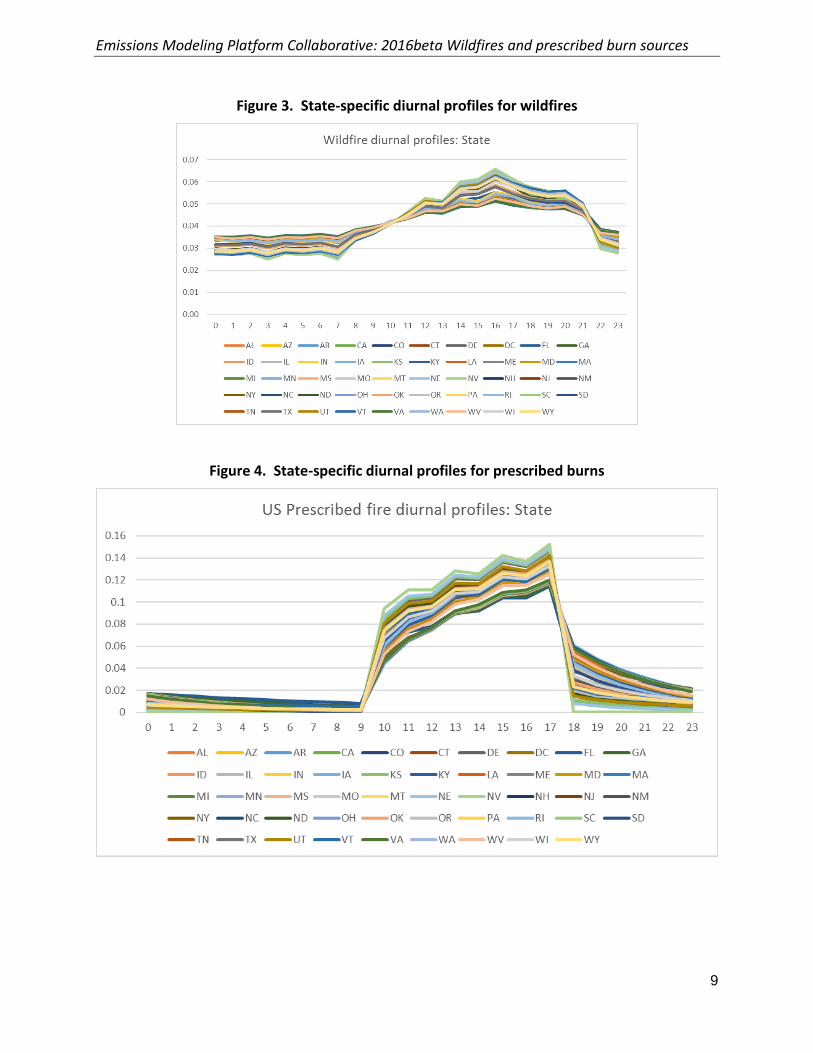
The output from the BlueSky Framework are daily emissions totals for various pollutants. The
standard air quality models used by the community for air quality research and regulatory use
require emissions at an hourly time scale. SMOKE version 4.6 was used to import the daily
inventory files. The Temporal program within SMOKE was used to apply available diurnal
profiles to generate the required hourly emissions. Figures 3 and 4 display the state-specific
diurnal profiles for wildfires and prescribed burns that were used for 2016beta processing.
Emissions Modeling Platform Collaborative: 2016beta Wildfires and prescribed burn sources
9
Figure 3. State-specific diurnal profiles for wildfires
Figure 4. State-specific diurnal profiles for prescribed burns
Emissions Modeling Platform Collaborative: 2016beta Wildfires and prescribed burn sources
10
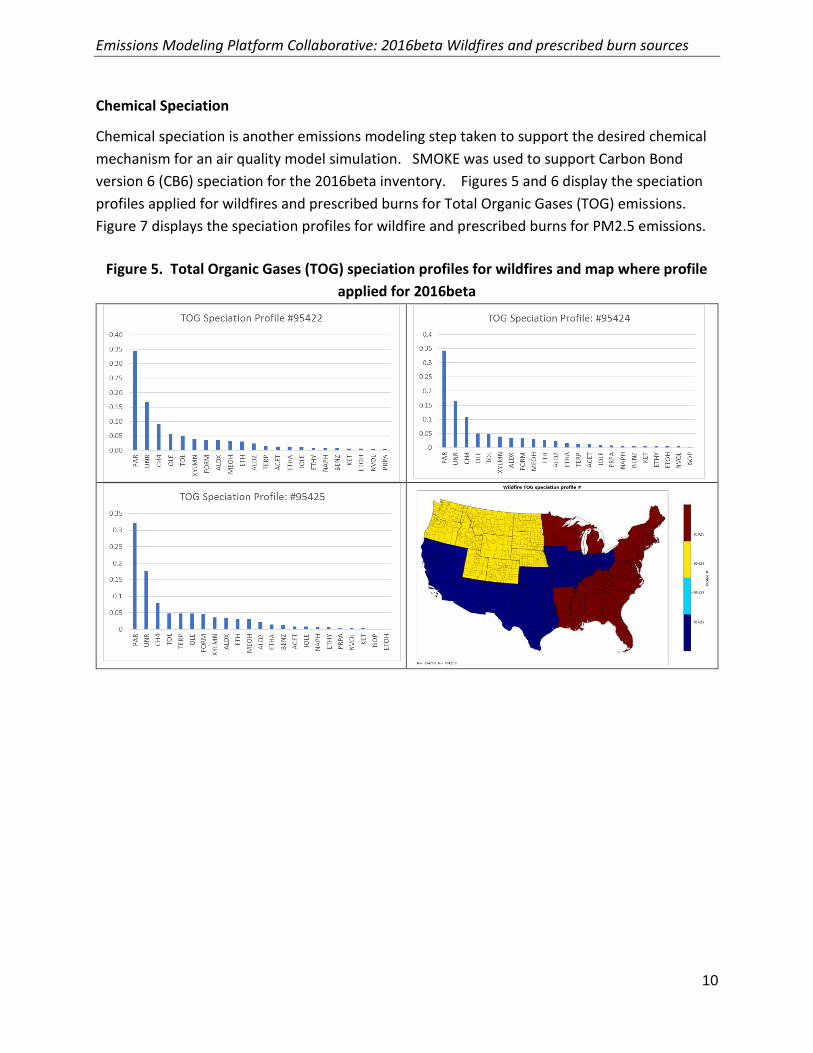
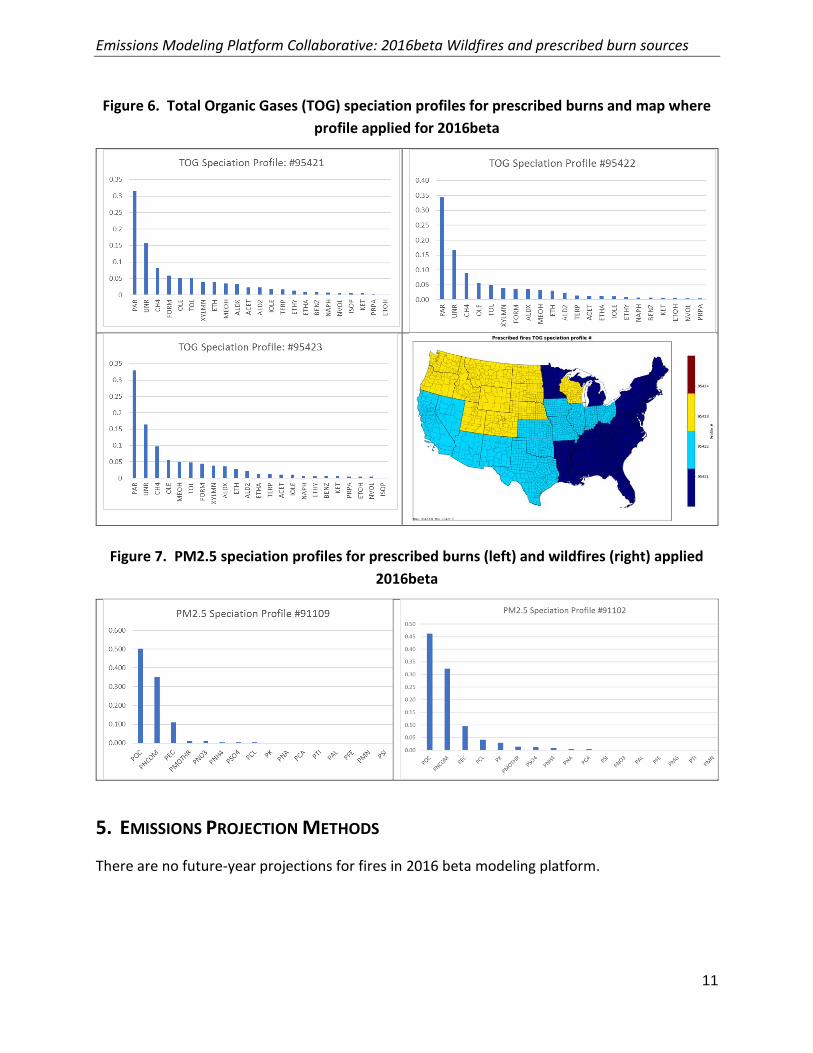
Chemical Speciation
Chemical speciation is another emissions modeling step taken to support the desired chemical
mechanism for an air quality model simulation. SMOKE was used to support Carbon Bond
version 6 (CB6) speciation for the 2016beta inventory. Figures 5 and 6 display the speciation
profiles applied for wildfires and prescribed burns for Total Organic Gases (TOG) emissions.
Figure 7 displays the speciation profiles for wildfire and prescribed burns for PM2.5 emissions.
Figure 5. Total Organic Gases (TOG) speciation profiles for wildfires and map where profile
applied for 2016beta
Emissions Modeling Platform Collaborative: 2016beta Wildfires and prescribed burn sources
11
Figure 6. Total Organic Gases (TOG) speciation profiles for prescribed burns and map where
profile applied for 2016beta
Figure 7. PM2.5 speciation profiles for prescribed burns (left) and wildfires (right) applied
2016beta
5. EMISSIONS PROJECTION METHODS
There are no future-year projections for fires in 2016 beta modeling platform.
Emissions Modeling Platform Collaborative: 2016beta Wildfires and prescribed burn sources
12
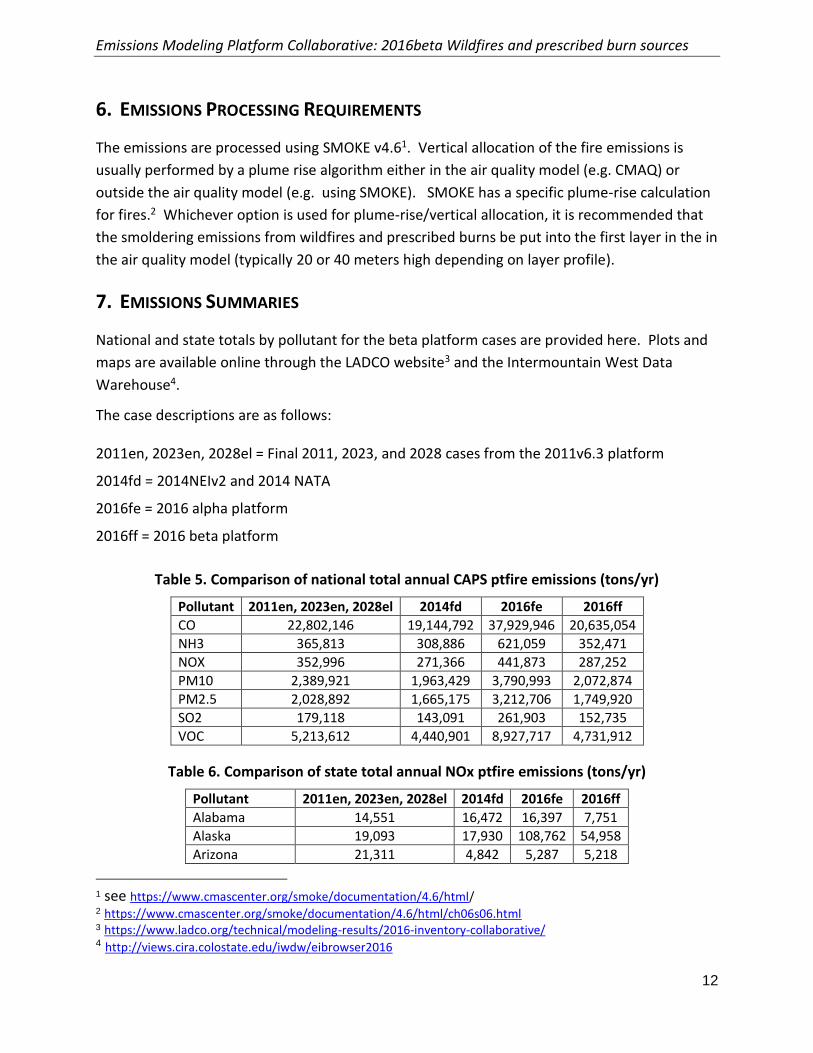
6. EMISSIONS PROCESSING REQUIREMENTS
The emissions are processed using SMOKE v4.61. Vertical allocation of the fire emissions is
usually performed by a plume rise algorithm either in the air quality model (e.g. CMAQ) or
outside the air quality model (e.g. using SMOKE). SMOKE has a specific plume-rise calculation
for fires.2 Whichever option is used for plume-rise/vertical allocation, it is recommended that
the smoldering emissions from wildfires and prescribed burns be put into the first layer in the in
the air quality model (typically 20 or 40 meters high depending on layer profile).
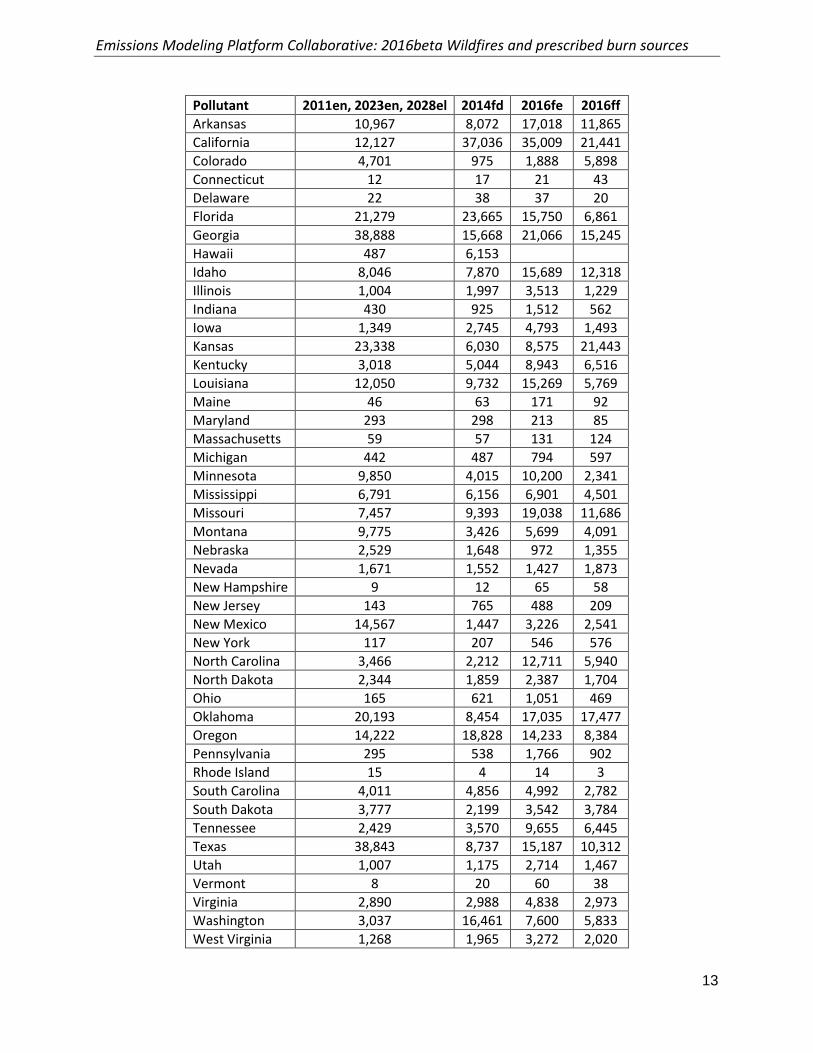
7. EMISSIONS SUMMARIES
National and state totals by pollutant for the beta platform cases are provided here. Plots and
maps are available online through the LADCO website3 and the Intermountain West Data
Warehouse4.
The case descriptions are as follows:
2011en, 2023en, 2028el = Final 2011, 2023, and 2028 cases from the 2011v6.3 platform
2014fd = 2014NEIv2 and 2014 NATA
2016fe = 2016 alpha platform
2016ff = 2016 beta platform
Table 5. Comparison of national total annual CAPS ptfire emissions (tons/yr)
Pollutant 2011en, 2023en, 2028el 2014fd 2016fe 2016ff
CO 22,802,146 19,144,792 37,929,946 20,635,054
NH3 365,813 308,886 621,059 352,471
NOX 352,996 271,366 441,873 287,252
PM10 2,389,921 1,963,429 3,790,993 2,072,874
PM2.5 2,028,892 1,665,175 3,212,706 1,749,920
SO2 179,118 143,091 261,903 152,735
VOC 5,213,612 4,440,901 8,927,717 4,731,912
Table 6. Comparison of state total annual NOx ptfire emissions (tons/yr)
Pollutant 2011en, 2023en, 2028el 2014fd 2016fe 2016ff
Alabama 14,551 16,472 16,397 7,751
Alaska 19,093 17,930 108,762 54,958
Arizona 21,311 4,842 5,287 5,218
1 see https://www.cmascenter.org/smoke/documentation/4.6/html/ 2 https://www.cmascenter.org/smoke/documentation/4.6/html/ch06s06.html 3 https://www.ladco.org/technical/modeling-results/2016-inventory-collaborative/ 4 http://views.cira.colostate.edu/iwdw/eibrowser2016
Emissions Modeling Platform Collaborative: 2016beta Wildfires and prescribed burn sources
13
Pollutant 2011en, 2023en, 2028el 2014fd 2016fe 2016ff
Arkansas 10,967 8,072 17,018 11,865
California 12,127 37,036 35,009 21,441
Colorado 4,701 975 1,888 5,898
Connecticut 12 17 21 43
Delaware 22 38 37 20
Florida 21,279 23,665 15,750 6,861
Georgia 38,888 15,668 21,066 15,245
Hawaii 487 6,153 Idaho 8,046 7,870 15,689 12,318
Illinois 1,004 1,997 3,513 1,229
Indiana 430 925 1,512 562
Iowa 1,349 2,745 4,793 1,493
Kansas 23,338 6,030 8,575 21,443
Kentucky 3,018 5,044 8,943 6,516
Louisiana 12,050 9,732 15,269 5,769
Maine 46 63 171 92
Maryland 293 298 213 85
Massachusetts 59 57 131 124
Michigan 442 487 794 597
Minnesota 9,850 4,015 10,200 2,341
Mississippi 6,791 6,156 6,901 4,501
Missouri 7,457 9,393 19,038 11,686
Montana 9,775 3,426 5,699 4,091
Nebraska 2,529 1,648 972 1,355
Nevada 1,671 1,552 1,427 1,873
New Hampshire 9 12 65 58
New Jersey 143 765 488 209
New Mexico 14,567 1,447 3,226 2,541
New York 117 207 546 576
North Carolina 3,466 2,212 12,711 5,940
North Dakota 2,344 1,859 2,387 1,704
Ohio 165 621 1,051 469
Oklahoma 20,193 8,454 17,035 17,477
Oregon 14,222 18,828 14,233 8,384
Pennsylvania 295 538 1,766 902
Rhode Island 15 4 14 3
South Carolina 4,011 4,856 4,992 2,782
South Dakota 3,777 2,199 3,542 3,784
Tennessee 2,429 3,570 9,655 6,445
Texas 38,843 8,737 15,187 10,312
Utah 1,007 1,175 2,714 1,467
Vermont 8 20 60 38
Virginia 2,890 2,988 4,838 2,973
Washington 3,037 16,461 7,600 5,833
West Virginia 1,268 1,965 3,272 2,020
Emissions Modeling Platform Collaborative: 2016beta Wildfires and prescribed burn sources
14
Pollutant 2011en, 2023en, 2028el 2014fd 2016fe 2016ff
Wisconsin 566 857 1,366 698
Wyoming 8,019 872 10,052 7,262
Puerto Rico 18 414
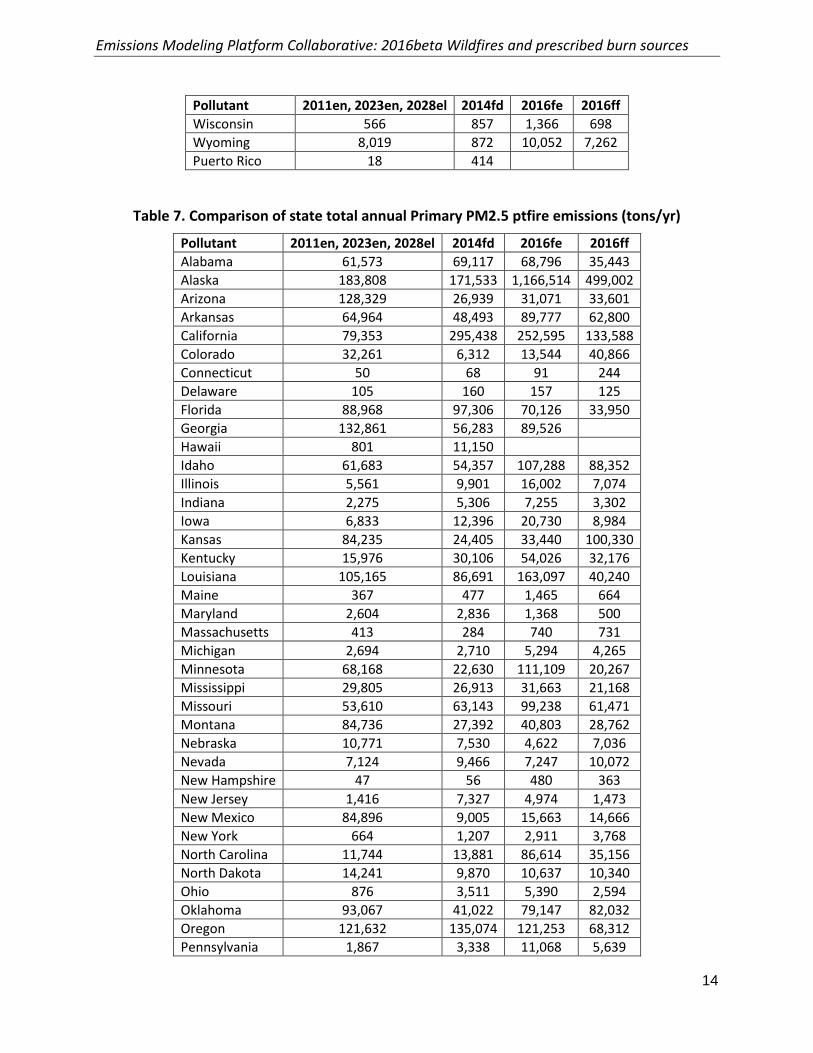
Table 7. Comparison of state total annual Primary PM2.5 ptfire emissions (tons/yr)
Pollutant 2011en, 2023en, 2028el 2014fd 2016fe 2016ff
Alabama 61,573 69,117 68,796 35,443
Alaska 183,808 171,533 1,166,514 499,002
Arizona 128,329 26,939 31,071 33,601
Arkansas 64,964 48,493 89,777 62,800
California 79,353 295,438 252,595 133,588
Colorado 32,261 6,312 13,544 40,866
Connecticut 50 68 91 244
Delaware 105 160 157 125
Florida 88,968 97,306 70,126 33,950
Georgia 132,861 56,283 89,526 Hawaii 801 11,150 Idaho 61,683 54,357 107,288 88,352
Illinois 5,561 9,901 16,002 7,074
Indiana 2,275 5,306 7,255 3,302
Iowa 6,833 12,396 20,730 8,984
Kansas 84,235 24,405 33,440 100,330
Kentucky 15,976 30,106 54,026 32,176
Louisiana 105,165 86,691 163,097 40,240
Maine 367 477 1,465 664
Maryland 2,604 2,836 1,368 500
Massachusetts 413 284 740 731
Michigan 2,694 2,710 5,294 4,265
Minnesota 68,168 22,630 111,109 20,267
Mississippi 29,805 26,913 31,663 21,168
Missouri 53,610 63,143 99,238 61,471
Montana 84,736 27,392 40,803 28,762
Nebraska 10,771 7,530 4,622 7,036
Nevada 7,124 9,466 7,247 10,072
New Hampshire 47 56 480 363
New Jersey 1,416 7,327 4,974 1,473
New Mexico 84,896 9,005 15,663 14,666
New York 664 1,207 2,911 3,768
North Carolina 11,744 13,881 86,614 35,156
North Dakota 14,241 9,870 10,637 10,340
Ohio 876 3,511 5,390 2,594
Oklahoma 93,067 41,022 79,147 82,032
Oregon 121,632 135,074 121,253 68,312
Pennsylvania 1,867 3,338 11,068 5,639
Emissions Modeling Platform Collaborative: 2016beta Wildfires and prescribed burn sources
15
Pollutant 2011en, 2023en, 2028el 2014fd 2016fe 2016ff
Rhode Island 64 16 53 20
South Carolina 18,263 22,180 25,104 14,527
South Dakota 32,403 15,265 30,067 25,069
Tennessee 11,280 16,576 46,767 30,217
Texas 194,224 50,670 86,943 48,471
Utah 6,758 6,486 16,916 9,066
Vermont 55 112 407 251
Virginia 14,698 16,682 27,002 15,262
Washington 22,503 119,131 53,858 41,750
West Virginia 7,495 12,676 19,588 10,524
Wisconsin 3,179 4,314 7,129 4,237
Wyoming 72,405 6,863 73,151 51,167
Puerto Rico 19 576
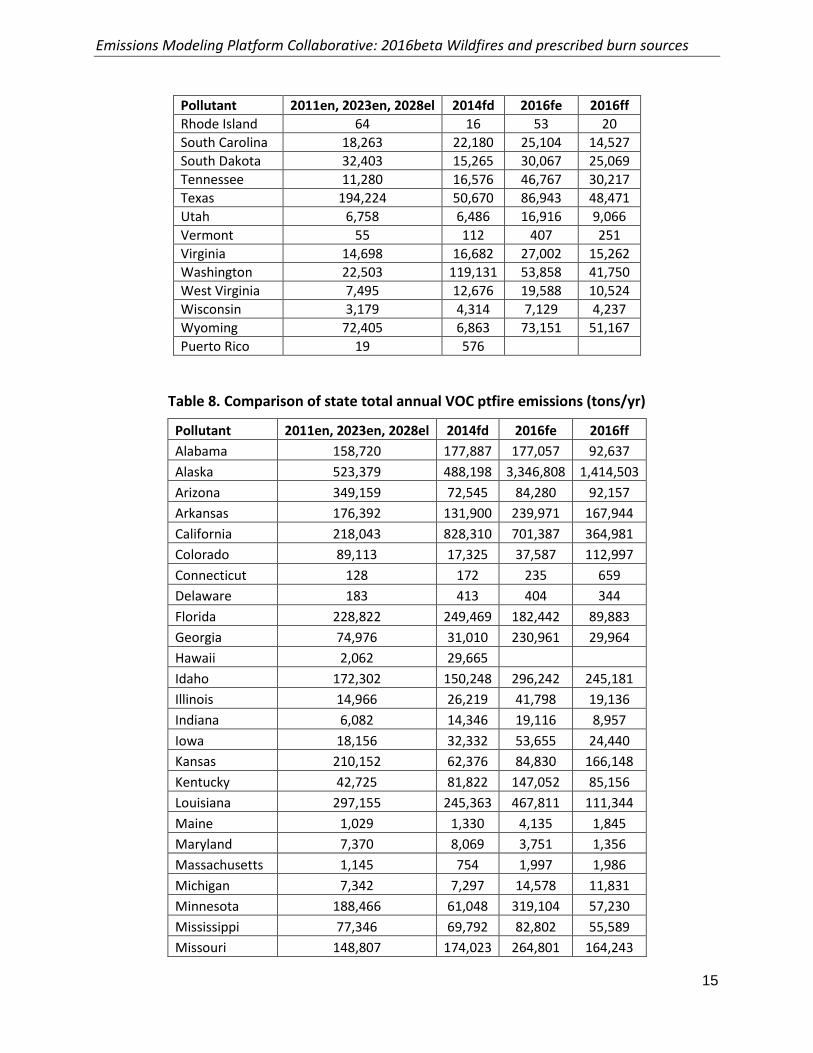
Table 8. Comparison of state total annual VOC ptfire emissions (tons/yr)
Pollutant 2011en, 2023en, 2028el 2014fd 2016fe 2016ff
Alabama 158,720 177,887 177,057 92,637
Alaska 523,379 488,198 3,346,808 1,414,503
Arizona 349,159 72,545 84,280 92,157
Arkansas 176,392 131,900 239,971 167,944
California 218,043 828,310 701,387 364,981
Colorado 89,113 17,325 37,587 112,997
Connecticut 128 172 235 659
Delaware 183 413 404 344
Florida 228,822 249,469 182,442 89,883
Georgia 74,976 31,010 230,961 29,964
Hawaii 2,062 29,665
Idaho 172,302 150,248 296,242 245,181
Illinois 14,966 26,219 41,798 19,136
Indiana 6,082 14,346 19,116 8,957
Iowa 18,156 32,332 53,655 24,440
Kansas 210,152 62,376 84,830 166,148
Kentucky 42,725 81,822 147,052 85,156
Louisiana 297,155 245,363 467,811 111,344
Maine 1,029 1,330 4,135 1,845
Maryland 7,370 8,069 3,751 1,356
Massachusetts 1,145 754 1,997 1,986
Michigan 7,342 7,297 14,578 11,831
Minnesota 188,466 61,048 319,104 57,230
Mississippi 77,346 69,792 82,802 55,589
Missouri 148,807 174,023 264,801 164,243
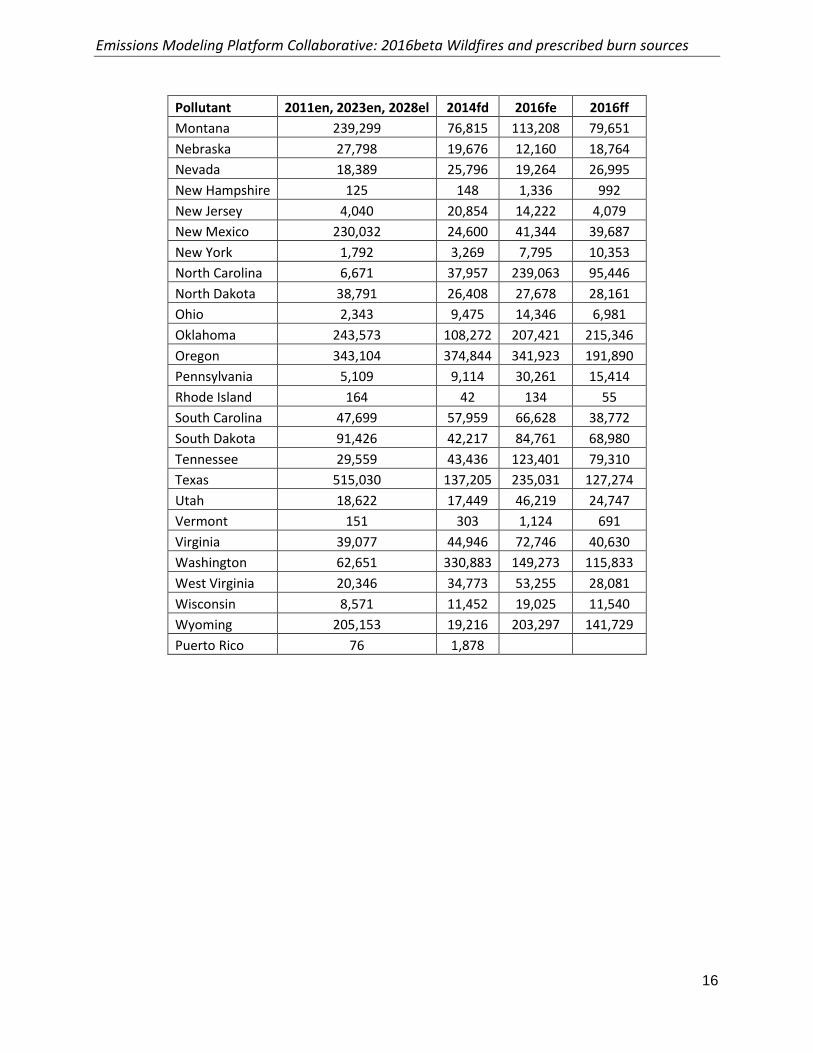
Emissions Modeling Platform Collaborative: 2016beta Wildfires and prescribed burn sources
16
Pollutant 2011en, 2023en, 2028el 2014fd 2016fe 2016ff
Montana 239,299 76,815 113,208 79,651
Nebraska 27,798 19,676 12,160 18,764
Nevada 18,389 25,796 19,264 26,995
New Hampshire 125 148 1,336 992
New Jersey 4,040 20,854 14,222 4,079
New Mexico 230,032 24,600 41,344 39,687
New York 1,792 3,269 7,795 10,353
North Carolina 6,671 37,957 239,063 95,446
North Dakota 38,791 26,408 27,678 28,161
Ohio 2,343 9,475 14,346 6,981
Oklahoma 243,573 108,272 207,421 215,346
Oregon 343,104 374,844 341,923 191,890
Pennsylvania 5,109 9,114 30,261 15,414
Rhode Island 164 42 134 55
South Carolina 47,699 57,959 66,628 38,772
South Dakota 91,426 42,217 84,761 68,980
Tennessee 29,559 43,436 123,401 79,310
Texas 515,030 137,205 235,031 127,274
Utah 18,622 17,449 46,219 24,747
Vermont 151 303 1,124 691
Virginia 39,077 44,946 72,746 40,630
Washington 62,651 330,883 149,273 115,833
West Virginia 20,346 34,773 53,255 28,081
Wisconsin 8,571 11,452 19,025 11,540
Wyoming 205,153 19,216 203,297 141,729
Puerto Rico 76 1,878
Emissions Modeling Platform Collaborative: 2016beta Wildfires and prescribed burn sources
17
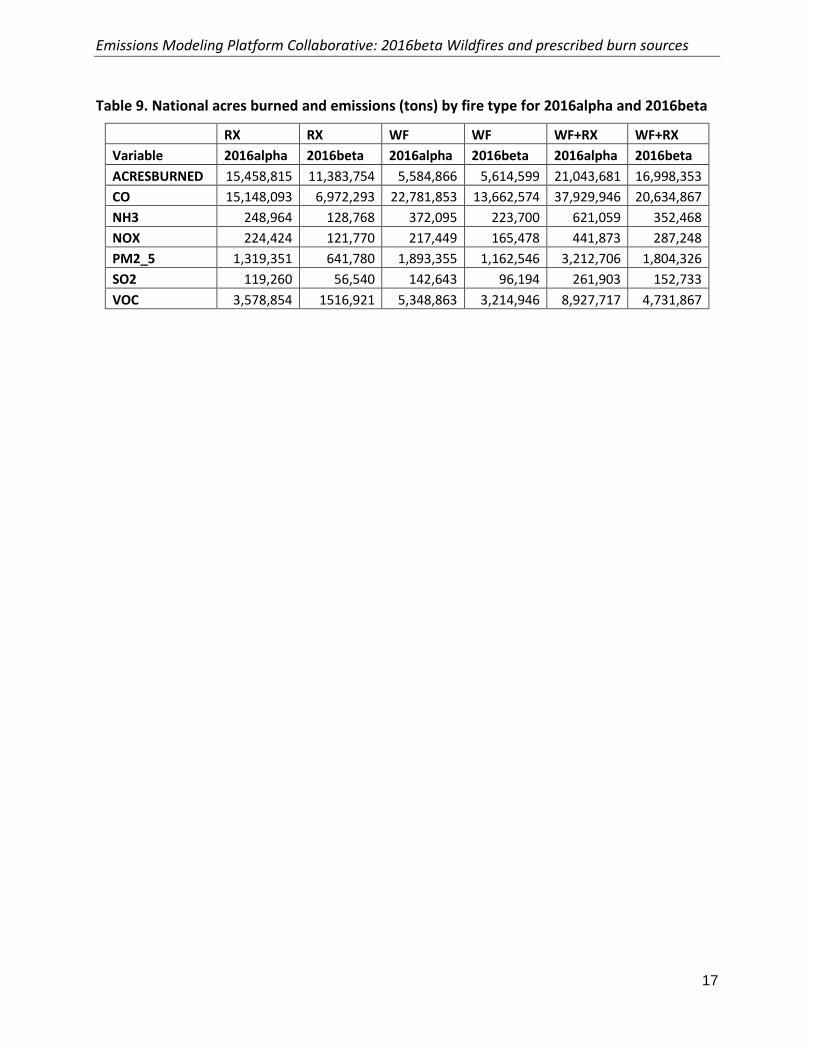
Table 9. National acres burned and emissions (tons) by fire type for 2016alpha and 2016beta
RX RX WF WF WF+RX WF+RX
Variable 2016alpha 2016beta 2016alpha 2016beta 2016alpha 2016beta
ACRESBURNED 15,458,815 11,383,754 5,584,866 5,614,599 21,043,681 16,998,353
CO 15,148,093 6,972,293 22,781,853 13,662,574 37,929,946 20,634,867
NH3 248,964 128,768 372,095 223,700 621,059 352,468
NOX 224,424 121,770 217,449 165,478 441,873 287,248
PM2_5 1,319,351 641,780 1,893,355 1,162,546 3,212,706 1,804,326
SO2 119,260 56,540 142,643 96,194 261,903 152,733
VOC 3,578,854 1516,921 5,348,863 3,214,946 8,927,717 4,731,867