Embed Size (px)
Citation preview
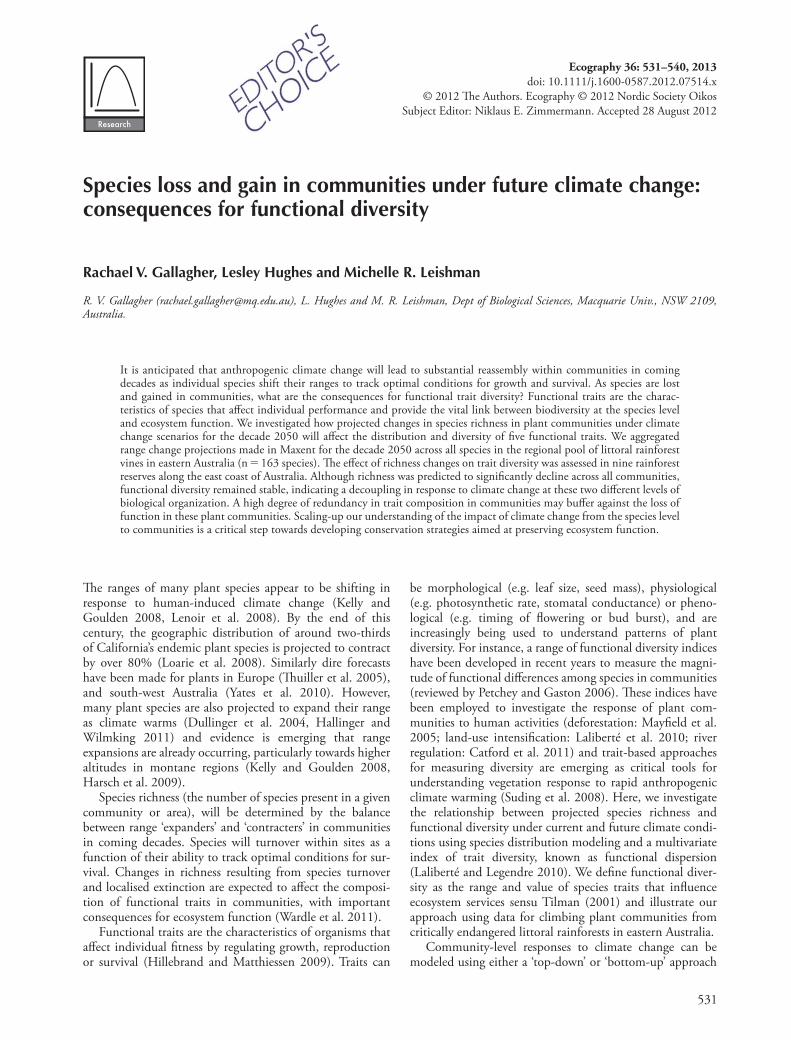
531
Species loss and gain in communities under future climate change: consequences for functional diversity
Rachael V. Gallagher , Lesley Hughes and Michelle R. Leishman
R. V. Gallagher ([email protected]), L. Hughes and M. R. Leishman, Dept of Biological Sciences, Macquarie Univ., NSW 2109, Australia.
It is anticipated that anthropogenic climate change will lead to substantial reassembly within communities in coming decades as individual species shift their ranges to track optimal conditions for growth and survival. As species are lost and gained in communities, what are the consequences for functional trait diversity? Functional traits are the charac-teristics of species that aff ect individual performance and provide the vital link between biodiversity at the species level and ecosystem function. We investigated how projected changes in species richness in plant communities under climate change scenarios for the decade 2050 will aff ect the distribution and diversity of fi ve functional traits. We aggregated range change projections made in Maxent for the decade 2050 across all species in the regional pool of littoral rainforest vines in eastern Australia (n � 163 species). Th e eff ect of richness changes on trait diversity was assessed in nine rainforest reserves along the east coast of Australia. Although richness was predicted to signifi cantly decline across all communities, functional diversity remained stable, indicating a decoupling in response to climate change at these two diff erent levels of biological organization. A high degree of redundancy in trait composition in communities may buff er against the loss of function in these plant communities. Scaling-up our understanding of the impact of climate change from the species level to communities is a critical step towards developing conservation strategies aimed at preserving ecosystem function.
Th e ranges of many plant species appear to be shifting in response to human-induced climate change (Kelly and Goulden 2008, Lenoir et al. 2008). By the end of this century, the geographic distribution of around two-thirds of California ’ s endemic plant species is projected to contract by over 80% (Loarie et al. 2008). Similarly dire forecasts have been made for plants in Europe (Th uiller et al. 2005), and south-west Australia (Yates et al. 2010). However, many plant species are also projected to expand their range as climate warms (Dullinger et al. 2004, Hallinger and Wilmking 2011) and evidence is emerging that range expansions are already occurring, particularly towards higher altitudes in montane regions (Kelly and Goulden 2008, Harsch et al. 2009).
Species richness (the number of species present in a given community or area), will be determined by the balance between range ‘ expanders ’ and ‘ contracters ’ in communities in coming decades. Species will turnover within sites as a function of their ability to track optimal conditions for sur-vival. Changes in richness resulting from species turnover and localised extinction are expected to aff ect the composi-tion of functional traits in communities, with important consequences for ecosystem function (Wardle et al. 2011).
Functional traits are the characteristics of organisms that aff ect individual fi tness by regulating growth, reproduction or survival (Hillebrand and Matthiessen 2009). Traits can
be morphological (e.g. leaf size, seed mass), physiological (e.g. photosynthetic rate, stomatal conductance) or pheno-logical (e.g. timing of fl owering or bud burst), and are increasingly being used to understand patterns of plant diversity. For instance, a range of functional diversity indices have been developed in recent years to measure the magni-tude of functional diff erences among species in communities (reviewed by Petchey and Gaston 2006). Th ese indices have been employed to investigate the response of plant com-munities to human activities (deforestation: Mayfi eld et al. 2005; land-use intensifi cation: Laliberté et al. 2010; river regulation: Catford et al. 2011) and trait-based approaches for measuring diversity are emerging as critical tools for understanding vegetation response to rapid anthropogenic climate warming (Suding et al. 2008). Here, we investigate the relationship between projected species richness and functional diversity under current and future climate condi-tions using species distribution modeling and a multivariate index of trait diversity, known as functional dispersion (Lalibert é and Legendre 2010). We defi ne functional diver-sity as the range and value of species traits that infl uence ecosystem services sensu Tilman (2001) and illustrate our approach using data for climbing plant communities from critically endangered littoral rainforests in eastern Australia.
Community-level responses to climate change can be modeled using either a ‘ top-down ’ or ‘ bottom-up ’ approach
Ecography 36: 531–540, 2013
doi: 10.1111/j.1600-0587.2012.07514.x
© 2012 Th e Authors. Ecography © 2012 Nordic Society Oikos
Subject Editor: Niklaus E. Zimmermann. Accepted 28 August 2012
532
(Ferrier and Guisan 2006). We employed a bottom-up approach, also known as a ‘ predict fi rst, assemble later ’ strategy, where individual predictions for each species in a community are aggregated into a single spatial projection. Although time-intensive, this approach allows the incorpo-ration of individualistic species ’ responses that, taken collectively, will drive the widespread reorganization of com-munities in coming decades. Individualistic responses may be poorly captured by top-down methods in which a single predictive relationship is modeled for all species in the community based on their physical environment. Bottom-up approaches have been widely applied to investigate changes in species richness under climate change (Th uiller et al. 2006, Buisson and Grenouillet 2009), but few studies have used the resulting richness projections to investigate potential changes in functional traits, particularly for plants.
One such study (Th uiller et al. 2006) explored compo-sitional changes in plant functional groups – sets of species with similar ecosystem responses – under future climates using projected changes in tree species richness across Europe. Despite its long history, the use of plant functional groups to defi ne diff erences in ecological strategies has a number of limitations when investigating patterns of func-tional diversity (reviewed by Hillebrand and Matthiessen 2009). Perhaps the most serious criticism is the inherent subjectivity involved in delineating groups, and the conse-quences this has for accurately summarizing the eff ect of trait variation on community and ecosystem processes. Newer methods circumvent this issue by measuring the dis-tance between species in multivariate space defi ned by a set of a priori traits. In this context, we calculated the func-tional dispersion of communities – the average distance to the centroid across species in multivariate trait space – and used this index to compare potential trait diversity under current and future conditions (Anderson et al. 2006, Lalibert é and Legendre 2010).
Functional traits provide a vital link between biodiversity and ecosystem function through their infl uence on key processes, such as nutrient cycling and carbon acquisition. Th erefore, strong ecological justifi cation is imperative when choosing which traits are the most appropriate for assessing functional diversity (Petchey and Gaston 2006). Each trait should be ecologically informative, captur-ing important information about how species acquire and
turnover nutrients in the constraints of their physical envi-ronment, and how they pass on fi tness to subsequent genera-tions. Traits are typically grouped into two categories: response and eff ect (Lavorel and Garnier 2002). Response traits, such as seed mass and dispersal mode, indicate which species will be most successful in response to some form of environmental perturbation. For example, small or wind dispersed seeds are most likely to colonise canopy gaps. By contrast, eff ect traits are those that directly infl uence eco-system functions, such as carbon acquisition and biomass accumulation and include specifi c leaf area, leaf size and growth habit. Previous studies have identifi ed a range of response traits that are expected to be advantageous for per-sistence under future climates, such as structures that pro-mote long distance dispersal, and phenological plasticity (Hughes 2000). However, fewer studies have addressed how climate change may alter the diversity of eff ect traits in communities. Th erefore, we have focused on a mixture of both response (seed mass, dispersal mode), and eff ect traits (leaf area, growth habit, climbing mechanism) in this study.
Our aims were to 1) illustrate the potential eff ects of projected changes in climate by the decade 2050 on species richness in communities using species distribution model-ing, and 2) link the eff ect of changes in species richness to changes in functional diversity using data on fi ve key traits and a multivariate measure of dispersion.
Material and methods
Study system
We focused on nine littoral rainforest climbing plant communities in eastern Australia (Fig. 1a). Littoral rain-forests are closed canopy forests found within 2 km of the coast or saltwater intrusion. Salt-laden winds act as a strong environmental fi lter on plant composition in these systems, leading to lower fl oristic diversity than inland rainforest communities (Keith 2004). Canopy height varies with the degree of wind exposure and may reach up to 30 m in protected sites. Littoral rainforests occur on a range of soil types, including deep podsolic sands and volcanically derived silts, and have a naturally patchy distribution that refl ects the occurrence of these substrates along the
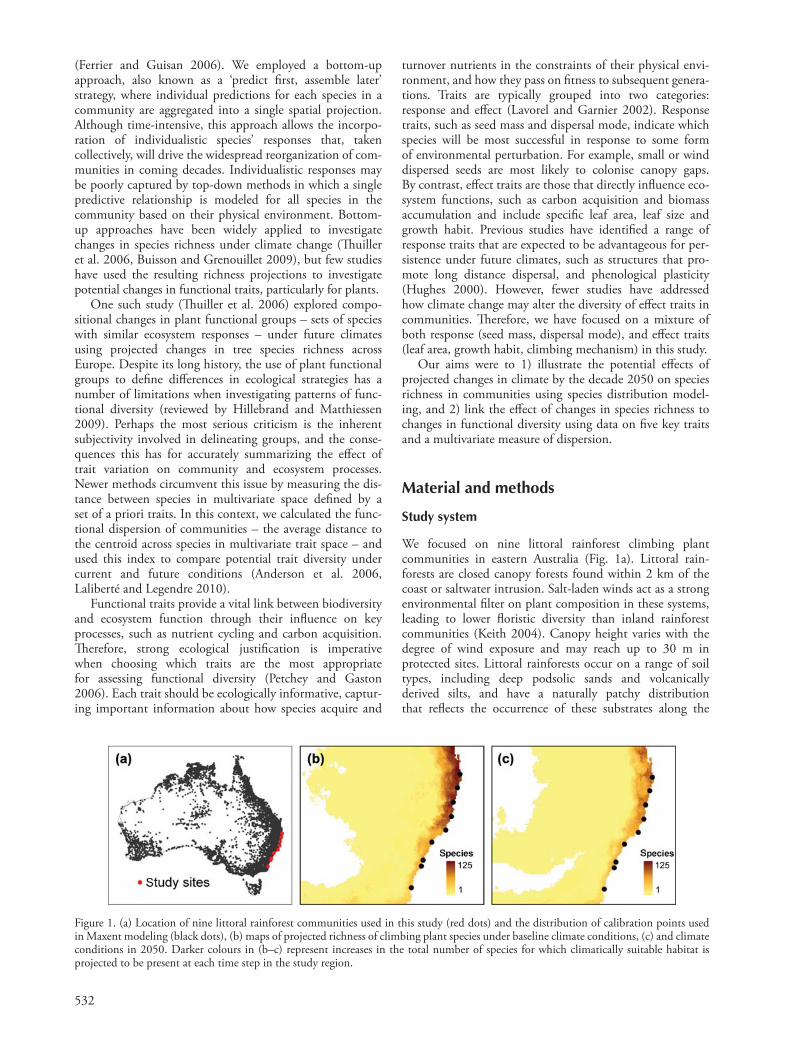
Figure 1. (a) Location of nine littoral rainforest communities used in this study (red dots) and the distribution of calibration points used in Maxent modeling (black dots), (b) maps of projected richness of climbing plant species under baseline climate conditions, (c) and climate conditions in 2050. Darker colours in (b – c) represent increases in the total number of species for which climatically suitable habitat is projected to be present at each time step in the study region.
533
Australian east coast. Th ese forests have been extensively cleared for sand mining and coastal development and � 1% of the original spatial extent remains. Th ese remnants are protected under state and federal environmental laws and the eff ect of climate change is cited as a key threat to their continued persistence ( � www.environment.gov.au/epbc/publications/pubs/littoral-rainforest.pdf � ).
We focused solely on climbing plants in this study because they represent a diverse, but understudied, func-tional group in this vegetation community. Evidence is accumulating globally that climbers may be responding to climate warming and increased emissions of CO 2 at a faster rate than free-standing species (see Schnitzer and Bongers 2011 for a thorough review) making the need to understand the response of this growth form critical for adaptation planning.
A comprehensive list of climbing plant species occurring in littoral rainforests between Princess Charlotte Bay in Queensland (14 ° 13 ′ S, 143 ° 58 ′ E) and Gippsland Lakes in Victoria, Australia (38 ° 08 ′ S, 147 ° 28 ′ E) was compiled from fi eld surveys, published sources and herbarium databases (see Supplementary material Appendix 1 for complete list of sources). Th ese 163 species represent the regional species pool for littoral rainforest climbers in eastern Australia.
Projecting changes to species richness
Point occurrence records (latitudes and longitudes) for each species were collated from Australia ’ s Virtual Herbarium ( � http://chah.gov.au/avh/public_query.jsp � ) and the Queensland Herbarium BRISmapper application. All sub-species and variety records were pooled at the species level because of the diffi culty in resolving sub-specifi c taxa from online records. Th e average number of georeferenced locations compiled for each species was 285, and varied between 31 and 1580 across the 163 species (see Fig. 1 and Supplementary material Appendix 2 for further information on occurrence records used to calibrate models). Herbarium records of Australia plants have been accumulating in herbaria since European contact in 1770, and the accuracy of locality data associated with records has increased since the advent of global positioning systems. However, some records – particularly those from early periods of Australia ’ s scientifi c history – may only be accurate within a 10 km radius as their latitudes and longitudes were retrospec-tively assigned during digitization using the location of the nearest town.
All distribution records were used to develop species distribution models for each species under baseline climate conditions (1950 – 2000 average) using Maxent (ver. 3.3.1). Maxent is a widely applied tool for distribution modeling with presence-only data that is ranked among the best performing modeling approaches (Elith et al. 2011). Species distribution models such as Maxent associate species occurrence points with environmental parameters (e.g. cli-mate, soils) to build a spatial prediction of the location of suitable habitat. By projecting the resulting model onto climate futures – spatial surfaces that describe projected climate conditions under General Circulation Models (GCMs) – the expansion or contraction of suitable habitat in coming decades can be projected.
We used four climate variables to model the distribution of each species in Maxent: mean annual temperature, mean annual precipitation, temperature seasonality and pre-cipitation seasonality. Th ese variables were chosen because they are critical factors in determining the distributional limits of a wide range of plant species (Woodward 1987) and they were not highly correlated (r � 0.65 in all pair-wise combinations). Baseline climate surfaces for each vari-able were downloaded from the Worldclim web application at 5 arc minute resolution (ver. 1.4, Hijmans et al. 2005) ( � www.worldclim.org/download.htm � ). Th is spatial resolution was chosen because it closely corresponds to the accuracy of species level observations in the Australian Virtual Herbarium (i.e. ∼ 10 km). Maxent models were built using the optimized default settings outlined in Phillips and Dud í k (2008) with two exceptions: 1) models were trained on ten cross-validated data partitions to reduce the likelihood of spatial bias in the occurrence records used in model training, and 2) the selection of background points (sometimes known as pseudo-absences) was con-strained to areas within an 800 km radius of known occurrences for each species to improve model accuracy (Van Der Wal et al. 2009, Yates et al. 2010, Elith et al. 2011). Models run with background points selected within this radius had the greatest predictive accuracy in an explor-atory modeling exercise performed on a subset of species in this study (results not shown). Model accuracy was mea-sured using the area under the receiver operating curve (AUC) which assesses the rate of correct classifi cation of presence points by the modeled function. AUC scores were calculated across background points using script developed in R ver. 2.12.1 (R Development Core Team). AUC scores greater than 0.75 were defi ned as providing a useful level of discrimination.
We projected distribution models built on baseline conditions onto climate scenarios for the decade centered around 2050 generated from four atmosphere-ocean GCMs under the A2 emission scenario (Nakicenovic and Swart 2000) (see Supplementary material Appendix 3 for interpolation methods for GCM surfaces). Th e GCMs chosen were the Bjerknes Centre for Climate Research Bergen Climate Model ver. 2, CSIRO Mk3.5, INMCM 3.0 Model, and the K-1 Coupled GCM (MIROC) ver. 3.2.2 medium resolution. Th ese four GCMs were used in the Intergovernmental Panel on Climate Change Fourth Assessment Report and chosen for this study because they perform comparatively well at modeling Australian climate conditions (Suppiah et al. 2007).
Mapping and comparing projected species richness in communities
Maxent provides gridded output as continuous probability fi elds which we converted to a binary classifi cation (0 � climatically unsuitable, 1 � climatically suitable) using a threshold value that maximized the test sensitivity and specifi city on the receiver operating curve. Th is threshold value has been widely applied in distribution modeling and provided a suitable balance between commission (false positive) and omission (false negative) error rates. For each species, areas classifi ed as climatically suitable across all
534
through the Community Access to Natural Resources Information website ( � www.canri.nsw.gov.au/ � ) using the ANZLIC unique identifi er ANZNS0157000046, and 3) localised mapping of littoral rainforests in the south coast region of NSW performed by staff at the NSW OEH (M. Beukers pers. comm.).
Comparing functional traits between baseline and future conditions
We appended data on fi ve functional traits – leaf area (cm 2 ), seed mass (mg), climbing mechanism, dispersal mode, and growth habit – to all species projected to occur in the nine littoral rainforest communities. Th ese traits were cho-sen because collectively they capture variation along key axes of strategy variation present among species. Seed mass – the dry mass of the endosperm – is a central component of the reproduction and establishment strategies of species (Leishman et al. 2000). Dispersal mode is a useful surro-gate for the distance a seed can travel in the landscape (Leishman et al. 2000) and the size of leaves is important for water balance and energy budgets, as well as light inter-ception and penetration to lower canopy layers (Parkhurst and Loucks 1972). Larger leaves require more evaporative cooling to remain at optimal temperature for photosynthe-sis and are selected against in dry or sunny environments. Species with woody and herbaceous growth habits diff er in their relative growth rates, specifi c leaf area (leaf dry mass per unit area) and photosynthetic rates (Hunt and Cornelissen 1997), all of which are important for defi ning how species capture and deploy resources. Climbing species attach to their hosts using a range of mechanisms including tendrils, twining, adventitious roots or spines, and the type of mechanism employed has been associated with dif-ferences in leaf area, specifi c leaf mass and leaf nitrogen content (Castellanos et al. 1989). Th e mechanism used to climb also mediates interactions between climbers and their hosts (DeWalt et al. 2000).
Trait data for each species were collected in the fi eld and compiled from published sources (Table 1; Supplementary material Appendix 4 and 5). Th e resulting datasets for
GCM projections were determined by summing the four binary raster maps and assigning grid cells with a value of 4 to a value of 1 (climatically suitable) using the package raster (ver. 1.8-12) in R (ver. 2.12.1).
Two maps of potential species richness (baseline, 2050) were created by summing the binary distribution maps produced for each of the 163 species in the study at each time step (Fig. 1b – c). Richness was calculated for each 5 ′ � 5 ′ grid cell across the study area by counting the num-ber of species for which climatically suitable habitat was present in each cell. Th e ability of species to realise shifts in climatically suitable habitat in 2050 will be, in part, dependent on their dispersal capacity. Many previous studies have assumed one of two dispersal scenarios: full dispersal, or no dispersal (Th uiller et al. 2005, Loarie et al. 2008). We propose a new approach which uses seed dispersal mode as a surrogate for a species ’ dispersal capacity, and assumes that only those species dispersed by highly mobile vertebrates (e.g. birds, bats), wind or water will be capable of occupying suitable habitat outside the current range in 2050. Species with unassisted, invertebrate or ballistic dis-persal were considered unlikely to substantially shift their distributions by 2050. Although long-distance dispersal can occur in species with these dispersal mode it is rare (Higgins et al. 2003), and the majority of seeds are expected to travel over short distances resulting in slow rates of migration.
Lists of species for which climatically suitable habitat was present were extracted for each of the nine littoral rain-forest communities under baseline and 2050 conditions from richness maps using an R function that returned all species whose distribution fell within each reserve boundary containing the community. Th ese species lists were used to examine how richness patterns in littoral rain-forests may be aff ected by projected changes in climate by 2050 using a paired t-test ( α � 0.05) in R (ver. 2.12.1). Shapefi les of reserve boundaries for littoral rainforests were compiled from three digital mapping sources: 1) protected area boundaries accessed through the NSW Offi ce of Environment and Heritage (OEH) spatial data download site ( � http://mapdata.environment.nsw.gov.au/DDWA/ � ), 2) areas protected under the NSW State Environmental Planning Policy Number 26 – Littoral Rainforests, acquired
Table 1. Five functional traits used in this study, their units and methods used to compile data for each trait. Details of all sources used to compile trait data are provided in Supplementary material Appendix 3.
Trait Units Source
Seed mass mg For 63 species compiled from the Royal Botanic Gardens Kew Seed Information Database; for remaining 87 species calculated from seed volume using the equation: log 10 seed mass � (1.104 � log 10 seed volume) � 0.275, R 2 � 0.94, p � 0.01 (see Supplementary material Appendix 5 for full details)
Leaf area cm 2 For 113 species 25 mature, fully expanded leaves were collected in the fi eld and scanned; for the remaining 37 species calculated from leaf dimensions in fl oras using the equation: leaf area � length � width � 0.7, R 2 � 0.98, p � 0.001 (Kraft et al. 2008)
Climbing mechanism 5 categories: twiner; tendrils; scrambler; adventitious roots; spines/hooks
Published literature; fl oras; internet databases
Dispersal mode 3 categories: abiotic (wind, water); biotic (animal); unassisted
Published literature; fl oras; internet databases
Growth habit 3 categories: herbaceous; semi-woody; woody Published literature; fl oras; internet databases
535
were calculated for each plot. Stress values of � 0.20 were considered to provide useful reduction (Quinn and Keough 2002). All multivariate analyses were performed in R using the FD (ver. 1.0-11), and ecodist (ver. 1.2.3) packages.
Results
Accuracy of species distribution models
On average, Maxent models for the 163 species had a high level of accuracy (mean AUC � 0.92, SD � � / � 0.04, range � 0.74 – 0.99). Th erefore, we are confi dent that the species richness maps derived from aggregated model output across all species accurately captured individualistic relationships between species occurrences and climate.
Projected changes in species richness
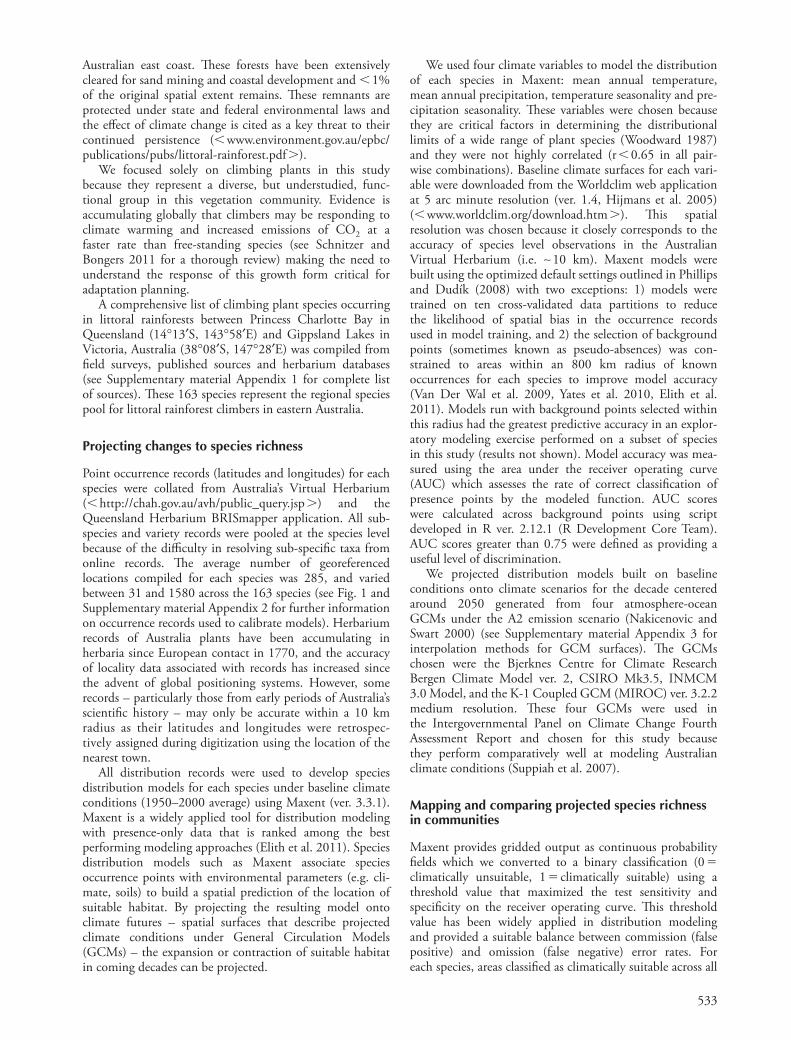
Climbing plant species richness was projected to decline signifi cantly across all nine littoral rainforest reserves by 2050 as a result of changing climatic conditions (t � � 3.09; DF � 8; p � 0.02; Fig. 2a). Under baseline conditions the nine reserves provide climatically suitable habitat for 149 species. By 2050, assuming a dispersal scenario based on known dispersal structure, 46 of these species were no longer projected to have climatically suitable habitat in any of the nine reserves. Projected reductions in species richness were most pronounced in subtropical areas at lower latitudes in the north of the study region (Fig. 2a). For exam-ple, the community currently occurring at the lowest latitude was projected to lose climatically suitable habitat for around one-third of climbing plant species by 2050 (Table 2). Other communities showed more stable patterns
each site and time-step were used to explore the eff ect of projected changes in richness on the distribution and the diversity of functional traits in each littoral rainforest community in two ways: 1) using univariate tests to com-pare each individual trait between time - steps, and 2) by combining all traits in a multivariate diversity index. We used two-sample Kolmogorov – Smirnov tests to compare the distribution of continuous traits (leaf area, seed mass) between time-steps in each of the nine communities. For categorical traits (climbing mechanism, dispersal mode, growth habit), chi-squared goodness-of-fi t tests were used to compare the proportions of trait states between time-steps. Univariate tests were performed in R (ver. 2.12.1), ( α � 0.05) and leaf area and seed mass were log 10 trans-formed before analysis to reduce skew.
We used a measure of multivariate functional dispersion (FDis; Lalibert é and Legendre 2010) to compare trait diversity between baseline and future conditions using data on all traits simultaneously. FDis calculates the average distance of individual species to their group centroid in multivariate trait space that has been defi ned by an appropri-ate distance measure. Tighter clustering of species in multi-variate trait space corresponds to lower functional diversity and thus lower FDis values. Although a range of functional diversity indices exist we chose FDis because, unlike other techniques, it is largely unaff ected by species richness (sample size). Our aim in combining response and eff ect traits in a single index was to complement univariate analy-ses of trait distributions, rather than to identify any potential eff ects of richness changes on specifi c ecosystem functions.
Correlations between traits may aff ect reported levels functional redundancy (Petchey and Gaston 2002). Th erefore, we also tested for associations between trait values using Pearson product-moment correlations for con-tinuous traits, one-way ANOVA for continuous and categor-ical trait combinations and chi-squared tests for categorical traits. We found a signifi cant relationship between seed mass and dispersal mode (F � 4.2; DF � 134; p � 0.02), but tests on all other pair-wise trait combinations were non-signifi cant at the 0.05 alpha level. Although correlated, we included both dispersal mode and seed mass in FDis calculations because they capture diff erent aspects of plant regeneration strategies.
For each combination of site and time-step (n � 18) we calculated FDis from a Gower ’ s matrix of similarities between species based on the fi ve functional traits selected. Th e Gower similarity coeffi cient was chosen because it accommodates both categorical and continuous variables (Gower 1971). All data matrices were normalized prior to analysis. We used values of FDis to test for diff erences in functional dispersion between baseline and 2050 commu-nities using a paired sample t - test ( α � 0.05). Non-metric multidimensional scaling plots were used to visualise the multivariate data in two-dimensions. Th e distance between two observations in these plots is a measure of their similar-ity as computed by Gower ’ s coeffi cient; species that are more similar in their traits appear closer together. We used 50 random restarts of the iteration to reach an optimal confi gu-ration of multivariate trait variation in two-dimensional space. Stress values indicating how reliably the higher-dimensional relationships were reduced to two-dimensions
Figure 2. Projected changes in climbing plant species richness (a) and functional dispersion across fi ve traits (b) in nine eastern Australian littoral rainforest communities. Richness changes are projected by species distribution models for baseline climate conditions (1950 – 2000 average) and 2050 climate conditions under the A2 emission scenarios (consensus across four future scenarios of climate in 2050 derived from diff erent general circula-tion models). Functional dispersion was calculated across fi ve traits using a multivariate index (FDis) computed from a Gower ’ s matrix of similarities. Sites are ordered top to bottom by latitude. Results of paired t-tests between time steps are shown.
536
change at the species and functional trait levels in commu-nities and our results show clear diff erences in responses between these two levels of biological organisation. Species richness was projected to signifi cantly decrease under future climates across the communities examined, whilst functional diversity remained stable. Th is fi nding has important implications for management of littoral rainfor-ests and highlights that the impacts of climate change at the species and trait level may be decoupled. Th e decoupling of species richness and functional diversity has been identi-fi ed in previous studies (Petchey and Gaston 2002) and will have signifi cant consequences for conservation practice and management of plant communities as climate changes in coming decades.
Functional redundancy may buffer against the impact of climate change on trait diversity in communities
We found that the degree of projected species turnover did not infl uence changes in the functional dispersion of com-munities between baseline and future conditions and our results were consistent in univariate tests of individual response and eff ect traits. Th is fi nding indicates that trait values are highly similar amongst species in the regional spe-cies pool and that range shifts that lead to the introduction of novel species into a community may be able to compen-sate for range contraction in others, resulting in no net loss of functional trait diversity. Our results also suggest that functional redundancy – a high degree of similarity in func-tional traits amongst species (Walker 1992) – may provide a buff er against the eff ect of potential species losses on trait diversity in littoral rainforest climber communities as climate change progresses. Redundancy in the composition of traits may act as an insurance policy against the loss of functional diversity should species richness decrease and this may in turn increase the resilience of these communities to changing climate regimes, as suggested in other studies (Kahmen et al. 2005). Th e potentially high level of trait redundancy in littoral rainforests ’ species pool may be the result of strong abiotic fi ltering of traits related to salt-tolerance or physical disturbance, both of which have been shown to shape species composition in these forests (Keith 2004).
Filtering has been shown to restrict the range of viable trait strategies present in communities, leading to the
of species richness between time-steps, but this was the result of turnover in species rather than stasis in climatic suitability (Table 2). For example, in Myall Lakes National Park, nine species projected to lose suitable habitat by 2050 were replaced by eight species projected to undergo poleward range expansions (Table 2).
The effect of changes in species richness on individual traits
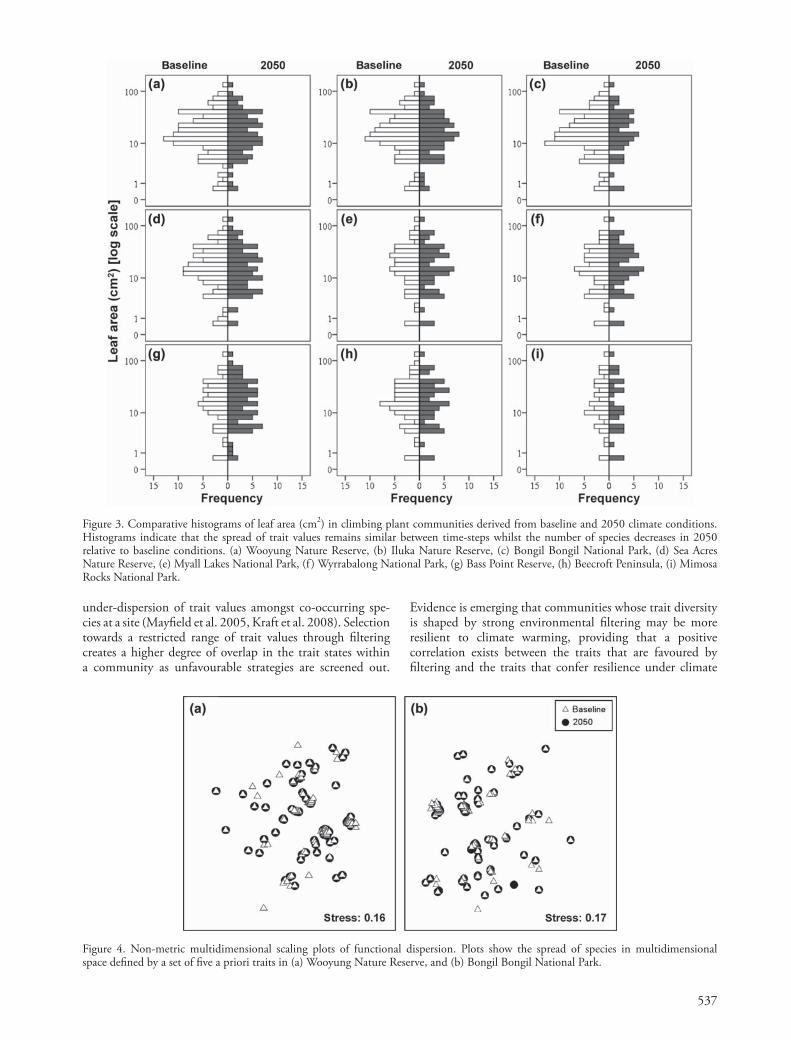
We found no evidence for diff erences in the distribution of continuous traits (leaf area, seed mass) between baseline and 2050 climate conditions in any of the nine communities examined (Fig. 3a – i; Supplementary material Appendix 5, Fig. A2a, Table A1). Similarly, the proportions of species exhibiting diff erent dispersal mode, climbing mechanism, and growth habit did not diff er between baseline and future communities (Supplementary material Appendix 5, Fig. A2b – d, Table A1).
The effect of changes in species richness on functional diversity
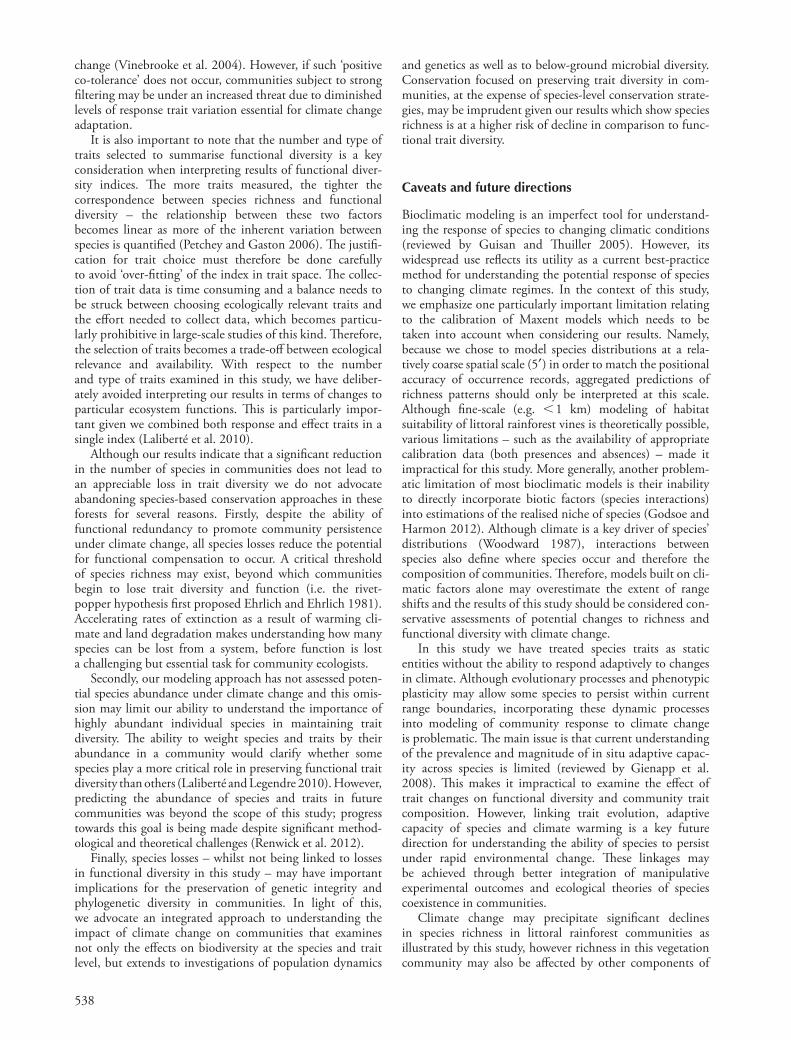
Despite signifi cant reductions in species richness we found no signifi cant diff erences in functional dispersion between time-steps across the nine littoral rainforest com-munities (Fig. 2b, Fig. 4). Th is fi nding was consistent across communities with little or no species turnover in 2050 (e.g. Wooyung Nature Reserve, Bongil Bongil National Park) and those with substantial turnover (e.g. Myall Lakes National Park) (Table 2). Th erefore, the volume of trait space occupied by baseline and future communities remains relatively stable despite projections of signifi cant reductions in species richness by 2050.
Discussion
Th e impact of climate change on vegetation is most com-monly investigated at the species level (Th uiller et al. 2005, Lenoir et al. 2008, Loarie et al. 2008, Yates et al. 2010), but it can also be extended to explore how the distribution of physical traits may change in coming decades. Th e main objective of this study was to compare the eff ect of climate
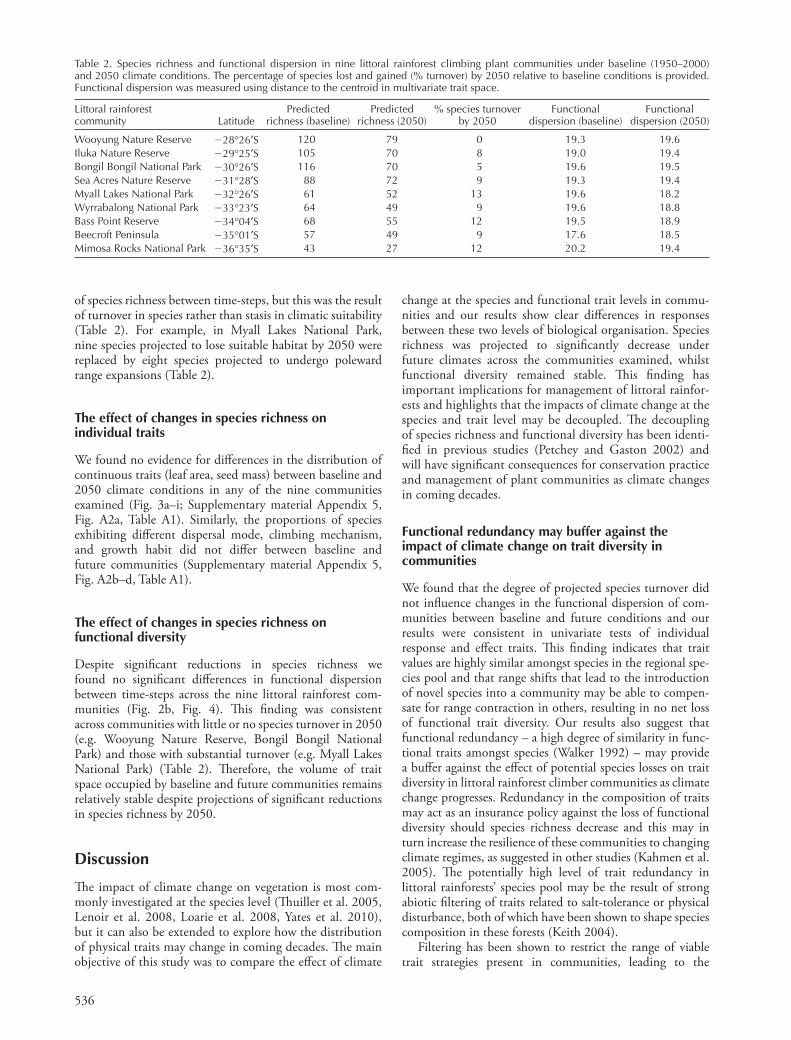
Table 2. Species richness and functional dispersion in nine littoral rainforest climbing plant communities under baseline (1950 – 2000) and 2050 climate conditions. The percentage of species lost and gained (% turnover) by 2050 relative to baseline conditions is provided. Functional dispersion was measured using distance to the centroid in multivariate trait space.
Littoral rainforest community Latitude
Predicted richness (baseline)
Predicted richness (2050)
% species turnover by 2050
Functional dispersion (baseline)
Functional dispersion (2050)
Wooyung Nature Reserve � 28 ° 26 ′ S 120 79 0 19.3 19.6Iluka Nature Reserve � 29 ° 25 ′ S 105 70 8 19.0 19.4Bongil Bongil National Park � 30 ° 26 ′ S 116 70 5 19.6 19.5Sea Acres Nature Reserve � 31 ° 28 ′ S 88 72 9 19.3 19.4Myall Lakes National Park � 32 ° 26 ′ S 61 52 13 19.6 18.2Wyrrabalong National Park � 33 ° 23 ′ S 64 49 9 19.6 18.8Bass Point Reserve � 34 ° 04 ′ S 68 55 12 19.5 18.9Beecroft Peninsula � 35 ° 01 ′ S 57 49 9 17.6 18.5Mimosa Rocks National Park � 36 ° 35 ′ S 43 27 12 20.2 19.4
537
Figure 3. Comparative histograms of leaf area (cm 2 ) in climbing plant communities derived from baseline and 2050 climate conditions. Histograms indicate that the spread of trait values remains similar between time-steps whilst the number of species decreases in 2050 relative to baseline conditions. (a) Wooyung Nature Reserve, (b) Iluka Nature Reserve, (c) Bongil Bongil National Park, (d) Sea Acres Nature Reserve, (e) Myall Lakes National Park, (f ) Wyrrabalong National Park, (g) Bass Point Reserve, (h) Beecroft Peninsula, (i) Mimosa Rocks National Park.
Figure 4. Non-metric multidimensional scaling plots of functional dispersion. Plots show the spread of species in multidimensional space defi ned by a set of fi ve a priori traits in (a) Wooyung Nature Reserve, and (b) Bongil Bongil National Park.
under-dispersion of trait values amongst co-occurring spe-cies at a site (Mayfi eld et al. 2005, Kraft et al. 2008). Selection towards a restricted range of trait values through fi ltering creates a higher degree of overlap in the trait states within a community as unfavourable strategies are screened out.
Evidence is emerging that communities whose trait diversity is shaped by strong environmental fi ltering may be more resilient to climate warming, providing that a positive correlation exists between the traits that are favoured by fi ltering and the traits that confer resilience under climate
538
and genetics as well as to below-ground microbial diversity. Conservation focused on preserving trait diversity in com-munities, at the expense of species-level conservation strate-gies, may be imprudent given our results which show species richness is at a higher risk of decline in comparison to func-tional trait diversity.
Caveats and future directions
Bioclimatic modeling is an imperfect tool for understand-ing the response of species to changing climatic conditions (reviewed by Guisan and Th uiller 2005). However, its widespread use refl ects its utility as a current best-practice method for understanding the potential response of species to changing climate regimes. In the context of this study, we emphasize one particularly important limitation relating to the calibration of Maxent models which needs to be taken into account when considering our results. Namely, because we chose to model species distributions at a rela-tively coarse spatial scale (5 ′ ) in order to match the positional accuracy of occurrence records, aggregated predictions of richness patterns should only be interpreted at this scale. Although fi ne-scale (e.g. � 1 km) modeling of habitat suitability of littoral rainforest vines is theoretically possible, various limitations – such as the availability of appropriate calibration data (both presences and absences) – made it impractical for this study. More generally, another problem-atic limitation of most bioclimatic models is their inability to directly incorporate biotic factors (species interactions) into estimations of the realised niche of species (Godsoe and Harmon 2012). Although climate is a key driver of species ’ distributions (Woodward 1987), interactions between species also defi ne where species occur and therefore the composition of communities. Th erefore, models built on cli-matic factors alone may overestimate the extent of range shifts and the results of this study should be considered con-servative assessments of potential changes to richness and functional diversity with climate change.
In this study we have treated species traits as static entities without the ability to respond adaptively to changes in climate. Although evolutionary processes and phenotypic plasticity may allow some species to persist within current range boundaries, incorporating these dynamic processes into modeling of community response to climate change is problematic. Th e main issue is that current understanding of the prevalence and magnitude of in situ adaptive capac-ity across species is limited (reviewed by Gienapp et al. 2008). Th is makes it impractical to examine the eff ect of trait changes on functional diversity and community trait composition. However, linking trait evolution, adaptive capacity of species and climate warming is a key future direction for understanding the ability of species to persist under rapid environmental change. Th ese linkages may be achieved through better integration of manipulative experimental outcomes and ecological theories of species coexistence in communities.
Climate change may precipitate signifi cant declines in species richness in littoral rainforest communities as illustrated by this study, however richness in this vegetation community may also be aff ected by other components of
change (Vinebrooke et al. 2004). However, if such ‘ positive co-tolerance ’ does not occur, communities subject to strong fi ltering may be under an increased threat due to diminished levels of response trait variation essential for climate change adaptation.
It is also important to note that the number and type of traits selected to summarise functional diversity is a key consideration when interpreting results of functional diver-sity indices. Th e more traits measured, the tighter the correspondence between species richness and functional diversity – the relationship between these two factors becomes linear as more of the inherent variation between species is quantifi ed (Petchey and Gaston 2006). Th e justifi -cation for trait choice must therefore be done carefully to avoid ‘ over-fi tting ’ of the index in trait space. Th e collec-tion of trait data is time consuming and a balance needs to be struck between choosing ecologically relevant traits and the eff ort needed to collect data, which becomes particu-larly prohibitive in large-scale studies of this kind. Th erefore, the selection of traits becomes a trade-off between ecological relevance and availability. With respect to the number and type of traits examined in this study, we have deliber-ately avoided interpreting our results in terms of changes to particular ecosystem functions. Th is is particularly impor-tant given we combined both response and eff ect traits in a single index (Lalibert é et al. 2010).
Although our results indicate that a signifi cant reduction in the number of species in communities does not lead to an appreciable loss in trait diversity we do not advocate abandoning species-based conservation approaches in these forests for several reasons. Firstly, despite the ability of functional redundancy to promote community persistence under climate change, all species losses reduce the potential for functional compensation to occur. A critical threshold of species richness may exist, beyond which communities begin to lose trait diversity and function (i.e. the rivet-popper hypothesis fi rst proposed Ehrlich and Ehrlich 1981). Accelerating rates of extinction as a result of warming cli-mate and land degradation makes understanding how many species can be lost from a system, before function is lost a challenging but essential task for community ecologists.
Secondly, our modeling approach has not assessed poten-tial species abundance under climate change and this omis-sion may limit our ability to understand the importance of highly abundant individual species in maintaining trait diversity. Th e ability to weight species and traits by their abundance in a community would clarify whether some species play a more critical role in preserving functional trait diversity than others (Laliberté and Legendre 2010). However, predicting the abundance of species and traits in future communities was beyond the scope of this study; progress towards this goal is being made despite signifi cant method-ological and theoretical challenges (Renwick et al. 2012).
Finally, species losses – whilst not being linked to losses in functional diversity in this study – may have important implications for the preservation of genetic integrity and phylogenetic diversity in communities. In light of this, we advocate an integrated approach to understanding the impact of climate change on communities that examines not only the eff ects on biodiversity at the species and trait level, but extends to investigations of population dynamics
539
Higgins, S. I. et al. 2003. Are long-distance dispersal events in plants usually caused by nonstandard means of dispersal? – Ecology 84: 1945 – 1956.
Hijmans, R. J. et al. 2005. Very high resolution interpolated climate surfaces for global land areas. – Int. J. Climatol. 25: 1965 – 1978.
Hillebrand, H. and Matthiessen, B. 2009. Biodiversity in a complex world: consolidation and progress in functional bio-diversity research. – Ecol. Lett. 12: 1405 – 1419.
Hughes, L. 2000. Biological consequences of global warming: is the signal already apparent? – Trends Ecol. Evol. 15: 56 – 61.
Hunt, R. and Cornelissen, J. H. C. 1997. Components of relative growth rate and their interrelations in 59 temperate plant species. – New Phytol. 135: 395 – 417.
Kahmen, A. et al. 2005. Diversity-dependent productivity in semi-natural grasslands following climate perturbations. – Funct. Ecol. 19: 594 – 601.
Keith, D. A. 2004. Ocean shores to desert dunes: the native veg-etation of New South Wales and the ACT. – Dept of Environ-ment and Conservation.
Kelly, A. E. and Goulden, M. L. 2008. Rapid shifts in plant distribution with recent climate change. – Proc. Natl Acad. Sci. USA 105: 11823 – 11826.
Kraft, N. J. B. et al. 2008. Functional traits and niche-based tree community assembly in an Amazonian forest. – Science 322: 580 – 582.
Lalibert é , E. and Legendre, P. 2010. A distance-based framework for measuring functional diversity from multiple traits. – Ecology 91: 299 – 305.
Lalibert é , E. et al. 2010. Land-use intensifi cation reduces functional redundancy and response diversity in plant communities. – Ecol. Lett. 13: 76 – 86.
Lavorel, S. and Garnier, E. 2002. Predicting changes in community composition ecosystem functioning from plant traits: revisiting the Holy Grail. – Funct. Ecol. 16: 545 – 556.
Leishman, M. R. et al. 2000. Th e evolutionary ecology of seed size. – In: Fenner, M. (ed.), Seeds: the ecology of regeneration in plant communities. CABI Publishing, pp. 31 – 57.
Lenoir, J. et al. 2008. A signifi cant upward shift in plant species optimum elevation during the 20th century. – Science 320: 1768 – 1771.
Loarie, S. R. et al. 2008. Climate change and the future of California ’ s endemic fl ora. – PLoS One 3: e2502.
Mayfi eld, M. M. et al. 2005. Species and functional diversity of native and human-dominated plant communities. – Ecology 86: 2365 – 2372.
McInnes, K. L. et al. 2003. Impact of sea-level rise and storm surges on a coastal community. – Nat. Hazards 30: 187 – 207.
Nakicenovic, N. and Swart, R. 2000. Special report on emissions scenarios. – Cambridge Univ. Press.
Parkhurst, D. F. and Loucks, O. L. 1972. Optimal leaf size in relation to environment. – J. Ecol. 60: 505 – 537.
Petchey, O. L. and Gaston, K. J. 2002. Extinction and the loss of functional diversity. – Proc. R. Soc. B 269: 1721 – 1727.
Petchey, O. L. and Gaston, K. J. 2006. Functional diversity: back to basics and looking forward. – Ecol. Lett. 9: 741 – 758.
Phillips, S. J. and Dud í k, M. 2008. Modeling of species distribu-tion with Maxent: new extensions and a comprehensive evaluation. – Ecography 31: 161 – 175.
Quinn, G. P. and Keough, M. J. 2002. Experimental design and data analysis for biologists. – Cambridge Univ. Press.
Renwick, A. R. et al. 2012. Modelling changes in species ’ abundance in response to projected climate change. – Divers. Distrib. 18: 121 – 132.
Schnitzer, S. A. and Bongers, F. 2011. Increasing liana abundance and biomass in tropical forests: emerging patterns and putative mechanisms. – Ecol. Lett. 17: 223 – 230.
global change in coming decades. In particular, projected increases the frequency and magnitude of storm surges and in sea levels in eastern Australia may further degrade coastal habitats (McInnes et al. 2003) and projected changes to fi re regimes may alter vegetation composition (Clarke et al. 2011). We have shown that responses at the species level do not necessarily lead to similar consequences for trait diversity. Th ese fi ndings highlight the need to account for diff erent responses at various levels of biological complexity when devising conservation strategies to confront the threat of climate change to life on Earth.
Acknowledgements – For data access we wish to thank Colin Bale at the Univ. of New England, Australia, Max Beukers from the NSW Offi ce of Environment and Heritage and Don Butler at the Queensland herbarium. Th anks also to Peter Wilson and Stuart Allen for their assistance with scripting in R, Jeremy Van der Wal for advice on Maxent calibration and Niklaus Zimmerman and Sandra Diaz for their insightful comments.
References
Anderson, M. J. et al. 2006. Multivariate dispersion as a measure of beta diversity. – Ecol. Lett. 9: 683 – 693.
Buisson, L. and Grenouillet, G. 2009. Contrasted impacts of climate change on stream fi sh assemblages along an environ-mental gradient. – Divers. Distrib. 15: 613 – 626.
Castellanos, A. E. et al. 1989. Leaf, stem, and metamer character-istics of vines in a tropical deciduous forest in Jalisco, Mexico. – Biotropica 21: 41 – 49.
Catford, J. A. et al. 2011. Flow regulation reduces native plant cover and facilitates exotic invasion in riparian wetlands. – J. Appl. Ecol. 48: 432 – 442.
Clarke, H. G. et al. 2011. Regional signatures of future fi re weather over eastern Australia from global climate models. – Int. J. Wildfi re 20: 550 – 562.
DeWalt, S. J. et al. 2000. Density and diversity of lianas along a chronosequence in a central Panamanian lowland forest. – J. Trop. Ecol. 16: 1 – 19.
Dullinger, S. et al. 2004. Modelling climate change-driven treeline shifts: relative eff ects of temperature increase, dispersal and invasibility. – J. Ecol. 92: 241 – 252.
Ehrlich, P. and Ehrlich, A. 1981. Extinction: the causes and con-sequences of the disappearance of species. – Random House.
Elith, J. et al. 2011. A statistical explanation of MaxEnt for ecologists. – Divers. Distrib. 17: 43 – 57.
Ferrier, S. and Guisan, A. 2006. Spatial modelling of biodiversity at the community level. – J. Appl. Ecol. 43: 393 – 404.
Gienapp, P. et al. 2008. Climate change and evolution: disen-tangling environmental and genetic responses. – Mol. Ecol. 17: 167 – 178.
Godsoe, W. and Harmon, L. J. 2012. How do species interactions aff ect species distribution models? – Ecography 35: 1 – 10.
Gower, J. C. 1971. A general coeffi cient of similarity and some of its properties. – Biometrics 27: 857 – 871.
Guisan, A. and Th uiller, W. 2005. Predicting species distribution: off ering more than simple habitat models. – Ecol. Lett. 8: 993 – 1009.
Hallinger, M. and Wilmking, M. 2011. No change without a cause – why climate change remains the most plausible reason for shrub growth dynamics in Scandinavia. – New Phytol. 189: 902 – 908.
Harsch, M. et al. 2009. Are treelines advancing? A global meta-analysis of treeline response to climate warming. – Ecol. Lett. 12: 1040 – 1049.

540
Van Der Wal, J. et al. 2009. Selecting pseudo-absence data for presence-only distribution modeling: how far should you stray from what you know? – Ecol. Model. 220: 589 – 594.
Vinebrooke, R. D. et al. 2004. Impacts of multiple stressors on biodiversity and ecosystem functioning: the role of species co-tolerance. – Oikos 104: 451 – 457.
Walker, B. H. 1992. Biodiversity and ecological redundancy. – Conserv. Biol. 6: 18 – 23.
Wardle, D. A. et al. 2011. Terrestrial ecosystem responses to species gains and losses. – Science 323: 1273 – 1277.
Woodward, F. I. 1987. Climate and plant distribution. – Cambridge Univ. Press.
Yates, C. J. et al. 2010. Assessing the impacts of climate change and land transformation on Banksia in the South West Australian Floristic Region. – Divers. Distrib. 16: 187 – 201.
Suding, K. N. et al. 2008. Scaling environmental change through the community-level: a trait-based response-and-eff ect framework for plants. – Global Change Biol. 14: 1125 – 1140.
Suppiah, R. et al. 2007. Australian climate change projections derived from simulations performed for the IPCC 4th Assessment Report. – Aust. Meteorol. Mag. 56: 131 – 152.
Th uiller, W. et al. 2005. Climate change threats to plant diversity in Europe. – Proc. Natl Acad. Sci. USA 102: 8245 – 8250.
Th uiller, W. et al. 2006. Using niche-based modelling to assess the impact of climate change on tree functional diversity in Europe. – Divers. Distrib. 12: 49 – 60.
Tilman, D. 2001. Functional diversity. – In: Levin, S. (ed.), Encyclopedia of biodiversity. Academic Press, pp. 109 – 120.
Supplementary material (Appendix E7514 at � www.oikosoffi ce.lu.se/appendix � ). Appendix 1 – 5.


![Diversity and Outage Performance in Space–Time Block Coded ... · fading. Space–time codes [1]–[4] are capable of extracting spatial diversity gain in systems employing multiple](https://img.pdfslide.us/doc/110x75/5f7ff8b8ffe250477355d664/diversity-and-outage-performance-in-spaceatime-block-coded-fading-spaceatime.jpg)

![Multiple Antenna Technologies - arXivdiversity gain is increased [10]. To get diversity gain at the receiver, received signals from different antennas are combined. There are four](https://img.pdfslide.us/doc/110x75/60473afad90a6f74262c7764/multiple-antenna-technologies-arxiv-diversity-gain-is-increased-10-to-get-diversity.jpg)