Embed Size (px)
Citation preview
Biological Journal of the Linnean Society (1999), 68: 333–353. With 6 figures
Article ID: bijl.1999.0319, available online at http://www.idealibrary.com on
Species diversity in spatial and temporaldimensions of fruit-feeding butterflies from twoEcuadorian rainforests
PHILIP J. DVRIES∗ AND THOMAS R. WALLA
Department of Biology, University of Oregon, Eugene, Oregon 97403-1210, U.S.A.
HAROLD F. GREENEY
Department of Entomology, University of Arizona, Tucson, Arizona 85721, U.S.A.
Received 6 July 1998; accepted for publication 4 January 1999
To test the hypotheses that butterflies in an intact lowland rainforest are randomly distributedin space and time, a guild of nymphalid butterflies was sampled at monthly intervals for oneyear by trapping 883 individuals of 91 species in the canopy and understory of fourcontiguous, intact forest plots and one naturally occurring lake edge. The overall speciesabundance distribution was well described by a log-normal distribution. Total speciesdiversity (c-diversity) was partitioned into additive components within and among communitysubdivisions (a-diversity and b-diversity) in vertical, horizontal and temporal dimensions.Although community subdivisions showed high similarity (1-b-diversity/c-diversity), sig-nificant b-diversity existed in each dimension. Individual abundance and observed speciesrichness were lower in the canopy than in the understory, but rarefaction analysis suggestedthat the underlying species richness was similar in both canopy and understory. Observedspecies richness varied among four contiguous forest plots, and was lowest in the lake edgeplot. Rarefaction and species accumulation curves showed that one forest plot and the lakeedge had significantly lower species richness than other forest plots. Within any given month,only a small fraction of total sample species richness was represented by a single plot andheight (canopy or understory). Comparison of this study to a similar one done in disturbedforest showed that butterfly diversity at a naturally occurring lake edge differed strongly froma pasture-forest edge. Further comparison showed that species abundance distributions fromintact and disturbed forest areas had variances that differed significantly, suggesting that inaddition to extrapolation, rarefaction and species accumulation techniques, the shapes ofspecies abundance distributions are fundamental to assessing diversity among sites. Thisstudy shows the necessity for long-term sampling of diverse communities in space and timeto assess tropical insect diversity among different areas, and the need of such studies isdiscussed in relation to tropical ecology and quick surveys in conservation biology.
1999 The Linnean Society of London
ADDITIONAL KEY WORDS:—Nymphalidae – species abundance distributions – speciesdiversity – rarefaction – vertical stratification – habitat disturbance – edges – conservation.
∗Corresponding author. Email: [email protected]. Address from April 2000: Centerfor Tropical Diversity, Milwaukee Public Museum, 800 Wells Street, Milwaukee, WI 53233, U.S.A.
3330024–4066/99/110333+21 $30.00/0 1999 The Linnean Society of London
P. J. DVRIES ET AL.334
CONTENTS
Introduction . . . . . . . . . . . . . . . . . . . . . . . 334Material and methods . . . . . . . . . . . . . . . . . . . 335
Study site . . . . . . . . . . . . . . . . . . . . . . 335Study community . . . . . . . . . . . . . . . . . . . 337Field methods . . . . . . . . . . . . . . . . . . . . . 337Statistical analyses . . . . . . . . . . . . . . . . . . . 338
Results . . . . . . . . . . . . . . . . . . . . . . . . 339Discussion . . . . . . . . . . . . . . . . . . . . . . . 346Acknowledgements . . . . . . . . . . . . . . . . . . . . 350References . . . . . . . . . . . . . . . . . . . . . . . 350
INTRODUCTION
Once upon a time lowland tropical forests were extensive wilderness areas teemingwith unknown life forms and buffered from the ravages of human civilization. Inthe span of two generations, however, human commercial activities have largelyreduced these forests to degraded habitat remnants. Since tropical forests are beingdestroyed faster than ever (Bowles et al., 1998), and the organisms within them remainlargely unknown, modern studies of species diversity are crucial for understandingremaining tropical communities and their conservation (Heywood, 1995; Gaston,1996; Wilson & Sandoval, 1996). Although documenting variation in species abund-ance distributions of organisms through space and time can help identify generalecological properties of tropical diversity, relatively few studies have done so (e.g.Wolda, 1978, 1992; Hubbell & Foster, 1986; Morse, Stork & Lawton, 1988; Terborghet al., 1990; Gill, 1991; Kato et al., 1995; Condit et al., 1996; DeVries, Murray &Lande, 1997; Novotny & Basset, 1998). Rather, the urgency of habitat destructionhas forced most biologists to perform rapid inventories (e.g. Roberts, 1991; Anon,1993), or develop extrapolation techniques to estimate species richness in a varietyof habitat types (Noss, 1990; Ryti, 1992; Colwell & Coddington, 1994; Hammond,1994; Pearson, 1994; Keister et al., 1996; Longino & Colwell, 1997). For example,although recent books are devoted to measurement of diversity and its applicationto community ecology and conservation biology (Magurran, 1988; Groombridge,1992; Ricklefs & Schluter, 1993; Edwards, May & Web, 1994; Forey, Humphries& Vane-Wright, 1994; Huston, 1994; Heywood, 1995; Gaston, 1996; Hayek &Buzas, 1996), much focus in conservation biology is on inventories rather thandetailed studies of factors contributing to biological diversity. Regardless of theirwidespread use, the validity of quick assessments or strict inventories must ultimatelybe tested against long-term studies documenting variation of many species throughspace and time.
Many plant and animal species in tropical forests exhibit stratified distributionsbetween canopy and understory (Allee, 1926; Bates, 1944; Richards, 1952; Pearson,1977; Sutton & Hudson, 1980; DeVries, 1988; Stork, 1988; Longino & Nadkarni,1990; Gill, 1991; Wolda, 1992; Malcolm, 1994; Erwin, 1995; Mallet & Gilbert,1995; DeVries et al., 1997), and such vertical stratification is of obvious importanceto estimating diversity. Although vertical stratification is a significant component ofdiversity, it is seldom addressed or measured directly. Given the recent surge ofinterest in documenting canopy biotas (reviewed in Lowman & Nadkarni, 1995),
SPECIES DIVERSITY IN ECUADORIAN RAINFOREST BUTTERFLIES 335
surprisingly few investigations have measured species diversity simultaneously inboth canopy and understory environments through time (e.g. DeVries, 1988; Basset,Aberlenc & Delvare, 1992; Wolda, 1992; Malcolm, 1994; Kato et al., 1995; DeVrieset al., 1997).
As the majority of all described species on earth are insects (Groombridge, 1992)this group has great promise for illuminating patterns and processes of biologicaldiversity. Due to their relatively large size, colourful appearance and ease of sampling,butterflies have broad appeal as models for understanding tropical insect diversityand conservation biology (see Gilbert, 1984; DeVries, 1987, 1997; Brown, 1991;Kremen, 1992, 1994; Beccaloni & Gaston, 1995; Daily & Ehrlich, 1995; Robbinset al., 1996; Brown & Hutchings, 1997; DeVries et al., 1997 and references therein).Although spatial and temporal factors are important components of ecologicaldiversity (e.g. MacArthur, 1972; Cody & Diamond, 1975; Ricklefs & Schluter, 1993;Rosenzweig, 1995), their effects on diversity in tropical butterfly communities haveseldom been addressed directly. As a result many studies concerned with butterfliesand other insects are frequently limited by short sampling periods, use of non-comparable sampling methods, presence-absence data only, small sample sizes, andlack of data on spatial and temporal distributions within communities (e.g. Basset etal., 1992; Daily & Ehrlich, 1995; Robbins et al., 1996). It is therefore often difficultor impossible to compare diversity studies from different areas.
A recent Ecuadorian field study measured the diversity of fruit-feeding nymphalidsin spatial and temporal dimensions, and provided an assessment of habitat disturbanceon these butterflies (DeVries et al., 1997). Recognizing that, like most studies oftropical diversity, their investigation was conducted in a forest with considerablehuman disturbance, DeVries et al. (1997) concluded that the generality of theirfindings required testing them against data sets gathered from forests with lessdisturbance.
Accordingly this study was designed to characterize the diversity of an Ecuadorianfruit-feeding nymphalid community from an intact forest and compare it to thecommunity studied by DeVries et al. (1997). To achieve our goals we first test thehypothesis that fruit-feeding nymphalid butterflies are randomly distributed inspace and time among areas within continuous forest. After describing the speciesabundance distribution of our total sample, we partition the measures of diversityamong subsets of the community in multiple dimensions, and analyse these partitionsstatistically. Secondly, we compare our samples to those of DeVries et al. (1997) andask how the butterfly diversity of an intact forest compares to that from a similar forestthat has experienced greater disturbance. By gathering and analysing standardizedsamples in different dimensions this study provides a unique comparison that accentsdifferences between two tropical butterfly communities, and points to patterns thatwarrant comparative investigations from other areas.
MATERIAL AND METHODS
Study site
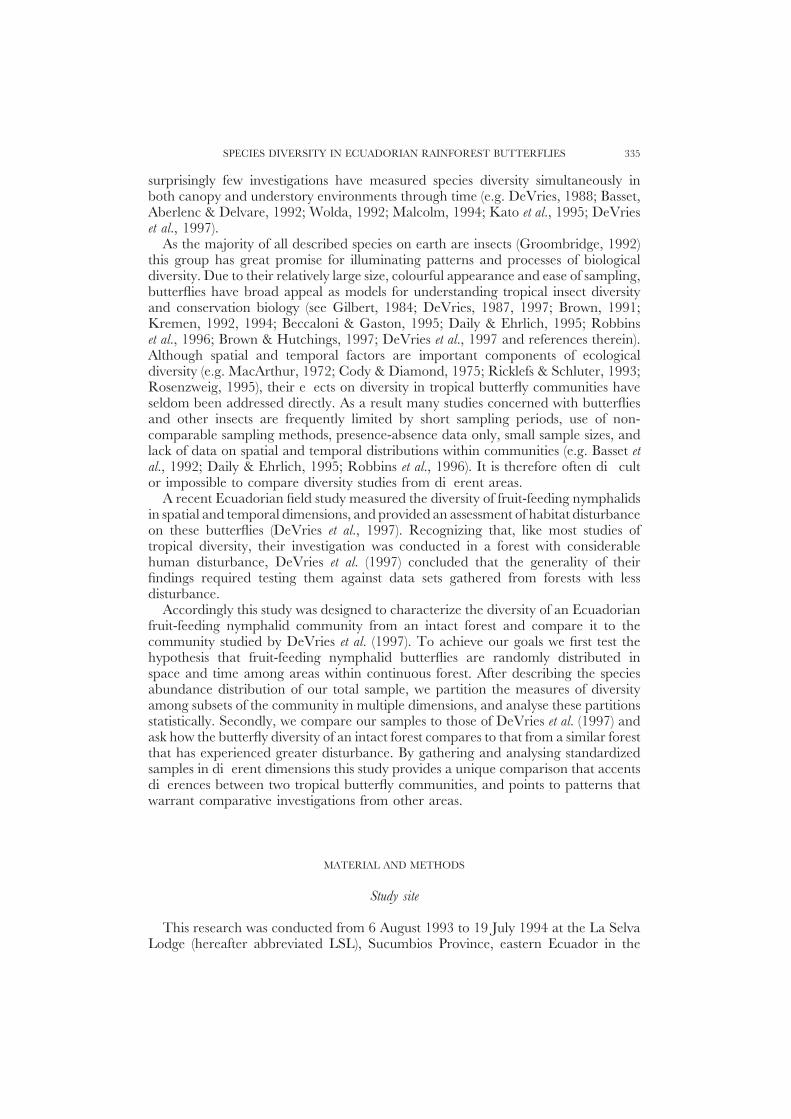
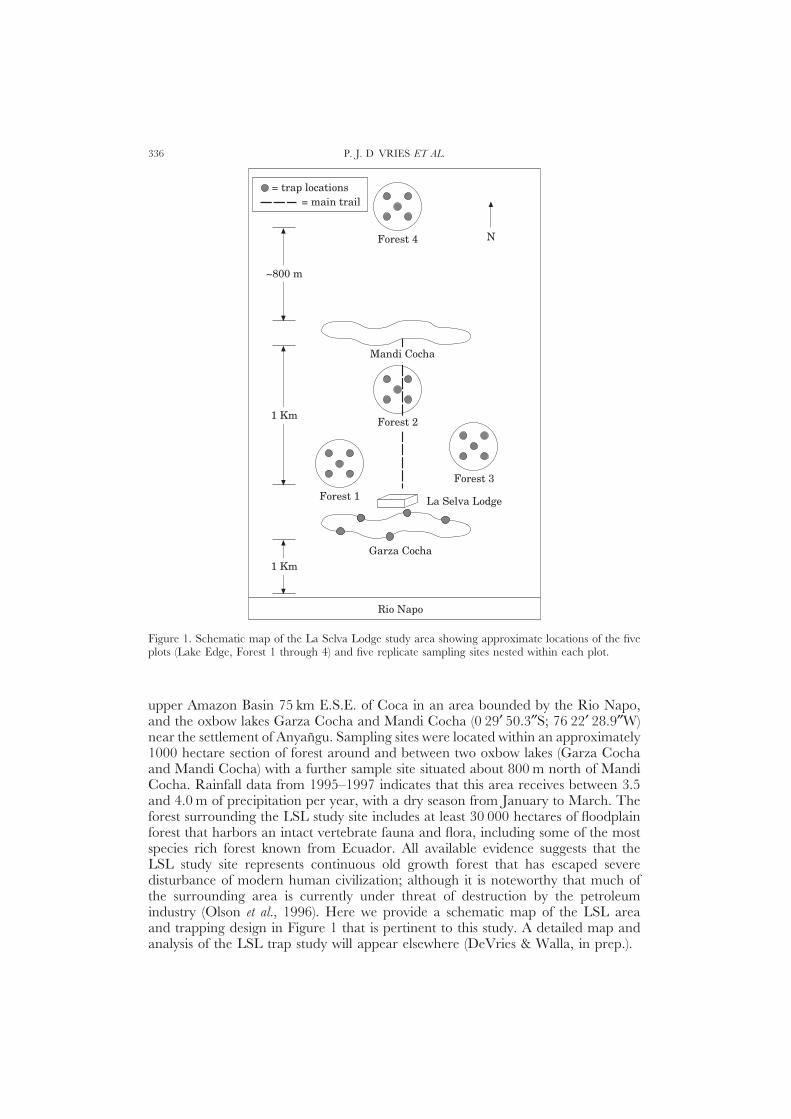
This research was conducted from 6 August 1993 to 19 July 1994 at the La SelvaLodge (hereafter abbreviated LSL), Sucumbios Province, eastern Ecuador in the
P. J. DVRIES ET AL.336
~800 m
1 Km
1 KmGarza Cocha
Forest 1 La Selva Lodge
Forest 3
Forest 2
Mandi Cocha
Forest 4
Rio Napo
N
= trap locations= main trail
Figure 1. Schematic map of the La Selva Lodge study area showing approximate locations of the fiveplots (Lake Edge, Forest 1 through 4) and five replicate sampling sites nested within each plot.
upper Amazon Basin 75 km E.S.E. of Coca in an area bounded by the Rio Napo,and the oxbow lakes Garza Cocha and Mandi Cocha (0 29′ 50.3″S; 76 22′ 28.9″W)near the settlement of Anyangu. Sampling sites were located within an approximately1000 hectare section of forest around and between two oxbow lakes (Garza Cochaand Mandi Cocha) with a further sample site situated about 800 m north of MandiCocha. Rainfall data from 1995–1997 indicates that this area receives between 3.5and 4.0 m of precipitation per year, with a dry season from January to March. Theforest surrounding the LSL study site includes at least 30 000 hectares of floodplainforest that harbors an intact vertebrate fauna and flora, including some of the mostspecies rich forest known from Ecuador. All available evidence suggests that theLSL study site represents continuous old growth forest that has escaped severedisturbance of modern human civilization; although it is noteworthy that much ofthe surrounding area is currently under threat of destruction by the petroleumindustry (Olson et al., 1996). Here we provide a schematic map of the LSL areaand trapping design in Figure 1 that is pertinent to this study. A detailed map andanalysis of the LSL trap study will appear elsewhere (DeVries & Walla, in prep.).
SPECIES DIVERSITY IN ECUADORIAN RAINFOREST BUTTERFLIES 337
Study community
Neotropical butterfly communities divide quite readily into two general adulttrophic guilds (see DeVries, 1987, 1988; DeVries et al., 1997): (1) flower feeders—thosespecies obtaining most nutritional requirements from flower nectar (mostPapilionidae, Pieridae, Lycaenidae, Riodinidae, and some Nymphalidae), and (2)fruit-feeding nymphalids—whose adults gain their nutritional requirements byfeeding on juices of rotting fruits or plant sap. The fruit-feeding guild is generallyunderstood to include the nymphalid subfamilies Charaxinae, Morphinae(Morphinae+Brassolinae of some authors, e.g. De Jong et al., 1996), Brassolinae,Amathusiinae, Satyrinae, and particular genera of Nymphalinae (Limenitinae ofsome authors). Fruit-feeding nymphalids are easily sampled in spatial and temporaldimensions using traps baited with rotting fruits (e.g. DeVries, 1988; Brakefield &Reitsma, 1991; Pinheiro & Ortiz, 1992; DeVries et al., 1997), and may comprisebetween 40–55% of the total nymphalid richness in tropical forests (DeVries, 1987,and unpublished). For completeness we note that at some neotropical sites a smallproportion of species in the subfamily Ithomiinae are found occasionally in fruit-traps (DeVries, Lande & Murray, in press). Ithomiines, however, typically feed onflower nectar, and are not strictly part of the fruit-feeding guild as defined here.The few individual ithomiines trapped during this study were excluded from ouranalyses.
Field methods
At LSL we established five sampling plots within intact, contiguous forest, eachcontaining five replicate sampling sites (Fig. 1). The five plots include: (1) Lake Edge:along the oxbow lake, Garza Cocha, where traps were located at the interface offorest edge and open water. This plot represented a naturally occurring forest edgedistinct from the other four plots that were all located within closed canopy forest;(2) Forest 1: located approximately 400 m WNW off the main trail between the twolakes; (3) Forest 2: located along the northernmost 500 m of the central trail towithin 50 m S of Mandi Cocha; (4) Forest 3: located approximately 1 km due eastof the central trail and ranging from 500–700 m north of Garza Cocha; and (5)Forest 4: located approximately 800 m north of Mandi Cocha.
In all plots each replicate sampling site was fitted with one understory trap andone canopy trap for a total of ten traps in each area—five canopy, and five understory(see DeVries, 1987; DeVries et al., 1997 for trap design and methods). Excludingrare emergent trees, the average height of the forest canopy at La Selva rangedbetween 18 and 29 m above the ground. In all cases our traps were positioned tosample from within the canopy; that is, within the crown of the trap tree. Canopytraps were suspended from thin ropes run over branches of an emergent tree, suchthat all traps could be raised and lowered from the ground. Understory traps weresuspended from low branches such that the bases hung between 1 and 1.5 m aboveground and could be serviced directly. In the case of the Lake Edge plot all traps(canopy and understory) were serviced from a dugout canoe.
Baited traps were maintained continuously for a 5-day sampling period withinthe first week of every month. As in a similar study (DeVries et al., 1997) traps werebaited with locally-obtained bananas which were mashed, mixed well, and fermented

P. J. DVRIES ET AL.338
for 48 h in one large container prior to use, and on the day prior to the samplinginterval, bait was placed in a small plastic cup fixed inside each trap, and a smallamount of new bait from the common reservoir was added to each trap on thethird sampling day. During trap months all 50 baited traps were sampled daily for5 days. On the last day of the sampling period baits were removed from all traps,and traps remained unbaited for 3 weeks. New bait was made prior to the subsequentsampling interval, and the protocol repeated throughout the study. As shownpreviously (DeVries, 1988; DeVries et al., 1997) butterflies were not attracted tounbaited traps.
All butterflies were identified to species, and depending on the species, individualbutterflies were treated in one of two ways. In most cases each individual wascollected and placed in a glassine envelope with all pertinent data written on theenvelope, and used for subsequent identification and ecological measurements. Fora few abundant species, individuals were marked with a unique number, released,and the information recorded in a notebook. Only data for the first date of captureof any individual were included in the analyses reported here. Results of the mark-recapture study will be reported elsewhere (DeVries & Walla, in prep.).
Excepting a few refinements of Ehrlich’s (1958) higher classification of butterflies,all subsequent systematic studies indicate that the phylogeny of nymphalid subfamilyrelationships are unresolved (see summary in De Jong et al., 1996). In the absenceof a well resolved phylogeny it therefore seems almost arbitrary as to which higherlevel classification is used, provided that the one chosen is unambiguous and wellknown. As in a previous study (DeVries et al., 1997) we follow the conservativesynthesis of Ackery (1984) which is based upon Ehrlich (1958), and represents awidely known, functional classification of nymphalid subfamilies.
Statistical analyses
Species abundance distributions were graphed following Williams (1964) whonoted that, in contrast to log base 2 (or any even number) interval widths, log base3 interval widths with interval edges at 3n/2 do not overestimate rare species, orviolate the independence of data points. The species abundance distribution inFigure 3 was plotted using log base 3 interval widths, and the goodness-of-fit to theobserved distribution was assessed for log series and log-normal distributions (Fisher,Corbet & Williams, 1943; Williams, 1964; May, 1975). The position of the lowestobserved relative abundance (the ‘veil line’ of Preston (1948)) provided an estimateof how completely the community had been sampled (Fig. 3).
We measure b-diversity as the component of total diversity among subdivisionsof the community in the dimensions of height (canopy and understory), area (LakeEdge, Forest plots 1–4), or time (month). Specifically, the total, or c-diversity isestimated by the diversity of the pooled data set for the entire sample; a-diversityis the weighted average diversity within subdivisions (weighted by sample size); andb-diversity equals c-diversity minus a-diversity. Thus, we use an additive partitionof diversity such that a-diversity plus b-diversity equals c-diversity. The proportionof total diversity within subdivisions in a given dimension therefore provides anatural measure of similarity among the subdivisions (Lande, 1996).
The hypothesis that total individual abundance for the entire community wasidentical among areas was evaluated using Chi-squared tests.
SPECIES DIVERSITY IN ECUADORIAN RAINFOREST BUTTERFLIES 339
Chi-squared tests for homogeneity of observed species abundance distributions attaxonomic levels of the total community and subfamilies were used to assess thesignificance of b-diversity among sample subsets in dimensions of height, area, andtime. A sequential Bonferoni test (Rice, 1989) was then used to assess potentialtable-wide type I errors at the a=0.05 level.
Species diversity was calculated using three measures: species richness, Shannon–Wiener information and Simpson diversity (Magurran, 1988), and communitysimilarity indices corresponding to each of these measures were calculated as 1-b-diversity/c-diversity (Lande, 1996).
Species accumulation curves for horizontal subdivisions of the LSL sample werecompared to assess the influence of sample size on species richness estimates (Colwell& Coddington, 1994; Longino & Colwell, 1997). However, as estimates of speciesrichness in diverse communities are highly sensitive to sample size, direct comparisonsbetween subdivisions require a method that corrects for differences in sample sizes.We calibrated species richness in vertical and horizontal subsets against the rarefactioncurve for the total sample (Sanders, 1968; Hurlbert, 1971; Gotelli & Graves, 1996)which gives the expected species richness in a random subset of any particular size.The statistical significance of such comparisons was evaluated using the approximate95% confidence limits for the rarefaction curve, calculated as±2 standard deviationsaround expected values (Heck, van Bell & Simberloff, 1975).
To compare fruit-feeding nymphalid diversity from an intact forest (LSL) to thatof a disturbed forest ( Jatun Sacha) the larger sample size of the Jatun Sacha dataset (see DeVries et al., 1997) was rarefied to that of the present study and plottedwith 95% confidence intervals onto the rarefaction curve of the total LSL sample.
To test the hypothesis that the difference between variances of the log-normalspecies abundance distributions fitted to the LSL and Jatun Sacha samples was anartifact of the difference in the two sample sizes, the following random samplingtest was written using Mathematica version 3.0 (Wolfram, 1996). Individuals weresampled at random, without replacement, from the larger Jatun Sacha sample toform 10 000 simulated communities, each with the same number of individuals asthe smaller LSL data set. A log-normal distribution was fitted to the observed speciesabundance distribution for each simulated community, and the variance of eachfitted distribution was calculated following Pielou (1975). The variance of the fittedlog-normal distribution for the LSL sample was compared to the distribution ofvariances obtained for the fitted distributions from our 10 000 simulated communities,and the proportion of the simulated variances greater than or equal to the observedLSL variance was determined.
RESULTS
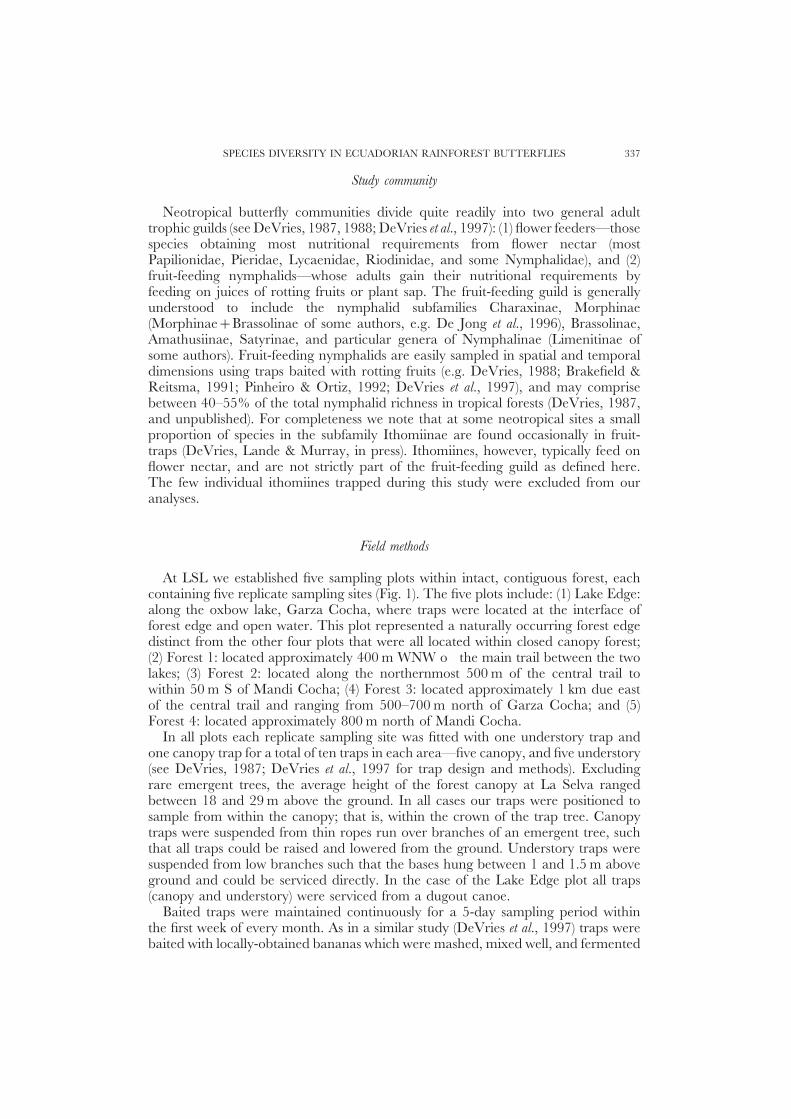
A total of 883 individual butterflies belonging to 91 species in five subfamilieswere captured during the 12 sampling periods (Table 1). The rank abundancedistribution of the entire sample showed that a large proportion of trapped butterflieswere accounted for by relatively uncommon species (Fig. 2): over 75% of specieswere represented by 10 or fewer individuals. The species abundance distributionranged from 22 species represented by single individuals to one species, Nessaeahewitsoni, represented by 104 individuals (Figs 2 & 3).
P. J. DVRIES ET AL.340
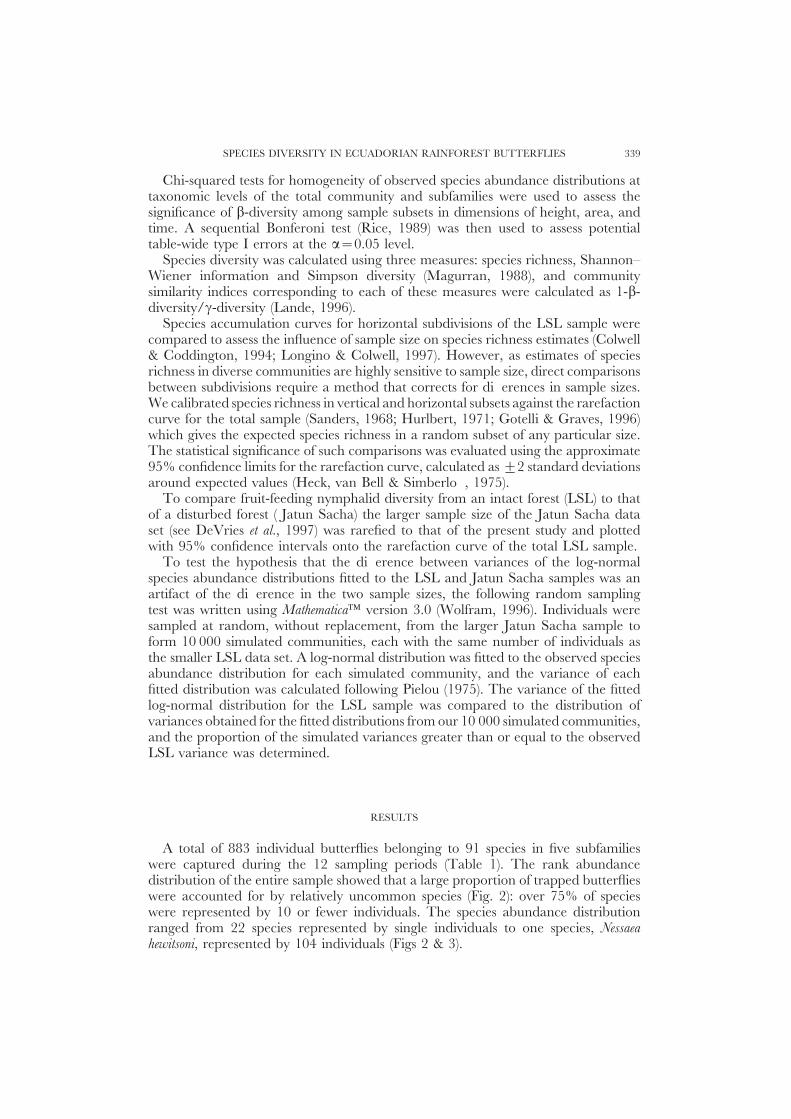
T 1. A, species richness of the La Selva Lodge sample partitioned by vertical position. Rare speciesare those represented byΖ4 individuals, and common species are those represented by[5 individuals.
B, individual abundance of the La Selva Lodge sample partitioned by vertical position
Canopy Understory Both Total
(A) Species richnessRare species 22 26 3 51Common species 6 18 16 40Total species 28 44 19 91
(B) Individual abundanceTotal individuals 303 580 883
100
1
0Species rank
Spe
cies
abu
nda
nce
5010 20 30 40 60 70 80 90
100
10
Figure 2. Rank-abundance distribution for total sample of fruit-feeding nymphalids.
Summary data showed that species richness and abundance were distributedunequally between canopy and understory. Thirty-one per cent of the species werefound in canopy only, 48% were found in understory only, and the remaining 21%of species were found in both strata (Table 1). When only the 51 rare species(represented by Ζ4 individuals) were considered, the frequency of rare species wasdistributed evenly with respect to vertical dimension; 22 species were found incanopy only, 26 in understory only, and 3 were found in both. In contrast, a largerproportion of common species (represented by [5 individuals) were found in theunderstory in comparison to the canopy, and 66% of the total individual abundancewas found in the understory (Table 1).
Partitioning the entire sample into five sample areas (Lake Edge, Forest 1, Forest2, Forest 3 and Forest 4) showed that observed species richness was unequal amongareas. Forest 3 had highest species richness and most unique species, the Lake Edgehad lowest species richness, and other areas had approximately equivalent speciesrichness and numbers of unique species (Table 2). The hypothesis of equal numbersof species among areas, however, is not subject to standard statistical tests since

SPECIES DIVERSITY IN ECUADORIAN RAINFOREST BUTTERFLIES 341
8
35
00Log3 number of individuals
Nu
mbe
r of
spe
cies
10
30
25
20
15
5
2 4 6
B
8
35
00
Nu
mbe
r of
spe
cies
10
30
25
20
15
5
2 4 6
A
Figure 3. A, Species abundance distribution for total sample of fruit-feeding nymphalids (histogram)from intact forest at the La Selva Lodge (91 species and 883 individuals). Parameters of the fitted log-normal distribution (solid curve) using the method of Pielou (1975) on a log base 3 scale are: mean1.053, variance 1.674, and estimated total number of species 100.73. The log-normal distribution(v2=0.429, P=0.934) gives a better fit than the log-series distribution (v2=1.293, P=0.862). Theparameters of the log-series distribution (not illustrated) are a=25.456 and x=0.972. B, speciesabundance distribution from disturbed forest (130 species and 6690 individuals) at Jatun Sacha (afterDeVries et al., 1997). Parameters of the fitted log-normal distribution (solid curve) are: mean 1.824and variance 3.279. Note that variances of species abundance distributions of Jatun Sacha and LaSelva Lodge differ significantly (P<0.01) in a random sampling.
T 2. Distribution of total species richness (91 species), unique species, and total abundance amongsampling areas
Area Unique species Total species Abundance
Lake Edge 2 25 94Forest 1 3 47 145Forest 2 4 42 125Forest 3 16 70 295Forest 4 5 42 224
species are not independent (due to phylogenetic relationships), nor could they beidentically distributed (due to differences in abundance).
Species richness provided a measure of how rare and common species were
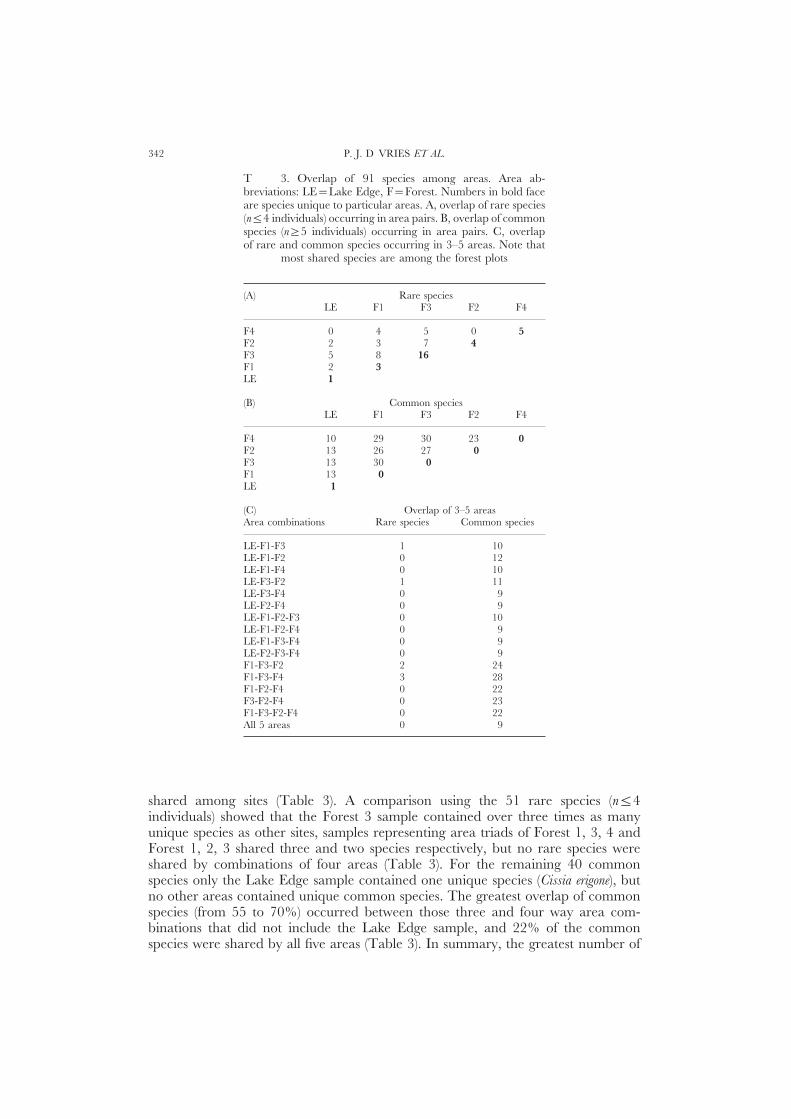
P. J. DVRIES ET AL.342
T 3. Overlap of 91 species among areas. Area ab-breviations: LE=Lake Edge, F=Forest. Numbers in bold faceare species unique to particular areas. A, overlap of rare species(nΖ4 individuals) occurring in area pairs. B, overlap of commonspecies (n[5 individuals) occurring in area pairs. C, overlapof rare and common species occurring in 3–5 areas. Note that
most shared species are among the forest plots
(A) Rare speciesLE F1 F3 F2 F4
F4 0 4 5 0 5F2 2 3 7 4F3 5 8 16F1 2 3LE 1
(B) Common speciesLE F1 F3 F2 F4
F4 10 29 30 23 0F2 13 26 27 0F3 13 30 0F1 13 0LE 1
(C) Overlap of 3–5 areasArea combinations Rare species Common species
LE-F1-F3 1 10LE-F1-F2 0 12LE-F1-F4 0 10LE-F3-F2 1 11LE-F3-F4 0 9LE-F2-F4 0 9LE-F1-F2-F3 0 10LE-F1-F2-F4 0 9LE-F1-F3-F4 0 9LE-F2-F3-F4 0 9F1-F3-F2 2 24F1-F3-F4 3 28F1-F2-F4 0 22F3-F2-F4 0 23F1-F3-F2-F4 0 22All 5 areas 0 9
shared among sites (Table 3). A comparison using the 51 rare species (nΖ4individuals) showed that the Forest 3 sample contained over three times as manyunique species as other sites, samples representing area triads of Forest 1, 3, 4 andForest 1, 2, 3 shared three and two species respectively, but no rare species wereshared by combinations of four areas (Table 3). For the remaining 40 commonspecies only the Lake Edge sample contained one unique species (Cissia erigone), butno other areas contained unique common species. The greatest overlap of commonspecies (from 55 to 70%) occurred between those three and four way area com-binations that did not include the Lake Edge sample, and 22% of the commonspecies were shared by all five areas (Table 3). In summary, the greatest number of
SPECIES DIVERSITY IN ECUADORIAN RAINFOREST BUTTERFLIES 343
Aug94
100
0Aug93
Indi
vidu
al a
bun
dan
ce 75
50
25
Sep93
Oct93
Nov93
Dec93
Jan94
Feb94
Mar94
Apr94
May94
Jun94
Jul94
CanopyUnderstory
Aug94
35
0
Aug93
Nu
mbe
r of
spe
cies 25
15
10
Sep93
Oct93
Nov93
Dec93
Jan94
Feb94
Mar94
Apr94
May94
Jun94
Jul94
CanopyUnderstory
B
30
20
A
Figure 4. Temporal variation of the total La Selva Lodge sample by vertical position. A, speciesrichness. B, individual abundance.
species were shared among combinations of plots that did not include the LakeEdge.
Total abundances among the five areas differed significantly (v2=25.21, df=4,P<0.0001), where the greatest abundance was found in the Forest 3 sample, andthe least in the Lake Edge sample (Table 2).
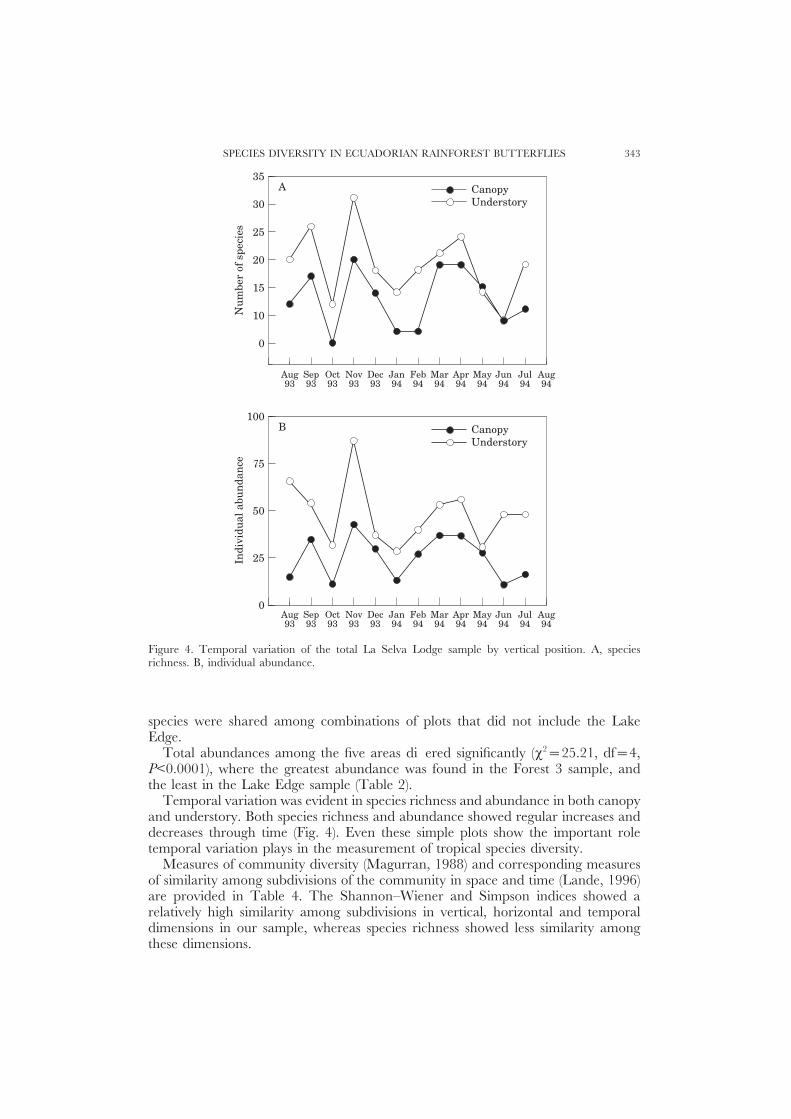
Temporal variation was evident in species richness and abundance in both canopyand understory. Both species richness and abundance showed regular increases anddecreases through time (Fig. 4). Even these simple plots show the important roletemporal variation plays in the measurement of tropical species diversity.
Measures of community diversity (Magurran, 1988) and corresponding measuresof similarity among subdivisions of the community in space and time (Lande, 1996)are provided in Table 4. The Shannon–Wiener and Simpson indices showed arelatively high similarity among subdivisions in vertical, horizontal and temporaldimensions in our sample, whereas species richness showed less similarity amongthese dimensions.

P. J. DVRIES ET AL.344
T 4. Measures of community diversity and similarity for the total community of fruit-feedingnymphalid butterflies at La Selva Lodge
Measure Community similarity among
heights areas months
Species richness 91 0.631 0.553 0.354Shannon–Wiener 3.645 0.861 0.891 0.840Simpson 0.954 0.961 0.980 0.974
∗Community similarity=1-b/c, where b is beta-diversity among subdivisions in a given dimension and c istotal community diversity (Lande, 1996).
T 5. Chi-squared tests for homogeneity of species abundance distributions among heights, areas,and months for the total sample and subfamilies. Significance levels are: ns=not significant, ∗∗=P<0.01, ∗∗∗=P<0.001. Application of the sequential Bonferroni test (Rice, 1989) did not affect thesignificance of our results. Note: as all Morphinae were found in understory no statistical test was
performed for heights
Taxon Species richness Abundance Heights Areas Months
Total sample 91 883 ∗∗∗ ∗∗∗ ∗∗∗Subfamily
Charaxinae 17 75 ∗∗∗ ns ∗∗∗Nymphalinae 26 398 ∗∗∗ ∗∗∗ ∗∗∗Morphinae 4 95 — ns nsBrassolinae 12 96 ∗∗∗ ∗∗∗ ∗∗Satyrinae 32 219 ∗∗∗ ∗∗∗ ns
Chi-squared tests for homogeneity of species abundance distributions demonstratedthat our sample was distributed non-randomly in all dimensions. The total sampleshowed significant differences in species composition among subdivisions of verticalposition (canopy or understory), area, and sampling period (Table 5). Relativefrequencies of species in each subfamily differed significantly between canopy andunderstory, among five areas (excepting Charaxinae and Morphinae), and with theexception of Morphinae and Satyrinae, among sampling periods (Table 5).
Species accumulation curves showed that, among the plots, Forest 3 had the mostspecies, and Lake Edge and Forest 4 had the least species (Fig. 5). Whether Forest1 and Forest 2 would continue to accumulate species more slowly than Forest 3could only be determined by additional sampling.
Rarefaction of the entire LSL sample (Fig. 6) indicates that, in contrast to rawdata uncorrected for sample size (e.g. Table 2), Forest 1, 2 and 3 contained similarnumbers of species, while the Lake Edge and Forest 4 areas had significantly fewerspecies than expected from a random sample of the entire community. Both canopyand understory samples fell below the rarefaction curve for the total sample (Fig. 6)indicating strong heterogeneity in the vertical dimension. The individual rarefactioncurves for canopy and understory showed no indication of crossing, and rarefactionof the understory to the sample size of the canopy (with 95% confidence intervals)suggests that the understory is expected to have approximately the same number ofspecies as the canopy (Fig. 6).

SPECIES DIVERSITY IN ECUADORIAN RAINFOREST BUTTERFLIES 345
350
75
Cumulative abundance
Spe
cies
ric
hn
ess
100
30
50454035
25201510
50 150 200 250 3000
70656055
5
Lake EdgeForest-1Forest-2Forest-3Forest-4
Figure 5. Species accumulation curves showing total species versus cumulative individual abundancethrough time in five sampling areas.
900
100
Sample size
Nu
mbe
r of
spe
cies
500
50
90
80
70
60
40
30
20
10
100 200 300 400 600 700 8000
LE
F1F4
C
U
T
JS
F2
F3
Figure 6. Rarefaction curve (solid curve) and approximate 95% confidence interval (dashed curves)for the total La Selva Lodge sample of fruit-feeding nymphalids compared to observed species richnessin subdivisions of the sample along dimensions of height and area. Abbreviations: T=total community;C=canopy; U=understory; LE=Lake Edge, F1=Forest 1, F2=Forest 2, F3=Forest 3, F4=Forest4 (individual points=Β); (Χ) months; (Η) understory rarefied to sample size of canopy (with 95%confidence intervals); (B) total Jatun Sacha sample rarefied to sample size of La Selva Lodge (with95% confidence intervals).
P. J. DVRIES ET AL.346
When the total sample of Jatun Sacha (6690 individuals) was rarefied to that ofLSL (883 individuals) it fell below the LSL rarefaction curve, but within the 95%confidence intervals (Fig. 6). Thus, rarefaction suggests that, despite the disparitybetween species richness at these sites (130 species at Jatun Sacha and 91 species atLSL), when standardized to the sample size of LSL species richness in these twocommunities does not differ significantly.
Our random sampling test suggested that the difference between variances offitted species abundance distributions from LSL and Jatun Sacha was not an artifactof sample size (Fig. 3). Ninety-nine per cent of the communities simulated from theJatun Sacha sample had variances greater than the observed variance of the LSLsample, indicating that the shapes of the species abundance distributions of LSLand Jatun Sacha samples differed significantly (P<0.01).
DISCUSSION
The scale and momentum of habitat destruction requires ecologists to acceptthe practical need for quick surveys of biodiversity in ecological monitoring andconservation planning (e.g. see Heywood, 1995; Laurence & Bierregaard, 1997).Ultimately, however, the accuracy of quick surveys in tropical areas can be justifiedonly by testing their accuracy against long-term studies with intensive sampling thatpartition diversity into spatial and temporal components. We show that fruit-feedingnymphalid butterflies provide a model system for testing the accuracy of quickbiodiversity surveys, and performing detailed comparisons among sites. In contrastto inventory or estimation techniques that rely on sampling with hand nets, sightrecords or sampling at irregular intervals by different collectors (e.g. Daily & Ehrlich,1995; Robbins et al., 1996; Brown & Hutchings, 1997), the system described hereallows more rigorous comparisons of butterfly diversity among samples in space andtime.
Trap studies have clearly advanced our understanding of tropical insect ecologyand diversity (e.g. Wolda, 1978, 1992; Hanski & Cambefort, 1991; Muirhead-Thomson, 1991). However, it is well known that sampling bias might arise fromvariance among trap positions, and variance among species in attraction to baits(Williams, 1964; Muirhead-Thomson, 1991). Pooling replicate traps within plots (asdone here) can reduce individual trap variance, but species attraction to baits canonly be addressed by intensive mark-recapture studies (Seber, 1982) and/or detailedobservations on diet preference. As noted elsewhere (DeVries, 1988; DeVries et al.,1997; DeVries, Lande & Murray, 1999) our methods estimate species abundanceof where adult butterflies were trapped, but not the distribution of host plants,courtship sites, or other life history components. Nevertheless, our methods canreduce or avoid the sampling biases in all hand net techniques that pool the effortsof multiple persons, and trapping is clearly superior to sight records. Althoughsusceptibility of fruit-feeding nymphalids to traps has not been established for allspecies, our methods are important for assessing tropical species diversity becausethey permit more accurate comparisons and statistical analysis to be made amongsamples in space and time than has been done previously.
This study provided unique estimates of spatial and temporal components ofspecies diversity and individual abundance for fruit-feeding nymphalid butterflies
SPECIES DIVERSITY IN ECUADORIAN RAINFOREST BUTTERFLIES 347
T 6. Comparison of species diversity between a natural lake edge at La Selva Lodge (this study)and forest-pasture edge at Jatun Sacha (data from DeVries et al., 1997)
Species Total edge Cissia penelope Cissia peneloperichness abundance total abundance edge abundance
La Selva Lodge 25 94 2 0Jatun Sacha 86 3686 1618 1556
within an intact tropical forest. Despite the fact that 78% of the species wererepresented by fewer than 10 individuals, and 56% of the species were representedbyΖ4 individuals (Fig. 2), the species abundance patterns in our sample fit the log-normal distribution (Fig. 3). The position of the veil line (Preston, 1948) providedan estimate of total species richness of 100.7 species using Pielou’s (1975) method,and the method of Chao (1984) provided an estimate of 108.3±9.6 species.Subsequent sampling has shown these to be underestimates of the fruit-feedingnymphalid species richness occurring at LSL (DeVries & Walla, unpublished), andthis issue will be addressed elsewhere.
Chi-square tests for homogeneity of species abundance distributions in the totalcommunity showed significant b-diversity in vertical, horizontal and temporaldimensions. Significant b-diversity existed among heights for all subfamilies, andmost subfamilies showed significant b-diversity among areas and months (Table 5,Fig. 4). Significant temporal and spatial variation in abundance and species richnessas seen in this and other studies (Kato et al., 1995; DeVries et al., 1997) suggeststhat such heterogeneity is a fundamental feature of tropical forest insect communities.Continuous observations over 5 years indicate that many species comprising Table5 (in addition to others not sampled in this study) manifest consistent verticaldistributions at LSL (DeVries & Walla, unpublished), emphasizing the importanceof accounting for vertical dimension in tropical insect diversity estimates.
In many communities vegetation structure may have profound effects on speciesrichness (e.g. MacArthur, Recher & Cody, 1966; Southwood, Brown & Reader,1979), and responses to edge effects may depend upon the focal group of organisms(Murcia, 1995). Comparing LSL and Jatun Sacha serves to illustrate how Amazonianbutterfly species diversity may differ between forest edges. The edge at LSL compriseda natural interface between a body of water and forest where butterfly diversityshowed a low individual abundance and species richness (Tables 2 & 6, Fig. 6). Incontrast, the edge at Jatun Sacha represents the interface between cattle pastureand forest where butterfly diversity showed a relatively high individual abundanceand species richness (DeVries et al., 1997). Further, in a spectacular case of ecologicalrelease (Table 6), over 1600 individuals of Cissia penelope were sampled at the JatunSacha edge (DeVries et al., 1997), yet this species was represented by only twospecimens in the total LSL sample (neither from the Lake Edge). This simplecomparison highlights how different types of edges (one natural, the other due tohuman disturbance) can affect two butterfly communities that share a large numberof species.
Although accumulation curves suggest a ranking of the five areas with respect tospecies richness, ultimately the differences implied between them could only beverified through continued sampling (Fig. 5). Given that intermediate levels of

P. J. DVRIES ET AL.348
disturbance may increase species richness (e.g. Connell, 1978; Huston, 1979, 1994;Denslow, 1987), the greater richness of Forest 3 could suggest that plot hasexperienced greater disturbance in the recent past than the other plots. This may,in fact, be the case as indigenous residents report that a localized storm blew downa significant number of large trees near this plot in August 1975, but left other areasunaffected (L. Chowamongo, J. Hualinga and S. Machoa, pers. comms.).
Rarefaction analysis verified spatial heterogeneity in both vertical and horizontaldimensions. The canopy and understory both fell below the 95% confidence intervalsof the rarefaction curve (Fig. 6) showing that each sample had a distinct speciescomposition, and only when combined did they reflect the species richness of thetotal sample. Rarefaction of the understory sample to that of the canopy suggeststhat both strata have similar species richness, a contrast to the disturbed Jatun Sachasite where the canopy was shown to have a higher species richness (DeVries et al.,1997). Rarefaction of the total community (Fig. 6) also showed that Lake Edge andForest 4 both fell below the rarefaction curve, confirming significant differences inspecies richness among sampling plots.
The most suitable measures of species diversity for quick surveys have the desirablestatistical property of small bias when sample size is small. Of the three mostcommonly used measures of species diversity, only Simpson diversity, 1-k, and to alesser extent Shannon–Wiener information, H, satisfy this criterion (Lande, 1996).Although it is the least reliable statistic, species richness is often employed inconservation applications because it is the only commonly used measure that issensitive to rare species (Peet, 1974). However, since species richness is highlysensitive to the small sample sizes that are typical of quick surveys, comparison ofspecies richness among samples requires correction for differences in sample sizeusing rarefaction, species accumulation curves, and extrapolation techniques whichare best performed on large samples.
Comparisons of species richness are often used to discriminate among naturalareas to be conserved. For example, during a 12 month period we sampled 91species of fruit-feeding nymphalids from an intact forest (Tables 1 & 2), but aprevious 12 month study (DeVries et al., 1997) sampled 130 species from a markedlydisturbed forest ( Jatun Sacha). In other words, using the same sampling regime43% more species were found at Jatun Sacha than in the present study. Extrapolationtechniques also indicate that Jatun Sacha has a higher species richness than LSL(see DeVries et al., 1997, and below), and under conservation practices favouringspecies richness one might argue that LSL is less worthy of protection than JatunSacha. Rarefaction, however, suggests that the apparent difference may be due todisparity in the sizes of the two samples (Fig. 6).
Although rarefaction is a robust statistical tool for comparing samples of differentsize, the shapes of the species abundance distributions are important for interpretingcomparisons among different communities. Estimates of total species richness usingthe methods of Pielou (1975) and Chao (1984) suggest that Jatun Sacha has a higherspecies richness than LSL. Alternatively, rarefaction suggests that at the sample sizeof LSL the species richness of these communities do not differ significantly (Fig. 6).Although the rarefaction curves for the two communities do not cross, the shapesof the species abundance distributions (Fig. 3) indicate that further sampling fromLSL would yield rarefaction curves that intersect, and at large sample sizes the LSLcurve would fall below that of Jatun Sacha. This is because, at the LSL sample size,rarefaction of the Jatun Sacha community considers a smaller proportion of the
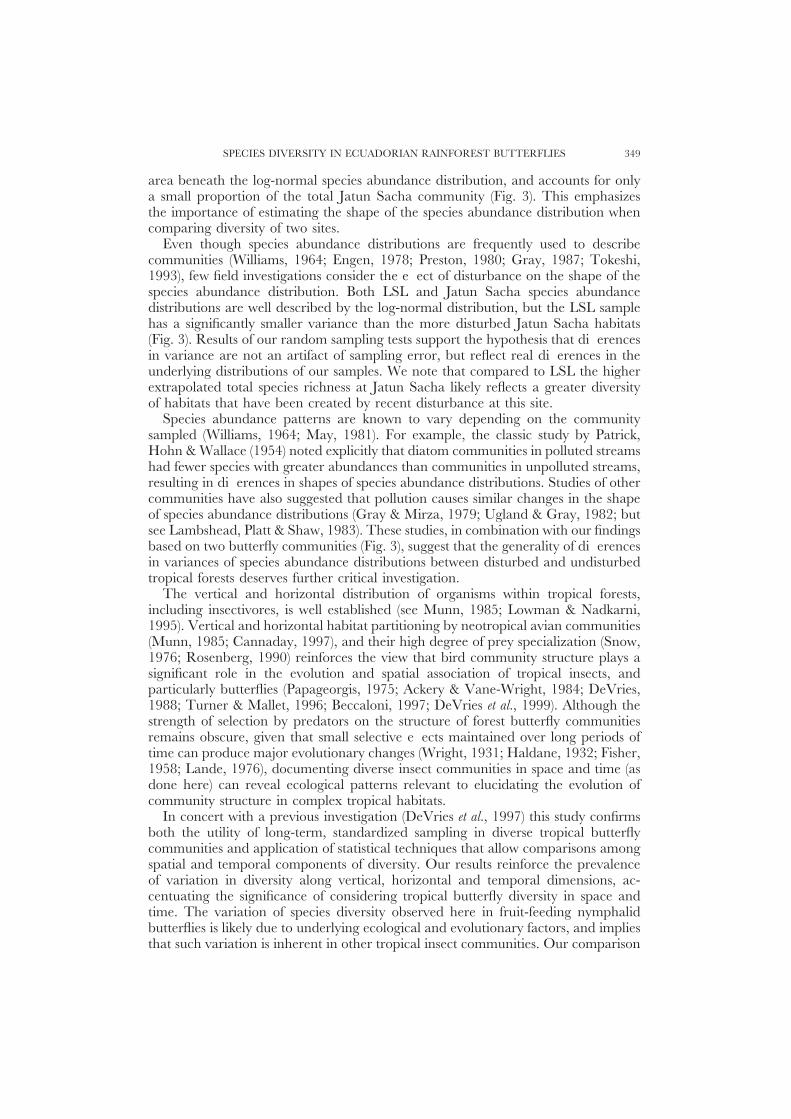
SPECIES DIVERSITY IN ECUADORIAN RAINFOREST BUTTERFLIES 349
area beneath the log-normal species abundance distribution, and accounts for onlya small proportion of the total Jatun Sacha community (Fig. 3). This emphasizesthe importance of estimating the shape of the species abundance distribution whencomparing diversity of two sites.
Even though species abundance distributions are frequently used to describecommunities (Williams, 1964; Engen, 1978; Preston, 1980; Gray, 1987; Tokeshi,1993), few field investigations consider the effect of disturbance on the shape of thespecies abundance distribution. Both LSL and Jatun Sacha species abundancedistributions are well described by the log-normal distribution, but the LSL samplehas a significantly smaller variance than the more disturbed Jatun Sacha habitats(Fig. 3). Results of our random sampling tests support the hypothesis that differencesin variance are not an artifact of sampling error, but reflect real differences in theunderlying distributions of our samples. We note that compared to LSL the higherextrapolated total species richness at Jatun Sacha likely reflects a greater diversityof habitats that have been created by recent disturbance at this site.
Species abundance patterns are known to vary depending on the communitysampled (Williams, 1964; May, 1981). For example, the classic study by Patrick,Hohn & Wallace (1954) noted explicitly that diatom communities in polluted streamshad fewer species with greater abundances than communities in unpolluted streams,resulting in differences in shapes of species abundance distributions. Studies of othercommunities have also suggested that pollution causes similar changes in the shapeof species abundance distributions (Gray & Mirza, 1979; Ugland & Gray, 1982; butsee Lambshead, Platt & Shaw, 1983). These studies, in combination with our findingsbased on two butterfly communities (Fig. 3), suggest that the generality of differencesin variances of species abundance distributions between disturbed and undisturbedtropical forests deserves further critical investigation.
The vertical and horizontal distribution of organisms within tropical forests,including insectivores, is well established (see Munn, 1985; Lowman & Nadkarni,1995). Vertical and horizontal habitat partitioning by neotropical avian communities(Munn, 1985; Cannaday, 1997), and their high degree of prey specialization (Snow,1976; Rosenberg, 1990) reinforces the view that bird community structure plays asignificant role in the evolution and spatial association of tropical insects, andparticularly butterflies (Papageorgis, 1975; Ackery & Vane-Wright, 1984; DeVries,1988; Turner & Mallet, 1996; Beccaloni, 1997; DeVries et al., 1999). Although thestrength of selection by predators on the structure of forest butterfly communitiesremains obscure, given that small selective effects maintained over long periods oftime can produce major evolutionary changes (Wright, 1931; Haldane, 1932; Fisher,1958; Lande, 1976), documenting diverse insect communities in space and time (asdone here) can reveal ecological patterns relevant to elucidating the evolution ofcommunity structure in complex tropical habitats.
In concert with a previous investigation (DeVries et al., 1997) this study confirmsboth the utility of long-term, standardized sampling in diverse tropical butterflycommunities and application of statistical techniques that allow comparisons amongspatial and temporal components of diversity. Our results reinforce the prevalenceof variation in diversity along vertical, horizontal and temporal dimensions, ac-centuating the significance of considering tropical butterfly diversity in space andtime. The variation of species diversity observed here in fruit-feeding nymphalidbutterflies is likely due to underlying ecological and evolutionary factors, and impliesthat such variation is inherent in other tropical insect communities. Our comparison
P. J. DVRIES ET AL.350
of two butterfly communities revealed intriguing differences in the shapes of speciesabundance distributions from intact and disturbed forest that, when considered incombination with previous work on diatom communities, invites further investigation.Finally, studies of tropical butterfly communities have rarely, if ever, employedstandardized methods to compare diversity among different sites as reported here.This study therefore encourages comparisons of fruit-feeding nymphalid butterflycommunities among other intact and disturbed tropical sites, and points to a meansof advancing our understanding of how spatial and temporal factors may influencetropical insect diversity and community structure.
ACKNOWLEDGEMENTS
We thank Eric Schwartz for encouraging and supporting our field work, C.Licuey, M. Lysinger and O. Tapuey for field assistance, L. Chowamongo, J. Hualingaand S. Machoa for local natural history of the La Selva Lodge area, and G. Onore(Universidad Catolica, Quito) with help obtaining research permits. For discussionof tropical diversity and species abundance distributions we thank G. Austin, J.Cadle, L. Emmons, S. Engen, C. Funk, R. Lande, E. Leigh, A. Magurran, R. May,E. Pianka and M. Wood. For critical comments on drafts of this manuscript wegratefully acknowledge R. Lande, C. Penz, E. Pianka, S. Ratner and two anonymousreviewers. Portions of this study were supported by a National Geographic Societygrant (no. 5792-96). DeVries thanks the MacArthur Foundation and the GuggenheimFoundation for broadly supporting his research. We dedicate this paper as an elegyto the memory of Bert Kay, and to the rapidly dwindling biodiversity of SucumbiosProvince, Ecuador.
REFERENCES
Ackery PR. 1984. Systematic and faunistic studies on butterflies. Symposium of the Royal EntomologicalSociety of London 11: 9–21.
Ackery PR, Vane-Wright RI. 1984. Milkweed butterflies: their cladistics and biology. London: BritishMuseum (Nat. Hist.), Entomology.
Allee WC. 1926. Measurement of environmental factors in the tropical rainforest of Panama. Ecology7: 273–302.
Anon. 1993. Rapid biodiversity assessment. Proceedings of the Biodiversity Assessment Workshop, MacquarieUniversity 1993. Sydney: Research Unit for Biodiversity and Bioresources, Macquarie University.
Basset Y, Aberlenc H, Delvare G. 1992. Abundance and stratification of foliage arthropods in alowland rain forest of Cameroon. Ecological Entomology 17: 310–318.
Bates M. 1944. Observations on the distribution of mosquitoes in a tropical forest. Ecology 25:159–170.
Beccaloni GW. 1997. Vertical stratification of ithomiine butterfly (Nymphalidae: Ithomiinae) mimicrycomplexes: the relationship between adult flight height and larval host-plant height. Biological Journalof the Linnean Society 62: 313–341.
Beccaloni GW, Gaston KJ. 1995. Predicting the species richness of neotropical forest butterflies:Ithomiinae (Lepidoptera: Nymphalidae) as indicators. Biological Conservation 71: 77–86.
Bowles IA, Rice RE, Mittermeir RA, daFonseca GAB. 1998. Logging and tropical forestconservation. Science 280: 1899–1900.
Brakefield PM, Reitsma F. 1991. Phenotypic plasticity, seasonal climate and population biologyfor Bicyclus butterflies (Satyridae) in Malawi. Ecological Entomology 16: 291–303.
SPECIES DIVERSITY IN ECUADORIAN RAINFOREST BUTTERFLIES 351
Brown KS Jr. 1991. Conservation of neotropical environments: insects as indicators. In: Collins NM,Thomas JA, eds. The conservation of insects and their habitats. London: Academic Press, 449–504.
Brown KS Jr, Hutchings RW. 1997. Disturbance, fragmentation, and the dynamics of diversity inAmazonian butterflies. In: Laurence WF, Bierregaard Jr, eds. Tropical forest remnants. Chicago:University of Chicago Press, 91–110.
Cannaday C. 1997. Loss of insectivorous birds along a gradient of human impact in Amazonia.Biological Conservation 77: 63–77.
Chao A. 1984. Non-parametric estimation of the number of classes in a population. ScandanavianJournal of Statistics 11: 265–270.
Colwell RK, Coddington JA. 1994. Estimating terrestrial biodiversity through extrapolation.Philosophical Transactions of the Royal Society of London B345: 101–118.
Cody ML, Diamond J, eds. 1975. Ecology and evolution of communities. Cambridge: Harvard UniversityPress.
Condit R, Hubbell SP, Lafrankie JV, Sukumar R, Manokaran N, Foster RB, Ashton PS.1996. Species-area and species-individual relationships for tropical trees: a comparison of three 50-ha plots. Journal of Ecology 84: 549–562.
Connell JH. 1978. Diversity in rain forests and coral reefs. Science 199: 1302–1310.Daily GC, Ehrlich PR. 1995. Preservation of biodiversity in small rainforest patches: rapid evaluations
using butterfly trapping. Biodiversity and Conservation 4: 35–55.De Jong R, Vane-Wright RI, Ackery PR. 1996. The higher classification of butterflies (Lepidoptera):
problems and prospects. Entomologica Scandanavica 27: 65–101.Denslow JS. 1987. Tropical rainforest gaps and tree species diversity. Annual Review of Ecology and
Systematics 18: 431–451.DeVries PJ. 1987. The Butterflies of Costa Rica and their Natural History. I: Papilionidae, Pieridae and
Nymphalidae. Princeton, NJ: Princeton University Press.DeVries PJ. 1988. Stratification of fruit-feeding nymphalid butterflies in a Costa Rican rainforest.
Journal of Research on the Lepidoptera 26: 98–108.DeVries PJ. 1997. The Butterflies of Costa Rica and their Natural History. II: Riodinidae. Princeton, NJ:
Princeton University Press.DeVries PJ, Murray D, Lande R. 1997. Species diversity in vertical, horizontal, and temporal
dimensions of a fruit-feeding butterfly community in an Ecuadorian rainforest. Biological Journal ofthe Linnean Society 62: 343–364.
DeVries PJ, Lande R, Murray D. 1999. Associations of co-mimetic ithomiine butterflies on smallspatial and temporal scales in a neotropical rainforest. Biological Journal of the Linnean Society 67:73–85.
Edwards PJ, May RM, Web NR, eds. 1994. Large scale ecology and conservation biology. London:Blackwell Scientific.
Ehrlich PR. 1958. The comparative morphology, phylogeny, and higher classification of the butterflies.University of Kansas Science Bulletin 39: 305–370.
Engen S. 1978. Stochastic abundance models with emphasis on biological communities and species. London:Chapman & Hall.
Erwin TL. 1995. Measuring arthropod biodiversity in the tropical forest canopy. In: Lowman MD,Nadkarni N, eds. Forest Canopies. San Diego: Academic Press, 109–127.
Fisher RA. 1958. The Genetical Theory of Natural Selection. 2nd edition. New York: Dover.Fisher RA, Corbet AS, Williams CB. 1943. The relation between the number of species and the
number of individuals in a random sample of an animal population. Journal of Animal Ecology 12:42–58.
Forey PL, Humphries CJ, Vane-Wright RI, eds. 1994. Systematics and Conservation Evaluation.Systematics Assoc. Special, Vol. 50. Oxford: Clarendon Press.
Gaston KJ. 1996. Biodiversity. Oxford: Blackwell Science.Gilbert LE. 1984. The biology of butterfly communities. Symposium of the Royal Entomological Society of
London 11: 41–54.Gill BD. 1991. Dung beetles in tropical American forests. In: Hanski I, Cambefort Y, eds. Dung beetle
ecology. Princeton, NJ: Princeton University Press, 211–229.Gotelli NJ, Graves GR. 1996. Null models in ecology. Washington, D.C.: Smithsonian Institution Press.Gray JS. 1987. Species-abundance patterns. In: Gee JHR, Giller PS, eds. Organization of communities
past and present. Oxford: Blackwell Scientific, 53–67.Gray JS, Mirza FB. 1979. A possible method for detecting pollution-induced disturbance on marine
benthic communities. Marine Pollution Bulletin 10: 142–146.Groombridge B, ed. 1992. Global biodiversity. London: Chapman & Hall.
P. J. DVRIES ET AL.352
Haldane JBS. 1932. The causes of evolution. London: Longmans, Green & Co.Hammond PM. 1994. Practical approaches to the estimation of the extent of biodiversity in speciose
groups. Philosophical Transactions of the Royal Society of London B345: 119–136.Hanski I, Cambefort Y. 1991. Spatial processes. In: Hanski I, Cambefort Y, eds. Dung beetle ecology.
Princeton, NJ: Princeton University Press, 283–304.Hayek LC, Buzas MA. 1996. Surveying natural populations. New York: Columbia University Press.Heck KL, van Belle G, Simberloff D. 1975. Explicit calculation of the rarefaction diversity
measurement and the determination of sufficient sample size. Ecology 56: 1459–1461.Heywood VH, ed. 1995. Global biodiversity assessment. Cambridge: Cambridge University Press.Hubbell SP, Foster RB. 1986. Commonness and rarity in a neotropical forest: implications for
tropical tree conservation. In: Soule ME, ed. Conservation biology. The science of scarcity and diversity.Sunderland: Mass.: Sinauer Associates, 205–231.
Hurlbert SH. 1971. The non-concept of species diversity: a critique and alternative parameters.Ecology 52: 577–586.
Huston M. 1979. A general hypothesis of species diversity. American Naturalist 113: 81–101.Huston MA. 1994. Biological diversity, the coexistence of species on changing landscapes. Cambridge: Cambridge
University Press.Kato M, Inoue T, Hamid AA, Nagamitsu T, Merdek MB, Nona AR, Itino T, Yamane S,
Yumoto T. 1995. Seasonality and vertical structure of light-attracted insect communities in adipterocarp forest in Sarawak. Researches on Population Ecology 37: 59–79.
Keister AR, Scott JM, Csuti B, Noss RF, Butterfield B, Sahr K, White D. 1996. Conservationprioritization using GAP data. Conservation Biology 10: 1332–1324.
Kremen C. 1992. Assessing the indicator properties of species assemblages for natural areas monitoring.Ecological Applications 2: 203–217.
Kremen C. 1994. Biological inventory using target taxa: a case study of butterflies of Madagascar.Ecological Applications 4: 407–422.
Lambshead PJD, Platt HM, Shaw KM. 1983. Detection of differences among assemblages ofbenthic species based on an assessment of dominance and diversity. Journal of Natural History, London17: 859–974.
Lande R. 1976. Natural selection and random genetic drift in phenotypic evolution. Evolution 30:314–334.
Lande R. 1996. Statistics and partitioning of species diversity, and similarity among multiplecommunities. Oikos 76: 5–13.
Laurence WF, Bierregaard RO, eds. 1997. Tropical forest remnants. Chicago: University of ChicagoPress.
Longino JT, Nadkarni N. 1990. A comparison of ground and canopy leaf litter ants (Hymenoptera:Formicidae) in a tropical montane forest. Psyche 97: 81–94.
Longino JT, Colwell RK. 1997. Biodiversity assessment using structured inventory: capturing theant fauna of a tropical rain forest. Ecological Applications 7: 1263–1277.
Lowman MD, Nadkarni N, eds. 1995. Forest canopies. San Diego, CA: Academic Press.MacArthur RH. 1972. Geographical ecology. Princeton, NJ: Princeton University Press.MacArthur RH, Recher H, Cody ML. 1966. On the relation between habitat-selection and species
diversity. American Naturalist 100: 319–325.Magurran AE. 1988. Ecological diversity and its measurement. Princeton, NJ: Princeton University Press.Malcolm JR. 1994. Edge effects in central Amazonian forest fragments. Ecology 75: 2438–2445.Mallet J, Gilbert LE. 1995. Why are there so many mimicry rings? Correlations between habitat,
behavior and mimicry in Heliconius butterflies. Biological Journal of the Linnean Society 55: 159–180.May RM. 1975. Patterns of species diversity and abundance. In: Cody ML, Diamond JM, eds. Ecology
and evolution of communities. Cambridge, MA: Harvard University Press, 81–120.May RM. 1981. Patterns in multi-species communities. In: May RM, ed. Theoretical ecology: principles
and applications. Oxford: Blackwell, 197–227.Morse DR, Stork NE, Lawton JH. 1988. Species number, species abundance and body length
relationships of arboreal beetles in Bornean lowland rain forest trees. Ecological Entomology 13: 25–37.Munn CA. 1985. Permanent canopy and understory flocks in Amazonian species composition and
population density. Ornithological Monographs 36: 683–712.Murcia C. 1995. Edge effects in fragmented forests: implications for conservation. Trends in Ecology &
Evolution 10: 58–62.Muirhead-Thomson RC. 1991. Trap responses of flying insects. London: Academic Press.Noss RF. 1990. Indicators for monitoring biodiversity: a hierarchical approach. Conservation Biology 4:
355–364.
SPECIES DIVERSITY IN ECUADORIAN RAINFOREST BUTTERFLIES 353
Novotny V, Basset Y. 1998. Seasonality of sap-sucking insects (Auchenorrhyncha, Hemiptera) feedingon Ficus (Moraceae) in a lowland rain forest in New Guinea. Oecologia 115: 514–522.
Olson D, Dinnerstein E, Castro G, Maravi E, eds. 1996. Identifying gaps in botanical informationfor biodiversity conservation in Latin America and the Caribbean. Washington, D.C.: WorldWildlife Fund.
Papageorgis CA. 1975. Mimicry in Neotropical butterflies. American Scientist 63: 522–532.Patrick R, Hohn M, Wallace J. 1954. A new method for determining the pattern of the diatom
flora. Noctulae Natura Academy of Natural Sciences, Philadelphia 259: 1–12.Pearson DL. 1977. A pantropical comparison of bird community structure on six lowland forest
sites. Condor 79: 232–244.Pearson DL. 1994. Selecting indicator taxa for the quantitative assessment of biodiversity. Philosophical
Transactions of the Royal Society of London B345: 75–79.Peet RK. 1974. The measurement of species diversity. Annual Review of Ecology and Systematics 5:
285–307.Pinheiro CEG, Ortiz JVC. 1992. Communities of fruit-feeding butterflies along a vegetation gradient
in central Brazil. Journal of Biogeography 19: 505–511.Pielou FC. 1975. Ecological diversity. New York: Wiley.Preston FW. 1948. The commonness and rarity of species. Ecology 29: 254–283.Preston FW. 1980. Noncannonical distribution of commonness and rarity. Ecology 61: 88–97.Richards PW. 1952. The tropical rain forest, an ecological study. Cambridge: Cambridge University Press.Rice WR. 1989. Analyzing tables of statistical tests. Evolution 43: 223–225.Ricklefs R, Schluter D, eds. 1993. Species diversity in ecological communities. Chicago: University of
Chicago Press.Robbins RK, Lamas G, Mielke OH, Harvey DJ, Casagrande MM. 1996. Taxonomic com-
position and ecological structure of the species-rich butterfly community at Pakitza, Parque Nacionaldel Manu, Peru. In: Wilson DE, Sandoval A, eds. La Biodiversidad del Sureste del Peru. Lima, Peru:Editorial Horizonte, 201–236.
Roberts L. 1991. Ranking the rain forests. Science 251: 1559–1560.Rosenberg KV. 1990. Dead-leaf foraging specialization in tropical forest birds: measuring resource
availability and use. In: Morrison ML, Ralph CJ, Jehl JR Jr, eds. Avian foraging: theory, methodology,and applications. Studies in Avian Biology 13: 360–368.
Rosenzweig ML. 1995. Species Diversity in Space and Time. Cambridge: Cambridge University Press.Ryti RT. 1992. Effect of the focal taxon on the selection of nature reserves. Ecological Application 2:
404–410.Sanders HL. 1968. Marine benthic diversity: a comparative study. American Naturalist 102: 243–282.Seber GAF. 1982. The estimation of animal abundance and related parameters. 2nd ed. London: Charles
Griffin.Snow DW. 1976. The web of adaptation: bird studies in the American tropics. New York: Quadrangle.Southwood TRE, Brown VK, Reader PM. 1979. The relationship of plant and insect diversities
in succession. Biological Journal of the Linnean Society 12: 327–348.Stork NE. 1988. Insect diversity: facts, fiction and speculation. Biological Journal of the Linnean Society
35: 321–337.Sutton SL, Hudson PJ. 1980. The vertical distribution of small flying insects in the lowland rainforest
of Zaire. Zoological Journal of the Linnean Society 68: 111–123.Terborgh J, Robinson SK, Parker TA, Munn CA, Pierpont N. 1990. Structure and organization
of an Amazonian forest bird community. Ecological Monographs 60: 213–238.Tokeshi M. 1993. Species abundance patterns and community structure. Advances in Ecological Research
24: 111–186.Turner JRG, Mallet JB. 1996. Did forest islands drive the diversity of warningly coloured butterflies?
Biotic drift and the shifting balance. Philosophical Transactions of the Royal Society B351: 835–845.Ugland KI, Gray JS. 1982. Lognormal distributions and the concept of community equilibrium.
Oikos 39: 171–178.Williams CB. 1964. Patterns in the balance of nature and related problems in quantitative ecology. London:
Academic Press.Wilson DE, Sandoval A, eds. 1996. La Biodiversidad del Sureste del Peru. Lima, Peru: Editorial
Horizonte.Wolda H. 1978. Fluctuations in abundance of tropical insects. American Naturalist 112: 1017–1045.Wolda H. 1992. Trends in abundance of tropical forest insects. Oecologia 89: 47–52.Wolfram S. 1996. Mathematica 3.0. Wolfram Industries.Wright S. 1931. Evolution in Mendelian populations. Genetics 16: 97–159.