Embed Size (px)
Citation preview

TITLE PAGE
Species Boundaries in Scleractinian Corals:
A Case Study of the Acropora humilis Species Group
Thesis submitted by
Jacqueline Kerri Wolstenholme (B. Sc. Hons)
in September 2003
for the degree of Doctor of Philosophy
in Marine Biology
within the School of Marine Biology and Aquaculture
James Cook University

STATEMENT OF ACCESS
I, the undersigned, the author of this thesis, understand that James Cook University will
make it available for use within the University Library and, by microfilm or other
means, allow access to users in other approved libraries. All users consulting this thesis
will have to sign the following statement:
In consulting this thesis I agree not to copy or closely paraphrase it in whole or in part
without the written consent of the author; and to make proper public written
acknowledgement for any assistance which I have obtained from it.
Beyond this, I do not wish to place any restriction on access to this thesis.
(Name) (Date)
ii

STATEMENT ON SOURCES
DECLARATION
I declare that this thesis is my own work and has not been submitted in any form for
another degree or diploma at any university or other institution of tertiary education.
Information derived from the published or unpublished work of others has been
acknowledged in the text and a list of references is given.
(Name) (Date)
iii

PUBLICATIONS
Publications resulting from this thesis: Chapter 2 Wolstenholme JK, Wallace CC, Chen CAC (2003) Species boundaries within the
Acropora humilis species group (Cnidaria; Scleractinia): a morphological and molecular interpretation of evolution. Coral Reefs 22: 155-166
Chapter 3 Wolstenholme JK (2003) Temporal reproductive isolation and gametic compatibility
are evolutionary mechanisms in the Acropora humilis species group (Cnidaria; Scleractinia). Marine Biology (In Press)
Chapters 4 and 5 Wolstenholme JK, Wallace CC, Chen CA (in prep) Recognition of intraspecific and
interspecific variation contributes to the interpretation of evolutionary boundaries within a scleractinian coral species complex. Proceedings of the Royal Society of London - Series B: Biological Sciences
Wolstenholme JK, Wallace CC (in prep) A taxonomic revision of the Acropora
humilis species group, following the combined examination of morphological, molecular and reproductive criteria. Biological Journal of the Linnean Society
Additional publications produced during my PhD candidature: Baird AH, Marshall PA, Wolstenholme J (2002) Latitudinal variation in the
reproduction of Acropora in the Coral Sea. Proc 9th International Coral Reef Symposium 1: 395-389
Chen CA, Wallace CC, Wolstenholme J (2002) Analysis of the mitochondrial 12S
rRNA gene supports a two-clade hypothesis of the evolutionary history of scleractinian corals. Molecular Phylogenetics and Evolution 23: 137-149
Wallace CC, Paulay G, Hoeksema BW, Bellwood DR, Hutchings PA, Barber PH,
Erdmann M, Wolstenholme J (2002) Nature and origins of unique high diversity reef faunas in the Bay of Tomini, Central Sulawesi: The ultimate "centre of diversity"? Proc 9th International Coral Reef Symposium 1: 185-192
iv

ACKNOWLEDGMENTS I thank my supervisors Terry Hughes, Carden Wallace and Allen Chen for their advice and sharing their expertise. I also thank Terry for giving me the opportunity to collect samples in Papua New Guinea, the Solomon Islands, American Samoa and French Polynesia; Carden for introducing me to corals, in particular Acropora, and the opportunity to participate in the Tethyana expedition in Indonesia; and Allen for teaching me molecular laboratory techniques and for the opportunity to work in his laboratory at Academia Sinica, Taiwan. I am grateful to the funding bodies that provided financial support for my project. These are the Australian Museum (Lizard Island Doctoral Fellowship), Australian Coral Reef Society (Terry Walker Fellowship and international conference travel grant), Great Barrier Reef Marine Park Authority (augmentative grant), James Cook University Marine Biology & Aquaculture Department (Monkman Fellowship, Doctoral Merit Research Scheme and Doctoral Research Scheme), James Cook University (completion scholarship) and the Australian Research Council (ARC funded stipend). I thank Barbara Kojis for sharing her observations of the timing of spawning at Lizard Island. Barbara’s observations provided a foundation on which part of this project was based. I also thank Tim Hancock, Danny Coomans, Morgan Pratchett and Mike Steele for statistical advice. Thanks also to friends and colleagues: Lynne van Herwerden, Faye Christidis, David Blair, Kirsten Michalek-Wagner, Sandra Romano, Michelle Waycott, Howard Lasker, Andrew Baird, Selma Klanten, Julian Caley, Phil Munday and Paul Detwiler for valuable discussions and advice. I thank the staff of the Lizard Island Research Station, Anne Hoggett, Lyle Vail, Marianne and Lance Pearce for their support. The station’s excellent facilities contributed to the success of my project. I also thank Kirsten Michalek-Wagner, Sandra Romano, Paul Detwiler, Molly Lalor, Xavier Pochon, Ken Martin, Jonas Stenstrom, Margie Brown, Tsai Sin, Marie Kospartov, Dean Richards, Jason Mackenzie, Karen Tutt and Zoe Richards for their assistance on coral spawning field trips at Lizard Island; and Liz Dinsdale, Mary-Jo Boyle, Allen Chen and Nuwei Vivian Wei for field assistance in other countries. I thank my friends in Taiwan Yu-hua Huang, Chuan-Wen Ho, Yuh-wen Chiu, Ya-wen Yang, Nu-wei Vivian Wei, Ming-Duon Lin, Chi-Chin Shih, Po-Fen Lin, Kuei-Ping Lin, Kuan-Yu Chen, Jinin Lin, Ching Zeng, Vanson Liu, Leon Liu and many other friends for the fun times, giving me such a valuable insight into how scientific research is done in a culture so foreign to my own and teaching me molecular laboratory techniques. I also thank my friends and office-mates in Australia, particularly Morgan Pratchett, Maria João Rodrigues, Marie Kospartov, Sula Blake, Josh Madin, Abbi McDonald and Ailsa Kerswell for fun times, advice, support and assistance. I also thank the support staff of Biological Sciences, in particular Jan Nugent for assistance and advice with my travel arrangements, and Gordon Bailey, Vince Pullela and Ainsley Calladine for computer support. I say a special thank you to Ken Martin for his unfailing help and support throughout the project.
v

ABSTRACT
Accurate identification of species is critical for studies of biological systems, including
biodiversity analyses, understanding evolutionary processes and ecological dynamics,
and for effective conservation and management of the environment. However, defining
species boundaries in scleractinian corals is impeded by the difficulties of
distinguishing between ecological and evolutionary influences on the appearance of
colony morphology. In this study, I used three criteria, i.e. reproductive, morphometric
and molecular evidence to determine the extent to which intraspecific and interspecific
morphological variation is indicative of evolutionary relationships in species of the
Acropora humilis species group. Reproductive criteria, including relative timing of
spawning and potential to interbreed in fertilization experiments, provided the greatest
level of taxonomic resolution. Discriminant analysis of morphometric data provided a
moderate level of resolution. Molecular phylogenetic analysis of two markers, the 28S
rDNA unit (domains 1 and 2) and the mtDNA intergenic region, provided the lowest
level of resolution of the three criteria.
Twenty-one morphs were recognized in field surveys, conducted in seven regions in the
western and central Pacific, and these were used as sampling units throughout this
study. The morphs were defined using morphological characters that are traditionally
used to identify species of the genus Acropora and included the eight currently
recognized species of the A. humilis group, seven intermediate morphs and six sub-
morphs. The intermediate morphs were characterized by intermediate morphologies
that prevented colonies from being confidently assigned to a single species, and the
sub-morphs formed recognizable units within the range of morphological variation of
one species. Differentiation between species and morphs greatly enhanced the
interpretation of evolutionary relationships in this species group, with consistent
patterns being found throughout the geographic scale of this project. Colonies
identified as A. humilis, A. samoensis, A. gemmifera, A. monticulosa and A. digitifera
were shown to be valid species on the basis of reproductive data. Although these
species showed no potential to interbreed, it is possible that indirect introgression,
through interbreeding between some members of these species and morphs may be
retarding divergence of these species. Reproductive data were not obtained for A.
globiceps, A. retusa and A. multiacuta. The taxonomic status of A. globiceps is
vi

therefore unresolved, due to its lack of morphological and genetic differentiation from
A. humilis. Acropora retusa and A. multiacuta appear to be valid species, on the basis
of morphological and molecular differentiation. Acropora humilis, A. samoensis, A.
globiceps and morphs of these species share the greatest evolutionary affinity, on the
basis of morphological overlap and lack of genetic differentiation. The most closely
related to these three species appears to be A. gemmifera, with this species and morphs
common to these four species also being genetically undifferentiated. Acropora
digitifera was morphologically and genetically distinct from all other species of the A.
humilis group, although an intermediate morph between this species and A. gemmifera
was genetically undifferentiated but reproductively isolated from A. digitifera. On the
basis of morphological affinity, this morph is proposed as a possible hybrid between
these species. Acropora monticulosa was morphologically distinct from all other
species, although it appears to share evolutionary connections on two fronts. Firstly,
low levels of genetic differentiation for the mitochondrial marker, between this species
and A. humilis, A. samoensis, A. globiceps and A. gemmifera, suggest recent divergence
from these species. Secondly, A. monticulosa also appears to share evolutionary
affinities with A. digitifera on the basis of morphological similarities between morphs
of each of these species, with one of these morphs grouping with A. monticulosa for the
28S marker and with A. digitifera for the mitochondrial marker.
This study demonstrates that examining intraspecific and interspecific patterns of
polymorphism are valuable for interpreting evolutionary relationships in corals.
Evidence derived from these criteria suggest that the morphs are at various stages of
divergence from the species with which they share morphological characters and that
the morphs may indicate possible zones of speciation and hybridization. Recognition of
morphs also avoided the possibility of taxonomic error as a result of ‘forcing’ colonies
into incorrect or inappropriate species categories and was therefore essential for
accurate interpretation of evolutionary boundaries. Using multiple criteria and samples
collected across a broad biogeographic scale facilitated the clarification of relationships
within and between species.
vii

TABLE OF CONTENTS Title Page...................................................................................................................................... i Statement of Access ....................................................................................................................ii Statement on Sources ................................................................................................................iii Publications ................................................................................................................................ iv Acknowledgments.......................................................................................................................v Abstract ......................................................................................................................................vi Table of Contents.....................................................................................................................viii List of Tables..............................................................................................................................xi List of Figures ..........................................................................................................................xiii CHAPTER 1: General Introduction.........................................................................................1 1.1 Species Boundaries in Scleractinian Corals .......................................................................1 1.2 Species concepts in scleractinian corals..............................................................................4 1.3 The Acropora humilis Species Group..................................................................................4 1.4 Thesis Outline .......................................................................................................................8 CHAPTER 2: Species Boundaries within the Acropora humilis Species Group (Cnidaria;
Scleractinia): a Morphological and Molecular Interpretation of Evolution .......................11 2.1 Abstract ...............................................................................................................................11 2.2 Introduction ........................................................................................................................11 2.3 Methods ...............................................................................................................................14
2.3.1 Sampling............................................................................................................14
2.3.2 Morphological Analyses ...................................................................................15
2.3.2.1 Morphometric Characters...........................................................................15
2.3.2.2 Descriptive Characters ...............................................................................16
2.3.3 Molecular Analysis .......................................................................................19
2.4 Results..................................................................................................................................20
2.4.1 Morphological Analyses ...................................................................................20
2.4.1.1 Morphometric Characters...........................................................................23
2.4.1.2 Descriptive Characters ...............................................................................25
2.4.2 Molecular Analysis ...........................................................................................25
2.5 Discussion ............................................................................................................................28
2.5.1 Synthesis of Morphological and Molecular Findings .......................................28
2.5.1.1 Divergence Between Clades.......................................................................29
2.5.1.2 Divergence Within Clades .........................................................................29
2.5.2 Evolutionary Implications .................................................................................31
viii

Chapter 3: Temporal reproductive isolation and gametic compatibility are evolutionary
mechanisms in the Acropora humilis species group (Cnidaria; Scleractinia) .....................34 3.1 Abstract ...............................................................................................................................34 3.2 Introduction ........................................................................................................................35 3.3 Methods ...............................................................................................................................38
3.3.1 Species and Morphs ..........................................................................................38
3.3.2 Relative Abundance ..........................................................................................38
3.3.3 Molecular Techniques and Analysis .................................................................39
3.3.4 Breeding Potential .............................................................................................41
3.3.4.1 Timing of Gamete Maturity .......................................................................41
3.3.4.2 Spawning and Fertilization Trials ..............................................................42
3.4 Results..................................................................................................................................43
3.4.1 Species and Morphs ..........................................................................................43
3.4.2 Relative Abundance ..........................................................................................43
3.4.3 Molecular Phylogenetic Analysis......................................................................47
3.4.4 Breeding Potential .............................................................................................51
3.4.4.1 Timing of Gamete Maturity .......................................................................51
3.4.4.2 Spawning and Fertilization Trials ..............................................................54
3.5 Discussion ............................................................................................................................57
3.5.1 Evolutionary relationships within the Acropora humilis species group ...........57
3.5.2 Taxonomic Implications....................................................................................63
CHAPTER 4: Morphological Variation and Biogeography of Species and Morphs of the
Acropora humilis Species Group .............................................................................................67 4.1 Introduction ........................................................................................................................67 4.2 Methods ...............................................................................................................................70
4.2.1 Collection of Samples .......................................................................................70
4.2.2 Morphometric Analysis.....................................................................................71
4.2.3 Indo-Pacific Morphological Variation and Distribution ...................................74
4.3 Results..................................................................................................................................74
4.3.1 Species and Morphs ..........................................................................................74
4.3.2 Morphological Variation between Species and Morphs ...................................80
4.3.3 Morphometric Analysis.....................................................................................84
4.3.3.1 Defining Species Categories ......................................................................84
4.3.3.1.1 Regional Morphological Variation within Species .............................88
4.3.3.2 Classification of Morphs within Species Categories..................................88
ix

4.3.4 Distribution of Species and Morphs..................................................................91
4.4 Discussion ............................................................................................................................92
4.4.1 Morphological Comparison of Species and Morphs.........................................92
4.4.2 Morphological Variation Contributes to the Interpretation of Evolutionary
Relationships ..............................................................................................................99
4.4.3 Biogeography of Species and Morphs of the Acropora humilis Species Group
..................................................................................................................................102
4.4.4 Conclusions .....................................................................................................104
CHAPTER 5: Phylogeny of Species and Morphs of the Acropora humilis Species Group
Based on a Mitochondrial Molecular Marker .....................................................................105 5.1 Introduction ......................................................................................................................105 5.2 Methods .............................................................................................................................109
5.2.1 Collection of molecular samples .....................................................................109
5.2.2 Molecular techniques and analysis..................................................................110
5.2.2.1 Comparison with GenBank Sequences ....................................................113
5.2.2.2 Comparison of Molecular and Morphological Phylogenies ....................113
5.3 Results................................................................................................................................114
5.3.1 Phylogenetic Analysis .....................................................................................114
5.3.1.1 Comparison with GenBank Sequences ........................................................116
5.3.1.2 Comparison of Molecular and Morphological Phylogenies ....................116
5.3.2 Variability of Sequence Repeats in the mtDNA Intergenic Region................119
5.4 Discussion ..........................................................................................................................122
5.4.1 Phylogeny of the Acropora humilis species group..........................................122
5.4.1.1 Comparison with GenBank Sequences ....................................................124
5.4.1.2 Comparison of Molecular and Morphological Phylogenies ....................124
5.4.2 Variability of Sequence Repeats in the mtDNA Intergenic Region................126
5.4.2.1 Comparison with other Acropora species ................................................126
5.4.3 Incomplete Lineage Sorting and Introgression ...............................................127
5.4.4 Speciation in the genus Acropora ...................................................................128
CHAPTER 6: General Discussion.........................................................................................132 6.1 Evolutionary relationships in the Acropora humilis species group ..............................132 6.2 Conclusions .......................................................................................................................137 References Cited .....................................................................................................................140
Appendices...................................................................................................................150
x

LIST OF TABLES
Table 2.1 Morphometric characters measured in this study…………………….…….16
Table 2.2 Descriptive morphological characters used in this study……………...……18
Table 2.3 Descriptions of morphs recognized from the Acropora humilis species group
in American Samoa in this study……………….……………………….………….….24
Table 3.1 Primary characters used to identify species and morphs in the A. humilis
species group…………………..……………………..………...........……………..44-45
Table 3.2 Number of sequences obtained from individuals of each species and morph
of the Acropora humilis species group in the molecular analysis………………....…..49
Table 3.3 Mean base compositions (%) for species and morphs of the Acropora humilis
species group and Acropora austera……………………......................................……50
Table 3.4 Average Kimura 2-parameter pairwise sequence distances (%) within and
between species and morphs of the Acropora humilis species group and Acropora
austera…………………..……………………...........................……………………...50
Table 3.5 Observations of spawning in laboratory aquaria for species and morphs of
the Acropora humilis species group recorded during three spawning seasons.……….52
Table 4.1 Regions and locations where corals were sampled……………………..…..70
Table 4.2 Habitats and locations in which species were recorded……..……….…72-73
Table 4.3 Species and morphs in the Acropora humilis species group and characters
used to identify them…………………………………………………………….…75-77
Table 4.4 Post-hoc classification rates (%) for colonies of each species of the Acropora
humilis species group into the species categories predicted by the discriminant
analysis...........................................................................................................................87
Table 4.5 Classification probability (%) for colonies of each intermediate and sub-
morph into the species categories defined in the discriminant analysis…..………..90-91
Table 5.1 Number of colonies sequenced and number of cloned sequences of the
mtDNA intergenic region obtained from each species and morph of the Acropora
humilis species group and A. austera………………………..………………..…111-112
Table 5.2 Mean base compositions (%) for sequences obtained in this study from the
mtDNA intergenic region for species and morphs of the Acropora humilis species
group and Acropora austera…………………..………………..………………..…..118
Table 5.3 Average Kimura 2-parameter pairwise distances (%) within and between
sequences obtained in this study from the mtDNA intergenic region for species and
morphs of the Acropora humilis species group and Acropora austera………....……118
xi

Table 6.1 Summary of inferred affinities of the species and morphs of the Acropora
humilis species group for each of the criteria examined in this study…………..133-134
Table 6.2 Summary of inferred affinities of each morph, of the Acropora humilis
species group based on the combined evidence for each of the criteria examined in this
study………………………..………………..………………..………………..……135
Appendix I Morphometric measurements (submitted as electronic supplementary
material to the journal Coral Reefs, with the publication of Chapter 2)…….………..150
Appendix II Descriptive morphological characters (submitted as electronic
supplementary material to the journal Coral Reefs, with the publication of Chapter
2)...................................................................................................................................151
xii
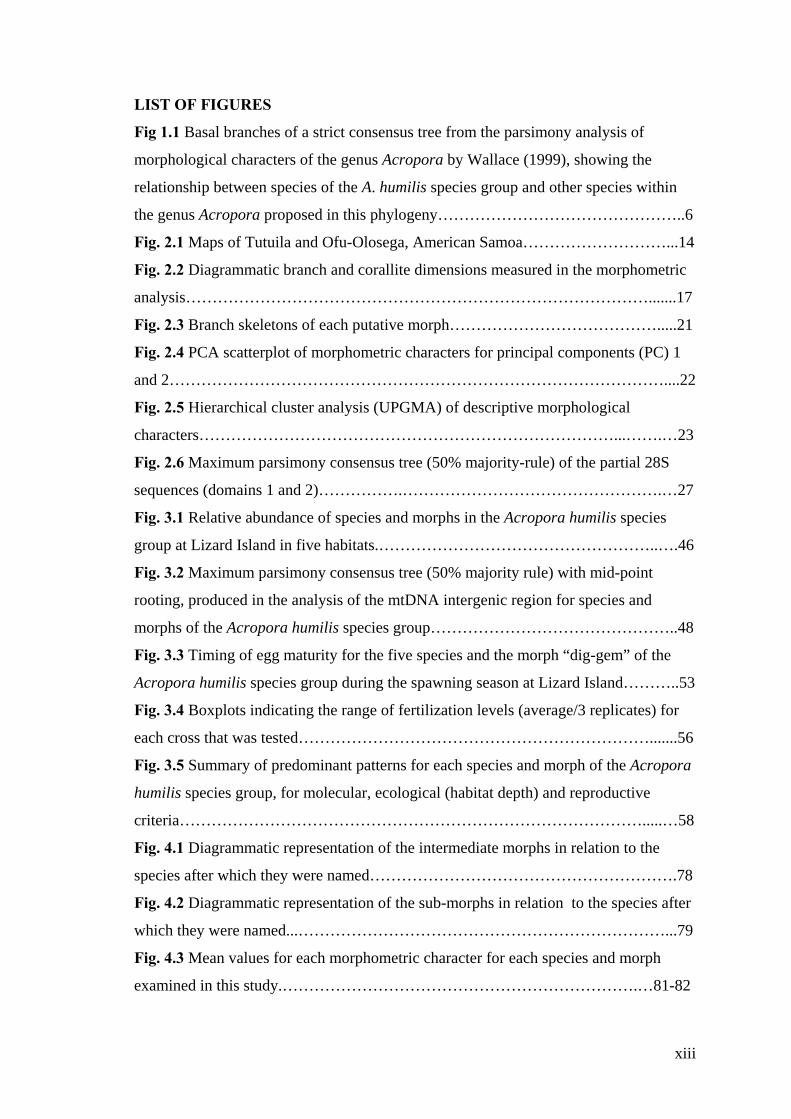
LIST OF FIGURES
Fig 1.1 Basal branches of a strict consensus tree from the parsimony analysis of
morphological characters of the genus Acropora by Wallace (1999), showing the
relationship between species of the A. humilis species group and other species within
the genus Acropora proposed in this phylogeny………………………………………..6
Fig. 2.1 Maps of Tutuila and Ofu-Olosega, American Samoa………………………...14
Fig. 2.2 Diagrammatic branch and corallite dimensions measured in the morphometric
analysis…………………………………………………………………………….......17
Fig. 2.3 Branch skeletons of each putative morph………………………………….....21
Fig. 2.4 PCA scatterplot of morphometric characters for principal components (PC) 1
and 2…………………………………………………………………………………....22
Fig. 2.5 Hierarchical cluster analysis (UPGMA) of descriptive morphological
characters……………………………………………………………………...…….…23
Fig. 2.6 Maximum parsimony consensus tree (50% majority-rule) of the partial 28S
sequences (domains 1 and 2)…………….………………………………………….…27
Fig. 3.1 Relative abundance of species and morphs in the Acropora humilis species
group at Lizard Island in five habitats.……………………………………………..….46
Fig. 3.2 Maximum parsimony consensus tree (50% majority rule) with mid-point
rooting, produced in the analysis of the mtDNA intergenic region for species and
morphs of the Acropora humilis species group………………………………………..48
Fig. 3.3 Timing of egg maturity for the five species and the morph “dig-gem” of the
Acropora humilis species group during the spawning season at Lizard Island………..53
Fig. 3.4 Boxplots indicating the range of fertilization levels (average/3 replicates) for
each cross that was tested………………………………………………………….......56
Fig. 3.5 Summary of predominant patterns for each species and morph of the Acropora
humilis species group, for molecular, ecological (habitat depth) and reproductive
criteria…………………………………………………………………………….....…58
Fig. 4.1 Diagrammatic representation of the intermediate morphs in relation to the
species after which they were named………………………………………………….78
Fig. 4.2 Diagrammatic representation of the sub-morphs in relation to the species after
which they were named...……………………………………………………………...79
Fig. 4.3 Mean values for each morphometric character for each species and morph
examined in this study.………………………………………………………….…81-82
xiii

Fig. 4.4 Scatterplot and vector plot of the first two discriminant functions for the
discriminant analysis of the species A. samoensis, A. humilis, A. globiceps, A.
gemmifera, A. monticulosa and A. digitifera…..…………………………………........85
Fig. 4.5 Distribution of species of the Acropora humilis species group, based on
records from this study and specimens in the collections at the Museum of Tropical
Queensland…………………………………………………………...………………..93
Fig. 4.6 Distribution of intermediate morphs of the Acropora humilis species group,
based on records from this study and specimens in the collections at the Museum of
Tropical Queensland………………………………………...……………………........94
Fig. 4.7 Distribution of sub-morphs of the Acropora humilis species group, based on
records from this study and specimens in the collections at the Museum of Tropical
Queensland………………………………...…………………………………..………95
Fig. 5.1 Maximum parsimony consensus tree (50% majority rule) with mid-point
rooting, produced in the analysis of the mtDNA intergenic region for species and
morphs of the Acropora humilis species group and species of the DND clade….......115
Fig. 5.2 Comparison of the morphological tree of Wallace (1999) and the molecular
tree of the mtDNA intergenic region for the species of the Acropora humilis species
group, A. austera and species of the DND clade…………………………………......117
Fig. 5.3 Alignment of cloned sequences of the mtDNA intergenic region, showing
examples of the six sequence types (Types I - VI) found in this study…………........120
xiv

CHAPTER 1: GENERAL INTRODUCTION
1.1 SPECIES BOUNDARIES IN SCLERACTINIAN CORALS
Species are the basic units of measurement of biodiversity. Accurate definition of
species is therefore critical for describing patterns of biodiversity, understanding
evolutionary processes and ecological dynamics, and effective conservation and
management of the environment. Yet, despite the importance of species in studies of
biological systems, the formation of species represent one of the most elusive subjects
in evolutionary biology (Palumbi 1994). Species boundaries form the interface at which
groups of individuals diverge to form separate evolutionary lineages (Avise and Ball
1990; Brower et al. 1996; Avise and Wollenberg 1997). This process of divergence is
ongoing, on an evolutionary time scale. Consequently, depending on time since
divergence, boundaries between species may be difficult to define, due to different rates
of divergence of the criteria used to delineate them (Avise and Ball 1990; Brower et al.
1996; Avise and Wollenberg 1997). It is also possible that species boundaries may only
be partially formed, with gene flow still occurring between some individuals or in some
locations, further complicating the delineation of boundaries between species (Wu
2001).
Defining species boundaries is particularly complex in scleractinian corals (Lang 1984;
Knowlton 2001; Frank and Mokady 2002). Species of corals are traditionally defined
using morphological characters (e.g. Wells 1956; Veron and Wallace 1984; Wallace
1999), with morphological discontinuities used to determine the boundaries between
them (Lang 1984; Wallace and Willis 1994). However, this is problematical because of
the high levels of morphological polymorphism within species, as they are currently
defined (Lang 1984; Wallace and Willis 1994; Veron 1995). Intraspecific
morphological variation is common, and in some cases, there appear to be discrete
morphs within currently defined species, particularly for studies within a small
geographic area (Veron and Pichon 1976). Morphological discontinuities between
species are often blurred by the existence of individuals that share morphological
characters (Lang 1984). It is also possible that cryptic species, which are evolutionarily
but not morphologically distinct, are concealed within this morphological variability
(Knowlton and Jackson 1994; Knowlton 2000; Stobart and Benzie 1994). This
phenotypic variability raises the issue of the extent to which morphological boundaries
1
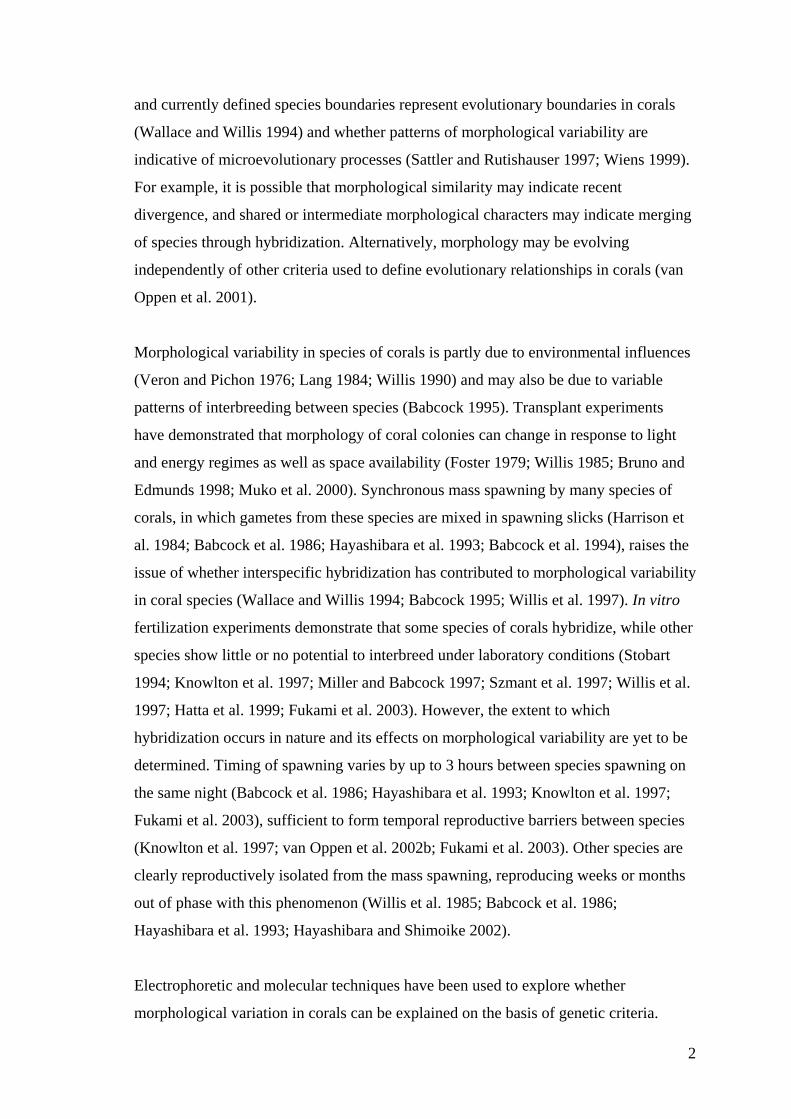
and currently defined species boundaries represent evolutionary boundaries in corals
(Wallace and Willis 1994) and whether patterns of morphological variability are
indicative of microevolutionary processes (Sattler and Rutishauser 1997; Wiens 1999).
For example, it is possible that morphological similarity may indicate recent
divergence, and shared or intermediate morphological characters may indicate merging
of species through hybridization. Alternatively, morphology may be evolving
independently of other criteria used to define evolutionary relationships in corals (van
Oppen et al. 2001).
Morphological variability in species of corals is partly due to environmental influences
(Veron and Pichon 1976; Lang 1984; Willis 1990) and may also be due to variable
patterns of interbreeding between species (Babcock 1995). Transplant experiments
have demonstrated that morphology of coral colonies can change in response to light
and energy regimes as well as space availability (Foster 1979; Willis 1985; Bruno and
Edmunds 1998; Muko et al. 2000). Synchronous mass spawning by many species of
corals, in which gametes from these species are mixed in spawning slicks (Harrison et
al. 1984; Babcock et al. 1986; Hayashibara et al. 1993; Babcock et al. 1994), raises the
issue of whether interspecific hybridization has contributed to morphological variability
in coral species (Wallace and Willis 1994; Babcock 1995; Willis et al. 1997). In vitro
fertilization experiments demonstrate that some species of corals hybridize, while other
species show little or no potential to interbreed under laboratory conditions (Stobart
1994; Knowlton et al. 1997; Miller and Babcock 1997; Szmant et al. 1997; Willis et al.
1997; Hatta et al. 1999; Fukami et al. 2003). However, the extent to which
hybridization occurs in nature and its effects on morphological variability are yet to be
determined. Timing of spawning varies by up to 3 hours between species spawning on
the same night (Babcock et al. 1986; Hayashibara et al. 1993; Knowlton et al. 1997;
Fukami et al. 2003), sufficient to form temporal reproductive barriers between species
(Knowlton et al. 1997; van Oppen et al. 2002b; Fukami et al. 2003). Other species are
clearly reproductively isolated from the mass spawning, reproducing weeks or months
out of phase with this phenomenon (Willis et al. 1985; Babcock et al. 1986;
Hayashibara et al. 1993; Hayashibara and Shimoike 2002).
Electrophoretic and molecular techniques have been used to explore whether
morphological variation in corals can be explained on the basis of genetic criteria.
2

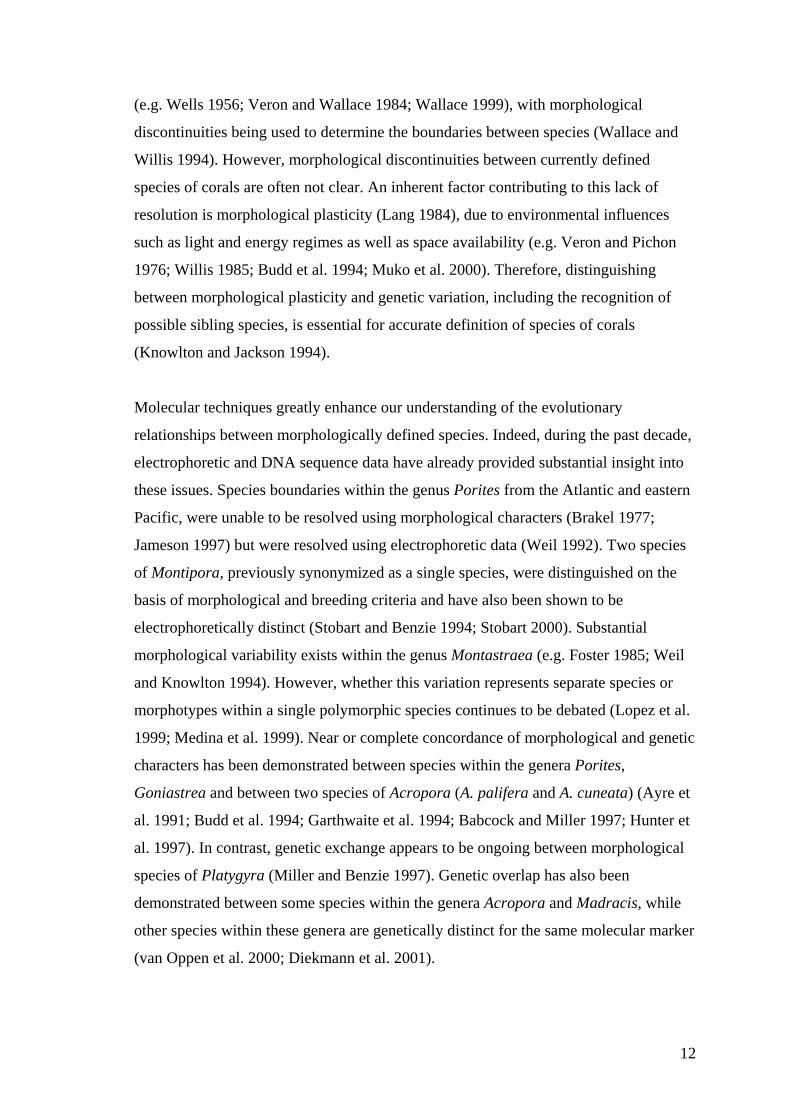
Several studies demonstrate near or complete concordance between morphological and
genetic boundaries, providing support for the validity of the species examined (Ayre et
al. 1991; Weil 1992; Garthwaite et al. 1994; Stobart and Benzie 1994; Márquez et al.
2002a; Márquez et al. 2002b; Maté 2003). In other studies, incomplete genetic
divergence between species may be due to hybridization or incomplete lineage sorting.
Most authors to date have favoured introgression through continued interbreeding or
hybridization as the likely mechanism preventing or retarding divergence (Miller and
Benzie 1997; Odorico and Miller 1997b; Hatta et al. 1999; Medina et al. 1999;
Diekmann et al. 2001; van Oppen et al. 2001; van Oppen et al. 2002b). However, it is
also argued that the contribution of hybridization has been overestimated and that
incomplete lineage sorting, due partly to the slow rate of evolution of some molecular
markers, is also a major reason for the lack of genetic distinction between many species
of corals (Knowlton 2001; Vollmer and Palumbi 2002).
Species boundaries in corals have typically been examined on a restricted spatial scale,
often limited to a single location. However, examination of morphological, genetic and
reproductive criteria within and between species on a broad biogeographic scale is
necessary to gain a greater understanding of the evolutionary relationships between
species. Taxonomic assemblages vary in different locations, due to the variable
geographic ranges of species (Wallace 1999; Veron 2000). Patterns in timing of
spawning and other spawning characters also vary in different locations, as well as in
different years in the same location, in response to varying environmental or physical
factors (Baird et al. 2002). It is therefore likely that patterns of evolutionary divergence
and potential for hybridization will vary between locations on a biogeographic scale.
For example, the inconsistent hybridization and the variable occurrence of intermediate
colonies reported for the Montastraea annularis species complex in different locations
(Knowlton et al. 1997; Szmant et al. 1997), may indicate that the formation of
evolutionary boundaries within this species complex are at different stages in different
locations within the Caribbean. Studies of species boundaries in scleractinian corals
must therefore be at a broad biogeographic scale, using multiple criteria, to determine
whether local varieties are in fact distinct evolutionary units and to enable the
evolutionary limits of species with broad distributions to be accurately defined.
3

1.2 SPECIES CONCEPTS IN SCLERACTINIAN CORALS
The definition of species remains one of the most controversial issues in biology.
Ongoing debates continue to evaluate the merits and limitations of different species
concepts for resolving the most appropriate framework to define evolutionary
relationships between taxonomic groups, particularly at the level of species (e.g.
Claridge et al. 1997; Wilson 1999). Three of the most influential species concepts are
(1) the morphological species concept in which phenotypic discontinuities are assumed
to indicate evolutionary boundaries; (2) the biological species concept in which ability
to interbreed is assumed to provide the cohesive mechanism within a species and
evolutionary separation from other species; and (3) the phylogenetic species concept in
which groups species as the smallest biological entities that are monophyletic.
Controversy stems from the fact that the most appropriate criteria for defining species
appear to vary for different taxonomic groups. Factors influencing these criteria include
mode of reproduction and likelihood of gamete mixing within and between species,
geographic distribution and connectivity between populations and therefore potential of
individuals to interbreed, and usefulness of phylogenetic characters for defining
evolutionary lineages. The authors of many reviews also argue that a single concept is
inadequate for defining species because of the enormous diversity of patterns of
evolution (e.g. Dupré 1999).
In corals, the inconsistent alignment of morphological, reproductive and genetic
boundaries between morphologically defined species, questions the applicability of the
morphological species concept as the most appropriate basis for defining species of
scleractinian corals (Willis 1990) and raises the issue of whether alternative or multiple
species concepts may provide a more appropriate framework. Developing a more
comprehensive understanding of species boundaries in corals and interpreting how
currently defined species correspond with evolutionary groups of individuals, will
contribute substantially to determining the most appropriate theoretical framework for
defining species in scleractinian corals.
1.3 THE ACROPORA HUMILIS SPECIES GROUP
The genus Acropora is the largest genus of scleractinian corals. The review by Wallace
(1999) describes 114 species while Veron (2000) describes 170 species within the
genus Acropora. Veron and Wallace (1984) and Wallace (1999) use species groups to
4

subdivide this large genus for convenience of identification, stating that they do not
imply taxonomic affinity (Veron and Wallace 1984). The Acropora humilis species
group contains eight species, as defined by Wallace (1999). These species are A.
humilis (Dana 1846), A. gemmifera (Brook 1892), A. multiacuta (Nemenzo 1967), A.
monticulosa (Brüggemann 1879), A. digitifera (Dana 1846), A. samoensis (Brook
1891), A. retusa (Dana 1846) and A. globiceps (Dana 1846). In a systematic revision of
the genus Acropora, based on morphological characters, Wallace (1999) found the
species of the A. humilis species group formed a paraphyletic assemblage (Fig. 1.1).
The species A. humilis and A. gemmifera formed a highly derived clade, independent of
all other species in this species group and the genus Acropora. The species A.
multiacuta and A. monticulosa each formed independent lineages. The species A.
digitifera, A. samoensis and A. retusa grouped within a monophyletic clade, the DND
clade (“digitifera–nasuta-divaricata groups”) shared by the species of two other
species groups i.e. the Acropora nasuta and Acropora divaricata species groups. The
eighth species, A. globiceps was not recognized at the time of the analysis, although
Wallace (1999) notes that this species is separated from A. humilis by one
morphological character, and therefore is assumed to be a sister species of A. humilis.
The species A. humilis, A. gemmifera, A. monticulosa, A. digitifera and A. samoensis
have broad Indo-Pacific distributions. Acropora globiceps is only recorded from Pacific
Ocean locations, A. multiacuta is only recorded from isolated locations in the central
Indo-Pacific and A. retusa is recorded from western Indian Ocean and central Pacific
locations (Wallace 1999).
The species of the Acropora humilis group have high levels of intraspecific
morphological variation, while morphological boundaries between some species are
unclear. This polymorphism contributes to the complex taxonomic history and
difficulties in interpreting the evolutionary history of these species, on the basis of
5

A. retusa
A. samoensis
A. digitifera
A. monticulosa
A. multiacutaA. gemmifera
A. humilisA. austera
A. rudis
A. clathrataA. solitaryensis
A. divaricata
A. hoeksemai
A. cerealis
A. kosurini
A. kimbeensis
A. lutkeni
A. secale
A. nasuta
A. valida
All Other Species of Acropora
DNDClade
A. humilisspeciesgroup
Fig 1.1 Basal branches of a strict consensus tree from the parsimony analysis of
morphological characters of the genus Acropora by Wallace (1999), showing the
relationship between species of the A. humilis species group and other species within
the genus Acropora proposed in this phylogeny. Species of the A. humilis species group
are highlighted in bold and with thickened lines. This figure is modified and redrawn
from Fig. 44 in Wallace (1999).
6

morphological characters. In the first comprehensive review of the species now
grouped within the A. humilis species group, Wells (1954) recognized only two species,
A. humilis and A. digitifera. Within A. humilis, Wells (1954) synonymised the species
A. globiceps, A. gemmifera and A. samoensis and thirteen other species, many of which
continue to be considered as synonyms of currently recognized species in the A. humilis
group. Wells (1954) recognized A. digitifera as a distinct species with no additional
synonyms. In a major review of the genus Acropora for eastern Australia, Veron and
Wallace (1984) recognized A. humilis and A. digitifera, as well as A. gemmifera and A.
samoensis as distinct species, but did not discuss the status of A. globiceps. In the same
monograph, Veron and Wallace (1984) recognized A. monticulosa and the recently
described A. multiacuta as valid species. Veron and Wallace (1984) described close
morphological affinities between the species A. humilis, A. gemmifera and A.
monticulosa as well as A. humilis and A. samoensis, but note the distinction of A.
multiacuta from all other species in the genus Acropora. In the most recent and only
worldwide review of the genus Acropora, Wallace (1999) concurred with the
designation of A. humilis, A. digitifera, A. gemmifera, A. samoensis, A. monticulosa and
A. multiacuta as valid species, as well as reviving A. globiceps and A. retusa as valid
species. In this review, Wallace (1999) states the need for further research to resolve
boundaries between the species of the A. humilis group, particularly for the species A.
humilis and A. gemmifera. Wallace (1999) notes apparent morphological affinities
between A. gemmifera and A. humilis; A. globiceps with A. samoensis and A. humilis;
and A. monticulosa with A. humilis and A. gemmifera. Based on the conclusions of
these previous studies, it appears that the species A. digitifera, A. multiacuta and A.
retusa are most clearly defined, while morphological boundaries between A. humilis, A.
globiceps, A. samoensis, A. gemmifera and A. monticulosa are less clear. This differs
from the results of the only two publications that have examined evolutionary
relationships between species of the A. humilis group using non-morphological criteria,
both of which present molecular phylogenies of the genus Acropora for a nuclear and
mitochondrial marker (van Oppen et al. 2001; Márquez et al. 2002b). Van Oppen et al.
(2001) found that A. humilis and A. digitifera share a close relationship which is
distinct from A. gemmifera. This was supported by Márquez et al. (2002b) who used
the same sequences of the previous study as well as additional sequences from other
colonies of the same and different species of Acropora.
7

1.4 THESIS OUTLINE
The major aim of this thesis is to determine the extent to which morphology is
indicative of evolutionary relationships within and between currently defined species of
the Acropora humilis species group. To achieve this, I defined morphological sampling
units, at multiple sites from the west to central Pacific, on the basis of morphological
characters that are traditionally used to identify species of corals in the genus Acropora
(Wallace 1999). I then examined evolutionary relationships between these sampling
units using morphometric, molecular and reproductive criteria. The morphological
sampling units included species as well as putative (intraspecific and interspecific)
morphs. The species categories correspond with the known species of the Acropora
humilis species group. The intraspecific morphs are termed sub-morphs and include
colonies that appear to form morphologically discrete groups within the known species.
The interspecific morphs are termed intermediate morphs and include colonies that
appear to share morphological characters with more than one species. The sub-morphs
and intermediate morphs are named after the species with which they appear to share
greatest morphological affinity.
In chapter 2, I determine the most useful morphometric characters for comparing
morphological relationships within and between the species and morphs of the
Acropora humilis species group, using samples from American Samoa. Relationships
between the species and morphs used in this analysis are examined using a nuclear
molecular marker, domains 1 and 2 of the 28S rDNA unit.
In chapter 3, I survey the relative abundance of each species and morph of the
Acropora humilis group at Lizard Island, Great Barrier Reef, Australia and examine the
potential of these species and morphs to interbreed. The potential to interbreed is
explored on two fronts. Firstly, timing of spawning is documented at the scales of
month, day and hour to determine whether some species or morphs would be unable to
interbreed due to temporal reproductive isolation. Secondly, I test the ability of colonies
of the same and different species and morphs, which spawned on the same night, to
form viable larvae in laboratory fertilization experiments. I use a mitochondrial
molecular marker, the mtDNA intergenic region, to determine whether this marker
indicates a genetic basis for the reproductive patterns that I found.
8

In chapter 4, I examine morphological variation and the biogeographic distribution of
species and morphs of the Acropora humilis species group. I use the morphometric
characters developed in chapter 2 to compare patterns of morphological variation
within and between species and morphs of the A. humilis species group. Patterns of
variation are documented across a broad geographic range, from the west to the central
Pacific. Locations sampled include American Samoa, using the same samples analysed
in chapter 2, in addition to six other locations: Taiwan, Indonesia, Australia (Lizard
Island, Great Barrier Reef), Papua New Guinea, Solomon Islands and French
Polynesia. I define morphological species categories in a discriminant analysis and then
calculate the probability of classification of each colony of each morph into these
species categories. To document the biogeographic distribution of each species and
morph recognized in this study, I supplement the biogeographic data collected during
my field work, by identifying all specimens of the A. humilis species group in the
collections of the Museum of Tropical Queensland using the morphological categories
(species and morphs) defined in this chapter. These identifications are used to map the
worldwide distribution of each species and morph. The museum collections are also
examined to determine if additional morphs, to those that I recorded in my field
surveys, are evident.
In chapter 5, I explore genetic relationships between the species and morphs examined
in chapter 4, using the mtDNA intergenic region. This analysis used the same
sequences presented in chapter 3 for samples from Lizard Island, Great Barrier Reef,
Australia as well as sequences from the other geographic locations i.e. Taiwan,
Indonesia, Papua New Guinea, Solomon Islands, American Samoa and French
Polynesia. Phylogenetic relationships determined for this marker are compared with the
results of the molecular analysis of the 28S rDNA marker (chapter 2) and the
morphological phylogeny presented by Wallace (1999), for species of the Acropora
humilis species group and closely related species (Fig. 1.1). I also examine patterns of
intra-individual variation for the mtDNA intergenic region, to determine whether these
patterns provide additional evidence of evolutionary relationships between the species
and morphs.
In chapter 6, I consolidate the findings of each chapter, summarizing the relationships
between the species and morphs of the Acropora humilis species group, based on the
9

combined morphological, molecular and reproductive evidence. I then interpret these
findings within an evolutionary framework and discuss the implications of my results
for understanding the systematics of the genus Acropora and scleractinian corals.
10

CHAPTER 2: SPECIES BOUNDARIES WITHIN THE ACROPORA HUMILIS
SPECIES GROUP (CNIDARIA; SCLERACTINIA): A MORPHOLOGICAL
AND MOLECULAR INTERPRETATION OF EVOLUTION*
2.1 ABSTRACT
Species boundaries remain unresolved in many scleractinian corals. In this study, we
examine evolutionary boundaries of species in the Acropora humilis species group.
Five morphologically discrete units are recognized using principal components and
hierarchical cluster analyses of quantitative and qualitative characters respectively.
Maximum parsimony and likelihood analyses of partial 28S rDNA sequences suggest
that these morphological units diverged to form two evolutionarily distinct lineages,
with A. humilis and A. gemmifera in one lineage and A. digitifera and two
morphological types of A. monticulosa in the other. Low levels of sequence divergence
but distinct morphologies of A. humilis and A. gemmifera within the former lineage
suggest recent divergence or ongoing hybridization between these species.
Substantially higher levels of divergence within and between A. digitifera and A.
monticulosa suggest a more ancient divergence between these species, with sequence
types being shared through occasional introgression without disrupting morphological
boundaries. These results suggest that morphology has evolved more rapidly than the
28S rDNA marker, and demonstrate the utility of using morphological and molecular
characters as complementary tools for interpreting species boundaries in corals.
2.2 INTRODUCTION
Species are the basic units of measurement of biodiversity and therefore their accurate
definition is critical to understanding evolutionary processes and ecological dynamics.
Yet, despite the importance of species in studies of living systems, their definition and
formation have long represented one of the most elusive subjects in evolutionary
biology (Palumbi 1994). In scleractinian corals, a number of issues impede our
understanding of the extent to which currently defined species represent evolutionary
entities. Species of corals are traditionally described using morphological characters
* This chapter is published (as is) in the journal Coral Reefs: Wolstenholme, J. K., C. C. Wallace, C.A. Chen (2003) Species boundaries within the Acropora humilis species group (Cnidaria; Scleractinia): a morphological and molecular interpretation of evolution. Coral Reefs 22(2): 155-166.
11
(e.g. Wells 1956; Veron and Wallace 1984; Wallace 1999), with morphological
discontinuities being used to determine the boundaries between species (Wallace and
Willis 1994). However, morphological discontinuities between currently defined
species of corals are often not clear. An inherent factor contributing to this lack of
resolution is morphological plasticity (Lang 1984), due to environmental influences
such as light and energy regimes as well as space availability (e.g. Veron and Pichon
1976; Willis 1985; Budd et al. 1994; Muko et al. 2000). Therefore, distinguishing
between morphological plasticity and genetic variation, including the recognition of
possible sibling species, is essential for accurate definition of species of corals
(Knowlton and Jackson 1994).
Molecular techniques greatly enhance our understanding of the evolutionary
relationships between morphologically defined species. Indeed, during the past decade,
electrophoretic and DNA sequence data have already provided substantial insight into
these issues. Species boundaries within the genus Porites from the Atlantic and eastern
Pacific, were unable to be resolved using morphological characters (Brakel 1977;
Jameson 1997) but were resolved using electrophoretic data (Weil 1992). Two species
of Montipora, previously synonymized as a single species, were distinguished on the
basis of morphological and breeding criteria and have also been shown to be
electrophoretically distinct (Stobart and Benzie 1994; Stobart 2000). Substantial
morphological variability exists within the genus Montastraea (e.g. Foster 1985; Weil
and Knowlton 1994). However, whether this variation represents separate species or
morphotypes within a single polymorphic species continues to be debated (Lopez et al.
1999; Medina et al. 1999). Near or complete concordance of morphological and genetic
characters has been demonstrated between species within the genera Porites,
Goniastrea and between two species of Acropora (A. palifera and A. cuneata) (Ayre et
al. 1991; Budd et al. 1994; Garthwaite et al. 1994; Babcock and Miller 1997; Hunter et
al. 1997). In contrast, genetic exchange appears to be ongoing between morphological
species of Platygyra (Miller and Benzie 1997). Genetic overlap has also been
demonstrated between some species within the genera Acropora and Madracis, while
other species within these genera are genetically distinct for the same molecular marker
(van Oppen et al. 2000; Diekmann et al. 2001).
12

In corals, hybridization during multi-species mass spawning events has been proposed
as the means by which common gene pools are maintained between species of corals
(Miller and Benzie 1997; Hatta et al. 1999; Diekmann et al. 2001; van Oppen et al.
2001), and has been demonstrated to be possible under laboratory conditions (e.g.
Willis et al. 1997). Based on this evidence, with additional support from karyotypic
data, a reticulate evolutionary hypothesis has been proposed for scleractinian corals
(Veron 1995; Kenyon 1997). Conversely, genetic overlap between species may merely
be due to incomplete lineage sorting of ancestral genotypes, due to slow rates of
molecular evolution in corals (Knowlton 2001).
Tracing the evolutionary history of scleractinian corals is clearly a very complex task
but one fundamental to defining species boundaries within the Scleractinia. This is
particularly true for the genus Acropora, the largest extant genus of scleractinian corals
(Veron and Wallace 1984; Wallace 1999), with recently proposed phylogenies based on
morphological characters (Wallace 1999) and molecular sequence data (van Oppen et
al. 2001) suggesting conflicting patterns of evolution. Fossil records indicate that the
high diversity of this genus appears to be the result of relatively recent and rapid
speciation in the Indo-Pacific during and since the Miocene (Wallace 1999).
Consequently, unresolved morphological and genetic boundaries between currently
described species, and the ability of some species to interbreed under laboratory
conditions (Wallace and Willis 1994; Willis et al. 1997), could indicate that many
species of Acropora are still in the process of diverging.
In this paper, we examine the evolutionary relationships between species within the A.
humilis species group in American Samoa, using morphological and molecular data.
The purpose of the morphological analyses is to define morphological groupings of
corals, with the aim of determining whether morphological entities can be recognized
within currently described species, or alternatively whether currently described species
merge to form larger overlapping morphological entities. The morphological entities
defined in this study were then analyzed using partial sequences of the 28S ribosomal
DNA unit. Finally, we propose evolutionary relationships for the morphological
entities, based on the combined results of the morphological and molecular data.
13

SouthPacificOcean
170040’W170050’W
0 5 km
Pago Pago
TUTUILA14020’S
OFU OLOSEGA
0 5 km169040’W
SouthPacificOcean
14020’S
1
6
54
2
7
3
2.3 METHODS
2.3.1 Sampling
Field work was carried out in American Samoa in January 1999. Samples were
collected from seven sites on the islands of Tutuila, Ofu and Olosega (Fig. 2.1).
Putative morphs, distinguished using field-recognizable and gross skeletal characters,
were used as the sampling units in this study. Seven morphs were recognized from the
A. humilis species group in American Samoa. Five colonies of each putative morph
were sampled, except two rare forms for which only two and four colonies were
sampled. All sites were exposed to very exposed. Each site was searched for morphs of
the A. humilis species group, from a depth of approximately 20 m up to the reef flat.
Fig. 2.1 Maps of Tutuila and Ofu-Olosega, American Samoa: indicated sampling sites and
numbers correspond with Table 3. The islands of Ofu and Olosega are approximately
100 km east of Tutuila.
14
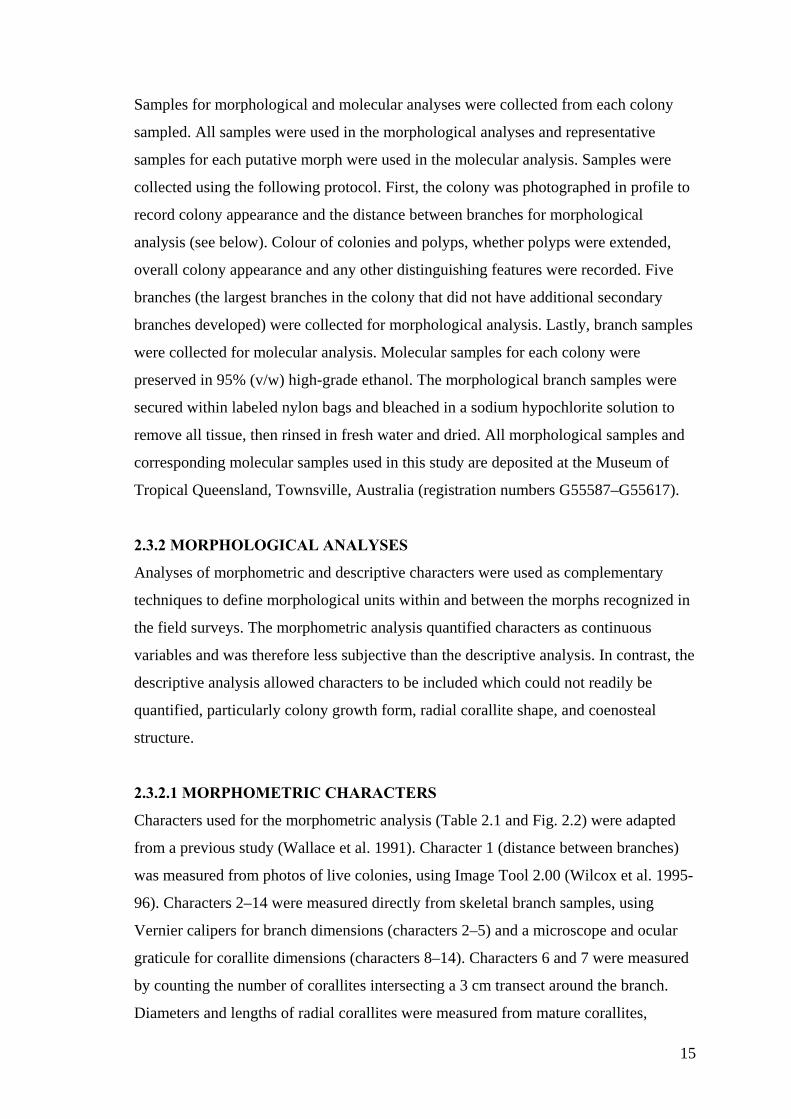
Samples for morphological and molecular analyses were collected from each colony
sampled. All samples were used in the morphological analyses and representative
samples for each putative morph were used in the molecular analysis. Samples were
collected using the following protocol. First, the colony was photographed in profile to
record colony appearance and the distance between branches for morphological
analysis (see below). Colour of colonies and polyps, whether polyps were extended,
overall colony appearance and any other distinguishing features were recorded. Five
branches (the largest branches in the colony that did not have additional secondary
branches developed) were collected for morphological analysis. Lastly, branch samples
were collected for molecular analysis. Molecular samples for each colony were
preserved in 95% (v/w) high-grade ethanol. The morphological branch samples were
secured within labeled nylon bags and bleached in a sodium hypochlorite solution to
remove all tissue, then rinsed in fresh water and dried. All morphological samples and
corresponding molecular samples used in this study are deposited at the Museum of
Tropical Queensland, Townsville, Australia (registration numbers G55587–G55617).
2.3.2 MORPHOLOGICAL ANALYSES
Analyses of morphometric and descriptive characters were used as complementary
techniques to define morphological units within and between the morphs recognized in
the field surveys. The morphometric analysis quantified characters as continuous
variables and was therefore less subjective than the descriptive analysis. In contrast, the
descriptive analysis allowed characters to be included which could not readily be
quantified, particularly colony growth form, radial corallite shape, and coenosteal
structure.
2.3.2.1 MORPHOMETRIC CHARACTERS
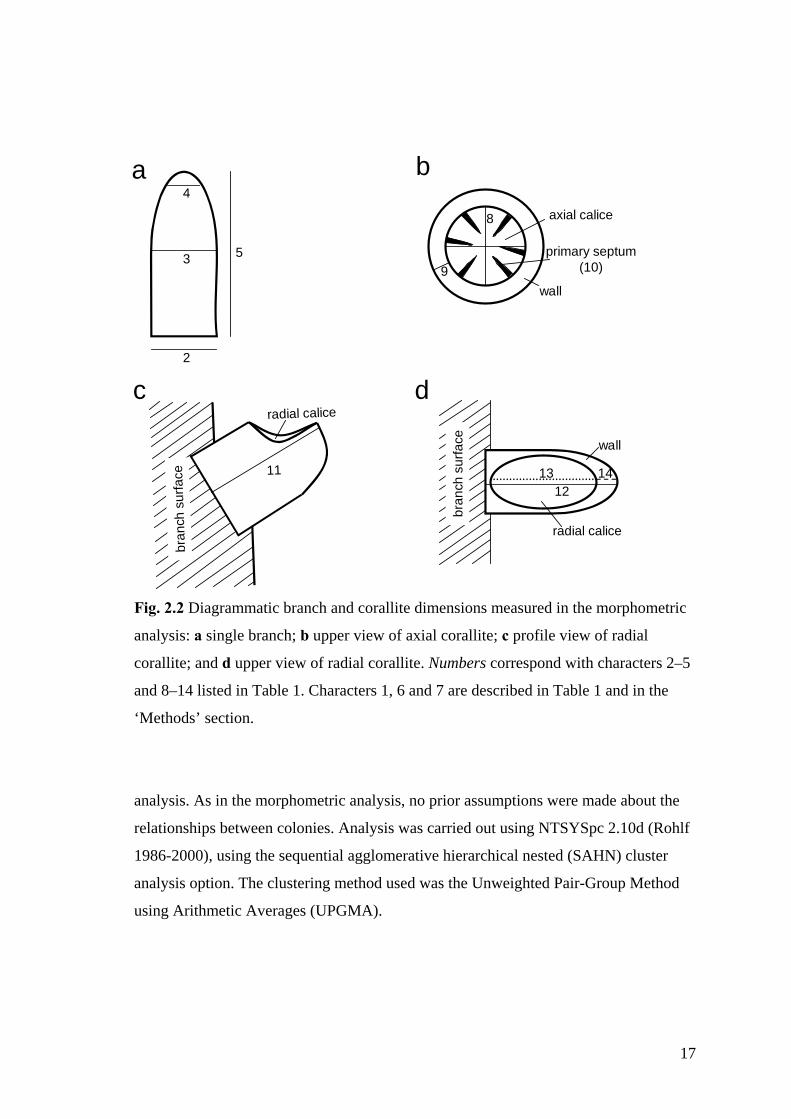
Characters used for the morphometric analysis (Table 2.1 and Fig. 2.2) were adapted
from a previous study (Wallace et al. 1991). Character 1 (distance between branches)
was measured from photos of live colonies, using Image Tool 2.00 (Wilcox et al. 1995-
96). Characters 2–14 were measured directly from skeletal branch samples, using
Vernier calipers for branch dimensions (characters 2–5) and a microscope and ocular
graticule for corallite dimensions (characters 8–14). Characters 6 and 7 were measured
by counting the number of corallites intersecting a 3 cm transect around the branch.
Diameters and lengths of radial corallites were measured from mature corallites,
15

Table 2.1 Morphometric characters measured in this study No. Character Code Description
1 Branch spacing brdist Distance to the five nearest branches
2 Basal branch diameter diambase Diameter at base of branch
3 Mid branch diameter diammid Diameter at mid-point of branch length
4 Branch tip diameter diamtip Diameter 5 mm from tip of branch
5 Branch length brlength Distance from tip to base of branch
6 Radial crowding radcor Average number of regular radial corallites / 3 transects
7 No. of subimmersed radials subimm Average number of subimmersed radial corallites / 3 transects
8 Diameter of axial calice axcal Average distance between inner walls of axial corallite, measured as
perpendicular diameters
9 Axial wall thickness axwall Width of axial wall
10 Septal length axsepta Average length of primary septa (usually 6) in axial corallite
11 Profile length rcprolen Maximum distance from base to outer edge of corallite
12 Corallite diameter rcordiam Maximum diameter of corallite from inner to outer wall
13 Calice diameter rcaldiam Maximum diameter of calice from inner to outer wall
14 Outer wall thickness rcwall Thickness of outer wall of radial corallite
defined as the largest radial corallites on the branch that did not have smaller corallites
budding from their surface.
Morphometric characters were analyzed using principal components analysis (PCA).
PCA is an exploratory tool, in which no a priori assumptions are made. PCA was
therefore used to explore morphological distance, both within and between morphs.
Characters 2–10 were measured from five branches. Characters 11–14 were measured
for five radial corallites on each of five branches. The average value for each character
for each coral colony was used in the analysis. The data matrix was standardized as a
correlation matrix, to equally weight the branch and corallite measurements. Analysis
was carried out in SPSS 9.0, using the factor analysis option.
2.3.2.2 DESCRIPTIVE CHARACTERS
Characters used for the descriptive analysis are listed in Table 2.2 and were adapted
from a previous study (Wallace 1999). The same colonies and branch samples used in
the morphometric analysis were used in this analysis. Characters 1 and 2 were coded
from photos and field notes. Characters 3–20 were coded directly from the skeletal
branch samples. The descriptive characters were analyzed using hierarchical cluster
16
2
3
4
5
a b
dc
8
9
axial calice
wall
primary septum(10)
11
radial calice
bran
ch s
urfa
ce 1312
bran
ch s
urfa
ce
radial calice
wall
14
Fig. 2.2 Diagrammatic branch and corallite dimensions measured in the morphometric
analysis: a single branch; b upper view of axial corallite; c profile view of radial
corallite; and d upper view of radial corallite. Numbers correspond with characters 2–5
and 8–14 listed in Table 1. Characters 1, 6 and 7 are described in Table 1 and in the
‘Methods’ section.
analysis. As in the morphometric analysis, no prior assumptions were made about the
relationships between colonies. Analysis was carried out using NTSYSpc 2.10d (Rohlf
1986-2000), using the sequential agglomerative hierarchical nested (SAHN) cluster
analysis option. The clustering method used was the Unweighted Pair-Group Method
using Arithmetic Averages (UPGMA).
17

Table 2.2 Descriptive morphological characters used in this study No.
Character Code States Coding
1 Colony outline determ Determinate from a focused origin 0 Indeterminate 1 2 Predominant outline growth Arborescent/divergent 0 Corymbose 1 Digitate 2 3 Branch structure axvsrad Axial dominated 0 Axials ≅ radials 1 4 Coenosteum coentype Same on and between radial corallites 0 Different on and between radial corallites 1 5 Coenosteum on radial corallites radcoen Costate or reticulo-costate 0 Open spinules 1 6 Coenosteum between radial corallites axcoen Reticulo-costate 0 Reticulate 1 Open spinules 2 7 Spinule shape spinules Single pointed, fine 0 Blunt, irregular, sturdy pointed 1 Elaborate 2 8 Radial corallite sizes rcsize One size or graded, with occasional, scattered
small radials 0
Two distinct sizes 1 Variable 2 9 Radial corallite inner wall rcinwall Developed 0 Not developed 1 Reduced 2 10 Radial corallite shape rcshape Tubo-nariform 0 Dimidiate 1 Lipped 2 Tubular 3 11 Radial corallite openings rcopen Oval 0 Rounded 1 12 Axial corallite diameter axdiam Large, > 3.0 mm 0 Medium, 2.8-3.0 mm 1 Small, < 2.8 mm 2 13 Radial corallites relsize Large 0 Medium 1 Small 2 14 Maximum branch thickness brthick > 25 mm 0 20-25 mm 1 15-20 mm 2 < 15 mm 3 15 Branch taper (tip=3 mm below
branch tip ) taper Broad conical (base > twice tip) 0
Conical (base broader than tip) 1 Terete (no to slight taper) 2 16 Maximum branch length brlength ≥ 80 mm 0 ≥ 70 mm 1 ≥ 60 mm 2 ≥ 50 mm 3 ≥ 40 mm 4 ≥ 30 mm 5 17 Radial crowding crowding Radials do not touch 0 Some radials touch 1 Radials crowded, touching 2 18 No. axial corallite synapticular rings axrings 2 0 3–4 1 > 4 2 19 Skeletal porosity porosity Radial walls porous 0 Radial walls not porous 1 20 No. radial corallite synapticular rings rcrings 2–3 0 > 3 1
18

2.3.3 MOLECULAR ANALYSIS
The 28S nuclear large subunit rDNA (domains 1 and 2) was used for the molecular
analysis. DNA was extracted from branch fragments of approximately 3–4 g wet
weight, based on protocols described by Chen et al. (2000) and Chen and Yu (2000).
Branch fragments were ground to a fine powder in liquid nitrogen and mixed with an
equal volume of DNA extraction buffer (5M NaCl, 0.5M EDTA, pH 8.0, 2%SDS), to
which 100 µg/ml of proteinase K was added. The solution was incubated overnight in a
water bath at 50 °C. DNA was extracted using phenol/chloroform and precipitated in
absolute ethanol. Following precipitation, the genomic DNA was dried, resuspended in
TE buffer and stored at –20 °C. The target segments, domains 1 and 2 from 28S rDNA,
were amplified using the primers 5S: 5’-GCCGACCCGCTGAATTCAAGCATAT-3’
and B35: 5’-CCAGAGTTTCCTCTGGCTTCACCCTATT-3’ (developed by Chen et
al. 2000). The amplification reaction used 100–200 ng of DNA template and BRL Taq
polymerase in a 50 µl reaction, in the presence of the buffer supplied with the enzyme
(as per manufacturer’s instructions). PCR was performed in a PC-960G gradient
thermal cycler using the following thermal cycles: 1 cycle at 95 °C (4 min); 30 cycles
at 94 °C (30 sec), 50 °C (1 min), 72 °C (2 min); 1 cycle at 72 °C (10 min); 1 cycle at 25
°C (30 sec). PCR products were electrophoresed in a 0.8% agarose (FMC Bioproduct)
gel in 1x TAE buffer to assess the yield. PCR products were cloned using the ligation
kit, pGEM T easy (Promega) and DH5α competent cells (BRL), under the conditions
recommended by the manufacturers. Bacterial colonies containing the vector were
picked with a sterile toothpick and cultured for 6–12 hours in a 4 ml LB nutrient
solution and purified using a plasmid DNA mini-prep kit (Viogene). Nucleotide
sequences were generated for pairs of complementary strands on an ABI 377 Genetic
Analyzer using the ABI Big-dye Ready Reaction kit following standard cycle
sequencing protocol. The sequences were submitted to GenBank under accession
numbers AY139650–AY139681.
Sequences were initially aligned using ClustalX (Thompson et al. 1997) and then
optimised manually within variable regions. The distance matrix comparing the pair
wise differences was calculated in PAUP* 4.0b10 (Swofford 2002), as were the
maximum parsimony and maximum likelihood analyses. Maximum parsimony was run
using the heuristic search option, with 10 random additions of sequences to search for
19

the most parsimonious trees. Bootstrapping with 1,000 pseudoreplicates determined the
robustness of clades, with branches supported by <50% collapsed. Analyses were run
with gaps excluded from the analysis, as well as treating gaps as a fifth character. The
most appropriate evolutionary model for the maximum likelihood analysis was selected
using Modeltest (Posada and Crandall 1998). Maximum likelihood analysis was run
using the heuristic search option, with 10 random additions of sequences.
Bootstrapping with 500 pseudoreplicates determined the robustness of clades, with
branches supported by <50% collapsed.
Acropora palifera, of the subgenus Isopora, was used as the outgroup. This species was
selected as an appropriate outgroup taxon because the two subgenera (Isopora and
Acropora) are thought to have diverged early in the history of the genus, and the A.
humilis species group occupies a basal position within the morphological phylogeny of
the genus Acropora (Wallace 1999). The A. palifera sample used was collected by
C. C. Wallace in September 1999 in the Togian Islands, central Sulawesi, Indonesia
(Museum of Tropical Queensland registration number G55715).
2.4 RESULTS
2.4.1 MORPHOLOGICAL ANALYSES
The seven morphs recognized during field surveys (Fig. 2.3) clustered as five
morphological units (Figs. 2.4 and 2.5). These morphological units correspond with the
species A. humilis (Dana 1846), A. gemmifera (Brook 1892), A. digitifera (Dana 1846),
and two forms (branching and digitate) of A. monticulosa (Brüggemann 1879).
Characters describing each morph are summarized in Table 2.3. In both the quantitative
and qualitative morphological analyses, all morphs except A. humilis formed discrete,
non-overlapping units corresponding with the putative groupings (Figs. 2.4 and 2.5).
The A. humilis morph comprises the remaining three undifferentiated putative
groupings (A. humilis 1, A. humilis 2 and A. humilis 3). All morphs, except the two
forms of A. monticulosa, were generally common at each of the seven sites surveyed.
All colonies of the branching form of A. monticulosa were sampled at site 1 and both
colonies of the digitate form of A. monticulosa at site 7 (Fig. 2.1). Data matrices used in
the morphometric and descriptive analyses are available as electronic supplementary
material (appendices I and II respectively).
20

a b c
de
f
g
1 cm
Fig. 2.3 Branch skeletons of each putative morph. Museum of Tropical Queensland
registration numbers are listed in brackets after the name of each morph: a “A. humilis
1” (G55591); b “A. humilis 2” (G55593); c “A. humilis 3” (G55599); d “branching A.
monticulosa” (G55617); e “digitate A. monticulosa” (G55612); f A. digitifera
(G55602); g A. gemmifera (G55607).
21

PC 1 (41.3%)
-6 -4 -2 0 2 4
PC 2
(20.
4%)
-4
-2
0
2
4
H3
H3
H3
H3
H3
bMbM bMbM
GG
GGGdMdM
H1
H1
H1H1H1
DD D
DD
H2
H2H2
H2 H2
12r13r
1b
6r
7r
11r3b
5b
4b
14r
10a8a
9a
2bdM
Fig. 2.4 PCA scatterplot of morphometric characters for principal components (PC) 1
and 2. Each data point in the PCA plot represents a single colony. Codes for each data
point are indicated by codes for each morph as follows: H1 “A. humilis 1”; H2 “A.
humilis 2”; H3 “A. humilis 3”; bM “branching A. monticulosa”; dM “digitate A.
monticulosa”; D A. digitifera; G A. gemmifera. Envelopes highlighting the clusters of
each morph were drawn by eye. Length and direction of vectors indicate the relative
effect of each character on distribution of morphs within the plot. Numbers for each
vector correspond with character codes in Table 1 and letters indicate vector type: b
branch character; a axial character; r radial character. Two colonies of H3 and two
colonies of dM almost overlay each other; one colony of H3 lies almost at the origin.
22

1.46 1.10 0.37Coefficient
0.000.73
H3
“digitateA. monticulosa”
A. gemmifera
A. humilis 1
“branchingA. monticulosa”
A. digitifera
A. humilis 2
A. humilis 2A. humilis 3
bM
bMbM
bM
DDDDD
dMdM
G
GGG
G
H3
H1H1H1H1H1
H2
H2H2H2H2
H3
H3A. humilis 3
H3
Fig. 2.5 Hierarchical cluster analysis (UPGMA) of descriptive morphological
characters. Each branch of the dendrogram represents a single colony. Codes for each
morph are the same as listed for Fig. 4.
2.4.1.1 MORPHOMETRIC CHARACTERS
The relationships between the five morphs revealed by PCA of the morphometric
characters are presented in Fig. 2.4, with each data point representing a single colony.
Colonies of each of the five morphs (A. humilis, A. gemmifera, A. digitifera,
“branching A. monticulosa and “digitate A. monticulosa”) formed discrete clusters. The
morphometric characters quantified branch, axial corallite, and radial corallite
dimensions. Characters quantifying radial corallites (size and spacing) were most useful
for separating the five morphs. The three axial corallite characters were highly
correlated, as were the five characters that quantified branch dimensions. The analysis
therefore indicates that A. digitifera colonies were characterized by relatively crowded,
small radial corallites and thin, short branches. The morph “branching A. monticulosa”
was characterized by a high proportion of subimmersed radial corallites, which were
oval rather than elongate in cross section. The three putative morphs of A. humilis were
all strongly characterized by the axial characters and radial corallite wall thickness and
width, with the radials tending to be widely spaced. The morphs “digitate A.
monticulosa” and A. gemmifera were not strongly influenced by any particular
characters. The short branches and relatively small, thin walled axials were the most
23
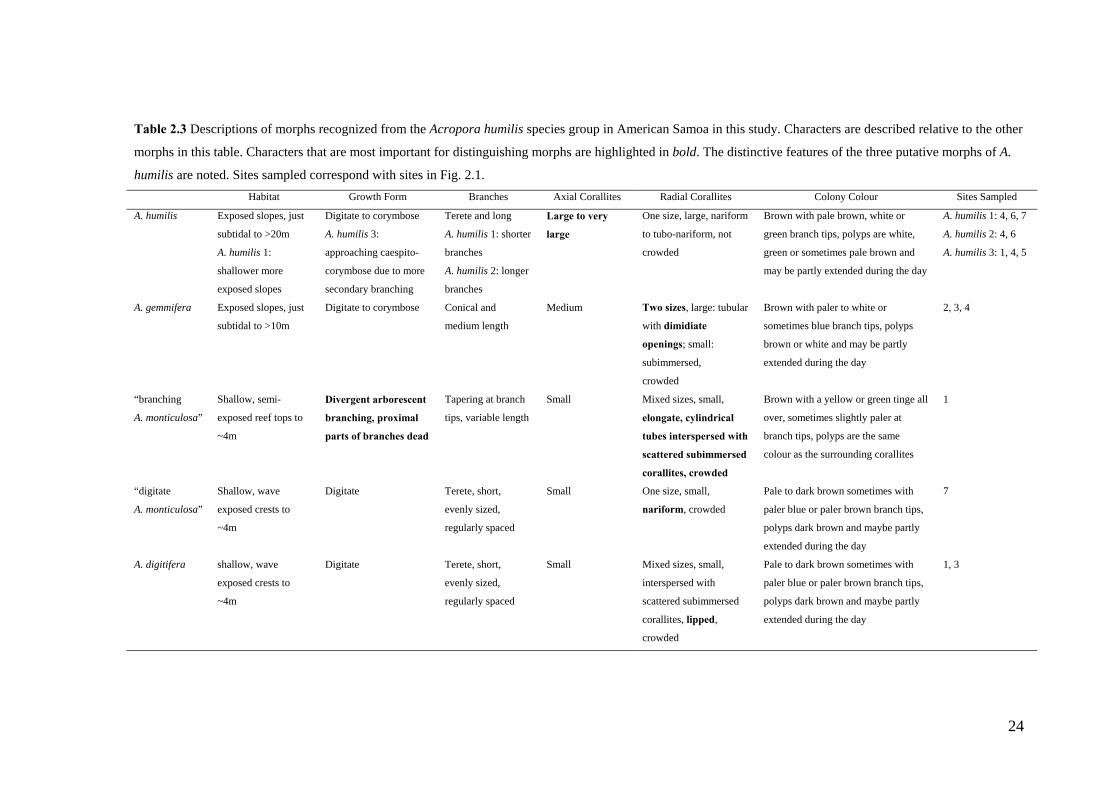
Table 2.3 Descriptions of morphs recognized from the Acropora humilis species group in American Samoa in this study. Characters are described relative to the other
morphs in this table. Characters that are most important for distinguishing morphs are highlighted in bold. The distinctive features of the three putative morphs of A.
humilis are noted. Sites sampled correspond with sites in Fig. 2.1. Habitat Growth Form Branches Axial Corallites Radial Corallites Colony Colour Sites Sampled
A. humilis
Exposed slopes, just
subtidal to >20m
A. humilis 1:
shallower more
exposed slopes
Digitate to corymbose
A. humilis 3:
approaching caespito-
corymbose due to more
secondary branching
Terete and long
A. humilis 1: shorter
branches
A. humilis 2: longer
branches
Large to very
large
One size, large, nariform
to tubo-nariform, not
crowded
Brown with pale brown, white or
green branch tips, polyps are white,
green or sometimes pale brown and
may be partly extended during the day
A. humilis 1: 4, 6, 7
A. humilis 2: 4, 6
A. humilis 3: 1, 4, 5
A. gemmifera
Exposed slopes, just
subtidal to >10m
Digitate to corymbose Conical and
medium length
Medium Two sizes, large: tubular
with dimidiate
openings; small:
subimmersed,
crowded
Brown with paler to white or
sometimes blue branch tips, polyps
brown or white and may be partly
extended during the day
2, 3, 4
“branching
A. monticulosa”
Shallow, semi-
exposed reef tops to
~4m
Divergent arborescent
branching, proximal
parts of branches dead
Tapering at branch
tips, variable length
Small Mixed sizes, small,
elongate, cylindrical
tubes interspersed with
scattered subimmersed
corallites, crowded
Brown with a yellow or green tinge all
over, sometimes slightly paler at
branch tips, polyps are the same
colour as the surrounding corallites
1
“digitate
A. monticulosa”
Shallow, wave
exposed crests to
~4m
Digitate Terete, short,
evenly sized,
regularly spaced
Small One size, small,
nariform, crowded
Pale to dark brown sometimes with
paler blue or paler brown branch tips,
polyps dark brown and maybe partly
extended during the day
7
A. digitifera
shallow, wave
exposed crests to
~4m
Digitate Terete, short,
evenly sized,
regularly spaced
Small Mixed sizes, small,
interspersed with
scattered subimmersed
corallites, lipped,
crowded
Pale to dark brown sometimes with
paler blue or paler brown branch tips,
polyps dark brown and maybe partly
extended during the day
1, 3
24

distinctive characters for the “digitate A. monticulosa” colonies and the high proportion
of subimmersed radial corallites was the most distinctive character for colonies of A.
gemmifera.
2.4.1.2 DESCRIPTIVE CHARACTERS
Qualitative analysis of the morphological characters showed the same separation of
morphs as the morphometric analysis, with colonies of each of the five morphs (A.
humilis, A. gemmifera, A. digitifera, “branching A. monticulosa” and “digitate A.
monticulosa”) clustering as distinct groups. The relationships within and between the
morphs, based on UPGMA analysis of the descriptive characters, are shown in Fig. 2.5.
A high cophenetic correlation of 0.96 calculated for this dendrogram indicates that the
pattern of clustering is a true representation of the original data set. Analysis of the
descriptive characters, using both single and complete linkage methods (calculated
separately and as a strict consensus tree) grouped colonies in a similar pattern to the
UPGMA analysis, differing only in branch lengths and the ordering of colonies within
the A. humilis cluster.
As also demonstrated in the morphometric analysis, the two morphs of A. monticulosa
clearly have very distinct morphologies. Colonies of “branching A. monticulosa”
showed the greatest dissimilarity to all other morphs within the A. humilis species
group, while colonies of “digitate A. monticulosa” shared most morphological
characters with A. digitifera and A. gemmifera. Within the A. humilis cluster, “A.
humilis 1” colonies formed a subcluster, while “A. humilis 2” and “A. humilis 3”
colonies were not differentiated. Colonies of the putative morph “A. humilis 1” all had
short branches and a different coenosteal structure compared with “A. humilis 2” and
“A. humilis 3”, while all other characters were shared between these three putative
morphs.
2.4.2 MOLECULAR ANALYSIS
The major findings in this analysis, based on the sequences examined, were that the
morphs A. digitifera, “branching A. monticulosa”, and probably “digitate A.
monticulosa” were distinct from the morphs A. humilis and A. gemmifera. Variability
between sequences of the former three morphs was substantially greater than between
the latter two morphs. Cloned sequences from domains 1 and 2 of the 5’ end of 28S
25

rDNA were obtained from colonies of the seven putative morphs. In total, 32 clones
from 15 coral colonies were sequenced. Sequence divergence ranged from 0–14.8%
between morphs of the A. humilis species group, compared with 22.3–30.8% when
compared with the A. palifera outgroup sequences. Nucleotide composition was similar
for all clones, with an average GC (Guanine-Cytosine) content of 62.57%. GC content
was slightly lower in clones isolated from morphs of the A. humilis species group
(61.15–63.53%) compared with the two A. palifera outgroup sequences (64.98%).
The aligned sequences consisted of 907 positions, with individual sequences ranging in
length from 782–851 bp. Within the aligned sequences, 635 positions were constant, 37
variable characters were not parsimony informative, and 235 (25.9%) were parsimony
informative.
Maximum parsimony (MP) and maximum likelihood (ML) analyses grouped the
sequences into four strongly supported clades. Sequences from A. digitifera and the two
morphs of A. monticulosa were substantially more divergent than those from A. humilis
or A. gemmifera. The phylogenetic tree from the MP analysis (Fig. 2.6, 50% majority-
rule consensus tree based on 885,920 trees) formed two branches grouping clades I, II
and III separately from clade IV. There were only low levels of divergence, indicating
high levels of similarity between sequences within each of the four clades. Clade I
grouped all but one sequence from A. digitifera (seven sequences from two colonies)
with the other sequence from a third colony grouping with “branching A. monticulosa”
in clade III. Sequences from “digitate A. monticulosa” grouped in clades I and II,
indicating that this morph shares sequence types with both A. digitifera and “branching
A. monticulosa”. Sequences from two colonies of “branching A. monticulosa” grouped
in clades II and III, indicating that there were two distinct types present within each
colony of this morph. The remaining clade IV contained all sequences from the A.
humilis and A. gemmifera morphs in addition to one sequence from the digitate morph
of A. monticulosa. This latter sequence from “digitate A. monticulosa” appears to be an
26

D - 1
D - 2
D - 1
D - 2D - 1
D - 1
dM - 1
dM - 1
D - 1
bM - 1
dM - 1
bM - 1
dM - 1
bM - 2
bM - 1
bM - 2
D - 3
bM - 2
G - 1
P - 1
P - 1
10 changes
H1 - 1G - 2
H2 - 1
H3 - 1
H1 - 2dM - 1
H3 - 2
H2 - 1
H1 - 3
H2 - 1
H3 - 1
97
99
80
100
56
52
100
70
98100
100
A. digitifera
“digitateA. monticulosa”
“branchingA. monticulosa”
A. digitifera
“branchingA. monticulosa”
A. gemmifera
A. humilis 1
A. humilis 2
A. humilis 3
“digitateA. monticulosa”
A. palifera
“digitateA. monticulosa”
I
II
III
IV
Fig. 2.6 Maximum parsimony consensus tree (50% majority-rule) of the partial 28S
sequences (domains 1 and 2). Numbers above branches indicate percent bootstrap
support; branches with <50% support have been collapsed. Tree length: 481; CI: 0.696;
RI: 0.850; HI: 0.304. Vertical bars at right of tree indicate the 4 major clades (I–IV).
Codes for each morph are the same as listed in Fig. 4. Numbers after the hyphen
identify different coral colonies within each putative morph. Scale bar indicates
number of nucleotide substitutions along branches.
27

erroneous sequence for two reasons. First, this sequence is almost identical to one of
the A. humilis sequences. Second, the sequences cloned from the A. humilis and A.
gemmifera morphs have very low levels of divergence and are otherwise very distinct
from all sequences cloned from the other morphs (Fig. 2.6). Negative controls were
consistently clear in all PCR reactions and so the source of error is most likely to have
occurred during cloning. It is possible that this sequence is a cloning artifact, although
contamination may also be the source.
The four clades were identical in composition when gaps were excluded from the
analysis or treated as a fifth character in the MP analysis. Treating gaps as a fifth
character produced a tree with two differences to that in Fig. 2.6. A shorter branch
connected the ingroup and outgroup sequences and bootstrap support increased for the
branch grouping clades I and II from 56 to 91%. Analysis of the sequences using ML
also produced four clades identical in composition to the MP analysis, with 70, 96, 99
and 100% bootstrap support for clades I–IV, respectively. The structure of the ML tree
differed in that the four clades formed a polytomy (compared with the grouping of
clades I–III as a single branch in the MP analysis) with a longer branch length
separating the ingroup from the outgroup sequences. The GTR + G + I model (G =
0.5612 and I = 0.3768) was selected for the maximum likelihood analysis.
2.5 DISCUSSION
2.5.1 SYNTHESIS OF MORPHOLOGICAL AND MOLECULAR FINDINGS
The seven putative morphs recognized in this study, within the A. humilis species group
in American Samoa, clustered as five morphological units (Figs. 2.4 and 2.5). These
morphological units correspond with the species A. humilis, A. gemmifera, A. digitifera,
and 2 forms (digitate and branching) of A. monticulosa. Cloned sequences of the 28S
nuclear rDNA unit from each of these morphs formed four strongly supported clades
(Fig. 2.6). All sequences from A. humilis and A. gemmifera grouped in a single clade
with little further differentiation. Sequences from A. digitifera and the two morphs of A.
monticulosa grouped in the other three clades with sequences from pairs of each of
these three morphs in each clade, indicating high levels of sequence variation within
and between these three morphs. Based on the partial 28S rDNA sequences cloned in
this study, we propose that the morphs A. humilis and A. gemmifera are evolutionarily
distinct from A. digitifera and A. monticulosa. The distinct morphologies but low levels
28

of sequence divergence between A. humilis and A. gemmifera suggest recent divergence
between these morphs. In contrast, sequence types appear to be shared through
occasional introgression while maintaining the distinct morphologies of the three
morphs, A. digitifera, “digitate A. monticulosa”, and “branching A. monticulosa”.
2.5.1.1 DIVERGENCE BETWEEN CLADES
All sequences cloned from colonies of the morphs A. humilis and A. gemmifera
grouped in a single clade with complete bootstrap support (Fig. 2.6, clade IV) in both
maximum parsimony and likelihood analyses. Based on these analyses, these morphs
appear to be an evolutionary lineage that is distinct from A. digitifera and A.
monticulosa. To confirm this proposal, additional sequences from colonies of “digitate
A. monticulosa” are necessary to verify that the anomalous sequence for this morph in
clade IV is erroneous. Alternatively, additional sequences will reveal the mechanisms
of introgression operating between this and the other morphs examined in this study.
The other three clades (Fig. 2.6, clades I, II and III), comprising sequences from A.
digitifera and A. monticulosa, form a single branch with weak bootstrap support in the
parsimony analysis and a polytomy with clade IV in the likelihood analysis. This
indicates that each of these clades are also distinct, but probably share greater affinity
with each other than with clade IV.
2.5.1.2 DIVERGENCE WITHIN CLADES
The extremely low level of sequence divergence between A. humilis and A. gemmifera
in clade IV (Fig. 2.6) can be interpreted by the fact that either these morphs diverged
too recently for these lineages to be assorted or they have not diverged and
interbreeding between these two morphs is ongoing. The species A. humilis and A.
gemmifera are often very similar morphologically at many locations within their
distribution range, to the extent that the two species may be difficult to distinguish
(Wallace 1999). However, in American Samoa the morphs representing these two
species were morphologically distinct, with no overlap or merging of morphological
characters (Table 2.3, Figs. 2.4 and 2.5), suggesting that recent divergence seems most
plausible. Analysis of a maternally inherited mitochondrial marker is now underway,
which will provide additional evidence on whether or not the low level of sequence
divergence reported in this study represents recent common ancestry between these
29

now morphologically distinct morphs. Breeding trials are also being conducted to test
the potential for these species to interbreed.
The partial 28S sequences cloned from A. digitifera and both forms of A. monticulosa
were highly divergent, due to distinct sequence types being found within and between
these morphs. The high to complete bootstrap support for clades I, II and III indicate
that distinct sequence types are present in different colonies of A. digitifera, the A.
monticulosa morphs and even in single colonies of each of the A. monticulosa morphs
(Fig. 2.6). The high levels of sequence variation within and shared sequence types
between these morphs were surprising because the three morphs were morphologically
distinct, and colonies within each of these morphs were indistinguishable as live
colonies and in skeletal samples (personal observation; Figs. 2.4 and 2.5). It therefore
appears that these three morphs share a common ancestral lineage, in which lineage
sorting is incomplete, and that gene flow may still be occurring between the three
morphs through occasional hybridization and backcrossing. The high levels of
divergence in these morphs may also be due to common ancestry with species not
examined in this study, possibly those that share the monophyletic clade with A.
digitifera in the phylogeny proposed by Wallace (1999) for the genus Acropora. More
sequences are necessary from the same colonies and additional colonies of these
morphs in order to confirm these proposals.
The grouping of sequences from “branching A. monticulosa” and “digitate A.
monticulosa” in different clades is significant, given that these two morphs fall within
the limits of a single species according to the current taxonomic description of A.
monticulosa (Wallace 1999). Although these two morphs belong to the same taxonomic
species, they were distinct morphologically, having different growth forms, differently
shaped radial corallites and coenosteal structure (Figs. 2.4 and 2.5), as well as different
colours of live colonies (Table 2.3). Despite the distinct morphological groupings of the
A. digitifera and two A. monticulosa morphs (Figs. 2.4 and 2.5), the digitate form of A.
monticulosa also shared apparent affinities with the A. digitifera colonies, having a
similar growth form and colour of live colonies. Based on these morphological
affinities and the shared sequence types, we tentatively propose that the morph “digitate
A. monticulosa” may have been derived from A. digitifera and “branching A.
monticulosa”, and that the two A. monticulosa morphs represent sibling species.
30

2.5.2 EVOLUTIONARY IMPLICATIONS
The large subunit 28S nuclear rDNA gene is usually used in phylogenetic studies to
examine the evolutionary relationships at higher taxonomic levels than species because
of its relatively slow rate of evolution (Hillis and Dixon 1991). For example, it has been
used to examine phylogenetic relationships between taxa within the Phylum Cnidaria
(Odorico and Miller 1997a), Class Anthozoa (Chen et al. 1995), and Order Scleractinia
(Veron et al. 1996; Romano and Cairns 2000). In contrast, more rapidly evolving
markers, such as ITS-1, ITS-2, and the 5.8S gene of the nuclear ribosomal DNA unit,
the mtDNA putative control region, Pax-C and the mini-collagen gene have been used
to study species boundaries within the genus Acropora (Odorico and Miller 1997b;
Hatta et al. 1999; van Oppen et al. 2000; van Oppen et al. 2001). These studies all
conclude that the lack of resolution found between many species of Acropora using
these markers indicates that this genus is evolving in a reticulate rather than a divergent
pattern. It seems likely, however, based on the molecular evidence in these papers and
the morphological and molecular evidence in this paper, that complex evolutionary
relationships exist between species within the genus Acropora, with boundaries
between species currently at various stages of formation.
In this study, we demonstrate that domains 1 and 2 of the 28S nuclear rDNA unit
contain important information for interpreting the evolutionary relationships between A.
digitifera, the A. monticulosa morphs and the A. humilis–A. gemmifera lineage, while
more rapidly evolving markers are likely to be most useful for interpreting evolutionary
relationships between more recently diverged species such as A. humilis and A.
gemmifera. Additional sequences are necessary to fully utilise the potential of this 28S
marker and provide a more comprehensive analysis of the evolutionary relationships
between species examined in this study as well as their relationship with other species
in the genus Acropora. To achieve this, additional sequences are needed from the
individuals and morphs examined in this project, particularly the A. digitifera and A.
monticulosa morphs, as well as other species of the genus Acropora occuring in
American Samoa. These additional sequences will reveal the number of sequence types
within individual colonies and individual morphs as well as the levels of divergence
and evolutionary affinities between morphs. The 28S marker is also likely to be useful
31

for examining evolutionary relationships between these species over a broader
biogeographic area because of its slow rate of evolution.
The existence of recognizably discrete groups of organisms, as seen in this study,
“argues against the idea that species are simply peaks in a continuum of variation”
(Vogler 2001).This view is reiterated for corals by Wallace and Willis (1994), who
state that the apparent morphological consistency of many species across a broad
geographic range supports the validity of species as real taxonomic entities. The
presence of the five discrete morphs of the A. humilis species group in American
Samoa, based on morphological characters, supports this view. Shared DNA sequences
between currently described species, previously interpreted as evidence for reticulate
evolution in corals (Odorico and Miller 1997b; Hatta et al. 1999; van Oppen et al.
2000; Diekmann et al. 2001; van Oppen et al. 2001), are equally likely to represent
common ancestry and be evidence of either recent or ancient divergence. Substantial
genetic overlap may exist between sister or other closely related species because only
one or a small number of genes may cause speciation, with large regions of the genome
remaining unchanged until the process of speciation is complete (Mayr 1963; Wu
2001).
Hybridization has been proposed by advocates of reticulate evolution as the mechanism
preventing species of corals from diverging as discrete evolutionary lineages (Veron
1995; Odorico and Miller 1997b; Hatta et al. 1999; van Oppen et al. 2000; Diekmann et
al. 2001; van Oppen et al. 2001). The opportunity for hybridization in corals appears to
be considerable because fertilization in many species occurs externally during
interspecific mass spawning events, in which gametes are mixed as they are released
and aggregate at the water surface. However, it is equally plausible that hybridization in
corals may retard but not prevent the final stages of divergence. If the latter is true, a
major implication is that the time since speciation is likely to be underestimated in
molecular phylogenetic analyses because genetic characters may have been shared
through occasional interbreeding. Hybridization, leading to polyploidy, has also been
proposed as a direct mechanism of rapid, sympatric speciation in the genus Acropora
(Kenyon 1997) as is well known in angiosperms [reviewed by Arnold (1997)].
Therefore, as well as maintaining shared gene pools between recently diverged species,
hybridization may also be a sudden means of divergent evolution. Further research is
32

necessary to determine the extent to which hybridization occurs under natural
circumstances and its role in the evolutionary history of corals.
The results presented in this paper demonstrate the importance of interpreting
morphological and molecular characters in complementary analyses to resolve species
boundaries in corals (Willis 1990; Stobart 2000), with analysis of morphological
characters providing additional information not revealed in the phylogeny of the
sequence data. This conflicts with the findings of van Oppen (2001) that morphology
has little predictive value in defining distinct evolutionary units. Concordance of the
morphological and molecular data for A. humilis, grouping the three putative morphs as
a single unit, strengthens support for colonies of these putative groupings belonging to
a single species, despite the morphological variation recognized in field surveys. The
recognition of two morphs within A. monticulosa, which may represent two sibling
species, also demonstrates the utility of examining corals at the intraspecific level for
tracing evolutionary relationships between species.
To enable further resolution of the evolutionary relationships of morphologically
defined species of corals, it will be necessary to examine fossil and extant morphs
across broad biogeographic ranges as well as trace their ancestry both directly in fossil
lineages and indirectly using increasingly sophisticated molecular tools. Augmenting
morphological and molecular studies with interspecific breeding experiments will also
provide valuable insights into the current reproductive potential of individual morphs.
Clearly, as demonstrated in this study, to resolve species boundaries and the
evolutionary relationships of species in corals, it is important to work at the
intraspecific level. This will enable possible sibling and intermediate species, as well as
evolutionarily discrete species, to be recognized.
33

CHAPTER 3: TEMPORAL REPRODUCTIVE ISOLATION AND GAMETIC
COMPATIBILITY ARE EVOLUTIONARY MECHANISMS IN THE
ACROPORA HUMILIS SPECIES GROUP (CNIDARIA; SCLERACTINIA)*
3.1 ABSTRACT
Patterns of interbreeding between individuals are fundamental to the structure and
maintenance of evolutionary boundaries between species. In corals, both hybridization
and reproductive isolation appear to be important evolutionary mechanisms. In this
study, I examine evolutionary boundaries using morphological, molecular and
reproductive criteria within the Acropora humilis species group at Lizard Island on the
Great Barrier Reef, Australia. Five species and seven morphs are recognized on the
basis of morphological appearance of features traditionally used to identify corals of the
genus Acropora. In a molecular phylogenetic analysis, I examine relationships for the
mtDNA putative control region, using maximum parsimony and maximum likelihood
methods. The reproductive criteria explore whether species and morphs are
reproductively isolated on the basis of temporal or fertilization barriers. Timing of
gamete maturity is surveyed for each species and morph, from the month prior to and
three months after the mass spawning. Time of spawning is documented at the levels of
night and hour of spawning, and time taken for egg-sperm bundles to separate.
Laboratory fertilization experiments tested the potential of species and morphs to
interbreed. High levels of intraspecific and extremely low or zero fertilization levels
between the five species indicated that they are valid species. Based on the combined
assessment of morphological, molecular and reproductive criteria, A. humilis and A.
gemmifera appear to be the most closely related species, which are most closely related
to the remaining species in the following order: A. samoensis, A. monticulosa and A.
digitifera. Evidence derived from one or more of these criteria suggest that the morphs
(i) are at various stages of divergence from the species with which they share
morphological characters, and (ii) may indicate possible zones of speciation and
hybridization. Identification of morphs avoided the possibility of taxonomic error and
was essential for accurate interpretation of evolutionary boundaries. Confirmation of
* This chapter is published (as is) in the journal Marine Biology: Wolstenholme, J. K. (2004) Temporal reproductive isolation and gametic compatibility are evolutionary mechanisms in the Acropora humilis species group (Cnidaria; Scleractinia). Marine Biology 144(3): 567-582.
34

morphology as an informative character of evolutionary boundaries is of great
significance because most coral research projects rely on morphology as the primary
tool for identification of species.
3.2 INTRODUCTION
Hybridization is an important mechanism of speciation in many groups of plants and
animals (reviewed in Arnold 1997; Rieseberg 1997). Hybridization may also promote
speciation in scleractinian corals (Willis et al. 1997) and may contribute to the
taxonomic difficulties of defining boundaries between species (Wallace and Willis
1994; Babcock 1995; Veron 1995). However the extent to which hybridization occurs
in nature, its evolutionary role and its phenotypic effect in corals is unknown.
Many corals reproduce during synchronous multi-specific spawning events (Harrison et
al. 1984; Babcock et al. 1986; Hayashibara et al. 1993; Babcock et al. 1994),
potentially providing opportunities for interspecific hybridization (Babcock 1995;
Willis et al. 1997). Gametes are viable for 6-8 hours after spawning (Willis et al. 1997)
and those released from species which spawn synchronously aggregate and mix at the
water surface, providing the potential for fertilization between different species.
Interspecific fertilization occurs under laboratory conditions (Knowlton et al. 1997;
Miller and Babcock 1997; Szmant et al. 1997; Willis et al. 1997; Hatta et al. 1999;
Fukami et al. 2003) and some molecular studies conclude that common DNA sequence
types in different species of corals are evidence of interspecific hybridization (Odorico
and Miller 1997b; Hatta et al. 1999; van Oppen et al. 2000; Diekmann et al. 2001; van
Oppen et al. 2001; van Oppen et al. 2002b; Fukami et al. 2003). A study of
chromosome numbers concluded that hybridization contributes to the development of
polyploidy and rapid speciation in the genus Acropora (Kenyon 1997).
Although there is potential for hybridization in corals, prezygotic mechanisms also
appear to be important in limiting interspecific breeding in corals. The most apparent
prezygotic mechanisms in corals include temporal reproductive isolation and gametic
incompatibility. Temporal isolation has been proposed for some species on the scale of
hours within mass spawning periods (Knowlton et al. 1997; Szmant et al. 1997; van
Oppen et al. 2001; Fukami et al. 2003). Many additional species spawn up to 1-3 hours
apart (Babcock et al. 1986; Wallace 1999) and may also be reproductively isolated.
35

Other species spawn weeks or months out of phase with the mass spawning (Willis et
al. 1985; Babcock et al. 1986; Hayashibara et al. 1993; Wallace 1999; Hayashibara and
Shimoike 2002) and may be partially or completely reproductively isolated by temporal
barriers. Gametes of many species also appear to be incompatible. Within
synchronously spawning species of Acropora, rates of intraspecific fertilization in
experimental crosses are high (often > 90%) for many species compared with rates of
fertilization in many interspecific crosses (Fig 3a and 4a in Willis et al. 1997; Table 1
in Hatta et al. 1999). The likelihood of interspecific fertilization in coral spawning
slicks also appears to be reduced by the presence of sperm attractants in eggs, which
enhance conspecific fertilization and reduce interspecific fertilization, as demonstrated
for species of Montipora (Coll et al. 1994).
Detailed examination of morphologically similar species and intraspecific morphs,
using molecular and reproductive criteria, suggest that evolutionary boundaries within
and between coral taxa are at various stages of formation. In one study, congruent
patterns of shared DNA sequences and high levels of fertilization between
morphologically divergent species of Acropora provide strong evidence of interspecific
hybridization (Hatta et al. 1999). In the same study, Hatta and colleagues also
recognized three morphs in A. nasuta and two in A. muricata (synonym of A. formosa),
which showed high levels of intramorph fertilization and (in all but one cross)
extremely low levels (≤1.6%) of intermorph fertilization. This suggests that breeding
boundaries have formed between the morphs within each of these species. Márquez and
colleagues demonstrate that the species Acropora hyacinthus and A. cytherea are
closely related but have now evolved to form statistically distinct lineages which
hybridize infrequently in nature, despite having high levels of hybridization in
laboratory experiments (Márquez et al. 2002a; Márquez et al. 2002b). Two studies have
concluded that Acropora palmata and A. cervicornis are evolutionarily distinct species
and that A. prolifera is a hybrid, derived from these species (van Oppen et al. 2000;
Vollmer and Palumbi 2002). The latter study also demonstrated that colonies of A.
prolifera are first generation hybrids with limited potential to interbreed, concluding
that the effect of hybridization has been the generation of new morphologies without
speciation. Three species of Montastraea, initially described as separate species and
then synonymised within Montastraea annularis, are now recognized on the basis of
36

morphological, molecular and behavioral differences, as well as timing of spawning
and fertilization potential (Knowlton et al. 1997; Szmant et al. 1997). However, no
single character has been found which separates the three species. This and the variable
occurrence of morphologically intermediate colonies suggest that boundaries may be at
different stages of formation in different locations within the Caribbean (Knowlton et
al. 1997; Szmant et al. 1997). Similarly, the species pairs Acropora millepora and A.
spathulata and Montipora digitata and M. tortuosa were each previously regarded as
single morphologically variable species, but are now recognized as distinct species on
the basis of morphological and breeding criteria (Wallace 1999; Stobart 2000), and
fixed genetic differences for the Montipora species (Stobart and Benzie 1994). In the
genus Platygyra, seven morphospecies from the Great Barrier Reef have been defined
in multivariate analyses, although no single morphological, reproductive or genetic
character has been found which separates them (Miller and Babcock 1997; Miller and
Benzie 1997). As suggested by Willis et al. (1997), based on the small number of
species in the genus Platygyra compared with the genus Acropora, the effect of
hybridization may have been to merge species or retard speciation in the former genus,
but promote speciation in the latter genus.
These studies clearly indicate that it is necessary to use morphs, rather than species, as
sampling units to accurately interpret evolutionary boundaries in corals. This will
provide the greatest opportunity of elucidating evolutionary relationships in corals,
separating genetic versus environmental influences on morphological variability, and
avoiding the potential of confused phylogenies due to taxonomic error. In this study, I
examine evolutionary relationships between morphs of the Acropora humilis species
group at Lizard Island (Great Barrier Reef), defined on the basis of morphological
appearance. The major aim of this project is to determine the extent to which
morphology is indicative of evolutionary relationships within and between currently
defined species in this group of corals. To do this, I use molecular and breeding criteria.
The A. humilis species group is of particular interest because species within this group
have a high level of intraspecific morphological variability, with boundaries between
species appearing indistinct (Wallace 1999). In addition, based on previous surveys at
Lizard Island (Wallace 1999 and B. Kojis pers. comm.), it appears that temporal
reproductive isolation may occur within this species group.
37
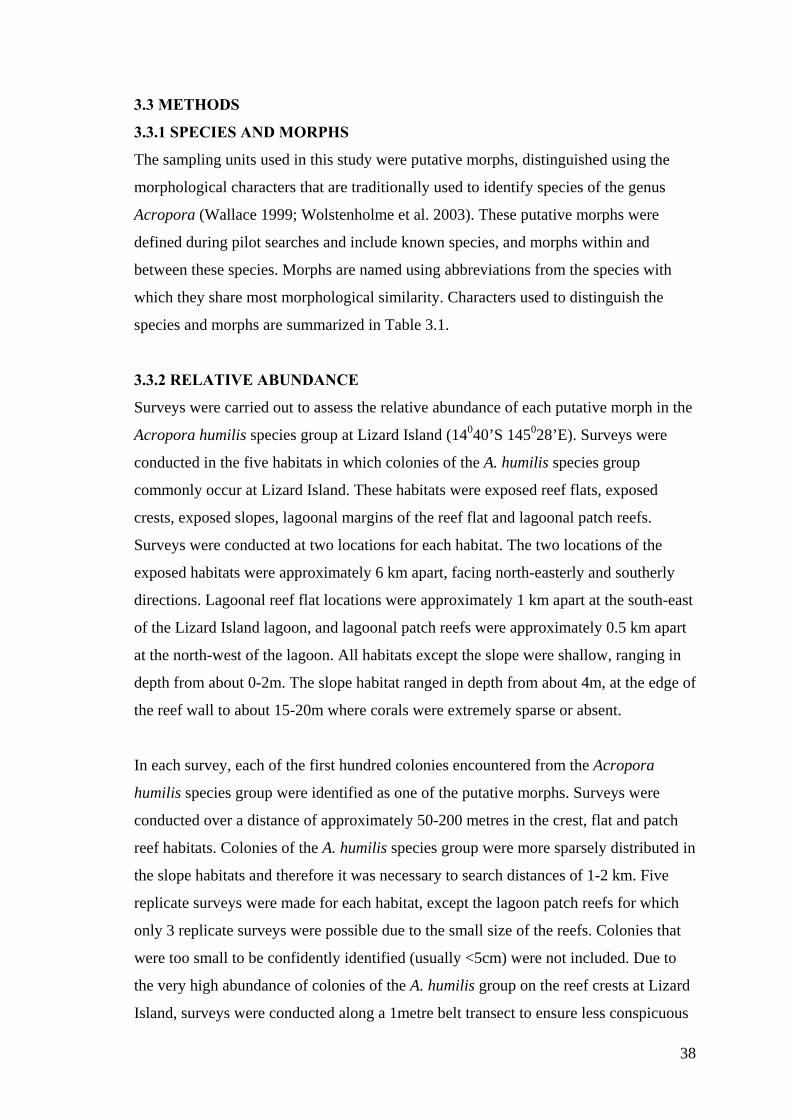
3.3 METHODS
3.3.1 SPECIES AND MORPHS
The sampling units used in this study were putative morphs, distinguished using the
morphological characters that are traditionally used to identify species of the genus
Acropora (Wallace 1999; Wolstenholme et al. 2003). These putative morphs were
defined during pilot searches and include known species, and morphs within and
between these species. Morphs are named using abbreviations from the species with
which they share most morphological similarity. Characters used to distinguish the
species and morphs are summarized in Table 3.1.
3.3.2 RELATIVE ABUNDANCE
Surveys were carried out to assess the relative abundance of each putative morph in the
Acropora humilis species group at Lizard Island (14040’S 145028’E). Surveys were
conducted in the five habitats in which colonies of the A. humilis species group
commonly occur at Lizard Island. These habitats were exposed reef flats, exposed
crests, exposed slopes, lagoonal margins of the reef flat and lagoonal patch reefs.
Surveys were conducted at two locations for each habitat. The two locations of the
exposed habitats were approximately 6 km apart, facing north-easterly and southerly
directions. Lagoonal reef flat locations were approximately 1 km apart at the south-east
of the Lizard Island lagoon, and lagoonal patch reefs were approximately 0.5 km apart
at the north-west of the lagoon. All habitats except the slope were shallow, ranging in
depth from about 0-2m. The slope habitat ranged in depth from about 4m, at the edge of
the reef wall to about 15-20m where corals were extremely sparse or absent.
In each survey, each of the first hundred colonies encountered from the Acropora
humilis species group were identified as one of the putative morphs. Surveys were
conducted over a distance of approximately 50-200 metres in the crest, flat and patch
reef habitats. Colonies of the A. humilis species group were more sparsely distributed in
the slope habitats and therefore it was necessary to search distances of 1-2 km. Five
replicate surveys were made for each habitat, except the lagoon patch reefs for which
only 3 replicate surveys were possible due to the small size of the reefs. Colonies that
were too small to be confidently identified (usually <5cm) were not included. Due to
the very high abundance of colonies of the A. humilis group on the reef crests at Lizard
Island, surveys were conducted along a 1metre belt transect to ensure less conspicuous
38

colonies were included. Surveys in the other habitats were conducted by haphazard
swimming, with all colonies encountered being identified.
3.3.3 MOLECULAR TECHNIQUES AND ANALYSIS
Molecular samples were collected to analyze genetic relationships between the putative
morphs. One or two colonies of all but two of the rarer morphs (“mont-hum” and
“mont-gem”) and three colonies of Acropora austera, the outgroup taxon for this study,
were sampled. The species A. austera was selected as the most appropriate outgroup
because it is directly ancestral to the species examined in this study, based on a
morphological phylogeny of the genus Acropora (Wallace 1999). For each colony
sampled, skeletal branch samples were collected and photographs taken, providing a
reference of the appearance of the colony. Molecular samples were collected following
the protocol described by Wolstenholme et al. (2003).
DNA was extracted from a volume of approximately 200 µl of tissue and skeleton,
using a Viogene blood and tissue genomic DNA extraction kit. The tissue and skeleton
were ground to a fine powder in liquid nitrogen, mixed with an equal volume of lysis
buffer and 20 µl of proteinase E. Samples were incubated overnight in a 600C
waterbath. DNA was extracted as per the manufacturer’s instructions and precipitated
in isopropanol. Following precipitation, the genomic DNA was dried, resuspended in
ddH20 and stored at –200C. The marker used for the molecular analysis was the
mtDNA putative control region (referred to as the mtDNA intergenic region for the
remainder of this paper, as in van Oppen et al. (2001)). Target segments were amplified
using the primers AcrdloopF: 5’-TGTTAGTACAAATCGCCCGTCGCC-3’,
AcrdloopInt: 5’-CGTGAGCAGGACGCTTCAG-3’ and AcrdloopR: 5’-
CATCCATATCATTTGGTTGAGCCTTCT-3’, designed by van Oppen et al. (1999a).
The amplification reaction used 100-200ng of DNA template and BRL Taq polymerase
in a 50µl reaction, in the presence of the buffer supplied with the enzyme (as per
manufacturer’s instructions). PCR was performed in a PC-960G Gradient Thermal
Cycler using the following steps: incubation period of 4 min at 950C; 5 cycles of 30 sec
at 940C, 1 min at 500C and 2 min at 720C; followed by 30 cycles of 30 sec at 940C, 1
min at 550C and 2 min at 720C; ending with a 10 min extension at 720C. PCR products
were electrophoresed in a 0.8% agarose (FMC Bioproduct) gel in 1X TAE buffer to
assess the yield.
39

Sequences were initially obtained by direct sequencing but these could not be
interpreted, apparently due to the variable occurrence of repeat sequence blocks within
individuals. All sequences analysed in this study were therefore obtained by cloning.
Multiple clones were sequenced from most individuals (Table 3.2) enabling variation
within and between individuals to be compared. PCR products were cloned using the
ligation kit, pGEM® T easy (Promega) and transformed into DH5αTM competent cells
(BRL), under conditions recommended by the manufacturers. Bacterial colonies
containing the vector were picked with a sterile toothpick and cultured for 6-12 hours in
a 4ml LB nutrient solution and purified using a Viogene plasmid DNA mini-prep kit.
Nucleotide sequences were generated for both strands on an ABI 377 Genetic Analyzer
using the ABI Big-dye Ready Reaction kit following standard cycle sequencing
protocol.
Sequences were aligned manually in Seqapp 1.99 (Gilbert 1994). Calculation of the
pairwise sequence distance matrix and the maximum parsimony and likelihood
phylogenetic analyses were performed in PAUP* 4.0b10 (Swofford 2002).
Phylogenetic analyses used the heuristic search option. Bootstrapping with 1000
pseudoreplicates determined the robustness of clades, with branches supported by
<50% being collapsed as polytomies. The maximum parsimony analysis was run with
gaps excluded from the analysis, as well as treating gaps as a fifth character. The best-
fit model of sequence evolution (TrN+I) was determined using Modeltest 3.06 (Posada
and Crandall 1998) and the Akaike Information Criterion (AIC) method, for the
maximum likelihood analysis.
Sequences have been submitted to GenBank under accession numbers AY364090 to
AY364162 and the morphological reference samples are deposited at the Museum of
Tropical Queensland (MTQ), Townsville, Australia (registration numbers G56366-
G56383). GenBank accession numbers and MTQ registration numbers are cross-
referenced with the reciprocal institutions.
40
3.3.4 BREEDING POTENTIAL
3.3.4.1 TIMING OF GAMETE MATURITY
Surveys of the six most abundant morphs were carried out from November 1998 to
December 2001, to determine the proportion of colonies containing mature eggs and an
indication of the timing of spawning of each morph. Surveys were conducted 1-3 days
after the full moons during the spawning season, which extended from one month
before and three months after the mass spawning event (months –1, 0, 1, 2, 3 with
month 0 being the mass spawning month). Up to 30 colonies of Acropora humilis, A.
gemmifera, A. samoensis, A. digitifera, A. monticulosa and the morph “dig-gem” were
surveyed each month, with fewer colonies surveyed during the earlier spawning
seasons. Surveys were conducted around Lizard Island for all morphs. Colonies of A.
digitifera are rare at Lizard Island (Fig. 3.1) but common at a nearby island, North
Direction Island (5km SE of the Lizard Island group). Surveys of 30 colonies were
therefore conducted at North Direction Island for A. digitifera, with fewer colonies
sampled around Lizard Island during the earlier phases of the project. Based on the
results of these surveys, no difference in timing of spawning was evident between
Lizard and North Direction Islands.
The surveys were conducted following the protocol described in Baird et al. (2002).
Eggs develop over approximately a nine month period in species of Acropora,
becoming pigmented about three weeks prior to spawning (Wallace 1985). Testes are
visible microscopically four to six weeks prior to spawning (Wallace 1985). To
determine timing of gamete maturity and month of spawning, branches were broken
from colonies and scored as follows: colonies in which eggs were not visible or only
just visible microscopically were scored as containing ‘no eggs’; colonies with visible
but white eggs were recorded as ‘immature’; and colonies with pigmented eggs were
recorded as ‘mature’ and ready to spawn. Up to five branches were broken from each
colony. If any of these branches contained mature eggs, then the colony was scored as
mature. If reproductive status could not be confidently assessed in the field (i.e. ‘no
eggs’ vs. ‘immature’), branch samples were collected, preserved in 5% formalin,
decalcified in 3% hydrochloric acid and examined under a dissecting microscope.
41

3.3.4.2 SPAWNING AND FERTILIZATION TRIALS
Laboratory-based fertilization experiments were carried out, following the procedure in
Willis et al. (1997). Fertilization trials were only conducted between colonies spawning
during the same period of gametic viability (i.e. the same night), to test the breeding
potential within and between species and morphs that could feasibly interbreed in
nature. Potential for colonies to interbreed was tested between pairs of colonies of the
same morph, between pairs of colonies of different morphs and gametes from a single
colony (selfs) for all morphs, except the rare morph “mont-gem”.
Colonies used in the fertilization experiments were collected 1-5 days after the full
moon. Each colony was placed in a separate aquarium. Once colonies had released a
substantial amount of spawn, egg-sperm bundles were collected and poured into a cup
with a plankton mesh base, in a bowl of seawater. The cup was then gently agitated to
separate egg-sperm bundles, with sperm being strained through the plankton mesh and
eggs retained within the cup. Plankton mesh with a pore size of 210μm was used in the
main spawning month. However, in the first spawning season, I found that this mesh
was too coarse to retain eggs released from colonies that spawned in the later months
(months 2 and 3). Plankton mesh with a pore size of 62μm was therefore used to
separate eggs and sperm in the later months. Sperm diluted to approximately 106 per ml
and approximately 100 eggs were then combined in 25ml glass vials. Controls were set
up for each colony used in the experiment, to ensure that extraneous sperm had not
contaminated any of the crosses. All crosses and controls were replicated three times.
Vials were suspended at the surface in a tank of aerated water, simulating the
conditions in which eggs and sperm are mixed in a spawning slick. The proportions of
regular embryos were counted after 6-10 hours. Fertilization levels in all self crosses
were <10% and usually <3%, indicating that selfing is possible but most likely a
consequence of the artificial conditions. Fertilization levels in all controls were <3%
and usually 0%. Recorded fertilization levels may therefore include occasional embryos
due to selfing or sperm contamination. Crosses that showed low levels of fertilization
were therefore interpreted cautiously. Time of spawning (nights after the full moon and
time of night) and time taken for gametes to separate were also recorded, providing
additional indications of breeding potential within and between morphs.
42

3.4 RESULTS
3.4.1 SPECIES AND MORPHS
Twelve morphs were recognized within the Acropora humilis species group. Five of the
morphs corresponded with currently recognized valid species in this group and are
referred to as species for the rest of this paper, distinguishing them from the other seven
morphs. The species are A. humilis (Dana 1846), A. gemmifera (Brook 1892), A.
samoensis (Brook 1891), A. monticulosa (Brüggemann 1879) and A. digitifera (Dana
1846). Six of the remaining seven morphs were morphologically intermediate between
these species and are named after the species with which they appear to share greatest
morphological affinity (Table 3.1). The seventh morph, “terete mont” appeared to be
most closely associated with A. monticulosa, and is named for its apparent affinity with
this species and its less conical (terete) branches. Four of the morphs, “dig-gem”,
“mont-hum”, “mont-gem” and “terete mont” were distinct. The “hum-gem” morph was
morphologically variable, forming a continuum between the species A. humilis and A.
gemmifera, with some colonies appearing most similar to one of these species and other
colonies clearly sharing characters with both species. Colonies of the morphs “sam-
hum” and “sam-gem” each appeared to share closest morphological affinity with A.
samoensis.
3.4.2 RELATIVE ABUNDANCE
The most abundant species or morph was the morph “dig-gem”, dominating the crest
and flat habitats, common on the lagoon patch reefs but absent on the slopes (Fig. 3.1).
Acropora humilis, A. gemmifera and the morph “hum-gem” were moderately common
in all habitats. Colonies of A. monticulosa and morphs sharing characters with this
species were mainly found on the reef crest, but were not abundant in any habitat and
were absent on the lagoon patch reefs and slopes. Acropora digitifera was present but
rare at all shallow sites and absent on the slopes. Acropora samoensis was the most
abundant species or morph of the A. humilis species group in the deeper slope habitat,
with “sam-hum” being the next most abundant. Both of these morphs were extremely
rare or absent in all exposed habitats, while a small number of colonies were present on
the lagoon patch reefs. The morph “sam-gem” was always rare, with only a few
colonies being recorded on the slope and one lagoon patch reef.
43

Table 3.1 Primary characters used to identify species and morphs in the A. humilis species group.
Growth Form Branch Shape
Axial Corallites
Radial Corallitesa Colony Colour
Species A. samoensis caespito-
corymbose thin, terete large one size, large, tubular
to tubo-nariform, not crowded
brown with edges of radial corallites, calice of axial corallites and ring around axial corallites pale green-yellow, pale brown, white or pale blue; polyps green-yellow (in colonies with this colour), white or pale brown
A. humilis corymbose thick, terete large to
very large
one size, large, nariform to tubo-nariform, crowded
often brightly coloured; brown, green, blue, purple or combinations of these colours; often paler or white around axial corallites; polyps yellow, green, white, pale blue or pale brown
A. gemmifera corymbose thick,
conical large two sizes, large,
flaring dimidiate to tubo-nariform, crowded
brown or pale brown, often with an orange, blue or yellow tinge; branch tips, edges of radial corallites and edges of colony often paler or white; polyps white or pale brown
A. monticulosa digitate very thick,
very conical small one size, small,
nariform, crowded colonies usually the same colour along length of all branches; brown with pale or strong green-yellow or purple-blue tinge; polyps green-yellow (in colonies with this colour), white or pale brown
A. digitifera corymbose very thin,
terete small mixed sizes, large,
flaring dimidiate to flaring lips, crowded
pale brown to brown; sometimes with blue or cream branch tips; polyps pale or dark brown
44

Table 3.1 continued
Morphsb “sam-hum” corymbose to
caespito-corymbose thin, terete large one size, large, tubo-
nariform, usually crowded usually as described for A. samoensis, but sometimes a single colour within the range of that seen in A. humilis
“sam-gem” corymbose to
caespito-corymbose thin, terete large one size, large, tubo-
nariform to dimidiate, usually crowded
same as A. samoensis
“hum-gem” corymbose thick, terete large one to two sizes, large, tubo-
nariform to dimidiate, crowded
colonies similar in colour to A. humilis but not usually as brightly coloured; polyps white or pale brown
“mont-hum” corymbose thick, terete to
conical large to very large
one size, large, nariform, crowded
colonies recorded in this study were usually brown sometimes with a pink or yellow tinge; often calices of radial and axial corallites and ring around axial corallite were paler or white; polyps white
“mont-gem” digitate very thick,
very conical small two sizes, small, dimidiate,
crowded same as A. gemmifera
“terete mont” digitate very thick,
sometimes conical
large mixed sizes, small, dimidiate, crowded
brown with a green-yellow or purple-blue tinge, calices of radial and axial corallites paler in colour, polyps white
“dig-gem” corymbose thick, conical small mixed sizes, large, flaring
dimidiate to flaring lips, crowded
same as A. digitifera
a The first size category in the description of radial corallites, refers to the size range of radial corallites within that morph and the second size category refers to the
size of radial corallites relative to other morphs. b Morphs are named according to the species with which they share most morphological characters. Characters that
are most important for distinguishing each species and morph are highlighted in bold.
45

Fig. 3.1 Relative abundance of species and morphs in the Acropora humilis species
group at Lizard Island in five habitats. a Overall abundance for all habitats and b-f
abundance in each habitat. Columns represent average number of colonies for five
replicate surveys for crest, flat and slope habitats and three replicate surveys for lagoon
patch reefs. Black and white bars distinguish the two sites surveyed for each habitat.
Error bars indicate 1 SD. Species and morphs are ordered along the horizontal axis by
overall abundance (most to least abundant) in non-slope and then slope habitats. Upper
case letters represent species and lower case letters represent morphs as follows: dg
“dig-gem”; G A. gemmifera; hg “hum-gem”; H A. humilis; M A. monticulosa; tm “terete
mont”; mh “mont-hum”; mg “mont-gem”; D A. digitifera; S A. samoensis; sh “sam-
hum”; sg “sam-gem”.

SlopeLagoon Patch Reef
Lagoon FlatExposed Flat
CrestAll habitats
0
30
10
20
40
No.
Col
onie
sN
o. C
olon
ies
No.
Col
onie
s
a b
c d
e
0
30
10
20
40
0
30
10
20
40
0
30
10
20
40
0
30
10
20
40
Smhdg G hg H DmgM tm sh sg
Smhdg G hg H DmgM tm sh sg
Smhdg G hg H DmgM tm sh sgSmhdg G hg H DmgM tm sh sg
Smhdg G hg H DmgM tm sh sg
0
30
10
20
40
Smhdg G hg H DmgM tm sh sg
f
46

3.4.3 MOLECULAR PHYLOGENETIC ANALYSIS
Phylogenetic analysis of the mtDNA intergenic region, using both maximum
parsimony and maximum likelihood methods, divided the species and morphs into two
clades. Acropora digitifera and “dig-gem” formed clade I and all other species and
morphs formed clade II (Fig. 3.2). Complete (100%) bootstrap support for clade I
indicates that A. digitifera and “dig-gem” are distinct from the other species and
morphs of the A. humilis species group for this marker. Within clade I, sequences from
the colonies of A. digitifera and “dig-gem” were indistinguishable. Within clade II,
divergence is also apparent for A. monticulosa (clade IIa) from A. humilis, A.
samoensis, A. gemmifera and intermediate morphs of these three species (clade IIb),
with each of these subclades having strong (95%) bootstrap support. There was little
additional resolution in clade IIb, suggesting a close evolutionary relationship between
these species and morphs.
Repeat sequence blocks were present in some but not all cloned sequences from single
colonies of Acropora gemmifera, A. monticulosa, “terete mont” and all cloned
sequences from the three colonies of A. austera (Table 3.2), indicating that these repeat
sequences do not represent a consistent phylogenetic signal. The repeat sequence
blocks were therefore deleted prior to the phylogenetic analysis. In addition to the
repeat sequence blocks, there were low levels of variation between sequences cloned
from each individual. The number of base differences between cloned sequences from
an individual coral ranged from 0 to 10 (Table 3.2). This variation may indicate
polymorphic sites within an individual or PCR error. Single consensus sequences for
each individual were therefore used in the analyses. At nucleotide sites that varied
within an individual, the most commonly occurring base at that site was used in the
consensus sequence. If different bases occurred with equal frequency at a particular
site, that site was recoded using the IUPAC (International Union of Pure and Applied
Chemistry) ambiguity code.
47

95
66
58
A. digitifera 122
A. digitifera 124
“dig-gem” 27
“dig-gem” 35
“terete mont” 6
A. monticulosa 30
A. monticulosa 34
A. humilis 23
A. humilis 32
“hum-gem” 105
“sam-hum” 94
A. gemmifera 108
“sam-gem” 95
A. samoensis 119
A. samoensis 121
A. austera 111
A. austera 112
A. austera 113
A. austeraClade
CladeII b
humilis-
gemmifera-
samoensis
CladeII a
monticulosa
CladeI
digitifera
5 changes
100
100
95
87
Fig. 3.2 Maximum parsimony consensus tree (50% majority rule) with mid-point
rooting, produced in the analysis of the mtDNA intergenic region for species and
morphs of the Acropora humilis species group. Gaps were treated as missing characters
in this analysis. Numbers below branches indicate bootstrap values (1000 replicates) for
branches with >50% support. Species names and sample codes are given for each
individual. Sample codes are as listed in Table 3.2.
48

Table 3.2 Number of sequences obtained from individuals of each species and morph
of the Acropora humilis species group in the molecular analysis. GenBank Accession
numbers and corresponding Museum of Tropical Queensland (MTQ) registration
numbers for morphological reference samples are listed for each colony. Species
or
Morph
Sample
Code
#
Sequences /
Individual
# base differences
between sequences
within an individual
GenBank
Accession
Numbers a
MTQ
Registration
Number
A. samoensis 119 5 1–7 AY364090–4 G56366
121 5 2–4 AY364095–9 G56367
A. humilis 23 2 2 AY364100–1 G56368
32 3 2–7 AY364102–4 G56369
A. gemmifera 108 4 0–10 AY364105–8 a G56370
A. monticulosa 30 8 0–9 AY364109–16 a G56371
34 4 3–6 AY364117–20 G56372
A. digitifera 122 1 AY364121 G56373
124 5 0–3 AY364122–6 G56374
“sam-hum” 94 5 1–3 AY364127–31 G56375
“sam-gem” 95 3 0–2 AY364132–4 G56376
“hum-gem” 105 5 1–7 AY364135–9 G56377
“terete mont” 6 1 AY364155a G56378
“dig-gem” 27 9 1–6 AY364140–8 G56379
35 6 2–10 AY364149–54 G56380
A. austera 111 3 2–6 AY364156–8a G56381
112 2 5 AY364159–60a G56382
113 2 9 AY364161–2a G56383 a Sequences with the accession numbers AY364106 (A. gemmifera); AY364111, AY364112 and
AY364116 (A. monticulosa); AY364155 (“terete mont”) and all sequences from colonies of A. austera
did not contain the repeat sequence block, as described in the text.
49
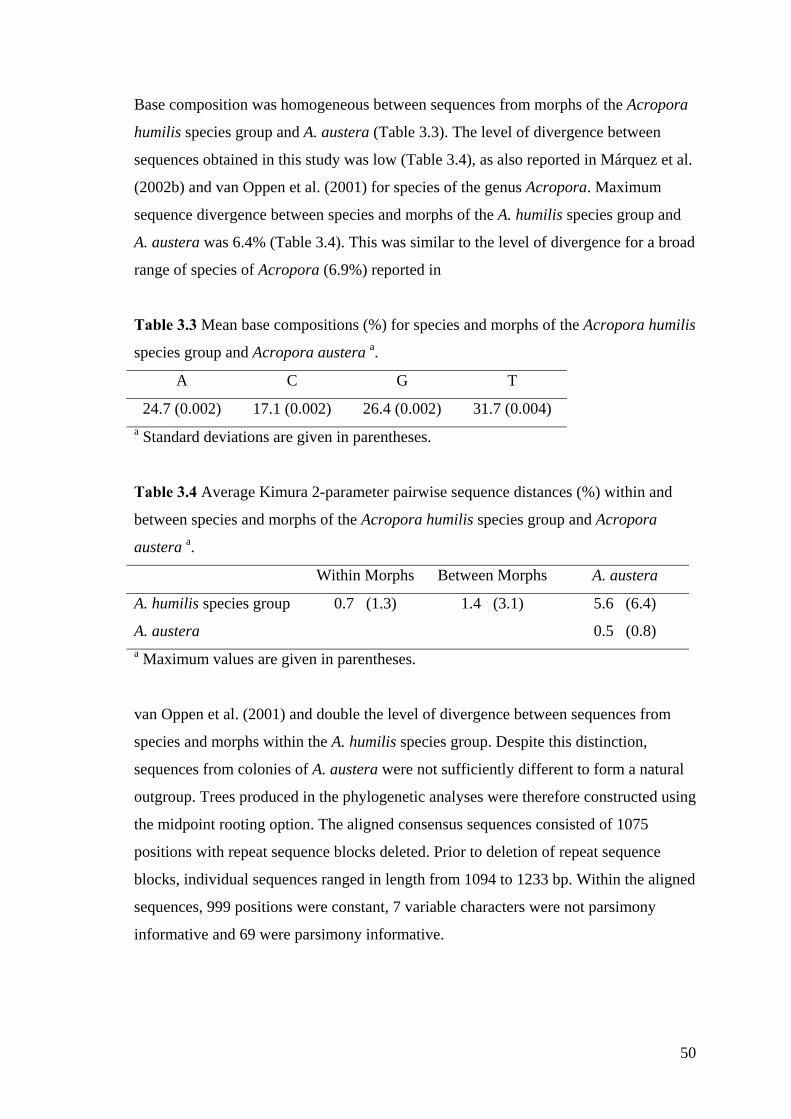
Base composition was homogeneous between sequences from morphs of the Acropora
humilis species group and A. austera (Table 3.3). The level of divergence between
sequences obtained in this study was low (Table 3.4), as also reported in Márquez et al.
(2002b) and van Oppen et al. (2001) for species of the genus Acropora. Maximum
sequence divergence between species and morphs of the A. humilis species group and
A. austera was 6.4% (Table 3.4). This was similar to the level of divergence for a broad
range of species of Acropora (6.9%) reported in
Table 3.3 Mean base compositions (%) for species and morphs of the Acropora humilis
species group and Acropora austera a.
A C G T
24.7 (0.002) 17.1 (0.002) 26.4 (0.002) 31.7 (0.004) a Standard deviations are given in parentheses.
Table 3.4 Average Kimura 2-parameter pairwise sequence distances (%) within and
between species and morphs of the Acropora humilis species group and Acropora
austera a.
Within Morphs Between Morphs A. austera
A. humilis species group 0.7 (1.3) 1.4 (3.1) 5.6 (6.4)
A. austera 0.5 (0.8) a Maximum values are given in parentheses.
van Oppen et al. (2001) and double the level of divergence between sequences from
species and morphs within the A. humilis species group. Despite this distinction,
sequences from colonies of A. austera were not sufficiently different to form a natural
outgroup. Trees produced in the phylogenetic analyses were therefore constructed using
the midpoint rooting option. The aligned consensus sequences consisted of 1075
positions with repeat sequence blocks deleted. Prior to deletion of repeat sequence
blocks, individual sequences ranged in length from 1094 to 1233 bp. Within the aligned
sequences, 999 positions were constant, 7 variable characters were not parsimony
informative and 69 were parsimony informative.
50
Maximum parsimony (MP) and maximum likelihood (ML) analyses produced trees
with similar topologies and levels of bootstrap support, differing in that the single
“terete mont” sequence formed a third branch with weak bootstrap support in clade II in
the MP analysis (Fig. 3.2) and a polytomy within this clade in the ML analysis.
Additional sequences are needed to clarify the phylogenetic position of this morph, but
based on the analyses in this study, it appears to be distinct from the species Acropora
monticulosa. Treating gaps as a fifth character in the MP analysis did not change the
tree topology, as also reported by van Oppen et al. (2001). MP analysis with gaps
treated as missing characters produced 607 most parsimonious trees of 81 steps. A
consistency index of 0.938, homoplasy index of 0.062 and a retention index of 0.973
indicate a strong phylogenetic signal in the sequence data.
3.4.4 BREEDING POTENTIAL
The results of this component of the study demonstrate that prezygotic mechanisms
restrict the interbreeding potential between species in the Acropora humilis species
group. Temporal reproductive barriers were present at two levels, i.e. month of gamete
maturity and hour of spawning, while isolation of species or morphs was not evident on
the basis of day of spawning. Fertilization barriers also existed between species that
spawned synchronously (i.e. on the same night, within a 4 hour period).
3.4.4.1 TIMING OF GAMETE MATURITY
Surveys of the timing of egg maturity in colonies of the Acropora humilis species group
at Lizard Island provided a direct indication of timing of spawning for each morph, for
each month of the spawning season (Fig. 3.3). The development of eggs through the
three stages of maturation is evident for each morph (Fig. 3.3) and timing of spawning
was validated by field and laboratory observations. No spawning was recorded in the
days prior to collection of this survey data. Spawning was only recorded by morphs
containing mature eggs, and colonies recorded with mature eggs in the surveys
contained no eggs in the days following spawning (Table 3.5).
51

Table 3.5 Observations of spawning in laboratory aquaria for species and morphs of
the Acropora humilis species group recorded during three spawning seasons (1999–
2000, 2000–2001 and 2001–2002). # Colonies
spawninga
# Colonies
not spawningb
Monthc Nightd Time of Spawning
(hrs after sunset)e
Separation of
Bundlesf
A. samoensis 9 1 2, 3 3, 4 1.5 – 2 5 – 30 mins
A. humilis 13 1 0 5, 6, 7, 8 2.5 – 3.5 1 – 4 hrs
A. gemmifera 9 0 0, 1,3 6, 7, 8 2.5 – 3.5 5 – 30 mins
A. monticulosa 9 1 0 6, 7, 8 5 – 6.25 30 – 60 mins
A. digitifera 4 0 3 7 2.75 5 – 15 mins
“sam-hum” 2 3 2 4, 6, 7 2 – 2.5 30 – 60 mins
“sam-gem” 2 0 2 4, 6 1.5 – 2 < 5 mins
“hum-gem” 4 1 0, 2 6, 7, 9 2.5 – 3 30 – 90 mins
“mont-hum” 3 1 0 7, 8 5 – 6.25 30 – 60 mins
“terete mont” 2 0 0 7 2.5 – 3 1 – 2 hrs
“dig-gem” 14 1 0 6, 7, 8 2.5 – 3.5 < 5 mins a # Colonies spawning indicates the number of colonies spawning in aquaria, on which the observations
in this table are based; b # colonies not spawning indicates the number of colonies in aquaria which did
not spawn; c Month = month of spawning relative to the mass spawning (month 0), codes for the month
of spawning are the same as those in Fig. 3; d Night = the number of nights after the full moon (night 0)
on which spawning was recorded; e spawning times ranged from 8.30pm to 1.15am; f separation of
bundles indicates the time interval taken for egg-sperm bundles to be separated.
The most striking finding in the pattern of timing of gamete maturity was that a second
substantial spawning event occurred three months after the mass spawning, with all but
one species spawning only during one of these events (Fig. 3.3a). Colonies of Acropora
monticulosa had the greatest level of synchronicity, with almost all colonies (96%)
containing mature eggs during the mass spawning month (month 0) and 4% during the
month following the mass spawning (month 1). Similarly, most colonies of A. humilis
and “dig-gem” contained mature eggs during the mass spawning month (90% and 89%
respectively). In contrast, A. samoensis never contained mature gametes during the
mass spawning, with all colonies of this species spawning during months 1, 2 or 3. The
absence of mature gametes in colonies of A. digitifera during month 0 indicates that it
also is not a mass spawning species. The predominant time of spawning for this species
appears to be month 3, based on the data available, with almost all colonies (94%)
containing mature eggs in this month. Acropora gemmifera showed the greatest
variability in timing of spawning, with high proportions of colonies containing mature
52

Fig. 3.3 Timing of egg maturity for the five species and the morph “dig-gem” of the
Acropora humilis species group during the spawning season at Lizard Island. Months
were standardized in relation to the month of mass spawning (month 0) as follows:
month –1: November 1998, October 1999; Month 0: November 1999, November 2000,
December 2001; Month 1: December 1999, December 2000; Month 2: January 2000,
January 2001; Month 3 March 1999, February 2001. Horizontal axis is ordered by
predominant spawning time, using the same codes for species and “dig-gem” as in Fig.
3.1. a Summary of timing of egg maturity for species and “dig-gem”. No line indicates
months when no colonies contained mature eggs; dotted lines indicate <40% of
colonies contained mature eggs; solid lines indicate >40% of colonies contained mature
eggs. b-f Stages of egg maturity for each month in the spawning season: white indicates
no or extremely small eggs were present, cross-hatching indicates immature eggs were
present, black indicates the presence of mature eggs. Multiple bars for each taxon
represent data recorded in different spawning seasons (years).
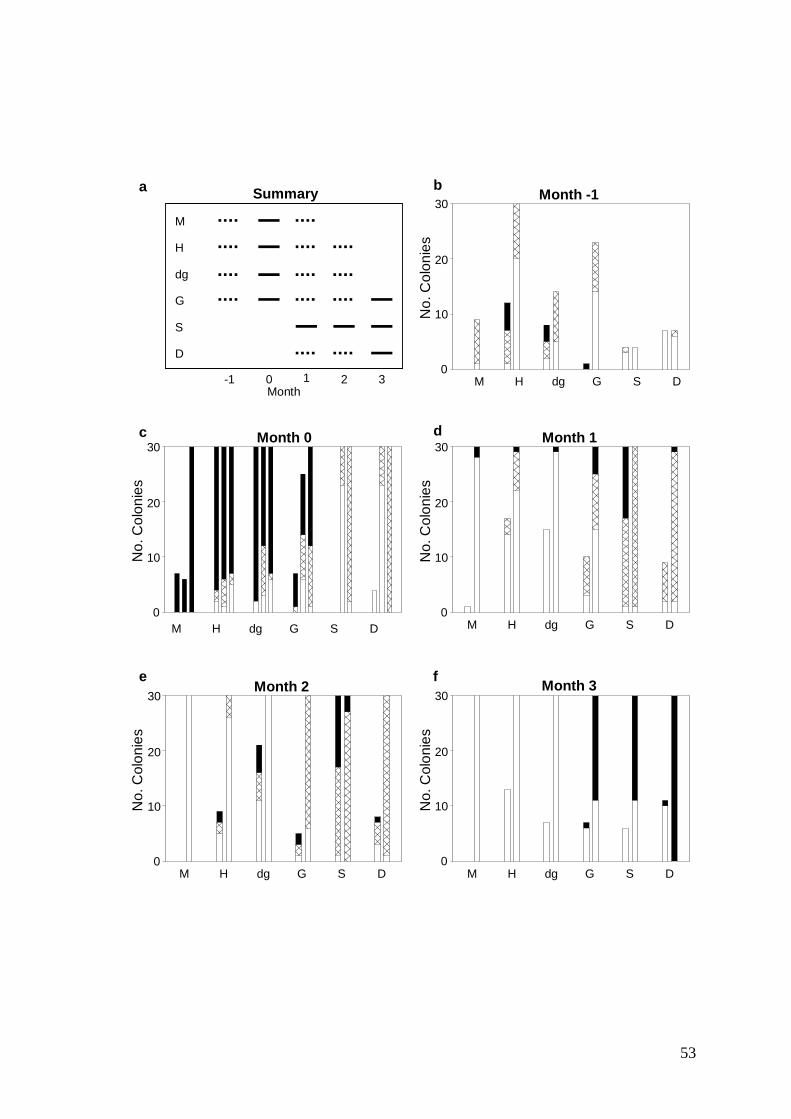
Month 3
M H G Sdg D0
10
20
30
Month 1
M H G Sdg D0
10
20
30
Month -1
M H G Sdg D0
10
20
30
Month 2
M H G Sdg D0
10
20
30
Month 0
M H G Sdg D0
10
20
30
No.
Col
onie
sN
o. C
olon
ies
No.
Col
onie
s
a b
c d
e
Month-1 2 30 1
M
H
dg
G
S
D
Summary
f
No.
Col
onie
sN
o. C
olon
ies
53

eggs during the mass spawning and three months afterwards (55 and 32% of all
colonies respectively), with ≤8% of all colonies spawning in each of the other months
of the spawning season.
Colonies of the rarer morphs were also scored when encountered during the survey
period. Colonies of “mont-hum”, “mont-gem” and “terete mont” were only recorded
with mature eggs in month 0. The majority of colonies of “hum-gem” also contained
mature eggs during month 0 (83%), with ≤7% of colonies containing mature eggs in
each of the other months surveyed. Colonies of “sam-hum” and “sam-gem” appear to
follow the timing of spawning recorded for Acropora samoensis, with sampled colonies
containing mature eggs only during months 2 and 3.
3.4.4.2 SPAWNING AND FERTILIZATION TRIALS
Time (hour) of spawning and time taken for egg-sperm bundles to break apart were
consistent for each species and morph, between different nights, months and years.
Most colonies of species and morphs spawning during the same month, spawned over
the same range of nights (Table 3.5). This suggests that the former two factors, hour of
spawning and time taken for egg-sperm bundles to separate, play an important role in
determining which morphs have the greatest potential to interbreed while ‘night of
spawning’ does not. Colonies of Acropora humilis, A. gemmifera, “hum-gem”, “dig-
gem” and “terete mont” spawned at similar times (2.5-3.5 hours after sunset), while
colonies of A. monticulosa and “mont-hum” spawned around 2-3 hours later (Table
3.5). Following spawning, time taken for egg-sperm bundles to break apart varied
substantially (Table 3.5), despite similar levels of agitation for spawn collected from
each colony. Bundles released from colonies of “dig-gem” and some colonies of A.
gemmifera broke apart almost instantaneously upon reaching the water surface.
Bundles released from colonies of “hum-gem”, “terete mont”, A. monticulosa, “mont-
hum” and some colonies of A. gemmifera broke up over a 0.5-2 hour period. In
contrast, time taken for bundles to separate from colonies of A. humilis ranged from 1-4
hours. It therefore seems that all species and morphs which spawned 2.5-3.5 hours after
sunset, except A. humilis, would be unlikely to breed with the later spawning colonies
of A. monticulosa and “mont-hum”. The longer time taken for bundles to separate for
some colonies of A. humilis suggest a greater potential for this species to interbreed
54
with A. monticulosa and “mont-hum”, both of which released egg-sperm bundles that
separated relatively quickly.
Although timing of spawning and time taken for egg-sperm bundles to break apart did
not indicate opportunities for reproductive isolation between species and morphs which
spawned after the mass spawning event, timing of these traits do provide evidence of
possible evolutionary connections for these taxa. Colonies of Acropora samoensis,
“sam-hum”, and “sam-gem” spawned 1.5-2.5 hours after sunset and A. digitifera about
3 hours after sunset (Table 3.5). Relative to colonies of A. samoensis, colonies of “sam-
hum” spawned later and egg-sperm bundles took longer to break apart, while the
bundles released from colonies of “sam-gem” separated more rapidly. These
observations suggest a distinction between colonies of A. samoensis and the
intermediate morphs “sam-hum” and “sam-gem”, and a possible link with the species
A. humilis and A. gemmifera respectively. Similarly, egg-sperm bundles released from
colonies of A. digitifera separated rapidly, as seen for colonies of “dig-gem” (Table
3.5).
Preliminary observations in this study suggest that egg size may be related to timing of
spawning, with smaller eggs being released from colonies in the second and third
months after the mass spawning compared with eggs spawned during the mass
spawning month. This proposal is based on the finer plankton mesh needed to separate
eggs and sperm from colonies that spawned in months 2 and 3. Measurement of
spawned eggs from each species and morph, for each month that they spawn, is
necessary to confirm these observations.
Levels of fertilization between colonies of the same species were high to very high
(usually >90%) and negligible between colonies of different species (Fig. 3.4). This
suggests that strong pre-zygotic fertilization barriers exist between species of the
Acropora humilis species group that spawn on the same night. Levels of fertilization
between colonies of “dig-gem” were also high to very high and negligible between
colonies of this morph and all other species and morphs, suggesting that fertilization
barriers are well developed between this and other synchronously spawning species and
55
Fig. 3.4 Boxplots indicating the range of fertilization levels (average/3 replicates) for
each cross that was tested. Interspecific and intermorph crosses are only presented in
one figure: a “dig-gem” and A. digitifera b A. monticulosa and intermediate morphs of
this species c A. gemmifera, A. humilis, A. samoensis and intermediate morphs of these
species. The top and bottom of the boxes represent the upper and lower quartiles (i.e.
50% of the data) with the horizontal line within the box indicating the median value;
whiskers at either end of the boxes indicate values within 1.5 inter-quartile ranges and
dots indicate extreme values beyond the whiskers. Codes for species and/or morphs for
each pair of colonies used in each cross are indicated on the horizontal axis and are the
same as those in Fig. 3.1. Numbers below the codes for each morph indicate the
number of crosses tested.

4
G x
G
16
H x
H
6
G x
hg
20
G x
H
7
H x
hg
16
S x
S
6
S x
sh
2
sgx
sh
80
60
40
20
0
100
% F
ertil
izat
ion
80
60
40
20
0
100
% F
ertil
izat
ion
10
M x
M
12
H x
mh
12
M x
mh
29
M x
H
2
tm x
tm
8
tm x
H
12
M x
tm
4
tm x
mh
16
M x
G
8
M x
hg
5
mh
x G
2
mh
x hg
4
tm x
G
4
tm x
hg
D x
D
9
D x
G
7
D x
hg
7
dg x
dg
18dg
x G
16dg
x H
24
dg x
hg
5
dg x
M
13
dg x
tm
6
80
60
40
20
0
100
% F
ertil
izat
ion
a
b
c
56

morphs. “Terete mont” was the only other morph that was tested for interbreeding
potential because no other pairs of colonies of the same morph spawned on the same
night. Although only two colonies were tested, the low to moderate levels of
fertilization between colonies of “terete mont” contrasts strongly with the high levels of
fertilization for all intraspecific and “dig-gem” crosses, suggesting that this morph may
be a recent hybrid. Further crosses are necessary to explore this proposal. Extremely
low levels of fertilization were recorded between colonies of A. humilis and A.
monticulosa, while moderate but never high levels of fertilization were recorded
between colonies of A. humilis and the morphs “mont-hum” and “terete mont”,
suggesting an evolutionary link between these species and morphs. Negligible levels of
fertilization between colonies of A. monticulosa, “mont-hum” and “terete mont” with
colonies of A. gemmifera and “hum-gem” suggest strong reproductive barriers exist
between these species and morphs. High levels of fertilization between colonies of
“hum-gem” and A. gemmifera and low levels with A. humilis and all other species and
morphs with which colonies of “hum-gem” were crossed, suggest that this morph
shares greatest affinity with A. gemmifera. Likewise, high levels of fertilization
between colonies of A. samoensis and “sam-hum” suggest a strong evolutionary
affinity. Moderate fertilization levels between “sam-hum” and “sam-gem” reinforce the
distinction between these morphs and A. samoensis, as is also evident in the timing of
spawning and separation of bundles.
3.5 DISCUSSION
3.5.1 EVOLUTIONARY RELATIONSHIPS WITHIN THE ACROPORA
HUMILIS SPECIES GROUP
The morphological, molecular and reproductive data presented in this study all
contribute to the interpretation of evolutionary relationships between species and
morphs in the Acropora humilis species group, with the five species and seven morphs
at different stages of speciation. Predominant trends for each morph are summarized in
Fig. 3.5. The molecular phylogenetic analysis (Fig. 3.2) provided the least resolution,
indicating two levels of divergence for this marker. Divergence was largest between A.
digitifera and other species and morphs of the A. humilis species group, while a more
recent divergence of A. monticulosa was evident from the species A. samoensis, A.
57

Fig. 3.5 Summary of predominant patterns for each species and morph of the Acropora
humilis species group, for molecular, ecological (habitat depth) and reproductive
criteria. The figure or table from which each column is summarized is indicated under
the heading of each column. The tree at left and first column of species and morph
names represent a reduced version of the tree produced from the phylogenetic analysis
of the mtDNA intergenic region. Each row in the remainder of the figure corresponds
with the species and morphs listed within the tree. Molecular data were not obtained for
“mont-hum” or “mont-gem”: these morphs are placed in dashed boxes to separate them
from the molecular tree. Depth is coded as shallow or deep, indicating the relative
depth of the habitat in which species and morphs most commonly occurred; egg
maturity is coded as after mass spawning: After MS or mass spawning: MS; spawning
time is coded as regular or late, relative to the hour of spawning of other species and
morphs; bundle separation is coded as fast, moderate or slow, relative to time taken for
bundles to break apart for colonies of each species and morph; fertilization potential
indicates which species and morphs showed potential to interbreed, based on the
fertilization data, and are coded as low, moderate or high; the morph “terete mont”
showed moderate intra-morph levels of fertilization while all other species or morphs
had high levels of intraspecific or intra-morph levels of fertilization; A. digitifera, “dig-
gem” and A. monticulosa showed no or extremely low potential to interbreed with other
species or morphs; no reproductive observations were recorded for “mont-gem”.

A. d
igiti
fera
“dig
-gem
”
“ter
ete
mon
t”
A. m
ontic
ulos
a
A. h
umili
s
“hum
-gem
”
“sam
-hum
”
A. g
emm
ifera
“sam
-gem
”
A. sa
moe
nsis
“mon
t-gem
”
“mon
t-hum
”
Mol
ecul
ar(F
ig. 3
.2)
Afte
r MS
MS
MS
MS
MS
MS
Afte
r MS
MS
& A
fter M
S
Afte
r MS
Afte
r MS
MS
Egg
Mat
urity
(Fig
. 3.3
)
Reg
ular
Reg
ular
Reg
ular
Late
Reg
ular
Reg
ular
Reg
ular
Reg
ular
Reg
ular
Reg
ular
Late
Spaw
ning
Tim
e(T
able
3.5
)
Shal
low
Shal
low
Shal
low
Shal
low
Shal
low
Shal
low
Dee
p
Shal
low
Dee
p
Dee
p
Shal
low
Shal
low
Dep
th(F
ig. 3
.1)
Fast
Fast
Mod
erat
e
Mod
erat
e
Slow
-m
oder
ate
Mod
erat
e
Mod
erat
e
Mod
erat
e
Fast
Mod
erat
e
Mod
erat
e
Bund
leSe
para
tion
(Tab
le 3
.5)
Ferti
lizat
ion
Pote
ntia
l(F
ig. 3
.4)
Intra
: mod
erat
e
“mon
t-hum
”: lo
w
A. g
emm
ifera
: hig
h
A. sa
moe
nsis
: hig
h“s
am-g
em”:
mod
erat
e
“hum
-gem
”: h
igh
“sam
-hum
”: m
oder
ate
“sam
-hum
”: h
igh
A. h
umili
s: lo
w
----
----
----
----
-
----
----
----
----
-
----
----
----
----
-
58

humilis, A. gemmifera and morphs of these species. The reproductive data provided
greater resolution, indicating that temporal and prezygotic reproductive barriers are
important mechanisms, maintaining and possibly structuring species boundaries in the
A. humilis species group. Temporal reproductive isolation is apparent at the scale of
months over the summer spawning season, based on timing of gamete maturity (Fig.
3.3) and hours within the mass spawning (Table 3.5). Evidence of reproductive
isolation based on night of spawning was not apparent, with most colonies of species
and morphs spawning during the same month, also spawning over the same range of
nights (Table 3.5). High levels of intraspecific and negligible levels of interspecific
fertilization potential confirmed that the species of the A. humilis species group are
valid species, while fertilization potential between species and morphs corresponded
with apparent evolutionary affinity based on morphological appearance.
Phylogenetic analysis of the mtDNA intergenic region resolved two distinct clades
within the Acropora humilis species group, with sequences from colonies of A.
digitifera and “dig-gem” forming clade I and sequences from all other species and
morphs forming clade II (Fig. 3.2). This distinction between the two clades was
corroborated by the results of the breeding experiments, which demonstrated that the
potential for colonies of A. digitifera or “dig-gem” to interbreed with the species or
morphs in clade II against which they were tested were negligible (Fig. 3.4a).
Within clade I, sequences from the colonies of Acropora digitifera and “dig-gem” were
indistinguishable. Morphologically colonies of this species and morph are very similar,
differing in that colonies of A. digitifera have thin branches compared with the thicker
and more conical shaped branches of “dig-gem” (Table 3.1). Live colonies of this
species and morph also share identical patterns of colour variation (Table 3.1).
Considering the molecular and morphological similarities, it was surprising to discover
that an almost complete temporal reproductive barrier separates this species and morph,
with “dig-gem” predominantly spawning during the mass spawning month and A.
digitifera spawning three months after the mass spawning. These differences in timing
of spawning indicate that A. digitifera and “dig-gem” are unlikely to interbreed at
Lizard Island, although fertilization experiments are necessary to test whether they
could interbreed if colonies spawned at the same time. The other species with which the
morph “dig-gem” shares morphological characters is A. gemmifera, which also has
59

conical shaped branches and radial corallites whose shape merges with that of “dig-
gem” (Table 3.1). No temporal reproductive barrier was evident between “dig-gem”
and A. gemmifera, with both spawning simultaneously during the mass spawning.
However, inter-fertilization potential was negligible (Fig. 3.4a), indicating that a pre-
zygotic barrier reproductively isolates them. Based on the combined evidence of the
morphological, molecular and reproductive results, three hypotheses could explain the
origin of “dig-gem”. Firstly, this morph may have evolved from within the species A.
digitifera due to or reinforced by a differential timing of spawning. A second
hypothesis is that A. digitifera evolved from “dig-gem”, also as a result of or reinforced
by a differential timing of spawning. A third hypothesis is that “dig-gem” may be
derived from A. digitifera and A. gemmifera, through hybridization. Hybridization
between A. digitifera and A. gemmifera would be most likely to occur in the third
month after the mass spawning when most colonies of A. digitifera and many colonies
of A. gemmifera spawned. Irrespective of the evolutionary origin of “dig-gem”, it now
comprises a discrete evolutionary unit, which is more abundant than any other species
or morph of the A. humilis species group at Lizard Island (Fig. 3.1). Analysis of
molecules involved in gamete recognition, e.g. bindin or lysin (Palumbi 1994), would
be most useful for testing each of the three hypotheses and resolving the evolutionary
origin of “dig-gem”.
Within clade II of the molecular phylogenetic analysis, sequences from colonies of
Acropora monticulosa grouped in a subclade (clade IIa) with high bootstrap support
(95%), suggesting that this species has also diverged from other species within the A.
humilis species group (Fig. 3.2). This apparent divergence of A. monticulosa is
congruent with the extremely low potential of this species to interbreed with other
species in clade II (Fig. 3.4), as well as the late spawning time of this species (Table
3.5) forming a temporal reproductive barrier from other mass spawning species.
Colonies of A. monticulosa were the most synchronized in timing of spawning
compared with all other species within the A. humilis species group, spawning almost
exclusively in the mass spawning month during a time interval of just over one hour.
This species consistently spawned 5-6.25 hours after sunset, while most species of
Acropora spawn 2-3.5 hours after sunset, as recorded in this study (Table 3.5) and by
Babcock et al. (1986), with the latest previous recorded spawning time for any species
of Acropora being 3.8 hours after sunset (Babcock et al. 1986). The separation in
60
timing of spawning of A. monticulosa from other species monitored in this study by 2-3
hours, and 1-2 hours after the latest time recorded for any other congeneric species
provides convincing evidence that this species is reproductively isolated by temporal
barriers. In comparison, temporal reproductive isolation has also been proposed for
other species of Acropora (van Oppen et al. 2001; Fukami et al. 2003) with separation
times ranging from 0.5-3 hours (Babcock et al. 1986; Hayashibara et al. 1993; Fukami
et al. 2003). Temporal reproductive isolation has also been suggested in the
Montastraea annularis species complex, with M. franksi spawning 1-2 hours earlier
than M. annularis and M. faveolata (Knowlton et al. 1997; Szmant et al. 1997).
The species Acropora monticulosa appears to share greatest evolutionary affinity with
A. humilis, with several factors supporting this proposal. It is feasible that the prolonged
period of separation for egg-sperm bundles released from colonies of A. humilis, and
the later spawning time of A. monticulosa (Table 3.5) has provided or maintained an
opportunity for these species to continue to interbreed, that does not exist for A.
monticulosa and other species of the A. humilis species group. Colonies of the morph
“mont-hum” were the only other colonies to spawn at the later time recorded for A.
monticulosa, while “mont-hum” egg-sperm bundles also separated over a 30-60 min
interval (Table 3.5). Levels of fertilization between A. monticulosa and colonies of A.
humilis and morphs of these species were extremely low, but slightly higher than levels
with any other species or morphs, supporting the proposed divergence of A.
monticulosa but closest evolutionary affinity with A. humilis. Meanwhile moderate
levels of fertilization were recorded between colonies of A. humilis and the morphs
“mont-hum” and “terete mont”. Based on these fertilization records and the
morphological affinities of these morphs, it is possible that they may be of hybrid
origin, derived from A. humilis and A. monticulosa and able to backcross with colonies
of A. humilis but rarely with colonies of A. monticulosa. The low to moderate levels of
fertilization between two colonies of “terete mont”, in contrast to the high levels of
fertilization for all other intra-species and intra-morph crosses provides additional
evidence that this morph may be a hybrid, in which sterility barriers partially reduce the
potential for colonies of this morph to inter-breed. Further support for the hybrid origin
of the morph “terete mont” is indicated in the molecular phylogeny, with the sequence
for this morph having low bootstrap support and grouping neither within clade IIa or
IIb.
61

Sequences from colonies of Acropora humilis, A. gemmifera, A. samoensis and morphs
of these species formed a second subclade (IIb) also with high bootstrap support (95%),
in the molecular phylogenetic analysis (Fig. 3.2). There was little further differentiation
between sequences within this subclade, suggesting a close evolutionary relationship
between these species relative to A. digitifera and A. monticulosa. The existence of
intermediate morphs between A. humilis, A. gemmifera and A. samoensis also suggests
a close relationship between these species, with the morphological continuum between
A. humilis and A. gemmifera (this study and Wallace (1999)) and molecular evidence
(Wolstenholme et al. 2003) suggesting these two species are closely related. The
consistent late maturation of gametes in colonies of A. samoensis also suggests this is
the most distinct of the three species. Greatest evolutionary affinity of “sam-hum” and
“sam-gem” with A. samoensis is suggested by morphological similarity and supported
by the same late maturation of gametes in the second and third months after the mass
spawning. High levels of fertilization between A. samoensis and “sam-hum” suggest
reproductive barriers have not formed between this species and morph. Meanwhile,
substantially lower levels of fertilization between “sam-hum” and “sam-gem” suggests
that their morphological differences reflect the reduced breeding compatibility and a
possible hybrid status for these morphs.
Further investigation of egg size may contribute to understanding factors determining
timing of spawning. Preliminary evidence from this study indicates that the relatively
small eggs in the species Acropora samoensis and A. digitifera may be related to timing
of spawning. These species do not appear to be closely related, based on the molecular
data and morphological appearance. They also differ in the habitats that they occupy,
with A. samoensis mostly occurring in slope and lagoonal habitats and A. digitifera on
reef flats. Therefore, the smaller eggs in these species do not appear to be attributable to
environmental conditions. Measurement of eggs released from colonies of each species
and morph, particularly those that spawned in different months, would clarify whether
there is a correlation between egg size and species/morph or timing of spawning. Such
patterns may have been overlooked in previous studies, which only measured egg size
in preserved branch samples, irrespective of timing of egg maturity and spawning.
62

3.5.2 TAXONOMIC IMPLICATIONS
Species of corals are well known to be morphologically variable, with boundaries
between many species remaining unclear (e.g. Lang 1984). This study demonstrates the
value of working at the morph level for clarifying evolutionary boundaries in corals.
Recognition of morphs within or between species reduces taxonomic error as a result of
‘forcing’ colonies into incorrect or inappropriate species categories. The most
outstanding case in this study is the morph “dig-gem”, which was substantially more
abundant than any other species or morph at Lizard Island. According to the current
taxonomy, this morph could have been identified as either Acropora digitifera or A.
gemmifera (Table 3.1), but it is distinct from both of these species. Identification of this
morph as either of these species would conceal important evolutionary distinctions
between these species. If colonies of “dig-gem” were identified as A. digitifera, it
would appear that this species spawns from months –1 to month 3, with no temporal
reproductive barrier isolating it from other species and morphs of the A. humilis species
group. Conversely, if colonies of “dig-gem” were identified as A. gemmifera, DNA
sequences for the marker examined in this study would be present in both clades I and
II for this species and fertilization levels would range from 0 to 100%. In the case of the
other species examined in this study, the most serious consequences of not
distinguishing the species and morphs would be the interpretation of substantially
broader levels of fertilization for each species, which in many cases would range from
0-100%.
Accurate identification of morphological species and morphs provided the foundation
for interpreting relationships between the species and morphs examined in this study.
This is in contrast to the conclusions of van Oppen et al. (2001), who state that “skeletal
morphology may have been effectively uncoupled from the genotype in the case of
Acropora evolution” and in the case of A. humilis, “morphology may have arisen
several times independently”. The current study demonstrates that close examination of
morphological boundaries, using molecular and breeding criteria, is a powerful
technique for resolving evolutionary boundaries in corals, as proposed by Willis
(1990), Stobart (2000) and Wolstenholme et al. (2003). In addition, the morphs
provided a valuable tool for testing possible evolutionary links between species, while
the absence of intermediate morphs between other species, e.g. between A.
monticulosa, A. samoensis and A. digitifera corresponds with the low potential of these
63
species to interbreed. This is the first study to assess the potential of species of the A.
humilis group to interbreed, and therefore comparison with other studies that have
tested fertilization potential under laboratory conditions is not possible for these
species. Sperm competition experiments would provide a further test of prezygotic
barriers and therefore evolutionary boundaries (Márquez et al. 2002a), between species
and morphs. This could be done for pairs of species and morphs, which showed no
potential to interbreed, to confirm the existence of prezygotic barriers. In cases where
there was potential for interbreeding, for example between A. gemmifera and “hum-
gem”, sperm competition experiments would establish whether fertilization potential
varied between the same and different morphological groups.
Intermediate morphologies and breeding potential are not conclusive evidence of
hybrid status. For example, many hybrids exhibit extreme (positive or negative)
phenotypic characters relative to parent species (reviewed in Rieseberg et al. 1999). To
confirm the evolutionary affinities of morphs recognized in this study, it will be
necessary to examine the species and morphs using a combination of nuclear and
mitochondrial molecular markers. This has recently been demonstrated for Acropora
prolifera. At least two morphs of A. prolifera, both of which are morphologically
intermediate between the species A. cervicornis and A. palmata, are now known to be
of hybrid origin and derived from these species (Vollmer and Palumbi 2002).
Examination of chromosome number is also likely to contribute to understanding
evolutionary relationships between the species and morphs examined in this study.
Kenyon (1997) concluded that polyploidy, resulting from the combination of sets of
chromosomes from different species during hybridization events is a likely source of
gametic incompatibility between species in the genus Acropora. Evaluation of
chromosome numbers in species as well as morphs may therefore also provide an
important tool for tracing evolutionary relationships within the genus Acropora and
possibly other groups of corals.
The variation between sequences within individual colonies was surprising, given that
sequences from mitochondrial markers are not expected to vary at this level (Avise
2000). Two patterns contributed to this variation. Firstly, although repetitive sequences
are a typical feature of control regions (van Oppen et al. 2002a and references within),
the occurrence of repeat sequence blocks in this study was not consistent within
64

individuals. Repeat sequence blocks have been reported for other species of Acropora,
but no other cnidarians for which data are available (van Oppen et al. 2002a), while
patterns of intra-individual variation have not been examined in other studies of
cnidarians. Further research is necessary to understand the evolutionary significance of
these repeat regions (van Oppen et al. 2002a) and whether they have the potential to
contribute to the interpretation of evolutionary relationships in the genus Acropora (MS
in prep., Wolstenholme et al.). Secondly, differences in sequences (excluding the repeat
regions) from single individuals, varied by up to 10 base pairs (Table 3.2). Although
some of this variation is likely to be due to PCR error (Saiki et al. 1985), sites which
varied as a result of PCR error and those that are due to intra-individual polymorphisms
cannot be distinguished. Further interpretation of this variation, within an evolutionary
context, is therefore not possible.
This study was restricted to the Acropora humilis species group at Lizard Island on the
Great Barrier Reef, Australia. Species within this group and other species groups in the
genus Acropora were arbitrarily assigned based on apparent morphological similarity
(Veron and Wallace 1984; Wallace 1999). It is possible that the species and morphs in
this species group also share evolutionary affinities with other species in the genus
Acropora. This particularly applies to A. digitifera, given the clear distinction between
this species and other species of the A. humilis species group in this study. Phylogenetic
analysis of morphological characters of the genus Acropora suggests that A. digitifera
may be most closely related to species of the Acropora nasuta and A. divaricata species
groups (Wallace 1999). Broader analyses, which examine additional species within the
genus Acropora using complementary techniques as in this study, are necessary to
explore this possibility. It is likely that the status of evolutionary relationships between
species and morphs will vary in different geographic locations (e.g. Hayashibara and
Shimoike 2002). Therefore, such projects must also be conducted at a broad geographic
scale before the taxonomic status of the morphs and the boundaries of current species
can be fully resolved.
This study demonstrates that morphology is a valuable tool for interpreting
evolutionary relationships in the Acropora humilis species group. This is likely to also
be true for other species of Acropora and other coral taxa. In particular, morphs may
indicate active zones of speciation (e.g. between A. humilis and A. gemmifera) or
65

hybridization (e.g. between A. digitifera and A. gemmifera), which can then be tested
using genetic and reproductive criteria. Confirmation of morphology as an informative
character of evolutionary boundaries is of great significance because most coral
research projects rely on morphology as the primary tool for recognizing species.
66

CHAPTER 4: MORPHOLOGICAL VARIATION AND BIOGEOGRAPHY OF
SPECIES AND MORPHS OF THE ACROPORA HUMILIS SPECIES GROUP
4.1 INTRODUCTION
Morphological appearance or external form is the primary and most easily accessible
means for defining and recognizing species (Stuessy 1990; Maddison 1996). Virtually
all species of plants and animals are defined on the basis of morphological
differentiation and once species have been defined, they are most readily recognized in
other fields of research (e.g. genetics, biogeography, biology, ecology, physiology) on
the basis of their morphological appearance. Recently, species have also been proposed
on the basis of non-morphological criteria e.g. using genetic differentiation. In some
cases, subsequent examination has revealed that these taxa can also be distinguished
morphologically, while others appear to have not diverged morphologically.
Irrespective of the level of morphological differentiation, it is essential that species are
defined accurately according to the current state of knowledge (Knowlton and Jackson
1994). This is necessary so that advances in the interpretation of evolutionary
relationships can be incorporated into the current taxonomic framework, enabling them
to be assessed in future systematic studies and examined in other fields of research. To
ensure results of past studies can be verified and compared in future research projects,
voucher specimens need to be deposited in museum collections (Paulay 1997; Wheeler
2001).
In scleractinian corals, skeletal characters are most important for defining and
recognizing species. The taxonomy of scleractinian corals is based almost entirely on
skeletal characters (e.g. Wells 1956; Veron and Wallace 1984; Wallace 1999) and
corresponding type and voucher specimens are dried skeletons, for which until recently,
tissue samples were not preserved and live appearance was not recorded. The skeleton
also forms the structure of all colonies, directly reflecting the morphological
appearance of living corals. In addition, although the fossil record of scleractinian
corals is extensive, it only provides evidence of the skeletal appearance of fossil taxa.
Skeletal characters are therefore fundamental to the recognition and study of extant and
fossil corals, connecting all fields of research on scleractinian coral species.
67

Despite the fundamental importance of skeletal characters in the taxonomy of
scleractinian corals, defining species on the basis of these characters has been
problematic, due to high levels of polymorphism in many taxa (reviewed in chapters 1-
3). Intraspecific polymorphism has typically been attributed to environmental
influences (e.g. Veron and Pichon 1976), but may also be an important indicator of
recent or ongoing microevolutionary processes within or between species (Sattler and
Rutishauser 1997; Wiens 1999). It is possible therefore, that unresolved boundaries
between morphologically similar species of scleractinian corals may be highly
informative, with shared or intermediate morphological characters indicating
incomplete speciation or evidence of hybridization. Similarly, discrete morphs within
currently defined species may be evidence of recent divergence (chapter 3).
Morphometric analyses have been used in numerous studies to examine morphological
variation in scleractinian corals. These investigations have mostly focused on the
Faviidae (Montastraea and Platygyra) and Poritidae (Porites), with few or no studies
being conducted in other families. Morphological variation has been extensively
examined within the genus Montastraea. Colonies previously assigned to one
polymorphic species, M. annularis, are now recognized as this and two previously
synonymised species, M. faveolata and M. franksi, on the basis of colony, corallite and
septal characters (Weil and Knowlton 1994), as well as life-history, ecological and
genetic differences (Knowlton et al. 1992; Knowlton et al. 1997). Morphometric
analysis of these three extant species and fossil colonies of the genus Montastraea
demonstrates that the extant species have been morphologically distinct for at least 2-4
million years, while evolutionary relationships of additional fossil species remain
unresolved, pending further analysis (Budd and Klaus 2001). Within the genus
Platygyra, morphometric analysis of corallite and septal characters confirm five
described species and two additional morphospecies on the Great Barrier Reef,
Australia are morphologically distinct, and that their appearance is independent of
environmental influences (Miller 1994). However, these species do not appear to be
separated by reproductive or genetic boundaries, indicating that evolutionary barriers
have not formed between them (Miller and Babcock 1997; Miller and Benzie 1997).
Defining morphological species boundaries in the genus Porites has been difficult
because of polymorphic variation as well as the small size of taxonomic skeletal
characters (Veron and Pichon 1982). Use of morphometric colony and corallite
68

characters has been useful in resolving boundaries within the genus Porites with
complete resolution in one study (Weil 1992) and 90% agreement between
morphological and genetic boundaries in another (Budd et al. 1994). Morphometric
differences, supported by electrophoretic and reproductive criteria, confirmed the
validity of three species in the genus Pavona (Maté 2003) and two in the genus
Montipora (Stobart 2000). Despite the widespread abundance and large number of
species of Acropora, only one preliminary study has examined species boundaries in
this genus using morphological characters. In this study, species of the A. selago group
were differentiated morphologically, using branch and axial corallite characters
(Wallace et al. 1991). However, this study did not examine variability between colonies
within each species.
Previous studies that have examined species boundaries in corals, have been on a
restricted biogeographic scale, and often limited to a single location. However, to gain a
greater understanding of the evolutionary relationships between species, it is necessary
to examine patterns at a broad biogeographic scale (Hughes et al. 2002). Analysis of
broad-scale biogeographic patterns of morphological variation in corals, within and
between species, will provide a foundation upon which non-morphological criteria can
be used to test the extent to which morphological variation is indicative of
microevolutionary processes (Wiens 1999) and whether the same evolutionary
processes are occurring between the same combinations of species in different
locations. This will enable the delineation of boundaries between species, across their
entire distributional range, to be more accurately defined. It will also enable the
evolutionary significance of morphological variants within currently defined species to
be resolved.
In this chapter, I assess patterns of morphological variation in the Acropora humilis
species group, for several west and central Pacific locations. Qualitative characters are
used to identify species as well as interspecific and intraspecific morphs.
Morphological variation for each species is defined in a discriminant analysis of
morphometric characters. The results of the discriminant analysis are then used to
determine morphological affinities of colonies of the interspecific and intraspecific
morphs, by calculating the classification probabilities of each colony. Finally, museum
collections of samples from the entire Indo-Pacific region are examined to determine
69

the geographic distribution of each species and morph, and whether additional morphs
of the A. humilis species group not recorded in the field surveys of this study could be
recognized.
4.2 METHODS
4.2.1 COLLECTION OF SAMPLES
Samples of the Acropora humilis species group were collected in seven regions from
the western to central Pacific, in Taiwan, Indonesia, Australia, Papua New Guinea,
Solomon Islands, American Samoa and French Polynesia. Sampling locations within
each region are listed in Table 4.1. The sampling units used in this study were putative
morphs, distinguished using morphological characters, as described in chapters 2 and 3.
Table 4.1 Regions and locations where corals were sampled.
Regiona Location Latitude Longitude Taiwan (Tai) 1 Taiwan Strait, Penghu Islands 23038'N 119033'E 2 Southern Taiwan, Wanlitung 22004'N 120043'E 3 Southern Taiwan, Nan-Wan Bay 22000'N 120048'E 4 Northern coast 25012'N 121037'E 5 Lanyu 22010'N 121031'E Indonesia (Ind) 1 Central Sulawesi, Togian Islands 00020'S 121049'E 2 North Sulawesi, Malibagu 00021'N 124003'E 3 North Sulawesi, Bunaken National Park 01038'N 124045'E 4 North Sulawesi, Lembeh Strait 01029'N 125014'E Australia (Aus) 1 GBR, Lizard Island 14040’S 145028’E Papua New Guinea (PNG) 1 New Britain, Kimbe Bay 05025'S 150005'E Solomon Islands (Sol) 1 New Georgia Islands, Ghizo Island 08006'S 156053'E American Samoa (Sam) 1 Tutuila 14020'S 170048'W 2 Ofu 14011'S 169041'W 3 Olosega 14011'S 169037'W French Polynesia (Pol) 1 Society Islands, Moorea 17035'S 149050'W a Abbreviations for each region (used in Tables 2, 4 and 5) are given in parentheses
The colonies analysed in chapters 2 and 3 (from American Samoa and Lizard Island,
respectively) are included in this chapter. The putative morphs include known species,
70

intermediate morphs and sub-morphs. The characters used to define the species are
based on the descriptions for each of these species (Wallace 1999). The intermediate
morphs are characterized by intermediate morphologies that prevented colonies from
being confidently assigned to a particular species, and are named using abbreviations
from the species with which they appear to share most morphological characters. The
sub-morphs formed recognizable units within the range of morphological variation of
single species and are named using an abbreviation of this species name and a
morphological feature or the location from which it was collected. Habitats and
locations in which species and morphs were recorded, and characters used to
distinguish them are summarized in Tables 4.2 and 4.3 respectively. Colonies were
sampled following the protocol described in chapter 2.
4.2.2 MORPHOMETRIC ANALYSIS
Five colonies of each morph, from each region in which it occurred, were usually used
in the analyses. In cases where fewer than five colonies were recorded from a region,
all colonies were used in the analyses (Table 4.2). A total of 226 samples were
examined in this analysis. All morphological samples used in this study are deposited at
the Museum of Tropical Queensland, Townsville, Australia. Morphometric characters
used in this study are the same as those used in chapter 2 (Table 2.1). Analyses were
performed using the statistical package SPSS 10.0.5.
Variation within and between all species and morphs was compared for each
morphometric character (Fig. 4.3). Morphological relationships between the species A.
samoensis, A. humilis, A. globiceps, A. gemmifera, A. monticulosa and A. digitifera
were also assessed in a Bayesian linear discriminant analysis of the morphometric
variables. Variables were selected in the discriminant analysis using the stepwise
method. The species A. retusa and A. multiacuta were not included in this analysis
because they were clearly morphologically distinct from all other species and morphs
examined in this study (Table 4.3a and Fig. 4.3). Morphological affinities between the
species in the discriminant analysis and the intermediate and sub-morphs were tested by
determining the probability of classification of each morph colony into the categories
71

Table 4.2a Habitats and locations in which species were recorded.
Species Habitat Recorded Locationa
nb
A. globiceps exposed reef slopes, just subtidal to ~15m
Pol: 1 5
A. humilis exposed reef slopes and
lagoons, just subtidal to >20m but usually <10m
Tai: 2, 3, 4, 5 Ind: 3, 4 Aus: 1 PNG: 1 Sol: 1 Sam: 1, 2, 3
5 5 5 5 5 5
A. samoensis reef slopes and lagoons,
subtidal to > 20m, usually in calm or protected habitats
Ind: 1 Aus: 1 PNG: 1 Sol: 1
3 5 5 5
A. gemmifera exposed reef slopes and
lagoons, just subtidal to ~10m Ind: 1, 2, 3, 4 Aus: 1 PNG: 1 Sol: 1
5 5 5 5
A. monticulosa shallow, wave exposed reef
crests to ~4m Tai: 5 Aus: 1 Sol: 1 Sam: 1
2 5 3 4
A. digitifera shallow, exposed reef crests
and flats to ~4m Tai: 2, 3, 5 Ind: 1, 2, 3 Aus: 1 PNG: 1 Sol: 1
3 5 5 5 5
A. retusa exposed reef slopes and
lagoons, just subtidal to ~15m Pol: 1 5
A. multiacuta protected reef slopes and
lagoons, just subtidal to ~20m Ind: 1 5
a Recorded locations in bold indicate colonies from these locations were used in the
analyses. Location numbers are listed in Table 4.1; b n is the number of colonies used in
the analyses.
72

Table 4.2b Habitats and locations in which morphs were recorded.
Morph Habitat Recorded Location a
n b
“hum-gem” exposed reef slopes and lagoons, just subtidal to >20m but usually < 10m
Ind: 1 Aus: 1 PNG: 1
3 5 5
“hum-gem plate” exposed reef slopes to ~10m Tai: 1, 2, 3 5 “sam-hum” as for A. samoensis Ind: 1
Aus: 1 PNG: 1 Sol: 1
4 4 3 3
“sam-gem” as for A. samoensis Ind: 1
Aus: 1 Sol: 1
4 4 1
“mont-hum” shallow, exposed reef crests
and flats to ~4m Aus: 1 Sol: 1
5 2
“mont-gem” as for A. monticulosa Tai: 2, 3, 5
Ind: 2, 3, 4 Aus: 1 PNG: 1 Sol: 1 Sam: 1, 2
5 5 3 5 5 5
“dig-gem” as for A. digitifera Aus: 1 5 “Penghu hum” turbid reef slopes, subtidal to
~10m Tai: 1 5
“fine sam” protected reef slopes and
lagoons, subtidal to ~10m Ind: 1 5
“terete mont” as for A. monticulosa Aus: 1
Sol: 1 3 1
“digitate mont” as for A. monticulosa Tai: 5
Sol: 1 Sam: 3
2 1 2
“Samoan dig” shallow, wave exposed crests
to ~4m Sam: 1 5
“encrusting dig” as for A. digitifera Tai: 5 1 a Recorded locations in bold indicate colonies from these locations were used in the analyses.
Location numbers are listed in Table 1; b n is the number of colonies used in the analyses.
73

defined for the six species in the discriminant analysis. The classification coefficients
derived from the discriminant analysis were used to calculate the classification
probabilities for individual colonies, using the equation:
P f j | xo@@@Q
d e
P j
b c
P xo@@@Qb c
j
L
L
L
c
Xj 1
g
P j
b c
P x o@@@Q j
L
L
L
c
d
ffffffffffffffffffffffffffffffffffffffffffffffffffffffffffffffffffffffffffff
where πj is the species category, is the classification vector (morphometric values
for each colony), g is the maximum number of categories (i.e. 6) and j ranges from 1 to
the maximum number of categories. The classification probability was not calculated for
the sub-morph “encrusting dig” because morphological characters of this morph were
not directly comparable with the other species and morphs in this study, due to its
xo@@Q
peculiar growth form (Table 4.3c).
4.2.3 INDO-PACIFIC MORPHOLOGICAL VARIATION AND DISTRIBUTION
Collections from the entire Indo-Pacific region, at the Museum of Tropical Queensland,
of each of the eight species of the Acropora humilis species group were examined to
compare morphological variation and map the geographic distribution of the morphs
recognized in this study. These collections were also examined to determine if additional
morphs not recorded in this study were evident. Specimens in the collections (1267
specimens) were assigned to each species or morph, using the same skeletal
morphological characters that were used to identify colonies in this study (Table 4.3).
4.3 RESULTS
4.3.1 SPECIES AND MORPHS
In field surveys of this project, 21 putative morphs were recognized within the
Acropora humilis species group (Table 4.3). Eight of the putative morphs correspond
with the known species in this group. These are A. samoensis (Brook 1891), A. humilis
(Dana 1846), A. globiceps (Dana 1846), A. gemmifera (Brook 1892), A. monticulosa
(Brüggemann 1879), A. digitifera (Dana 1846), A. retusa (Dana 1846) and A.
multiacuta (Nemenzo 1967). The remaining putative morphs comprised seven
74

Table 4.3a Species in the Acropora humilis species group and characters used to identify them a.
Species Growth Form Branch Shape Axial Corallites Radial Corallites b Colony Colour A. globiceps corymbose thick, terete large, wall thin,
funnel-shaped calice
one size, large (radial corallites around axial corallite are quite large in comparison with A. humilis), nariform to tubo-nariform, crowded
brown, edges of corallites paler in colour, polyps white
A. humilis corymbose thin to thick, terete large to very
large one size, large, nariform to tubo-nariform, crowded to not crowded
brown, green, blue, yellow or combinations of these colours, corallites may be paler at edges, polyps are white, green or pale brown
A. samoensis caespito-
corymbose to corymbose
thin, terete large one size, size variable, tubular to tubo-nariform, not crowded
brown usually with a blue, orange or yellow tinge, edges of corallites often paler in colour, polyps white, yellow or pale brown
A. gemmifera corymbose thick, conical large two sizes, large, dimidiate
(sometimes flaring) to tubo-nariform, crowded
brown usually with a blue or orange tinge, corallites may be paler at edges, polyps white or pale brown
A. monticulosa digitate or
irregular digitate to arborescent
very thick, very conical
small one to mixed sizes, small, nariform to tubular, crowded
brown with a blue, yellow or green tinge all over, polyps pale brown
A. digitifera corymbose thin, terete small mixed sizes, small or large, flaring
dimidiate to flaring lips, crowded pale to dark brown sometimes with paler blue or paler brown branch tips, polyps dark or pale brown
A. retusa corymbose terete, spiky, long
and exsert radial corallites
small mixed sizes, large, elongate tubes, crowded
brown sometimes with a blue tinge, edges of corallites may be paler in colour, polyps not seen
A. multiacuta irregular corymbose thin, tapering very elongate
but small diameter
mixed sizes, small, tubular or tubular appressed, widely and unevenly scattered, most at base of branches
brown with a blue, pink or cream tinge, polyps not seen
a Characters are described relative to other species and morphs, with those that are most important for distinguishing each species highlighted in bold. b Two size categories of radial
corallites are given. The first category refers to the size range of radial corallites within that species: corals with two sizes have subimmersed and regular sized corallites; corals with
mixed sizes have corallites that range in size from subimmersed to regular. The second category refers to the size of radial corallites relative to other species and morphs.
75
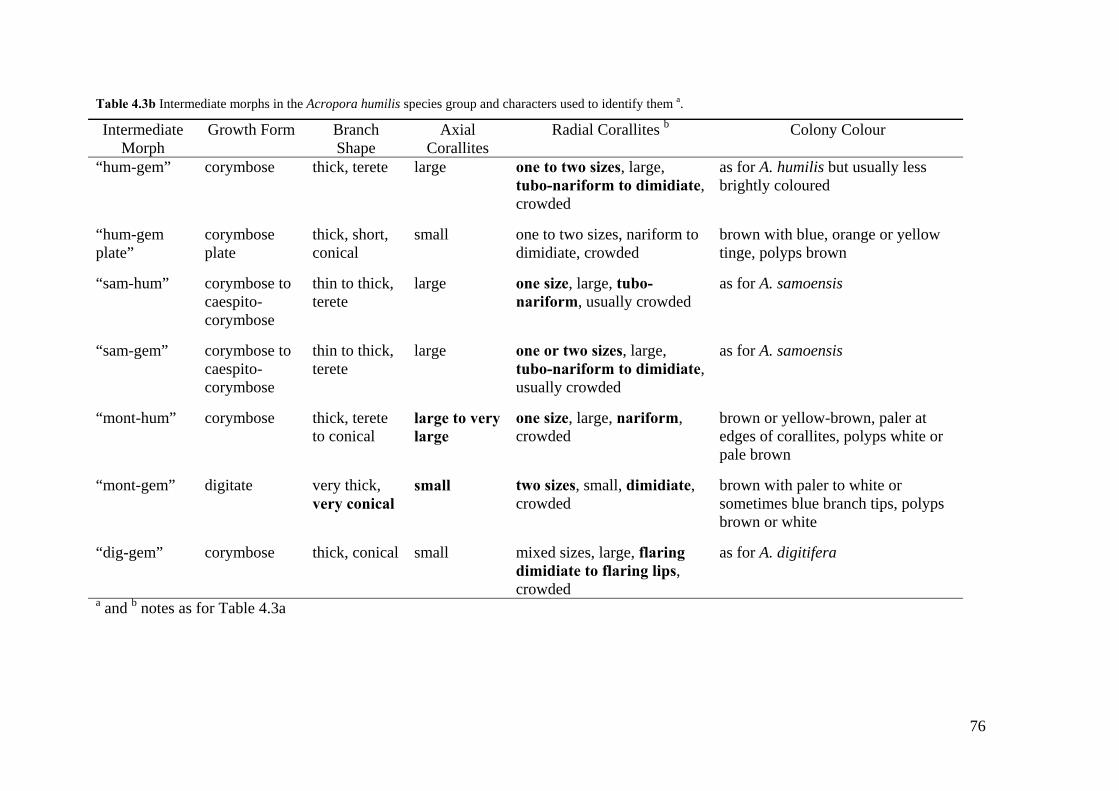
Table 4.3b Intermediate morphs in the Acropora humilis species group and characters used to identify them a.
Intermediate Morph
Growth Form Branch Shape
Axial Corallites
Radial Corallites b Colony Colour
“hum-gem” corymbose thick, terete large one to two sizes, large, tubo-nariform to dimidiate, crowded
as for A. humilis but usually less brightly coloured
“hum-gem plate”
corymbose plate
thick, short, conical
small one to two sizes, nariform to dimidiate, crowded
brown with blue, orange or yellow tinge, polyps brown
“sam-hum” corymbose to
caespito-corymbose
thin to thick, terete
large one size, large, tubo-nariform, usually crowded
as for A. samoensis
“sam-gem” corymbose to
caespito-corymbose
thin to thick, terete
large one or two sizes, large, tubo-nariform to dimidiate, usually crowded
as for A. samoensis
“mont-hum” corymbose thick, terete
to conical large to very large
one size, large, nariform, crowded
brown or yellow-brown, paler at edges of corallites, polyps white or pale brown
“mont-gem” digitate very thick,
very conical small two sizes, small, dimidiate,
crowded brown with paler to white or sometimes blue branch tips, polyps brown or white
“dig-gem” corymbose thick, conical small mixed sizes, large, flaring
dimidiate to flaring lips, crowded
as for A. digitifera
a and b notes as for Table 4.3a
76

Table 4.3c Sub-morphs in the Acropora humilis species group and characters used to identify them a.
Sub-Morph Growth Form
Branch Shape Axial Corallites
Radial Corallites a Colony Colour
“Penghu hum”
corymbose thin terete
small one size, large, nariform to tubo-nariform, crowded
brown, sometimes with blue, orange or cream tinge, paler to white axials, polyps green or brown
“fine sam” caespitose thin
terete small mixed sizes, large,
tubular, not crowded pale brown with blue or yellow tinge, polyps bright yellow
“terete mont” digitate very thick,
sometimes conical
large mixed sizes, small, dimidiate, crowded
brown with blue or green corallites, polyps white
“digitate mont”
digitate terete, short, evenly sized
small mixed sizes, small, nariform to tubo-nariform, crowded
as for A. digitifera
“Samoan dig”
digitate thin, terete small mixed sizes, small, lipped, crowded
as for A. digitifera
“encrusting dig”
digitate barely developed
small immature as for A. digitifera
a and b notes as for Table 4.3a
77

“hum-gem”
“hum-gem plate”
“mont-gem”
“sam-hum” “sam-gem”
“dig-gem”“mont-hum”
A. humilis A. gemmifera
A. digitifera
A. samoensis
A. monticulosa
Fig. 4.1 Diagrammatic representation of the intermediate morphs in relation to the
species after which they were named.
intermediate morphs (Fig. 4.1) and six sub-morphs (Fig. 4.2). No intermediate or sub-
morphs were recorded for the species A. globiceps, A. retusa and A. multiacuta and no
intermediate morphs were recorded between the species A. samoensis, A. monticulosa
and A. digitifera. Intermediate morphs were recorded between A. gemmifera and A.
samoensis, A. humilis, A. monticulosa and A. digitifera; and between A. humilis and A.
samoensis and A. monticulosa but not A. digitifera. The intermediate morphs were
“sam-hum”, “sam-gem”, “hum-gem”, “hum-gem plate”, “mont-hum”, “mont-gem” and
“dig-gem”. Colonies of A. gemmifera from American Samoa were reclassified as
“mont-gem” after comparison with all samples in the broader geographical context of
this study. Of the six sub-morphs, none were recorded for the species A. gemmifera,
one each for A. samoensis and A. humilis and two each for A. monticulosa and A.
78

A. monticulosa
“terete mont”
“digitate mont”
“Penghu hum”
A. humilis
A. digitifera
“Samoan dig”
“encrusting dig”
A. samoensis
“fine sam”
Fig. 4.2 Diagrammatic representation of the sub-morphs in relation to the species after
which they were named.
digitifera. These were “fine sam”, “Penghu hum”, “terete mont”, “digitate mont”,
“Samoan dig” and “encrusting dig”. Two morphs of A. monticulosa were recognized in
American Samoa in chapter 2 (“branching A. monticulosa” and “digitate A.
monticulosa”). The digitate morph remained a distinct morph when compared with
other samples collected in this study and in the museum collections and is referred to as
“digitate mont” in this chapter. The only distinguishing character of the morph
“branching A. monticulosa”, when compared with other samples, was the arborescent
branching growth form. Samples of this latter morph were therefore reclassified as the
species A. monticulosa. Similarly, “Samoan dig” was identified as A. digitifera in
chapter 2, but was clearly distinct from all other colonies of this species in this study
and was therefore renamed as this sub-morph in this chapter.
In addition to the species and morphs recognized in the field surveys, an intermediate
morph and two sub-morphs were recognized in the museum collections, all of which
appeared to share morphological affinities with the species A. digitifera. The
intermediate morph was “dig-gem 1”. The sub-morphs were Acropora sp 1 aff.
digitifera, which has been previously recognized and described (Hayashibara and
Shimoike 2002) and “Indonesian dig”.
79

4.3.2 MORPHOLOGICAL VARIATION BETWEEN SPECIES AND MORPHS
There was no single morphological character that consistently differentiated the species
and morphs in the Acropora humilis species group. This was the case for both
qualitative (Table 4.3) and morphometric characters, with most morphometric
characters varying continuously between most species and morphs (Fig. 4.3). Acropora
samoensis, A. humilis and A. globiceps were morphologically similar in that they had
terete branches and tubo-nariform radial corallites. These three species differed in that
dimensions for branch and radial corallite characters and axial calice diameter were
smallest in A. samoensis, intermediate in A. humilis and largest in A. globiceps. Width
of the axial walls was similar in A. samoensis and A. humilis and about one-third
thinner in A. globiceps. Of the remaining species, A. gemmifera is morphologically
most similar to these three species (particularly A. humilis), but differs in having
conical branches and radial corallites that varied from tubo-nariform to dimidiate in
shape. The most distinctive character of A. gemmifera is the large number of
subimmersed corallites compared to the small number of regular radial corallites. In A.
monticulosa, the very conical branches were the most distinctive feature, being of
intermediate length and having large basal diameters that taper to small axial corallites.
Radial corallite shape in A. digitifera is most similar to but less tubular, more flaring
and smaller compared to A. gemmifera. Acropora gemmifera and A. digitifera were also
similar in having a high number of subimmersed radial corallites, but are distinguished
by the thin, non-tapering branches and small axial corallite dimensions in the latter
species. Acropora retusa and A. multiacuta were the most morphologically distinct of
all species and morphs. The most distinguishing feature of A. retusa was the elongate
tubular radial corallites (4.8mm mean length), which were approximately twice the
length, but of similar diameter, to those in other species and morphs (Fig. 4.3 k-n).
Acropora multiacuta was easily separated from all other species by its long thin
branches (64.9mm mean length; Fig. 4.3e) with few radial corallites (7.6 regular and
1.1 subimmersed radial corallites/3cm; Fig. 4.3 f and g).
The intermediate morphs are recognized on the basis of intermediate or shared
morphological traits with the species after which they are named (Table 4.3b).
Morphometric dimensions of the morphs “sam-hum”, “sam-gem” and “hum-gem” were
80
Fig. 4.3 Mean values for each morphometric character for each species and morph
examined in this study. Morphometric characters are indicated on the vertical axes.
Error bars indicate 95% confidence intervals. Abbreviations for each species and morph
are: S A. samoensis; H A. humilis; GL A. globiceps; GE A. gemmifera; MO A.
monticulosa; D A. digitifera; R A. retusa; MU A. multiacuta; s-h “sam-hum”; s-ge
“sam-gem”; h-ge “hum-gem”; h-ge p “hum-gem plate”; mo-h “mont-hum”; mo-ge
“mont-gem”; d-ge “dig-gem”; fS “fine sam”; pH “Penghu hum”; tMO “terete mont”;
dMO “digitate mont”; sD “Samoan dig”; eD “encrusting dig”. Species and morphs are
ordered on the horizontal axes from maximum to minimum mean values, with the
exception of “encrusting dig”, A. retusa and A. multiacuta. This morph and these
species are placed in the same order at the right hand side of each plot. Branch
diameters and radial corallite counts were not applicable for “encrusting dig” due to the
absence of developed branches.

mo-
ge GE D
tMO
dMO
d-ge MO
h-ge
s-ge
h-ge
p s-h sD
mo-
h H SG
LpH fS RM
u
No.
sub
imm
erse
d ra
dial
cor
allit
es
0
2
4
6
8
10
12
14
mo-
hG
Lh-
ge Hs-
getM
Os-
h SG
E pHm
o-ge
h-ge
pd-
ge fS sD MO D
dMO eD R
MU
Axi
al c
alic
e di
amet
er (m
m)
0.6
0.8
1.0
1.2
1.4
1.6
1.8
h-ge GE
GL
s-ge
d-ge s-
hm
o-h
MO H S
mo-
ge DtM
O pH sDdM
O fSh-
ge p eD R
MU
Bra
nch
leng
th (m
m)
0
20
40
60
80
sDdM
Om
o-h
MO
h-ge
ptM
Od-
ge pH GL H S
s-h D
mo-
geh-
ge fSs-
ge GE R
MU
No.
regu
lar r
adia
l cor
allit
es
3
6
9
12
15
18
21
mo-
hM
Om
o-ge
h-ge GL
GE
tMO
dMO H
d-ge s-h
s-ge sD S pH
h-ge
p D fS RM
U
Bra
nch
mid
dia
met
er (m
m)
5
10
15
20
25
30
dMO
mo-
hG
LM
O Hh-
gem
o-ge
tMO sD GE
s-h
s-ge
d-ge
h-ge
p S pH fS D RM
U
Bra
nch
tip d
iam
eter
(mm
)
2
4
6
8
10
12
14
16
mo-
ge MO
mo-
hG
EtM
Oh-
ge GL
d-ge
dMO H
s-ge s-
h sD Sh-
ge p pH D fS R
MU
Bra
nch
base
dia
met
er (m
m)
5
10
15
20
25
30
35
GL
MO
mo-
ge GE
h-ge
mo-
h Hd-
gedM
OtM
Os-
ge s-h sD pH S D
h-ge
p fS eD RM
U
Bra
nch
spac
ing
(mm
)
10
15
20
25
30
35
40
45
50
55
g h
e f
c d
ba
81

GL
mo-
hh-
ge Hd-
ge s-h
pH GE
s-ge
tMO D S
mo-
ge fS MO
dMO
h-ge
p sD eD RM
U
Rad
ial c
alic
e di
amet
er (m
m)
0.6
0.8
1.0
1.2
1.4
1.6m
GL
h-ge HG
E pH s-h
mo-
gem
o-h
s-ge
d-ge S D fS
h-ge
ptM
OM
OdM
O sD eD RM
U
Rad
ial c
oral
lite
wal
l thi
ckne
ss (m
m)
0.2
0.4
0.6
0.8
1.0
1.2n
GL
h-ge MO GE fS s-h D
s-ge H pH
mo-
h Sd-
gem
o-ge
h-ge
pdM
OtM
O sD eD RM
U
Rad
ial c
oral
lite
leng
th (m
m)
1
2
3
4
5
6k
GL
h-ge GE
mo-
h Hd-
ges-
ge s-h fS pH S
mo-
ge DtM
OM
Oh-
ge p
dMO sD eD R
MU
Rad
ial c
oral
lite
diam
eter
(mm
)
1.0
1.5
2.0
2.5
3.0
l
h-ge
mo-
hs-
h H Ss-
getM
O GE pH
d-ge
mo-
geh-
ge p GL D
MO fS
dMO sD eD R
MU
Axi
al w
all t
hick
ness
(mm
)
0.5
1.0
1.5
2.0
2.5
3.0
3.5
4.0
4.5i
pH Ss-
hh-
ges-
ge HtM
O GL
GE
h-ge
pm
o-h
mo-
ge fSd-
ge MO
dMO D sD eD R
MU
Axi
al s
epta
leng
th (m
m)
0.1
0.2
0.3
0.4
0.5j
Fig. 4.3 continued
82

similar to or intermediate between dimensions for the species A. samoensis, A. humilis
and A. gemmifera. There was little variation between the morphs “sam-hum” and “sam-
gem” for most characters, except the former had more regular and fewer subimmersed
radial corallites and thicker axial walls, consistent with the dimensions recorded for A.
humilis and A. gemmifera respectively. Branch spacing and diameters of the morph
“hum-gem” were intermediate to A. humilis and A. gemmifera but slightly larger than
branch length, and axial and radial corallite dimensions in these species. Morphological
affinity of the intermediate morph “hum-gem plate” was not clear. The shape of radial
corallites in this morph suggested that this morph is probably most similar to A.
gemmifera or “hum-gem”. The growth form of corymbose plates in this morph seemed
to be common for a range of species of Acropora in the Penghu Islands and southern
Taiwan (pers. obs.), and so was not considered a diagnostic character for identifying
this morph. In comparison to A. monticulosa and A. humilis, branches of the morph
“mont-hum” were most similar to but less conical than those in the former species
while axial and corallite dimensions were most similar to the latter species. The morph
“mont-gem” was intermediate between A. monticulosa and A. gemmifera for most
characters except branch diameters, which were more similar to the former species.
Morphometric dimensions of the morph “dig-gem” were intermediate between A.
gemmifera and A. digitifera but closest to A. gemmifera for almost all characters.
Morphological dimensions of the sub-morphs were generally smaller than those of the
corresponding species after which they were named (Table 4.3c and Fig. 4.3). All
colonies of the sub-morph “fine sam” were identical in colour to some colonies of the
species A. samoensis, with this morph differing in that it had thinner, more compact
branches and smaller axial corallites. The sub-morph “Penghu hum” differed from A.
humilis in having smaller branch dimensions, smaller axial corallites but similarly long
axial septa, and similar but variably sized radial corallites. Most skeletal characters of
the sub-morph “terete mont” were highly variable, despite the consistent appearance of
live colonies. Compared to A. monticulosa, this sub-morph had smaller and less conical
branches, larger axial and similar radial dimensions. The sub-morph “digitate mont”
was distinct from A. monticulosa and “terete mont”, distinguished by short, thin, terete
branches. Colonies of “digitate mont” had most resemblance to the morph “Samoan
dig”, which had similarly shaped but smaller branches, similarly small corallites and
the same colour in live colonies. In comparison to A. digitifera, colonies of “Samoan
83

dig” had thicker, shorter branches with smaller axial corallites and smaller, more
crowded radial corallites. The single colony of the morph “encrusting dig” was named
because of its similar colony colour to that commonly seen in A. digitifera, although the
peculiar growth form clearly distinguished this morph from A. digitifera and all other
species and morphs examined in this study.
Examination of museum specimens of the Acropora humilis species group revealed
increased morphological variation for most species and morphs, when compared across
their Indo-Pacific distributions. This variation was within the range described for each
species and morph (Table 4.3), for all species except A. digitifera. Within this species,
many colonies from eastern Indian Ocean locations (Gulf of Thailand, Riau/Lingga
Archipelago SE of Singapore, and Western Australia) had densely arranged radial
corallites that approached a nariform shape. However, these colonies were not
recognized as a distinct morph, because variation in these characters merged with those
described in Table 4.3a for A. digitifera. The additional variation within the species A.
digitifera was also due to the presence of another intermediate and two sub-morphs.
The intermediate morph “dig-gem 1” appeared to have most affinity with A. digitifera
and A. gemmifera, being distinguished by a combination of growth form and radial
corallite characters. Colonies of “dig-gem 1” formed caespito-corymbose sub-branches
which developed from a few larger horizontal branches. Radial corallites were most
similar to those of A. gemmifera, being of mixed sizes ranging from subimmersed to
large, with larger radials having a dimidiate shape. The sub-morph Acropora sp 1 aff.
digitifera is distinguished from colonies of A. digitifera by its short, conical branches
arising from a solid base (Hayashibara and Shimoike 2002), while “Indonesian dig”,
was distinguished from A. digitifera by the large and strongly flaring shape of the radial
corallites.
4.3.3 MORPHOMETRIC ANALYSIS
4.3.3.1 DEFINING SPECIES CATEGORIES
Discriminant analysis of the species A. samoensis, A. humilis, A. globiceps, A.
gemmifera, A. monticulosa and A. digitifera indicated that 77.6% of the morphometric
variation between these species was explained by the first two discriminant functions
(DF1 and DF2) (Fig. 4.4a). The stepwise model used 10 characters to explain the
variation between the species (Fig. 4.4b) and removed the characters branch mid-
84
Fig. 4.4 a Plot of the first two discriminant functions for the discriminant analysis of
the species A. samoensis, A. humilis, A. globiceps, A. gemmifera, A. monticulosa and A.
digitifera. Each data point represents a single colony. Polygons are drawn around
colonies for each species with line styles as follows: A. samoensis dash with two dots;
A. humilis thin continuous; A. globiceps dotted; A. digitifera thick continuous; A.
gemmifera dash with one dot; A. monticulosa dashed. Symbols for each data point
indicate the region in which colony was sampled: Taiwan: , Indonesia: , Australia:
, PNG , Solomon Islands , American Samoa , French Polynesia . To
differentiate between colonies of species in overlapping polygons, solid symbols are
used for colonies of the species A. globiceps, A. samoensis, A. gemmifera and A.
digitifera and empty symbols for colonies of the species A. humilis and A. monticulosa.
b Vector plot showing the effect of each morphometric character on the distribution of
colonies of each species.

Branch spacing
Branch base diameter
# Subimmersed radialsRadial crowding
Branch tip diameter
Axial calice diameter
Axial wall thickness
Radial corallite diameter
Radial calice diameterRadial wall thickness
a
b
Discriminant Function 1 (51.5%)
Dis
crim
inan
t Fun
ctio
n 2
(26.
1%)
-4
8
-6 8
A. globiceps
A. humilis
A. samoensis
A. gemmifera
A. monticulosa
A. digitifera
85

diameter, branch length, length of axial septa and length of radial corallites (characters
3, 5, 10 and 11, respectively; Table 2.1) from the analysis because they contributed
little additional discrimination. The rate of correct classification of colonies for each
species was extremely high (97.3%), indicating that the morphometric characters used
in the analysis were successful in defining the species categories. All colonies of A.
globiceps, A. gemmifera, A. monticulosa and A. digitifera were correctly classified.
Only colonies of A. samoensis and A. humilis were misclassified, with one colony of A.
samoensis being classified as A. humilis and two colonies of A. humilis as A.
samoensis. Of the correctly classified individuals, most variation in the predicted
allocation of colonies of each species was also between A. humilis and A. samoensis,
emphasizing the morphological similarity of these species (Table 4.4). Most (13 of 18)
colonies of A. samoensis had a small (<3%) potential of being classified as A. humilis,
11 of 30 colonies of A. humilis had a 0.1 – 15% likelihood of being classified as A.
samoensis and 5 colonies of these species had a moderate likelihood (20.8 – 79.2%) of
being allocated to either species.
The first discriminant function separated A. samoensis, A. humilis and A. globiceps
from A. gemmifera, A. monticulosa and A. digitifera, with separation being mainly due
to the characters ‘number of subimmersed radial corallites’ and ‘radial crowding’ (Fig.
4.3). The former three species had fewer subimmersed radials and less crowded radial
corallites compared with the latter three species. The second discriminant function
separated the species A. samoensis and A. globiceps but did not separate either of these
species from A. humilis, with morphological variability between colonies of A. humilis
extending to the extremes of each of the other two species. The multivariate spread of
colonies in these three species was mostly due to the thicker axial walls and relatively
small radial corallites of A. samoensis and some colonies of A. humilis compared to the
larger branch dimensions, larger axial calices, thinner walls and smaller calices of
radial corallites of A. globiceps and other colonies of A. humilis. The second
discriminant function also separated A. gemmifera and A. monticulosa from A.
digitifera, but did not separate A. gemmifera and A. monticulosa. Colonies of A.
digitifera had larger radial calices and thicker radial walls compared to the other two
species, which both had thicker branches and larger overall size of radial corallites.
Acropora gemmifera and A. monticulosa both had relatively thin axial walls, while the
character providing most separation between these two species was the relatively larger
86

Table 4.4 Post-hoc classification rates (%) for colonies of each species of the Acropora humilis species
group into the species categories predicted by the discriminant analysis a. Species Region S H GL GE MO D Species Region S H GL GE MO D S Aus 51.6* 48.4 GE Aus 100* 99.7* 0.3 100* 97.1* 2.9 100* 100* 0.0 100* 99.9* 0.1 100* PNG 100* 0.0 PNG 91.7* 8.3 99.8* 0.2 100* 98.6* 1.4 100* 98.7* 1.3 100* 99.5* 0.5 100* Sol 99.7* 0.3 Sol 100* 99.6* 0.4 100* ••••• 11.3 88.7* 100* 79.2* 20.8 100* 97.1* 2.9 100* Ind 98.5* 1.5 Ind 100* 99.2* 0.8 99.9* 0.1 98.0* 2.0 100* H Sam 100* 0.2 99.8* 100* 100* 100* MO Aus 100* 100* 100* 100* 100* Aus 100* 100* 100* 100* 100* Sol 100* 12.1 87.9* 100* 100* Sam 100* PNG 6.9 93.1* 100* 100* 100* 100* 100* 4.4 95.6* Sol 100* 2.1 97.9* Tai 100* Sol 0.3 99.7* 100* 100* D Aus 100* 100* 100* 0.1 99.9* 100* 0.1 99.9* 100* Tai 1.1 98.9* 100* ••••• 93.3* 6.7 PNG 100* 48.5 51.5* 100* 1.1 98.9* 100* ••••• 92.6* 7.4 100* Ind 0.7 99.3* 100* 100* Sol 100* 30.5 69.5* 100* 14.2 85.8* 100* 24.0 76.0* 100* GL Pol 100* 0.1 99.9* 100* Tai 100* 100* 100* 100* 100* 100* Ind 100* 100* 100* 100* 100* a Abbreviations for species categories are S: A. samoensis, H: A. humilis, GL: A. globiceps, GE: A.
gemmifera, MO: A. monticulosa, D: A. digitifera. ••••• in the species column indicates misclassified
individuals. The highest value for each colony is highlighted with an * and values >20% are in bold.
Values of 0% are not shown.
87

basal branch diameters in A. monticulosa.
4.3.3.1.1 REGIONAL MORPHOLOGICAL VARIATION WITHIN SPECIES
Morphological variation between colonies for each region within each species of the
Acropora humilis species group was generally overlapping (Fig. 4.4a). This suggests
that no other morphs (in addition to those already recognized in this study) were
evident within the regions. Within this overall pattern, some minor trends were also
evident. The large variation between colonies of A. humilis for the second discriminant
function, was mostly due to colonies from Taiwan showing greater morphological
similarity to colonies of A. samoensis, colonies from American Samoa showing greater
similarity to A. globiceps and colonies from the other regions mostly being distributed
between these extremes. Within the species A. samoensis, colonies from Australia
tended to have the thickest axial corallite walls, while variation between colonies from
the other regions was overlapping. The amount of regional variation between colonies
within the species A. gemmifera and A. digitifera was similar, although one colony of
A. gemmifera from Indonesia was quite distinct, showing greatest affinity with A.
digitifera. Morphological variability between colonies of A. monticulosa was mostly
due to the variation in branch diameter, with colonies from Taiwan being largest and
colonies from the Solomon Islands being smallest.
4.3.3.2 CLASSIFICATION OF MORPHS WITHIN SPECIES CATEGORIES
The classification probabilities of the intermediate morphs confirmed that
morphological affinity of most colonies was closest to the pair of species after which
they were named. No geographical patterns, for example of colonies from one region
being classified as a different species to other colonies of the same morph, were evident
(Table 4.5a). Some colonies showed they were most likely to be classified as one or
other of the pair of species after which they were named, while others had a similar
chance of being classified as either species. The morph “sam-hum” had the largest
number of colonies with a moderate chance of being classified as both of the species, A.
samoensis and A. humilis. Of the 14 “sam-hum” colonies, probabilities of being
classified as either A. samoensis or A. humilis ranged from 39.5 – 56.3% for 4 colonies,
15.7 – 84.3% for a further 4 colonies, while the remaining 6 colonies had a 88.4 –
97.8% chance of being classified as A. samoensis. Colonies of “sam-gem” had an 83.9
– 100% chance of being classified as A. samoensis or A. gemmifera. Most colonies of
88

“hum-gem” were likely to be classified as the species A. humilis (82.0 – 99.6% for 7
colonies) or A. gemmifera (98.2 – 100% for 3 colonies), while one colony had a 77.5%
and 22.3% chance of being classified as A. humilis and A. gemmifera respectively. All
but one colony of “mont-hum” were most likely to be classified as A. humilis. Within
the 28 colonies of “mont-gem”, 17 had a 96 – 100% chance of being classified as A.
gemmifera, five as A. monticulosa and one as A. digitifera. Three of the remaining
colonies had a moderate chance of being classified as A. gemmifera or A. monticulosa
(15.1 – 84.9%), while two were most likely to be classified as A. gemmifera or A.
digitifera (31.0 – 67.7%). Classification probability of the colonies of “dig-gem” were
variable, with single colonies each having a 99.9 – 100% chance of being classified as
A. digitifera, A. gemmifera or A. monticulosa, while the other two colonies had a 57.7%
and 62.9% chances of being classified as A. digitifera. The apparent morphological
affinity was not consistent with classification probabilities for the morph “hum-gem
plate”, with four colonies most likely to be classified as A. digitifera (94.0 – 100%) and
one colony as A. monticulosa (78.9%). This was due to the plating growth form of this
species and therefore smaller branch, axial and radial dimensions compared to colonies
of A. humilis and A. gemmifera.
On the basis of the classification probabilities, only “fine sam” and “digitate mont” of
the six sub-morphs were consistently assigned to the species with which they appeared
to share most morphological affinity (Table 4.5b). These two sub-morphs had a 100%
probability of being classified as the species A. samoensis and A. monticulosa
respectively. Three colonies of the morph “Penghu hum” had moderate chances of
being classified as the species A. humilis or A. samoensis (34.9 – 65.1%) while two
colonies had a high chance (84.3 – 99.9%) of being classified as A. samoensis. The sub-
morphs “terete mont” and “Samoan dig” were both more likely to be classified as
different species than the species after which they were named. Three colonies of
“terete mont” had a 94.5 – 99.7% chance of being classified as A. gemmifera while one
colony had a 99.8% chance as A. monticulosa. Colonies of the morph “Samoan dig”
were most likely to be classified as A. monticulosa, with 4 colonies having a 97.4 –
100% chance of being classified as this species, and only one colony was most likely
(89.1%) to be classified as the species A. digitifera.
89

Table 4.5a Classification probability (%) for colonies of each intermediate morph into the species
categories defined in the discriminant analysis a. Morph Region S H GL GE MO D Morph Region S H GL GE MO D s-h Ind 94.5* 5.5 mo-ge Tai 3.3 0.2 96.4* 56.3* 43.7 100* 29.3 70.6* 0.1 100* 15.7 84.3* 98.6* 1.3 Aus 88.4* 11.6 31.0 1.2 67.7* 19.9 80.1* Ind 97.5* 2.5 49.1 50.9* 0.5 99.5* 39.5 53.4* 7.0 64.1* 0.1 35.8 PNG 91.1* 8.9 100* 51.7* 48.3 99.6* 0.4 97.8* 2.2 Aus 100* Sol 90.0* 10.0 99.7* 0.2 0.1 93.9* 6.1 100* 29.2 70.8* PNG 0.3 99.7* s-ge Ind 99.8* 0.2 0.6 99.4* 83.9* 16.1 98.5* 1.5 100* 15.1 84.9* 0.9 0.1 99.0* 99.5* 0.5 Aus 100* Sol 99.8* 0.2 97.3* 2.7 100* 1.0 9.9 88.6* 0.4 100* 99.9* 0.1 96.0* 4.0 Sol 93.0* 7.0 100* h-ge Ind 17.9 82.0* 0.1 Sam 99.9* 0.1 3.8 39.7 56.5* 56.6* 43.4 0.8 1.0 98.2* 100* Aus 0.2 77.5* 22.3 100* 100* 28.9 71.1* 0.6 99.4* mo-h Aus 100* 0.9 99.1* 100* 0.4 99.4* 0.1 100* PNG 0.4 99.6* 0.1 0.1 72.6* 3.6 9.7 14.0 60.7* 39.3 0.2 93.2* 6.6 0.2 93.0* 6.8 Sol 0.1 36.2 0.1 63.4* 0.3 1.2 98.8* 0.7 99.3*
2.1 97.3* 0.6 d-ge Aus 100* h-ge p Tai 4.0 0.7 95.3* 0.1 99.9* 0.7 1.4 97.8* 100* 1.0 3.2 3.7 78.9* 13.2 16.3 26.0 57.7* 0.6 5.3 94.0* 37.1 62.9* 100* a Abbreviations for morphs are the same as in Fig. 4.1. Abbreviations for species categories are the same
as in Table 4.4. The highest probability for each colony is highlighted with an * and probabilities > 20%
are in bold. Probabilities of 0% are not shown.
90
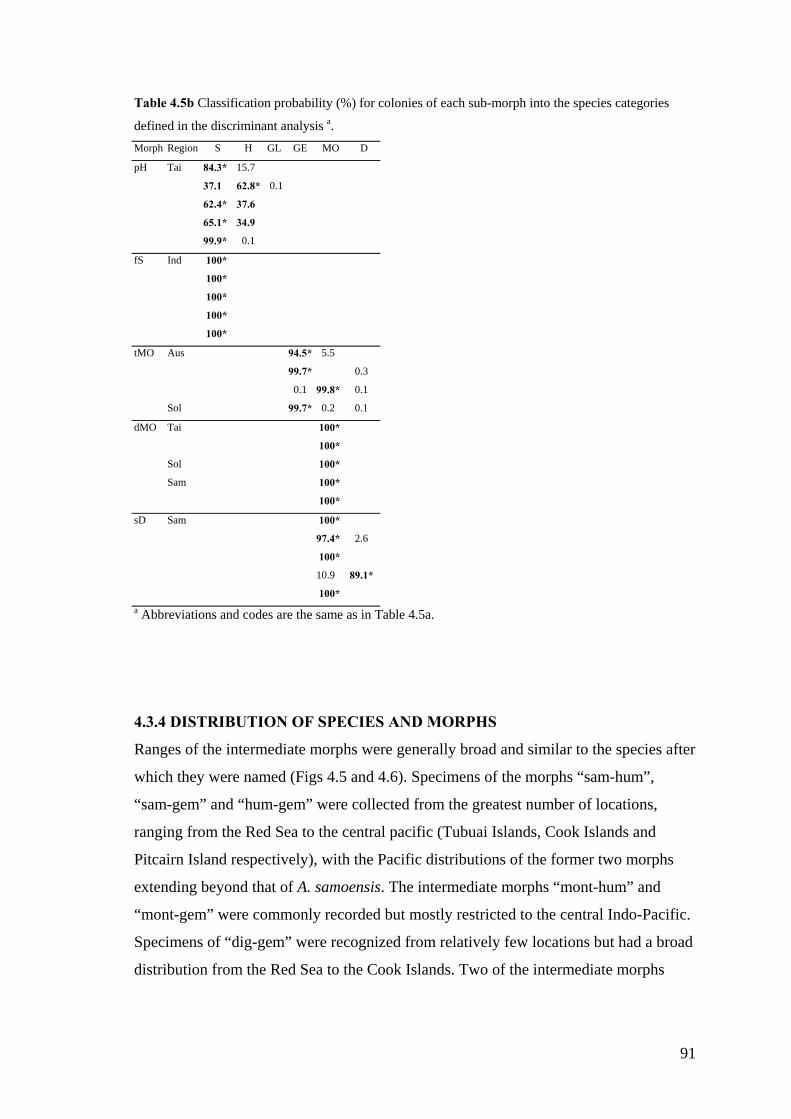
Table 4.5b Classification probability (%) for colonies of each sub-morph into the species categories
defined in the discriminant analysis a. Morph Region S H GL GE MO D
pH Tai 84.3* 15.7
37.1 62.8* 0.1
62.4* 37.6
65.1* 34.9
99.9* 0.1
fS Ind 100*
100*
100*
100*
100*
tMO Aus 94.5* 5.5
99.7* 0.3
0.1 99.8* 0.1
Sol 99.7* 0.2 0.1
dMO Tai 100*
100*
Sol 100*
Sam 100*
100*
sD Sam 100*
97.4* 2.6
100*
10.9 89.1*
100* a Abbreviations and codes are the same as in Table 4.5a.
4.3.4 DISTRIBUTION OF SPECIES AND MORPHS
Ranges of the intermediate morphs were generally broad and similar to the species after
which they were named (Figs 4.5 and 4.6). Specimens of the morphs “sam-hum”,
“sam-gem” and “hum-gem” were collected from the greatest number of locations,
ranging from the Red Sea to the central pacific (Tubuai Islands, Cook Islands and
Pitcairn Island respectively), with the Pacific distributions of the former two morphs
extending beyond that of A. samoensis. The intermediate morphs “mont-hum” and
“mont-gem” were commonly recorded but mostly restricted to the central Indo-Pacific.
Specimens of “dig-gem” were recognized from relatively few locations but had a broad
distribution from the Red Sea to the Cook Islands. Two of the intermediate morphs
91

“hum-gem plate” and “dig-gem 1” were only recorded over small areas i.e. Taiwan –
southern Japan and central Indonesia, respectively.
In contrast to the generally broad distributions of the intermediate morphs, the sub-
morphs had more restricted distributions, which were within the distribution of the
species after which they were named (Fig. 4.7). There were few colonies of each of the
sub-morphs in the museum collections (less than 10 colonies of each sub-morph),
suggesting that these morphs are also rare within their relatively small range (Fig. 4.7).
Specimens of “Penghu hum”, “encrusting dig” and A. sp 1 aff. digitifera were only
recorded from the western Pacific with the former two morphs only being found at
single locations in Taiwan in field surveys during this study, while colonies of the latter
morph were only recorded from southern Japan in the museum collections. The sub-
morph “Samoan dig” was only recorded in American Samoa and the Cook Islands,
suggesting that it is restricted to the central Pacific. Colonies of “fine sam”, “terete
mont” and “Indonesian dig” were commonly recorded, but only within narrow
distribution ranges, within the central Indo-Pacific region. The sub-morph “digitate
mont” was also rare, but found in relatively distant locations of Taiwan, Solomon
Islands, American Samoa and the Cook Islands.
4.4 DISCUSSION
4.4.1 MORPHOLOGICAL COMPARISON OF SPECIES AND MORPHS
This study demonstrates that the taxonomic difficulties of defining species in the
Acropora humilis species group are due to two levels of morphological variation.
Firstly, morphological boundaries between species are blurred by colonies with
intermediate morphologies, which share morphological affinities with more than one
species. Secondly, there are morphs with distinct morphologies within the
morphological boundaries of species as they are currently described. In this study, 21
morphs in the A. humilis species group were recognized from the western to central
Pacific on the basis of qualitative characters (Table 4.3). These morphs comprise the
eight described species of the group, seven intermediate morphs and six sub-morphs.
Morphometric classification of intermediate morphs was generally within either of the
species after which they were named, or in some cases, colonies had moderate chances
of being classified as either of these species. In contrast, four of the six sub-morphs
92

Fig. 4.5 Distribution of species of the Acropora humilis species group, based on
records from this study and specimens in the collections at the Museum of Tropical
Queensland: a A. samoensis; b A. humilis; c A. globiceps; d A. gemmifera; e A.
monticulosa; f A. digitifera; g A. retusa; h A. multiacuta.

A. samoensis
c
A. monticulosae
A. retusag
A. gemmiferad
A. digitiferaf
A. multiacutah
b A. humilisa
A. globiceps
A. samoensisA. samoensis
c
A. monticulosae
A. retusag
A. gemmiferaA. gemmiferad
A. digitiferaf
A. multiacutah
b A. humilisA. humilisa
A. globicepsA. globiceps
93

Fig. 4.6 Distribution of intermediate morphs of the Acropora humilis species group,
based on records from this study and specimens in the collections at the Museum of
Tropical Queensland: a “sam-hum”; b “sam-gem”; c “hum-gem”; d “hum-gem plate”;
e “mont-hum”; f “mont-gem”; g “dig-gem”; h “dig-gem 1”. Polygons indicate the
extreme locations that the species, after which each morph was named, was recorded.
Polygons are drawn by eye for each species from Fig. 4.5. The solid polygon indicates
the distribution of the first and the dashed polygon indicates the distribution of the
second species in the name of the morph.

a
c
“mont-hum”e
“dig-gem”g
b
d
“mont-gem”f
“dig-gem 1”h
“hum-gem”
“sam-hum”
“hum-gem plate”
“sam-gem”a
c
“mont-hum”e
“dig-gem”g
b
d
“mont-gem”f
“dig-gem 1”h
“hum-gem”“hum-gem”
“sam-hum”“sam-hum”
“hum-gem plate”“hum-gem plate”
“sam-gem”“sam-gem”
94

Fig. 4.7 Distribution of sub-morphs of the Acropora humilis species group, based on
records from this study and specimens in the collections at the Museum of Tropical
Queensland: a “fine sam”; b “Penghu hum”; c “terete mont”; d “digitate mont”; e
“Samoan dig”; f “encrusting dig”; g “A. sp 1 aff. digitifera”; h “Indonesian dig”.
Polygons indicate the extreme locations that the species, after which each morph was
named, was recorded. Polygons are drawn by eye for each species from Fig. 4.5.

“terete mont”c “digitate mont”d
“Penghu hum”b
“Indonesian dig”h
“encrusting dig”f“Samoan dig”e
A. sp 1 aff. digitiferag
“fine sam”a
“terete mont”c “digitate mont”d
“Penghu hum”b “Penghu hum”b
“Indonesian dig”h “Indonesian dig”h
“encrusting dig”f “encrusting dig”f“Samoan dig”e “Samoan dig”e
A. sp 1 aff. digitiferag A. sp 1 aff. digitiferag
“fine sam”a
95

were not classified within the species after which they were named, confirming the
distinction of these morphs from the species with which they appeared to have most
morphological affinity. Apparent affinities between the species and morphs, based on a
synthesis of the evidence from this chapter and chapters 2 and 3, are proposed in this
section.
Discriminant analysis of the morphometric characters indicated that the most
morphologically similar species were Acropora samoensis, A. humilis and A.
globiceps, with the greatest overlap being between the former two species (Fig. 4.4a).
The classification probabilities of the intermediate morph “sam-hum” also
demonstrated the close morphological similarities between the species A. samoensis
and A. humilis, with all colonies of this morph having some chance, and one-third of
the colonies having a moderate chance of being classified as either of these species
(Table 4.5a). Despite the morphological and genetic similarity of these species and this
morph (chapters 3), the predominant time of spawning of A. samoensis and “sam-hum”
was out of phase with A. humilis and the mass spawning event at Lizard Island (chapter
3). Documenting timing of spawning for these species and this morph, both in locations
where they do and do not co-occur, would contribute to understanding the evolutionary
significance of the different time of spawning of A. samoensis and whether the
boundary between A. samoensis and A. humilis can be more accurately defined.
Reproductive studies may also contribute to further understanding evolutionary
relationships for “Penghu hum”, which classified as A. samoensis and A. humilis, and
“fine sam” which consistently classified as A. samoensis in the morphometric analysis
(Table 4.5b). Morphological similarity between A. globiceps and the species A.
samoensis and A. humilis is indicated in the qualitative descriptions of each of these
species (Table 4.3a) and confirmed in the discriminant analysis (Fig. 4.4a). This
similarity is also recognized by Wallace (1999), who describes branch and radial
corallite shape as most similar to A. samoensis and branch thickness and growth form
as most similar to A. humilis.
The species with greatest morphological similarity to A. samoensis, A. humilis and A.
globiceps was A. gemmifera (Table 4.3a). Acropora gemmifera was separated from the
other three species by the first but not the second discriminant function (Fig. 4.4a).
Although A. gemmifera was well defined in the discriminant analysis (Table 4.4),
96

boundaries are less distinct when the morphs of this species, particularly “hum-gem”,
are considered (Table 4.3). The difficulty of distinguishing the species A. gemmifera
from A. humilis is also noted by Wallace (1999). Morphometric analysis of colonies of
this morph generally resolved the apparent gradation between these species with most
colonies having a high probability of being classified as one or other of these species,
although two colonies had moderate chances of being classified as either species (Table
4.5a). Morphological affinities of the morph “sam-gem” were resolved in the
morphometric analysis, with all colonies being classified as either the species A.
gemmifera or A. samoensis (Table 4.5a).
The species Acropora monticulosa formed a clearly defined group in the discriminant
analysis (Table 4.4). However, in shallow wave exposed habitats such as the reef crest,
other species of Acropora can also have digitate, conical branches (pers. obs.) and may
therefore be misidentified as A. monticulosa. Acropora gemmifera appears to be the
species most likely to be confused with A. monticulosa, based on the morphological
overlap between these species in the discriminant analysis (Fig. 4.4a) and the
morphological characters of the intermediate morph “mont-gem” (Table 4.3b).
Although I was unable to confidently identify colonies of this morph as either of these
species, the classification probabilities indicated that colonies of “mont-gem” were
most likely to be classified as A. gemmifera (Table 4.5a). Similarly, colonies of “mont-
hum” could not confidently be assigned to the species A. monticulosa or A. humilis,
although classification probabilities suggested that these colonies were usually most
similar to the latter species (Table 4.5a).
Colonies of the sub-morphs “digitate mont” and “terete mont” were also found in the
same habitat as A. monticulosa and shared morphological affinities with this species.
However, reproductive and genetic evidence for these morphs (chapters 2 and 3,
respectively) suggest that each is evolving independently of this species. The morph,
“digitate mont” was consistently classified as A. monticulosa (Table 4.5b), although
evolutionary affinities were also proposed with “Samoan dig”, on the basis of
morphological and molecular evidence (chapter 2). The morph “terete mont” also
appeared to share greatest morphological affinity with A. monticulosa, but could not be
confirmed due to the morphological variability and small number of colonies assessed
for this morph. The large axial corallites of this morph resembled A. humilis and the
97

dimidiate radial corallites resembled A. gemmifera (Table 4.3). Based on the combined
assessment of morphological appearance, the broad range of fertilization potential
between colonies and timing of reproduction for this morph, it was proposed as a
possible hybrid between the species A. monticulosa and A. humilis (chapter 3).
The species Acropora digitifera was the most clearly defined of all species in the
discriminant analysis, being the only species to form a separate group (Fig. 4.4a),
although this species appeared to have affinities with several morphs. Characters of this
species were most similar to those in the species A. gemmifera, with the intermediate
morph of these species, “dig-gem” sharing characters with both species (Table 4.3),
although classification probabilities were inconclusive due to the morphological
variability and small number of colonies examined of this morph. The intermediate
morph “dig-gem 1” also appeared to share greatest morphological affinity with the
same species, although was most similar to the species A. gemmifera, having radial
corallites most similar in size and shape to this species. This morph was only recorded
in the museum collections, in central Indonesia (Fig. 4.6h). Two sub-morphs were
recognized within the species A. digitifera in the field surveys. The sub-morph
“Samoan dig” appeared to have greatest affinity with the species A. digitifera (Table
4.3). However, classification probabilities for colonies of this morph suggested greatest
affinity was with A. monticulosa (Table 4.5b), supporting the proposed evolutionary
affinities between the morphs “Samoan dig” and “digitate mont” (chapter 2). Only a
single colony of the sub-morph of “encrusting dig” was recorded in this study. Affinity
of this morph is tentatively proposed, primarily on the basis of the colours of this
colony matching those commonly seen in A. digitifera, but could not be tested with the
morphometric characters used in this study due to the absence of branch and fully
developed radial corallite characters. Two other sub-morphs of the species A. digitifera
were recognized in the museum collections but not field surveys. One of these sub-
morphs has been described from southern Japan as a cryptic species of A. digitifera,
being distinguished by its encrusting growth form (Hayashibara and Shimoike 2002).
The other sub-morph recorded in the museum collections was morphologically similar
to A. digitifera, being distinguished by large and strongly flaring radial corallites and
was only found in central Indonesia (Fig. 4.7f).
98

The species Acropora multiacuta and A. retusa were morphologically distinct from
each other and all other species in the A. humilis species group. Wallace (1999)
concluded that A. multiacuta appears to be the most misplaced species in this species
group, noting the reduced number of radial corallites as being an unusual feature of this
species. This feature and the long, thin branches of this species distinguished it from all
other species and morphs of the A. humilis species group (Table 4.3 and Fig. 4.3). The
species A. retusa was also morphologically distinct from other species and morphs in
the A. humilis species group. The most distinguishing feature of this species was the
elongate tubular radial corallites (Table 4.3 and Fig. 4.3k). Because of the
morphological distinction of the species A. multiacuta and A. retusa from other species
and morphs in the A. humilis species group, more extensive analyses which incorporate
other species from the genus Acropora are necessary to determine the species with
which they have greatest morphological affinities.
4.4.2 MORPHOLOGICAL VARIATION CONTRIBUTES TO THE
INTERPRETATION OF EVOLUTIONARY RELATIONSHIPS
The morphometric analysis greatly enhanced this investigation of morphological
variation within and between the species and morphs, throughout their geographic
distributions. The analysis compared patterns of morphological variation of each
species (Fig. 4.4), and provided a framework for assessing, on a case-by-case basis, the
morphological affinity of colonies of each morph (Table 4.5). Given that morphological
characters vary between species, they must also vary within species at some stage in
their evolution, although such variation is not usually considered in systematic analyses
(Wiens 1999). Rather than considering morphologically variable species as discrete
evolutionary units, examination of patterns of intraspecific and interspecific variation
may provide evidence of microevolutionary processes (Wiens 1999). Morphological
affinities demonstrated in this study provide a foundation for testing this hypothesis
with additional evidence, such as molecular and reproductive criteria. This will help to
clarify whether colonies of morphs that had a high probability of being classified with
only one species are correctly assigned, providing a more accurate delineation of the
morphological boundaries between species. Non-morphological criteria can also be
used to test whether there is evidence of evolutionary divergence between colonies that
have not diverged morphologically across broad geographic scales, if intermediate
99

morphs indicate lineages that are diverging or hybridizing, and if sub-morphs are
cryptic or recently diverged species.
Within the genus Acropora, congruence between morphological and evolutionary
boundaries has been questioned (Wallace and Willis 1994; Willis et al. 1997; van
Oppen et al. 2001), although few studies have examined these boundaries using
detailed morphological analyses. The genus Acropora encompasses a large number of
species in which there is “bewildering within-species variability coupled with a high
degree of between-species similarity” (Wallace and Willis 1994). Furthermore,
morphological characters at all structural levels, i.e. colony, branch, axial corallite,
radial corallite and septa, are phenotypically variable, even within a single colony. It is
clear therefore, that detailed morphometric analyses are necessary to synthesize
patterns of polymorphism within and between species of Acropora and provide a sound
framework for using non-morphological criteria to interpret evolutionary boundaries in
this genus. Prior to the current study, only one study had used detailed morphological
analyses to examine evolutionary boundaries in the genus Acropora. In that
investigation, two morphs of the species A. millepora were found to be
morphologically distinct and reproductively incompatible (Wallace and Willis 1994).
On this basis, these morphs are now tentatively recognized as the species A. millepora
and A. spathulata (Wallace 1999), with the former having thinner branches and smaller
radial corallites than the latter species (Radford 1998). In the current study, using
putative morphs as the sampling units has greatly enhanced the interpretation of
reproductive and genetic relationships within the A. humilis species group (chapter 3).
For example, recognition of the intermediate morph “dig-gem” was critical for
exploring evolutionary relationships between the species A. digitifera and A.
gemmifera. This morph was most similar in appearance to A. digitifera when compared
as live colonies (Table 4.3), most similar to and usually identified as A. gemmifera
when skeletal samples are compared (pers. obs. in museum collections), but
evolutionarily distinct from each of these species on the basis of reproductive and
genetic criteria respectively. In contrast, the species A. humilis, A. samoensis and A.
gemmifera from Lizard Island were reproductively but not genetically distinct (chapter
3). Intermediate morphs of these species are also genetically undifferentiated from
these species, although timing of spawning and potential to interbreed suggests that
morphological appearance of these species and morphs is indicative of patterns of
100

recent divergence within these taxa (chapter 3). Interpretation of evolutionary
relationships within the A. humilis species group is discussed further in chapter 5.
The morphometric characters used in this study are based on linear measurements,
providing an indication of size but not shape of the dimensions measured. These linear
measurements reflect taxonomic differences in branch and axial corallite characters,
although comparison of radial corallite size only partially reflects differences between
the species and morphs. More detailed analyses of radial corallites may refine the
classification probability of intermediate morphs and sub-morphs. In the current study,
incorporating shape into the morphometric analyses would be particularly useful for
more detailed examination of radial corallites of A. humilis, A. gemmifera and
intermediate morphs of these species, clarifying whether changes in shape between
these species and morphs form a continuous gradient, or alternatively, marking where
discontinuities occur. This is also likely to be particularly informative for the morphs,
“hum-gem plate”, “Penghu hum”, “digitate mont” and “Samoan dig”, because the
relatively small dimensions of these morphs may have overshadowed differences in
radial corallite shape. Use of landmark techniques may be useful for comparing the
shape of radial corallites in the genus Acropora, as demonstrated in the genus Porites
(Budd et al. 1994; Johnson and Budd 1996). Landmark techniques involve the
measurement of distances between homologous points, documenting shape in two or
three dimensions (Bookstein 1990). The number of homologous points, which can be
defined in radial corallites of different shapes, may however restrict the application of
this technique in the genus Acropora. Further investigation is therefore necessary to
explore the potential of using landmark characters for increasing taxonomic resolution
in the genus Acropora.
Morphological variation within the Acropora humilis species group was analysed using
hierarchical cluster analysis for a single location with moderate diversity (American
Samoa: chapter 2). Characters in this previous study were coded for qualitative
character states, including traditional categories for radial corallite shape and
coenosteal structure (skeletal matrix). This procedure was also attempted in the current
study. However, the substantial levels of polymorphism within and between colonies of
the species and morphs over the broader geographic range precluded meaningful
classification, with many colonies possessing character states for more than one
101

category. In addition, classification clusters were unstable, especially for colonies of A.
globiceps, A. humilis, A. samoensis, A. gemmifera and morphs of these species. These
problems demonstrate the difficulties of assessing morphological variability of
polymorphic individuals, and emphasize the value of using morphometric characters,
ordination techniques and the potential of incorporating new morphometric characters
not assessed in the present study, such as radial corallite shape and possibly coenosteal
structure.
4.4.3 BIOGEOGRAPHY OF SPECIES AND MORPHS OF THE ACROPORA
HUMILIS SPECIES GROUP
Mapping distributions of samples of species and morphs from the field surveys of this
study and museum collections of the Acropora humilis species group provided
additional information for interpreting evolutionary relationships between these taxa.
The intermediate morphs tended to have broad geographic distributions that were
similar to the species with which they appeared to share most morphological affinity
(Fig. 4.6). Records from field surveys and museum collections indicated that the sub-
morphs tended to be rarer and have relatively restricted distributions, within the
distributions of the species after which they were named (Fig. 4.7).
The species A. humilis, A. samoensis, A. gemmifera and intermediate morphs of these
species have broad Indo-Pacific distributions (Fig. 4.5 b, c, d and Fig. 4.6 a, c, d).
Combined genetic and reproductive evidence suggests that these species and morphs
have recently or incompletely diverged (chapters 2 and 3). If the intermediate morphs
are indicative of recent divergence between these species, the broad and overlapping
distributions for these species and intermediate morphs suggests that this apparent
recent divergence may be the case throughout their range. Distributions of the
intermediate morphs of these species extend further than the range of some of the
species. The morphs “sam-hum” and “sam-gem” had broader distributions than A.
samoensis, and similar distributions to A. humilis and A. gemmifera, although A.
humilis was not recorded in the Red Sea (Fig. 4.6c and d). The distribution recorded for
the morph “hum-gem” was also broad and similar to A. humilis and A. gemmifera, with
two notable exceptions being that A. humilis was not recorded in the Red Sea and
neither of these species were recorded from Hawaii (Fig. 4.6a). The colonies identified
as “hum-gem” from Hawaii (French Frigate Shoals) shared characters with A. humilis
102

and A. gemmifera according to the categories defined in this study (Table 4.3), although
colonies from this location are usually identified as A. humilis (e.g. Wallace 1999;
Veron 2000). Further analyses of morphological and non-morphological criteria will
clarify whether some colonies identified as intermediate morphs should be identified as
one of the three species. For example, fertilization experiments demonstrated that
colonies of “hum-gem” were able to interbreed with A. gemmifera but not A. humilis
(chapter 3), suggesting that this morph may include colonies of A. gemmifera.
Potts (1983) proposed that the high levels of intraspecific variability and broad
distributions of many shallow-water coral species may be due to frequent changes in
sea level which cyclically separated and reconnected populations. He proposed that
during periods of isolation, levels of intraspecific variability increased, although these
time intervals were insufficient for the process of speciation to be completed. Based on
available evidence, such factors could be retarding the evolutionary divergence of A.
humilis, A. samoensis and A. gemmifera. Acropora digitifera also has a broad Indo-
Pacific distribution (Fig. 4.5f), although intermediate colonies were only recorded with
A. gemmifera. The morph “dig-gem” was recorded across a similar range but in
relatively few locations beyond the Great Barrier Reef (Fig. 4.6g). Reproductive and
genetic studies are necessary to confirm whether the evolutionary distinction of this
morph from each of these species, demonstrated in chapter 3, is consistent for the other
locations in which colonies of this morph were identified in the museum collections.
Similarly, the intermediate morph “mont-hum” had a more restricted distribution than
the species after which it was named, and on the basis of reproductive criteria, may also
be a hybrid morph of these species (chapter 3). Discriminant analysis of colonies of
“mont-gem” demonstrates that many colonies of this morph are likely to be A.
gemmifera, with their growth form altered by environmental conditions. The
distribution recorded for this morph is therefore likely to include some colonies that are
A. gemmifera, but were identified in the museum collections as A. monticulosa.
Colonies of other intermediate morphs and sub-morphs had relatively restricted
distributions, with the majority only being recorded within the high diversity region of
the central Indo-Pacific (sensu Wilson and Rosen 1998), or just north of this region in
Taiwan and southern Japan (Figs 4.6 and 4.7). Similarly, the species A. multiacuta was
recorded within and just south of this region on the Great Barrier Reef, Australia (Fig.
4.5h). In contrast, colonies of the species A. globiceps, A. retusa and “Samoan dig”
103

were only recorded outside this region (Fig. 4.5a and g and Fig. 4.7g), while the morph
“digitate mont” was recorded rarely from distant locations in the western to central
Pacific (Fig. 4.7d). These more restricted distribution patterns may indicate that recent
divergence has occurred within and beyond the region of high diversity, but more
frequently within this region for taxa of the A. humilis species group.
4.4.4 CONCLUSIONS
This study demonstrates that patterns of morphological variability within the genus
Acropora may indicate recent or ongoing evolutionary processes. In contrast, previous
studies of this genus have treated species as discrete taxa and therefore not revealed
such connections. Comprehensive documentation of morphological variability
throughout the distribution of the A. humilis species group was essential for exploring
such patterns, as well as ensuring that the sampling units are clearly defined for further
analysis of evolutionary relationships. Calculation of classification probabilities of
colonies of intermediate and sub-morphs provided a valuable technique for assessing
apparent morphological affinities. This analysis of intraspecific and interspecific
affinities provides a framework for testing evolutionary relationships and resolving the
nature of morphological boundaries between taxa, using alternative criteria e.g. genetic
and reproductive criteria (chapters 2, 3 and 5). Techniques used in this study will be
useful for resolving evolutionary relationships between other extant species complexes
in the genus Acropora and other groups of scleractinian corals. They will also be useful
for exploring whether species and morphs examined in this study share greater
evolutionary affinities with taxa in other species groups in the genus Acropora.
Classification probabilities may also be a valuable tool for assessing patterns of
morphological variability and affinities of fossil specimens, in relation to other
morphologically similar fossils and extant corals (Hillis 1987). Increased taxonomic
resolution of fossil specimens will greatly enhance our understanding of the
evolutionary history of scleractinian corals, providing evidence of patterns of
morphological variability through time and more accurate means of calibrating
molecular data.
104

CHAPTER 5: PHYLOGENY OF SPECIES AND MORPHS OF THE
ACROPORA HUMILIS SPECIES GROUP BASED ON A MITOCHONDRIAL
MOLECULAR MARKER
5.1 INTRODUCTION
Molecular markers provide alternative tools to traditional morphological characters for
assessing boundaries and evolutionary relationships between species. They provide
additional evidence, which is independent of morphological characters, for resolving
evolutionary relationships and boundaries between species (Avise 1994). This is useful
because the morphological appearance of a species constitutes a multitude of
characters, many of which may have an environmental or other non-genetic component.
Furthermore, molecular markers offer a direct means of tracing the evolutionary history
of species, by mapping genetic lineages.
Despite the advantages of using molecular markers to explore evolutionary
relationships of species, molecular phylogenies may not reflect species phylogenies.
Primary sources of incongruence between gene trees and species trees are incomplete
lineage sorting and introgression (e.g. Avise and Wollenberg 1997; Doyle 1997;
Maddison 1997). Incomplete lineage sorting refers to the situation in which a genetic
sequence, which existed prior to a speciation event, persists without or only partially
diverging within new evolutionary lineages following speciation and therefore provides
no indication of divergence. Introgression refers to the exchange of genes through
hybridization between species that have previously diverged. Ongoing introgression
may lead to stable hybrid populations, which may or may not evolve to form new
species (Arnold 1997). Alternatively, introgression may merge species, or lead to
extinction of one of the parent species through continued backcrossing between the
other parent species and the hybrid offspring (Arnold 1997).
Resolution between the contribution of incomplete lineage sorting and introgression in
evolutionary lineages is controversial, and for many taxa it is possible to argue that
either is the source of incongruence based on the data that is currently available
(Brower et al. 1996). This controversy is partly due to the difficulty of defining whether
species have actually diverged to form separate evolutionary lineages (Avise and Ball
1990; Brower et al. 1996; Avise and Wollenberg 1997) and therefore whether it is valid
105

to argue that shared genetic characters are due to merging of lineages through
hybridization. In addition, existing molecular evidence for many taxa is still
preliminary and therefore conclusions based on this data are likely to change, as more
data becomes available (Doyle 1997).
In studies that have examined species boundaries in scleractinian corals, both
incomplete lineage sorting and introgression are commonly considered as possible
reasons for discordance between molecular and morphological boundaries. However, in
most studies, one mechanism is usually favoured over the other. For example, in the
genus Acropora, introgression has been proposed as the most likely reason for
discordance of both nuclear and mitochondrial markers with morphological species,
based on the ability of species of this genus to hybridize under laboratory conditions
(Odorico and Miller 1997b; Hatta et al. 1999; van Oppen et al. 2000; van Oppen et al.
2001; van Oppen et al. 2002b). In the morphologically similar species Acropora
cytherea and A. hyacinthus, introgression through hybridization seemed to be
infrequent, with assortative mating and disruptive selection apparently operating to
maintain these species as statistically distinguishable lineages (Márquez et al. 2002a;
Márquez et al. 2002b). Similarly, Vollmer and Palumbi (2002) demonstrate that
hybridization occurs rarely between Acropora cervicornis and A. palmata, resulting in
the hybrid A. prolifera. Low levels of introgression were apparent for one
mitochondrial marker, while there was no evidence of introgression for two others.
Shared alleles for one of the nuclear markers are due to incomplete lineage sorting,
while the other has diverged completely between the parent species. In the genus
Madracis, two species were completely resolved, while introgressive hybridization is
the most likely mechanism maintaining shared polymorphisms between three other
species (Diekmann et al. 2001). In the family Faviidae, the lack of electrophoretic
differentiation between morphologically distinct species in the genus Platygyra (Miller
and Benzie 1997) is consistent with the ability of these species to interbreed (Miller and
Babcock 1997). Conflicting results have been reported for the three morphologically
distinct species of the Montastraea species complex. In one study, there was no
evidence of divergence between these species for a nuclear and a mitochondrial marker
(Medina et al. 1999). In contrast, one of these species is distinct based on
electrophoretic data (Knowlton et al. 1992), AFLP (amplified fragment length
polymorphism) patterns and possibly a microsatellite locus (Lopez et al. 1999). Lack of
106

differentiation between the other two species appears to be due to incomplete lineage
sorting (Lopez et al. 1999). Consistent patterns occur between morphological and
electrophoretic criteria between species of Porites (Weil 1992; Garthwaite et al. 1994),
Pavona (Maté 2003) and Montipora (Stobart and Benzie 1994) suggesting divergence
has occurred between the species examined.
The large number of species in the genus Acropora (113 species in Wallace 1999) may
be due to relatively rapid and recent speciation. While the earliest fossils of the genus
Acropora are from the Paleocene and Eocene (Wallace 1999), fossil records indicate
that most speciation in this genus has occurred since the start of the Neogene,
coinciding with the notable increase in shallow water carbonates and reef development
in the south-east Asian region (Wilson and Rosen 1998). This is corroborated by the
paucity of fossils of the genus Acropora in an early Miocene assemblage in southern
Iran, with a marked radiation for the genus Acropora in the Indo-West Pacific dated in
the late Miocene or Pliocene (McCall et al. 1994). Similarly, Fukami et al. (2000)
conclude, on the basis of combined sequence divergence of the cytochrome b and
ATP6 molecular markers, that radiation within the genus Acropora has occurred since
the late Miocene. If this apparent rapid and recent divergence in the genus Acropora is
correct, this would support the proposal of incomplete lineage sorting rather than
introgression as an explanation of the lack of divergence reported for many species of
this genus. Criteria used for interpreting evolutionary relationships between corals and
other taxa, such as morphological, molecular and breeding characters are least likely to
be congruent during divergence, with congruence between different criteria becoming
more likely as the time since divergence increases and the process of speciation is
completed (Avise and Ball 1990).
The high levels of divergence generally reported for mitochondrial genomes in many
animals, which make mitochondrial markers useful for phylogenetic analyses, are
inconsistent in anthozoans (reviewed in Shearer et al. 2002). This slower rate of
evolution is likely to have contributed to the discordant patterns of molecular and
morphological boundaries reported between species of corals, in studies that have used
mitochondrial markers. In these studies, clear patterns of evolutionary divergence are
only evident in relatively distantly related taxa. Sequences from the mitochondrial
cytochrome c oxidase subunit I (COI) differed by 2.4-2.7 % between the three species
107

of the Montastraea annularis species complex and M. cavernosa, but were virtually
identical for the three species within the species complex (Medina et al. 1999).
Sequence divergence for the cytochrome b gene ranged from 0.0-0.8% for nine species
of Acropora, compared to 4.8-5.5% for these nine species and a confamilial species
Montipora aequituberculata (van Oppen et al. 1999b). Similarly, for the same marker,
Fukami et al. (2000) reported differences of 0.0-0.95% for eight species of Acropora
and up to 8.46% when these species were compared with seven additional species of
different genera within the same family. Using a second molecular marker, ATP-6 and
the same set of species, Fukami et al. (2000) also reported divergence levels of 0.0-
0.46% between the eight species of Acropora and up to 6.13% for the additional seven
species. The only other mitochondrial marker that has been used to examine species
boundaries in scleractinian corals is the putative control region, identified and described
by van Oppen and colleagues (van Oppen et al. 1999a; van Oppen et al. 2002a). The
control region is thought to be the most rapidly evolving region of the mitochondrial
genome (Shearer et al. 2002) and therefore is expected to have the greatest potential for
resolving boundaries between closely related taxa. However, surprisingly low levels of
sequence divergence (0.0-6.9%) have also been recorded for this marker, for a range of
species within the subgenus Acropora (Chapter 3; van Oppen et al. 2001; Márquez et
al. 2002b). Substantially higher levels were recorded between species of the subgenera,
Acropora and Isopora, ranging from 15.11-18.84% (van Oppen et al. 2001). Despite
the low levels of divergence of the putative control region, distinct clades were resolved
for all studies that have used this marker to examine species boundaries in the genus
Acropora (Chapter 3; van Oppen et al. 2001; Márquez et al. 2002b; Vollmer and
Palumbi 2002).
Polymorphic sequence blocks within the mtDNA control region have been excluded
from previous phylogenetic analyses of the genus Acropora (Chapter 3; van Oppen et
al. 2001; Márquez et al. 2002b), despite their potential to contribute additional
information to the interpretation of evolutionary relationships (Wiens 1999). These
polymorphic regions have not been included in previous studies for at least two
reasons. The mtDNA control region is generally considered to occur in single copies
within an individual, and therefore single sequences are thought to be adequate for
analyzing phylogenetic relationships using this marker (Avise 1994). On this premise,
it has been necessary to exclude these polymorphic regions before analysis, because
108

they do not give a consistent phylogenetic signal for a single individual. In addition, the
mechanisms by which these regions evolve were uncertain (van Oppen et al. 2001),
although possible mechanisms and their evolutionary significance have recently been
investigated (van Oppen et al. 2002a). However, patterns of variation within an
individual have not been examined, even though the repeat sequence blocks commonly
occur within the mtDNA control region, and therefore contribute to the variation within
this marker (Avise 1994; van Oppen et al. 2002a), as demonstrated for colonies of the
Acropora humilis species group (Chapter 3). To determine the evolutionary
significance and mechanisms by which these regions may be evolving, it is necessary
to first document patterns of variation within and between individuals.
In this study, I use molecular phylogenetic analyses of the putative control region to
examine whether interpretation at the sub-species level can resolve evolutionary
boundaries within the Acropora humilis species group and to examine how
relationships vary within and between species across a broad biogeographic range, for
this marker. To achieve these objectives, I use the sequences analysed in chapter 3 as
well as additional sequences from samples collected across the west to central Pacific
of the species and morphs defined in Chapter 4. To further explore evolutionary
relationships of the species of the A. humilis group, I compare the phylogenetic position
of these sequences with GenBank sequences of the same molecular marker (from van
Oppen et al. 2001). In this comparison, the GenBank sequences are sequences from
species of the A. humilis group and from species that appear to be closely related, based
on a morphological phylogeny of the genus Acropora (Wallace 1999). I also compare
the molecular phylogeny presented in this chapter with the morphological phylogeny of
Wallace (1999), to test for congruence between these phylogenies. Finally, I compare
patterns of variation within and between individuals for the putative control region,
based on the occurrence of repeat sequence blocks, to examine whether they may
provide additional phylogenetic information for interpreting evolutionary relationships
between the species and morphs of the A. humilis species group.
5.2 METHODS
5.2.1 COLLECTION OF MOLECULAR SAMPLES
Samples for molecular analysis were collected using the protocol described in Chapter
2 and identified as species or morphs of the Acropora humilis species group. Colonies
109

used in this chapter are a subset, representing taxonomic and biogeographic
components, of the colonies examined in the morphological analyses in Chapter 4. One
to four colonies were examined for each species from each region, with two exceptions
(Table 5.1). Firstly, six colonies of A. humilis were analysed from American Samoa,
including two colonies of each of the putative morphs of this species, as described in
Chapter 2. Secondly, colonies of A. gemmifera from the Solomon Islands were not used
because the DNA was degraded in these samples. Intermediate and sub-morphs from
most regions and locations in which they were recorded, with the exception of “mont-
hum”, were also examined in the molecular analysis (Table 5.1). Acropora austera was
selected as the most appropriate outgroup because it is directly ancestral to the species
examined in this study (Chapter 3), based on a morphological phylogeny of the genus
Acropora (Wallace 1999) (Fig. 1.1).
5.2.2 MOLECULAR TECHNIQUES AND ANALYSIS
Extraction, amplification, cloning and sequencing of samples follow the same protocols
used in Chapter 3. As described in Chapter 3, the molecular marker was the mtDNA
putative control region, amplified using primers developed by van Oppen et al. (1999a).
This marker is referred to as the mtDNA intergenic region for the remainder of this
paper, as in van Oppen et al. (2001). Multiple cloned sequences were obtained for most
individuals (as indicated in Table 5.1), to examine variation in the frequency of
occurrence and position of repeat sequence blocks within and between individuals of
the Acropora humilis species group, across the biogeographic range of this study.
Phylogenetic analysis of this marker was based on consensus sequences for each
individual, with repeat sequence blocks deleted (as in Chapter 3). Sequences were
aligned manually using Seqapp 1.99 (Gilbert 1994). Calculation of the pairwise
sequence distance matrix and the maximum parsimony and likelihood phylogenetic
analyses were performed in PAUP* 4.0b10 (Swofford 2002). Phylogenetic analyses
used the heuristic search option. Bootstrapping with 1000 pseudoreplicates determined
the robustness of clades, with branches supported by <50% being collapsed as
polytomies. The maximum parsimony analysis was run with gaps excluded from the
analysis, as well as treating gaps as a fifth character. The best-fit model of sequence
110

Table 5.1 Number of colonies sequenced and number of cloned sequences of the
mtDNA intergenic region obtained from each species and morph of the Acropora
humilis species group and A. austera. Morph Region: Location a Sample
Code Sequences / Individual
Sequence Type
Base Differences d
GenBank Accession
No. b
MTQ Registration
No. b A. samoensis Indonesia: 1 62 2 I 2 5 G56648 75 3 I 3 1-5 G56649 76 1 I 1 G56650 Australia: 1 119 5 I 5 1-7 AY364090–4 G56366 121 5 I 5 2-4 AY364095–9 G56367 PNG: 1 14 5 I 5 1-7 G56651 Solomon Islands: 1 44 10 III 10 2-8 G56657 A. humilis Taiwan: 3 7 4 I 4 1-4 G56665 4 1 III 1 G56663 Indonesia: 3 9 5 I 5 1-6 G56668 13 4 I 4 0-2 G56669 Australia: 1 23 2 I 2 2 AY364100–1 G56368 32 3 I 3 2-7 AY364102–4 G56369 PNG: 1 17 6 I 6 1-7 G56672 33 7 I 7 3-9 G56674 Solomon Islands: 1 26 4 I 4 2-11 G56677 27 7 I 7 1-9 G56678 29 1 I 1 G56679 “A. humilis 1” c American Samoa: 2 15 1 I 1 G55587 51 2 I 2 2 G55589 “A. humilis 2” c American Samoa: 2 61 2 I 1
II 1 1 G55594
79 5 I 3 III 2
1-8 G55595
“A. humilis 3” c American Samoa: 2 66 5 I 3 III 2
2-6 G55599
80 6 I 6 1-6 G55600 A. globiceps French Polynesia: 1 9 2 I 2 2 G56682 10 1 I 1 G56683 12 5 I 5 3-5 G56684 A. gemmifera Indonesia: 1 50 1 I 1 G56689 Australia: 1 108 4 I 3
III 1
0-10 AY364105 AY364107-8
AY364106
G56370
PNG: 1 10 7 I 7 1-8 G56692 31 2 I 1
III 1 20 G56694
A. monticulosa Taiwan: 5 76 7 I 6 III 1
2-19 G56701
84 7 I 6 III 1
1-6 G56702
Australia: 1 30 8 I 5 III 3
0-9 AY364109–10 AY364113–15 AY364111–12
AY364116
G56371
34 4 I 4 3-6 AY364117–20 G56372 Solomon Islands: 1 12 7 I 7 0-6 G56703 32 9 III 9 1-4 G56704 American Samoa: 1 125 4 I 4 0-5 G55616 128 3 I 3 0-5 G55617 A. digitifera Taiwan: 2 22 1 I 1 G56707 Taiwan: 3 14 1 I 1 G56706 Indonesia: 1 45 2 I 2 10 G56799 46 8 I 8 2-7 G56800 Indonesia: 2 39 5 I 4
III 1 3-6 G56801
40 7 I 5 III 2
2-8 G56802
Australia: 1 122 1 I 1 AY364121 G56373 124 5 I 5 0-3 AY364122–6 G56374
111

Table 5.1 continued PNG: 1 1 8 I 8 1-10 G56714 2 7 I 7 2-5 G56715 Solomon Islands: 1 13 8 I 6
III 2 1-7 G56720
A. retusa French Polynesia: 1 14 11 I 10 III 1
2-6 G56728
A. multiacuta Indonesia: 1 65 3 III 3 2-6 G56730 82 6 III 6 0-6 G56731 “sam-hum” Australia: 1 94 5 I 5 1-3 AY364127–31 G56375 Solomon Islands: 1 20 3 I 1
III 2 2-6 G56741
“sam-gem” Australia: 1 95 3 I 3 0-2 AY364132–4 G56376 “hum-gem” Australia: 1 105 5 I 5 1-7 AY364135–9 G56377 “hum-gem plate” Taiwan: 3 11 1 I 1 G56758 “mont-gem” Taiwan: 3 10 1 I 1 G56765 Taiwan: 5 73 6 I 3
III 3 1-4 G56767
Indonesia: 3 3 1 I 1 G56769 Indonesia: 4 31 3 III 3 3-12 G56770 32 4 I 4 1-7 G56771 PNG: 1 3 5 I 3
III 2 1-4 G56774
6 1 I 1 G56775 19 1 I 1 G56777 Solomon Islands: 1 17 8 I 8 2-6 G56780 19 5 I 5 2-7 G56781 American Samoa: 1 102 7 I 5
III 2 1-17 G55610
American Samoa: 2 64 5 I 5 0-7 G55607 “dig-gem” Australia: 1 27 9 I 9 1-6 AY364140–8 G56379 35 6 I 6 2-10 AY364149–54 G56380 “fine sam” Indonesia: 1 89 4 I 4 2-3 G56787 “Penghu hum” Taiwan: 1 39 1 I 1 G56789 Taiwan: 4 68 6 III 6 0-5 G56793 “terete mont” Australia: 1 6 1 III 1 AY364155 G56378 “digitate mont” Taiwan: 5 71 4 IV 3
V 1 1-7 G56795
72 1 I 1 G56796 Solomon Islands: 1 18 5 I 1
IV 4 1-15 G56797
American Samoa: 3 24 1 I 1 G55613 “Samoan dig” American Samoa: 1 121 6 I 6 1-5 G55605 124 3 I 3 0-9 G55606 “encrusting dig” Taiwan: 5 75 4 I 4 2-6 G56798 A. austera Australia: 1 111 3 VI 3 2-6 AY364156–8 G56381 112 2 VI 2 5 AY364159–60 G56382 113 2 VI 2 9 AY364161–2 G56383 PNG: 1 45 4 VI 4 0-7 G56803 46 3 VI 3 2-6 G56804 49 7 VI 7 0-6 G56805 a Location codes within regions are given in Table 4.1; Sequences from Lizard Island, Australia are also presented in
chapter 3. b GenBank Accession numbers and corresponding Museum of Tropical Queensland (MTQ) registration
numbers for morphological reference samples are listed for each colony. c Putative morphs 1, 2 and 3 of A. humilis
from American Samoa, as described in chapter 2. d Base differences is the number of base differences between
sequences within an individual, excluding repeat sequence blocks.
112

evolution (HKY + G) was determined using Modeltest 3.06 (Posada and Crandall
1998) and the Akaike Information Criterion method, for the maximum likelihood
analysis. Sequences from samples from Lizard Island, Australia have been submitted to
GenBank (Table 5.1 and Chapter 3). Sequences from samples from other locations will
be available from GenBank following publication of this chapter. Morphological
samples are deposited at the Museum of Tropical Queensland (MTQ), Townsville,
Australia (Accession numbers are listed in Table 5.1). GenBank accession numbers and
MTQ registration numbers will be cross-referenced with the reciprocal institutions.
5.2.2.1 COMPARISON WITH GENBANK SEQUENCES
The phylogenetic relationship between colonies of the species and morphs examined in
this study are compared with results of van Oppen et al. (2001) for the same molecular
marker, for species of the Acropora humilis species group and other species within the
DND clade (“digitifera–nasuta-divaricata groups”) (Wallace 1999) (see Fig. 1.1).
Sequences from the study of van Oppen et al. (2001) were downloaded from GenBank.
Accession numbers for these sequences are as follows: A. humilis: AY26440,
AY26441, AY26442; A. gemmifera: AY26437, AY26438, AY26439; A. digitifera:
AY26431; A. valida: AY26460; A. nasuta: AY26450; A. cerealis: AY26424,
AY26425, AY26426; A. divaricata AY26432, AY26433.
5.2.2.2 COMPARISON OF MOLECULAR AND MORPHOLOGICAL
PHYLOGENIES
Comparison is also made between the molecular phylogeny in this study and the
morphological phylogeny of Wallace (1999). Consensus sequences of the mtDNA
intergenic region, for each species, were used in this comparison, with gaps treated as a
fifth character. Consensus sequences for species of the Acropora humilis species group
and A. austera were reduced from all sequences obtained in this study. GenBank
sequences from the study of van Oppen et al. (2001) for the species A. nasuta, A.
valida, a consensus sequence of the two A. divaricata sequences and the sequence for
A. cerealis in clade I (Fig. 5.1) were also included in the comparison. No explanation
was evident for the anomalous position of the two sequences of A. cerealis in clade IIc
(Fig. 5.1), and therefore they were not included in this analysis. The molecular
phylogeny was forced to match the morphological phylogeny of Wallace (1999), using
the program MacClade 4.03 (Maddison and Maddison 2001). This forced topology was
113

then compared to trees produced in an exhaustive search for the mtDNA intergenic
region, in PAUP* 4.0b10 (Swofford 2002), to test whether the morphological
phylogeny was significantly different from the molecular phylogeny, using the one-
tailed Kishino-Hasegawa test and the two-tailed Templeton-Wilcoxon signed-ranks
test.
5.3 RESULTS
5.3.1 PHYLOGENETIC ANALYSIS
Phylogenetic analysis of the sequences obtained in this study for the mtDNA intergenic
region separated the species and morphs of the Acropora humilis species group into
three major evolutionary lineages (Fig. 5.1). Within each lineage, there was a clear
pattern of taxonomic structuring for all samples, across the biogeographic range of this
study. Sequences from the species A. digitifera grouped in one lineage (clade I),
sequences from A. samoensis, A. humilis, A. globiceps, A. gemmifera and A.
monticulosa grouped in a second composite lineage (clade II) and sequences from A.
multiacuta formed a third lineage distinct from all other species and morphs. The single
sequence from A. retusa branched from clades I and II, with weak bootstrap support.
Sequences from the morphs “dig-gem”, “encrusting dig” and one colony of “digitate
mont” grouped with the A. digitifera sequences in clade I. Four sub-clades were present
within clade II. Clade IIa comprised one sequence from a colony of A. samoensis, two
from colonies of A. humilis and one from a colony of “sam-hum”. Clades IIb and IIc
were both ‘monticulosa’ clades with the two colonies of A. monticulosa from Australia
forming clade IIb and the remaining sequences of this species from Taiwan, the
Solomon Islands and American Samoa grouping with sequences from colonies of
“terete mont”, “digitate mont” and “Samoan dig” in clade IIc. Clade IId contained the
remaining sequences from A. samoensis and A. humilis and all sequences from A.
globiceps and A. gemmifera. Sequences from the three putative morphs of A. humilis
from American Samoa, as defined in Chapter 2 were undifferentiated within this sub-
clade, as were sequences from the intermediate morphs “sam-hum”, “sam-gem”, “hum-
gem plate”, “mont-gem” and the sub-morphs “fine sam” and “Penghu hum”.
114

Fig. 5.1 Maximum parsimony consensus tree (50% majority rule) with mid-point
rooting, produced in the analysis of the mtDNA intergenic region for species and
morphs of the Acropora humilis species group, A. austera and GenBank sequences
from the study by van Oppen et al. (2001) for the species A. humilis, A. gemmifera, A.
digitifera, A. cerealis, A. nasuta, A. valida and A. divaricata. Gaps were treated as
missing characters in this analysis. Numbers above branches indicate bootstrap values
(1000 replicates) for branches with >50% support. Species names and sample codes are
given for each individual. Sample codes are as listed in Table 5.1 for sequences from
this study. GenBank accession numbers for the study by van Oppen et. al. (2001) are in
bold font and contain 5 digit number prefixed by AY. Clade I and sub-clades of clade II
are named after the species of the Acropora humilis species group within each clade.
Symbols indicate the region in which colonies were sampled: Taiwan □ , Indonesia △,
Australia , PNG ◇, Solomon Islands ☆, American Samoa ○, French Polynesia ✖.
Filled symbols highlight GenBank sequences from Australia.

53
“hum-gem” 105
A. gemmifera 10A. gemmifera 108
A. gemmifera 50
1 change
A. humilis 7, 9, 29A. samoensis 62, 75, 119, 121, 14
A. samoensis 76
A. monticulosa 76, 12, 125
“encrusting dig” 75
A. austera 45A. austera 113, 46
A. austera 111, 112, 49
A. globiceps 9A. globiceps 10
A. globiceps 12
A. humilis AY26440A. humilis AY26441A. digitifera AY26431
“Penghu hum” 39, 68
A. humilis 23A. humilis 32
A. humilis 33A. humilis AY26442, 17
A. humilis 26A. humilis 27
“A. humilis 1” 15“A. humilis 1” 51“A. humilis 2” 70
“A. humilis 2” 79“A. humilis 3” 66“A. humilis 3” 80
“sam-hum” 94
“hum-gem plate” 11
A. gemmifera 31
“mont-gem” 31
“mont-gem” 6“mont-gem” 19
“mont-gem” 3“mont-gem” 3
“mont-gem” 10, 73, 32, 17, 19
“mont-gem” 72“mont-gem” 102
“sam-gem” 95
“fine sam” 89
A. retusa 14A. multiacuta 65, 82
A. digitifera 14A. digitifera 22A. digitifera 122
A. gemmifera AY26437A. gemmifera AY26438
A. gemmifera AY26439
A. cerealis AY26425A. nasuta AY26450
A. valida AY26460
A. divaricata AY26432A. divaricata AY26433
“digitate mont” 24
A. digitifera 39, 40, 45, 46, 124, 1, 2, 13“dig-gem” 27, 35
“Samoan dig” 124
“terete mont” 6“digitate mont” 71
“digitate mont” 72“digitate mont” 18
“Samoan dig” 121
A. monticulosa 32
A. monticulosa 84
A. monticulosa 128
96
82
73
A. samoensis 44
“sam-hum” 20A. humilis 13
A. humilis 489
A. monticulosa 30, 3498
65
62
6481
A. cerealis AY26424, AY2642694
64
93
96
61
87
100 6099
Clade IIbmonticulosa
Clade Idigitifera
Clade IIahumilis
-samoensis
A. austeraClade
Clade IIcmonticulosa
Clade IIdsamoensis
-humilis
-globiceps
-gemmifera
115

5.3.1.1 COMPARISON WITH GENBANK SEQUENCES
The phylogenetic position of GenBank sequences from a previous study by van Oppen
et al. (2001), for colonies of the Acropora humilis species group, were consistent with
those obtained in this study for A. humilis but not for A. gemmifera and A. digitifera
(Fig. 5.1). Sequences from the three colonies of A. humilis grouped in clade IId, as did
most sequences obtained in this study for this species. In contrast, the three GenBank
sequences for A. gemmifera grouped within the ‘digitifera’ clade (clade I) while the
GenBank A. digitifera sequence grouped in the ‘samoensis-humilis-globiceps-
gemmifera’ clade (clade IId). Most sequences from species of the DND (‘digitifera-
nasuta-divaricata’, Fig. 1.1) clade in the morphological phylogenetic analysis of
Wallace (1999), grouped in the ‘digitifera’ clade (clade I) (Fig. 5.1). One sequence of
each of A. valida, A. nasuta and A. cerealis and sequences from two colonies of A.
divaricata were in clade I, while sequences from two other colonies of A. cerealis were
in the ‘monticulosa’ clade (clade IIc).
5.3.1.2 COMPARISON OF MOLECULAR AND MORPHOLOGICAL
PHYLOGENIES
Forcing the topology of the molecular phylogenetic analysis to follow that of the
morphological tree of Wallace (1999) resulted in a tree that was significantly different
(p<0.0001 for both the one and two tailed tests), with an additional 29 steps (Fig. 5.2).
An exhaustive search of the consensus sequences of the mtDNA intergenic region
produced two equally parsimonious trees of 127 steps, differing only in that Acropora
valida and A. divaricata were sister taxa in one tree and a polytomy in the other. In
comparison with these trees, the tree with the forced topology required 156 steps.
Differences in the trees with and without the forced topology were due to the relative
positions of species of the A. humilis species group, while the positions of A. austera,
A. divaricata, A. cerealis, A. nasuta and A. valida were consistent. The greatest
differences in the two trees were due to A. retusa, A. samoensis and A. monticulosa. In
the morphological tree, A. retusa branched directly from the polytomy formed by A.
divaricata, A. cerealis, A. nasuta and A. valida. In the molecular tree, however, A.
retusa had a more basal position branching with strong bootstrap support from the
polytomies formed by the species of clades I and II (Fig. 5.1). Acropora samoensis is
the next most derived species, branching from A. retusa in the morphological tree, in
116

Fig. 5.2 Comparison of the morphological tree of Wallace (1999) and the molecular
tree of the mtDNA intergenic region for the species of the Acropora humilis species
group, A. austera and other species of the DND clade for which sequences were
available: i.e. A. cerealis, A. nasuta, A. valida and A. divaricata. The molecular tree is a
50% majority rule consensus tree drawn from the two equally most parsimonious trees
of an exhaustive search of single sequences for each species. Numbers above branches
are bootstrap values (1000 replicates), for branches with >50% support. The bootstrap
values of 100% indicated that the same species grouped together in both of the most
parsimonious trees.

A. re
tusa
A. s
amoe
nsis
A. d
igiti
fera
A. m
ontic
ulos
a
A. m
ultia
cuta
A. d
ivar
icat
a
A. c
erea
lis
A. n
asut
a
A. v
alid
a
A. g
emm
ifera
A. h
umilis
A. a
uste
ra
Mor
phol
ogic
al P
hylo
geny
(red
raw
n fr
om W
alla
ce 1
999)
Con
sens
us T
ree:
mtD
NA
Inte
rgen
ic R
egio
n
A. re
tusa
A. s
amoe
nsis
A. d
igiti
fera
A. m
ontic
ulos
a
A. m
ultia
cuta
A. g
emm
ifera
A. h
umilis
A. a
uste
ra
A. c
erea
lis
A. n
asut
a
A. v
alid
a
A. d
ivar
icat
a
100
100
100
100
100
100
117

contrast to the molecular tree in which it groups within a polytomy with the other clade
II species. Acropora monticulosa also groups within this clade II polytomy in the
molecular tree, but forms its own lineage in the morphological tree. Acropora digitifera
appears to be relatively closely related to A. divaricata, A. cerealis, A. nasuta and A.
valida in both analyses. Acropora humilis and A. gemmifera form polytomies in each
tree, emphasizing the close relationship of these species. Acropora multiacuta formed a
separate lineage in both analyses, supporting the apparent distinction of this species.
Base composition of consensus sequences obtained in this study from species and
morphs of the Acropora humilis group and A. austera was homogeneous (Table 5.2),
and almost identical to that reported in Chapter 3 for a single geographic location.
Level of divergence between sequences obtained in this study (Table 5.3) was low, as
also reported in Márquez et al. (2002b) and van Oppen et al. (2001) and similar to that
reported in Chapter 3. Maximum sequence divergence between the A. humilis species
group and A. austera was 6.03% (Table 5.3), more than double the level of divergence
between sequences from species and morphs within the A. humilis species group.
Table 5.2 Mean base compositions (%) for sequences obtained in this study from the
mtDNA intergenic region for species and morphs of the Acropora humilis species
group and Acropora austera a.
A C G T
24.8 (0.002) 17.2 (0.002) 26.4 (0.002) 31.6 (0.003) a Standard deviations are given in parentheses.
Table 5.3 Average Kimura 2-parameter pairwise distances (%) within and between
sequences obtained in this study from the mtDNA intergenic region for species and
morphs of the Acropora humilis species group and Acropora austera a.
A. humilis species group A. austera
A. humilis species group 0.96 (2.56) 5.31 (6.03)
A. austera 0.24 (0.66) a Maximum values are given in parentheses.
118

Nonetheless, sequences from colonies of A. austera were not sufficiently different to
form a natural outgroup. Trees produced in the phylogenetic analyses were therefore
drawn using the midpoint rooting option (as in Chapter 3). The aligned consensus
sequences consisted of 1077 positions with repeat sequence blocks deleted. Prior to
deletion of repeat sequence blocks, individual sequences ranged in length from 1094 to
1343 bp. Within the aligned sequences, 923 positions were constant, 69 variable
characters were not parsimony informative and 85 were parsimony informative.
Maximum parsimony (MP) and maximum likelihood (ML) analyses of the single data
set, comprising the consensus sequences obtained in this study and the GenBank
sequences from van Oppen et al. (2001), produced trees with similar topologies and
levels of bootstrap support and the same combination of sequences in each clade. The
trees resulting from each analysis mainly differed in the structure of the sub-clades in
clade II. In the MP analysis, clade IIa formed a separate branch with 81% bootstrap
support, while the remaining three clades (IIb, IIc and IId) formed a polytomy (Fig.
5.1). In the ML analysis the four sub-clades formed a polytomy with 60% bootstrap
support. The single sequence from Acropora retusa branched from clades I and II, with
weak bootstrap support in both analyses (65% in the MP and 62% in the ML analysis).
Treating gaps as a fifth character in the MP analysis did not change the tree topology,
as also reported in Chapter 3 and by van Oppen et al. (2001). All A. austera sequences
grouped as a distinct clade with strong (100%) bootstrap support in both MP analyses
and the ML analysis. MP analysis with gaps treated as missing characters produced 29
most parsimonious trees of 183 steps. A consistency index of 0.863, a retention index
of 0.971 and a homoplasy index of 0.137 indicate a strong phylogenetic signal in the
sequence data.
5.3.2 VARIABILITY OF SEQUENCE REPEATS IN THE mtDNA
INTERGENIC REGION
Alignment of all cloned sequences of the mtDNA intergenic region obtained in this
study indicated the existence of six sequence types, defined according to the presence
and position of repeat sequence blocks or deletions (Fig. 5.3). Type I sequences were
the most common, against which all other sequence types are compared. Type II
sequences differed from type I in having a unique repeat sequence block between
positions 919 and 1032, repeating bases from positions 805-918. Sequence types IV
119

Fig. 5.3 Alignment of cloned sequences of the mtDNA intergenic region, showing
examples of the six sequence types (Types I - VI) found in this study. Dots indicate the
same bases as shown in the upper (Type I) sequence and dashes indicate alignment
gaps. Positions of repeat sequence blocks are indicated with unfilled arrows. Location
of bases from positions 1-165, 293-718, 1043-1216 and 1259-1462 are indicated with
solid arrows, but not shown in the alignment. Codes for sequences are as follows: H323
Acropora humilis from Lizard Island, Australia; H702 “A. humilis 2” from Ofu,
American Samoa; S442 A. samoensis from Ghizo Island, Solomon Islands; dM181
“digitate mont” from Ghizo Island, Solomon Islands; dm711 “digitate mont” from
Lanyu, Taiwan; A1111 A. austera from Lizard Island, Australia. The last digit for each
sequence code indicates the clone number, the digits preceding the clone numbers
correspond with the sample code in Table 5.1.

Type I H323 TTATTGAGAC
---
---
--
---
--
---
---
--
---
--
---
---
--
---
--
---
---
--
---
--
---
---
--
---
---
--
---
--
---
---
--
---
--
---
---
--
---
--
---
---
--
Type II H702 .....................................................................................................................
Type III S442 .........T...........................................................................................................
Type IV dM181 .........TGCTAAATTTATTCGGGAACATGGATTTTATAGTGGAGGAATGGCCCTTGAAACAGGTCCGTCAGGCCTGGGGGCAAAAAAGAATACAGCGATGCGACTTATTGAGAT
Type V dM711 .........TGCTAAATTTATTCGGGAACATGGATTTTATAGTGGAGGAATGGCCCTTGAAACAGGTCCGTCAGGCCTGGGGGCAAAAAAGAATACAGCGATGCGACTTATTGAGAT
Type VI A1111 .CG......T...........................................................................................................
H323 ACTAAATCTA TCTGCACAAAGTATTGGGGCAGTGGCGGGGGAACTATCACATCAAGGTTCTCTGCATAGTTTTAACTCAATGTGTGGGGAGGCTCTCGGGGCTCGGGGGTCAATGTTCCAAGGTTCT
H702 .......... .....................................................................................................................
S442 .......... ..........
---
---
--
---
--
---
---
--
---
--
---
---
--
---
--
---
---
--
---
--
---
---
--
---
---
--
---
--
---
---
--
---
--
---
---
--
---
--
---
---
--
dM181 .......... .....................................................................................................................
dM711 .......... ..........
---
---
--
---
--
---
---
--
---
--
---
---
--
---
--
---
---
--
---
--
---
---
--
---
---
--
---
--
---
---
--
---
--
---
---
--
---
--
---
---
--
A1111 G......... .T........
---
---
--
---
--
---
---
--
---
--
---
---
--
---
--
---
---
--
---
--
---
---
--
---
---
--
---
--
---
---
--
---
--
---
---
--
---
--
---
---
--
H323 GCACAAAGTTTTGGGTCAGTGGCGGGGGAACTATCACATCAAGGTACTCTGCATAGTTTTAACTCAATGTGTGGGGAGGCTCT
--
---
--
---
---
--
---
--
---
---
--
---
--
---
---
--
---
-H702 .........T...................................T.....................................CGGGGCTCGGGGGTCAATGTTCCAAGGTTCTGCACAAAGTTTTGG
S442
---
---
-..T.....G.............................T.....................................
--
---
--
---
---
--
---
--
---
---
--
---
--
---
---
--
---
-dM181 .........A...................................T.....................................
--
---
--
---
---
--
---
--
---
---
--
---
--
---
---
--
---
-dM711
---
---
-..A...................................T.....................................
--
---
--
---
---
--
---
--
---
---
--
---
--
---
---
--
---
-A1111
---
---
-..T...................................T.....................................
--
---
--
---
---
--
---
--
---
---
--
---
--
---
---
--
---
-
H323
---
---
--
---
--
---
---
--
---
--
---
---
--
---
---
--
---
--
---
---
--
---
--
---
---
--
-TTATCAGCCA GGCGGTTTAGTTTTTGGTTTTTAGAAGATTGGTGCTTTTGAA
H702 GTCAGTGGCGGGGGAACTATCACATCAAGGTTCTATGCATAGTTTTAACTCAATGTGTGGGGAGGCTCT.......... ..........................................
S442
---
---
--
---
--
---
---
--
---
--
---
---
--
---
---
--
---
--
---
---
--
---
--
---
---
--
-.......... ..........................................
dM181
---
---
--
---
--
---
---
--
---
--
---
---
--
---
---
--
---
--
---
---
--
---
--
---
---
--
-.......... ..........................................
dM711
---
---
--
---
--
---
---
--
---
--
---
---
--
---
---
--
---
--
---
---
--
---
--
---
---
--
-.......... ..........................................
A1111
---
---
--
---
--
---
---
--
---
--
---
---
--
---
---
--
---
--
---
---
--
---
--
---
---
--
-.......... ..........
---
---
--
---
--
---
---
--
-..........
1-16
5
293-
718
1043
-121
612
59-1
462
176
282
729
842
919
1032
1227
1248
120
and V contained a sequence block from positions 176 to 282, which was not found in
any other sequence types. This sequence block repeated bases from positions 68-175.
Type IV sequences were otherwise the same as type I sequences. Type V sequences
also differed from type I sequences in that they contained an additional sequence block
from positions 729-842. This additional sequence block was also present in type III and
VI sequences, and repeated bases from positions 843-956. Type III sequences were
otherwise the same as type I sequences, while type VI sequences had a unique deletion
from positions 1227 to 1248.
Various combinations of pairs of sequence types were found in 18 of the 89 colonies
sequenced, indicating that the mtDNA intergenic region can occur as more than one
copy within individuals (Table 5.1) and comparison of this variability may provide
additional information for revealing evolutionary relationships between species and
morphs. No individuals were recorded with more than two sequence types. Sequence
type I was present in at least some individuals of all species and morphs from all
regions, with the exception of both colonies of Acropora multiacuta and the single
colony of “terete mont” in which only type III was recorded. Type III sequences were
the second most common type, and when present in an individual, usually co-occurred
with sequence type I. Type I and III sequences were found in individuals from all
regions, but not the same species and morphs in each region. Both I and II were present
in colonies of A. humilis from American Samoa and Taiwan, A. gemmifera from
Australia and PNG, A. monticulosa from Taiwan, Australia and the Solomon Islands, A.
digitifera from Indonesia and the Solomon Islands, A. retusa from French Polynesia,
“sam-hum” from the Solomon Islands, “mont-gem” from Taiwan, Indonesia, PNG and
American Samoa and “Penghu hum” from Taiwan. The colony of A. samoensis from
the Solomon Islands contained only sequence type III, while colonies of A. globiceps,
“sam-gem”, “hum-gem”, “hum-gem plate”, “dig-gem” or “fine sam” contained only
type I sequences. Sequence type II was present in only one cloned sequence, from a
single colony of “A. humilis” from American Samoa. Type IV sequences were found
only in colonies of “digitate mont” from Taiwan and the Solomon Islands, while one of
the Taiwan colonies of this morph also contained the only type V sequence. Type VI
sequences were found in all colonies of A. austera but not in colonies of any other
species or morph.
121

5.4 DISCUSSION
5.4.1 PHYLOGENY OF THE ACROPORA HUMILIS SPECIES GROUP
Three main evolutionary lineages were evident between species and morphs within the
Acropora humilis group, based on the phylogenetic analysis of the sequences obtained
in this study (Fig. 5.1). A clear pattern of taxonomic structure was evident between
lineages, for all samples across the biogeographic range of this study. Clades I and II
formed two of the lineages, separating A. digitifera in clade I from sequences of A.
monticulosa, A. samoensis, A. humilis, A. globiceps and A. gemmifera in the composite
clade II. The single sequence from A. retusa branched from clades I and II, with weak
bootstrap support. Sequences from the species A. multiacuta formed a third lineage that
was distinct from all other species and morphs.
Clade I comprised all sequences from the species Acropora digitifera, the intermediate
morph “dig-gem” and the sub-morphs “encrusting dig” and “dig mont”. The very high
bootstrap support for this clade indicates a strong divergence of this species and these
morphs from those in clade II. Clade I includes the sequences from colonies of A.
digitifera and “dig-gem” from Lizard Island, Australia in clade I in Chapter 3, as well
as additional sequences from colonies of A. digitifera from Taiwan, Indonesia, Papua
New Guinea and the Solomon Islands. This finding demonstrates the strong similarity
between colonies of A. digitifera across this broad biogeographic range and reinforces
the lack of differentiation between this species and “dig-gem”, for the mtDNA
intergenic region. The grouping of the sub-morph “encrusting dig” within this clade
supports the tentative identification of this morph, based on colony colour (Chapter 4).
Divergence between Acropora samoensis, A. humilis, A. globiceps, and A. gemmifera
and morphs of these species, across the west to central Pacific, was not evident for the
mtDNA intergenic region, suggesting recent or incomplete divergence between these
taxa for this marker (Fig. 5.1). Lack of genetic differentiation was also demonstrated
for the species A. humilis and A. gemmifera in the phylogenetic analysis of the nuclear
28S rDNA marker (Chapter 2, with colonies of “mont-gem” identified as A.
gemmifera). Despite the lack of divergence of these molecular markers, reproductive
barriers have been demonstrated between the species A. samoensis, A. humilis and A.
gemmifera at Lizard Island, Australia (Chapter 3), suggesting recent rather than
incomplete divergence for these species. The grouping of sequences from colonies of A.
122

globiceps in this clade is consistent with the close morphological similarity between
this species and A. humilis (Chapter 4), although testing the potential of these species to
interbreed would confirm whether evolutionary boundaries exist between these species.
The grouping of sequences from all colonies of “mont-gem” within this clade is
consistent with the strong morphological affinity between this morph and the species A.
gemmifera, demonstrated by the likelihood of most colonies of this morph having a
higher probability of being classified as A. gemmifera rather than A monticulosa
(Chapter 4). Grouping of sequences from the morphs “hum-gem plate”, “fine sam” and
“Penghu hum” in clade IId is consistent with their apparent morphological affinities.
Clarification of whether the morphological differentiation of these morphs, from the
species after which they were named, reflected environmental polymorphism or cryptic
species status was not possible due to the lack of further differentiation of the marker
used in this study.
All sequences from the species Acropora monticulosa grouped in clades IIb or IIc (Fig.
5.1). The grouping of sequences from the two colonies of the putative morph
“branching mont” from American Samoa with colonies of A. monticulosa from Taiwan
and the Solomon Islands, supports my decision to classify this morph within this
species (Chapter 4), despite its arborescent rather than the familiar digitate growth form
of this species (Chapter 2). The grouping of sequences from A. monticulosa within
clade II, but in separate sub-clades from A. samoensis, A. humilis, A. globiceps and A.
gemmifera suggests that A. monticulosa has diverged from but shares greatest
evolutionary affinity with these four species. Evolutionary affinity is however also
evident between A. monticulosa and A. digitifera, based on relationships with the
morphs “digitate mont” and “Samoan dig”. The morph “digitate mont” is
morphologically similar to A. monticulosa (Chapter 4), although sequences from
different colonies of this morph grouped in both the ‘digitifera’ clade I and the
‘monticulosa’ clade IIc. Despite the morphological resemblance of the morph “Samoan
dig” to A. digitifera, it also appears to have a strong evolutionary affinity with A.
monticulosa. Four of five colonies of this morph were most likely to be classified as A.
monticulosa in the morphometric analysis (Chapter 4) and sequences of the mtDNA
intergenic region and the 28S rDNA region all grouped with A. monticulosa (Fig. 5.1,
this chapter and Chapter 2 respectively). Evolutionary affinities of the morph “terete
mont” also appears to be with two species, i.e. A. monticulosa and A. humilis. The
123

sequence from this morph grouped in the ‘monticulosa’ clade IIc (Fig. 5.1), while it
showed a greatest but only a moderate potential to interbreed with A. humilis. On this
basis and its morphological appearance, this morph may be a hybrid, derived from the
species A. monticulosa and A. humilis, as suggested in Chapter 3.
5.4.1.1 COMPARISON WITH GENBANK SEQUENCES
Phylogenetic relationships for sequences of the mtDNA intergenic region obtained in
this study were consistent with van Oppen et al. (2001) for Acropora humilis but
inconsistent for A. gemmifera and A. digitifera (Fig. 5.1). The three sequences from
colonies of A. humilis grouped within clade IId, as did most sequences for this species
in this study. However, the three sequences from colonies of A. gemmifera grouped
within the ‘digitifera’ clade (clade I), while the single sequence from A. digitifera
grouped within clade IId. Based on the consistent grouping of colonies of A. digitifera
and “dig-gem” in a well-supported clade (96% bootstrap support) that is distinct from
the other species of the A. humilis group (Fig. 5.1) and the morphological affinities of
the intermediate morph “dig-gem” with A. digitifera and A. gemmifera (Chapter 4), it
seems likely that the colonies identified as A. gemmifera in the study by van Oppen et
al. (2001), may in fact belong to the morph “dig-gem”. Furthermore, the colony
identified as A. digitifera by van Oppen et al. (2001), may be A. humilis, and hence
explain the grouping of the sequence from this colony in clade IId. This proposal is
supported by the collection details of this colony, which was collected from Magnetic
Island on the Great Barrier Reef, Australia (Table 1: van Oppen et al. 2001).
Specifically, A. digitifera does not occur at Magnetic Island and A. humilis is the only
species of the A. humilis species group that does (Museum of Tropical Queensland
collections).
5.4.1.2 COMPARISON OF MOLECULAR AND MORPHOLOGICAL
PHYLOGENIES
Significantly different trees were drawn from the phylogeny of the mtDNA intergenic
region and the morphological phylogeny of Wallace (1999), for the same set of species
(Fig. 5.2). Differences were due to inconsistent relationships between species of the
Acropora humilis species group. In contrast, A. austera occupied a basal position while
A. cerealis, A. nasuta, A. valida and A. divaricata were closely related and occupied
derived positions in both phylogenies. The close relationship of A. digitifera with the A.
124

nasuta and A. divaricata species groups was evident in both phylogenies, with A.
digitifera grouping in monophyletic clades shared by the species of these groups in
both analyses. The grouping of A. retusa and A. samoensis in the same monophyletic
clade in the morphological phylogeny did not match the molecular phylogeny. In the
molecular phylogeny, A. retusa branched from the polytomies formed by the species
from clade I and clade II, with strong bootstrap support. Acropora retusa occupied the
same position in the phylogeny of all sequences from all locations (Fig. 5.1), but with
weak bootstrap support. It therefore appears to be distinct from other species of the A.
humilis species group, although sequences from additional colonies of this species are
needed to confirm this distinction. The position of A. samoensis was the most
incongruent in the comparison of the morphological and molecular phylogenies.
Although this species grouped with A. digitifera and A. retusa in the morphological
phylogeny, it formed a polytomy with A. humilis, A. gemmifera and A. monticulosa in
the molecular analysis. Based on the available evidence, I propose that the molecular
phylogeny provides a more accurate indication of the evolutionary relationships of A.
samoensis, consistent with its morphological similarity to A. humilis (Chapter 4).
Acropora samoensis tends to occur deeper on the reef slope compared to other species
of the A. humilis species group (Chapter 3; Wallace, 1999) and therefore it appears that
the phylogenetic coding of morphological characters of this species reflect
environmental rather than evolutionary features. Acropora monticulosa formed an
independent lineage in the morphological phylogeny. Although this species shares a
close relationship with A. samoensis, A. humilis and A. gemmifera in the molecular tree,
the morphological distinction of this species is likely to be real, as also suggested by
the grouping of sequences from this species in separate sub-clades in the analysis of
colonies from all locations (Fig. 5.1). Acropora multiacuta formed independent
lineages in both the morphological and molecular phylogenies, supporting the
distinction of this species from other species of the A. humilis group. Acropora humilis
and A. gemmifera formed a highly derived monophyletic clade in the morphological
phylogeny and this close relationship was reflected in the molecular phylogeny.
Acropora globiceps was not included in the morphological phylogeny of Wallace
(1999), although she noted that it was separated from A. humilis by only one character
and therefore was assumed to be a sister species. Therefore, although A. globiceps was
not included in the statistical comparison of the morphological and molecular
125

phylogenies, this apparently close relationship was supported by the results of this
study, with each of these species grouping within clade IId (Fig. 5.1).
5.4.2 VARIABILITY OF SEQUENCE REPEATS IN THE mtDNA
INTERGENIC REGION
Variation in the distribution of repeat sequence blocks in the mtDNA intergenic region
suggests this marker has the potential to provide additional support or information for
revealing evolutionary relationships within the Acropora humilis species group. Type I
sequences were most common, being found in colonies of all species and morphs of the
A. humilis species group except A. multiacuta and the single sequence obtained from
the sub-morph “terete mont”. Type I sequences were also absent in A. austera, with all
sequences of this species having type VI sequences, confirming the distinction of this
species. All sequences from the two colonies of A. multiacuta were of type III,
supporting the phylogenetic analysis, which found it to be the most distinctive species
within the A. humilis species group. The reverse situation, i.e. the presence of type I
sequences and the absence of type III sequences is less informative due to the wide
occurrence of type I sequences. This reverse pattern was found in the colonies of A.
globiceps and “dig-gem”, with no other sequences types in this species and morph. The
presence of sequence types I and III in all species other than A. globiceps within clade
IId provides preliminary support for the distinction of A. globiceps. Similarly, the
presence of type I sequences only in the colonies of “dig-gem”, compared to both
sequence types I and III in colonies of A. digitifera and A. gemmifera, also supports the
distinction of this morph. Type IV sequences were recorded only in colonies of the
morph “dig mont” from Taiwan and the Solomon Islands, supporting the apparent
distinction of this morph from A. monticulosa, based on morphological appearance.
5.4.2.1 COMPARISON WITH OTHER ACROPORA SPECIES
The sequence types recorded in this study were different from all sequence types
recorded for five other species of the genus Acropora: A. aspera, A. cervicornis, A.
loripes, A. tenuis and A. cuneata (van Oppen et al. 2002a). The repeat sequence blocks
recorded in this study from positions 176-282 (sequence types IV and V) and 919-1032
(sequence type II) (Fig. 5.3) were not present in any of the sequences in this previous
study. The first of these sequence blocks (from sequence types IV and V) is located
between positions 330 and 331, within the ‘repeat 1, copy 3’ block. The second
126

sequence block (from sequence type II) is located between positions 1065 and 1066, at
the end of the ‘repeat 4, copy 2’ block and just prior to the conserved sequence block
‘f’ in the alignment by van Oppen et al. (2002a). The repeat sequence block recorded
from positions 729-842 in this study (sequence types I, II and IV) aligned with
positions 876 to 990, from within ‘repeat 3, copy 2’ to within ‘repeat 3, copy 3’in the
alignment of the previous study. The deletion in all sequences from colonies of A.
austera, from positions 1227 to 1248 was also present as a deletion in A. tenuis. Five
segments in the aligned sequences in the study by van Oppen et al. (2002a), from
positions 126-263, 715-764, 828-875, 1336-1422 and 1468-1603, were not present in
the sequences of the current study.
It is clear, therefore, that patterns of variation exist between the repeat blocks in species
and morphs of the A. humilis species group, and other species of the genus Acropora,
which appear to be phylogenetically informative, although further research is necessary
to understand the evolutionary significance of these repeat regions (van Oppen et al.
2002a). Development of phylogenetic analysis programs that can incorporate within-
individual variation (e.g. Wiens 2001; Legendre and Makarenkov 2002) in the mtDNA
intergenic region, the nuclear rDNA unit and other markers will assist in the
interpretation of the evolutionary significance of this molecular polymorphism, and
therefore relationships between species.
5.4.3 INCOMPLETE LINEAGE SORTING AND INTROGRESSION
Incomplete lineage sorting of the mtDNA intergenic region appears to be the primary
explanation of the low levels of divergence between the species and morphs of the
Acropora humilis species group, and is supported by the proposal of relatively rapid
and recent speciation in the genus Acropora (Wilson and Rosen 1998; Fukami et al.
2000). The low levels or lack of divergence between A. samoensis, A. humilis, A.
globiceps, A. gemmifera, A. monticulosa and morphs of these species, for all colonies
across the broad biogeographic scale of this project, strongly suggests that lineage
sorting is incomplete for this molecular marker. Although these species showed no
potential to interbreed (Chapter 3), their rate of divergence may be retarded by indirect
introgression through backcrossing via morphs of these species, leading to indirect
mixing of genomes between what appear to be otherwise distinct species (Arnold
1997). Examples of species and morphs that showed moderate and high potentials to
127
interbreed include A. humilis with “terete mont” and A. samoensis with “sam-hum”,
respectively (Chapter 3).
Although the close phylogenetic relationships between these species and most morphs
of the Acropora humilis species group appear to be explained by incomplete lineage
sorting of the mtDNA intergenic region, there was also some evidence for introgression
through hybridization in two cases. Firstly, the morph “dig-gem” was the only
intermediate morph that did not share the same clade as both of the species after which
it was named. If the apparent morphological affinities of this morph are indicative of its
ancestry, then the position of the putative parent species in the distinct clades, supports
the tentative proposal that this morph may be derived from hybridization of A.
digitifera and A. gemmifera (Chapter 3). Secondly, possible indications of hybridization
between A. monticulosa and A. digitifera were also evident from morphological and
molecular features of these species and the sub-morphs “digitate mont” and “Samoan
dig”. These morphs were most like A. monticulosa in their morphological features,
although their colony colour and diminutive, terete branches also resembled A.
digitifera (Chapter 4). The molecular data also supports evolutionary affinities,
possibly as hybrids of these species, for both morphs. “Digitate mont” grouped in both
the ‘monticulosa’ clade (clade IIc) and the ‘digitifera’ clade (clade I) in the
phylogenetic analysis of the mtDNA intergenic region (Fig. 5.1), and with A.
monticulosa and “Samoan dig” for the 28S rDNA unit (Chapter 2). Meanwhile, the
morph “Samoan dig” grouped within the ‘monticulosa’ clade (clade IIc) in the analysis
of the mtDNA intergenic region.
5.4.4 SPECIATION IN THE GENUS ACROPORA
The ancestral history of species and morphs in the Acropora humilis species group is
likely to be more complex than the results of this study indicate, with some species
being more closely related to species outside the A. humilis group than to species within
this group. Species from groups outside the A. humilis group may therefore have
contributed to new lineages, recognized as species or morphs in this study.
Furthermore, new lineages may have evolved from hybridization events that involved
more than two species (Chapter 3). However, following the close examination of
genetic relationships between species and morphs in this study, it appears that
hybridization between species within this genus is more structured and not as
128

widespread as suggested previously (e.g. van Oppen et al. 2001). To explore this
proposal further, it will be necessary to use molecular markers that are evolving under
evolutionary constraints, because the low rate of divergence of neutral markers such as
the mtDNA intergenic region are inadequate for resolving relationships between all
species in corals and other anthozoans (Shearer et al. 2002). Proteins directly involved
in preventing fertilization will be particularly useful for resolving evolutionary
boundaries in corals (Palumbi 1994). In addition, reproductive proteins appear to
evolve rapidly and may play a pivotal role in speciation (reviewed in Swanson and
Vacquier 2002). Molecular markers developed from these proteins are likely to greatly
enhance our understanding of the evolutionary relationships between apparently closely
related species, such as A. samoensis, A. humilis, A. globiceps and A. gemmifera and of
the ancestral history of possible hybrid morphs, such as “dig-gem”, “digitate mont” and
“Samoan dig”.
Patterns of divergence between coral taxa have the potential to vary geographically.
Different locations have different taxonomic assemblages and different patterns in the
timing of spawning, influencing which species interbreed. Species composition varies
considerably across the biogeographic range of the genus Acropora, most notably
decreasing in diversity outwards from the Indo-West Pacific centre of biodiversity
(Wallace 1999). Relative timing of spawning also varies between taxa in different
geographic locations (e.g. Table 4 in Wallace 1999). Of particular relevance to the
interpretation of the results of this study, timing of spawning of A. digitifera varies in
relation to other species of the A. humilis species group and other mass spawning corals
in different locations. The documented time of spawning of A. digitifera is February to
March at Lizard Island, Australia (Chapter 3, Wallace 1999), while most other species
of the genus Acropora spawn during the mass spawning months in November to
December (Wallace 1999). Similarly, A. digitifera does not seem to spawn during the
mass spawning in Guam (S. Romano, pers. comm.). However, in Papua New Guinea
(April 2000) and the Solomon Islands (November 2000) this species contained mature
gametes at the same time as other species of the A. humilis group and other mass
spawning species (pers. obs.), and therefore appears to spawn at the same time as
species from which it is temporally reproductively isolated in other locations. The three
month separation in the predominant time of spawning between A. digitifera and the
morph “dig-gem” at Lizard Island, Australia (Chapter 3) and between A. digitifera and
129

the cryptic species A. sp 1 aff. digitifera (also by three months) in southern Japan
(Hayashibara and Shimoike 2002), provides clear evidence of the potential for
geographically different patterns of divergence. This potential is supported by the
abundance of colonies of “dig-gem” at Lizard Island, with this morph being
substantially more common than any other species or morph of the A. humilis species
group (Chapter 3). The morph “dig-gem” has only been recorded from a few other
biogeographic locations (Chapter 4), while the cryptic species A. sp 1 aff. digitifera has
not been recorded from other locations (Chapter 4; Hayashibara and Shimoike 2002).
This apparent potential for different patterns of divergence in different geographic
locations highlights the complexity of resolving evolutionary boundaries in the genus
Acropora, and possibly other coral taxa. Different biogeographic patterns of divergence
also supports incomplete lineage sorting as the predominant explanation of
evolutionary relationships in the A. humilis species group, because the same patterns of
hybridizing taxa over the broad biogeographic scale of this study are unlikely (and for
many locations not possible) given the same combinations of taxa were not present in
each location.
This study demonstrates the value of examining polymorphism of morphological and
molecular characters, within and between species, for interpreting evolutionary
boundaries in corals as suggested by Wiens (1999). Recognition of morphological
polymorphism within species enabled intermediate morphs and sub-morphs to be
defined and used as additional categories. Exploitation of this variability, rather than
reducing it to previously defined species categories, assisted in interpreting
evolutionary relationships as well as reducing the likelihood of taxonomic error. To
exploit this variability in future studies and guard against taxonomic error, it is essential
that voucher specimens be lodged in museums for permanent housing (Paulay 1997;
Wheeler 2001). This is particularly important now that genetic data from previous
studies are publicly available on databases such as GenBank. Lodgment of voucher
specimens will enable the question of identity to be revisited as new techniques and
evidence become available, and confirm or correct what is reported in the literature
(Wheeler 2001). Examination of patterns of molecular variation can also contribute to
interpreting evolutionary relationships in corals. The variable occurrence of the repeat
sequence blocks, within and between individuals provided additional support for
interpreting the relationships determined in the molecular phylogenetic analysis, given
130

the low levels of divergence for the mtDNA intergenic region. The repeat sequence
blocks also highlighted the distinction of the morph “digitate mont” from Acropora
monticulosa and other morphs of this species. Incorporating patterns of polymorphism
into future analyses of are therefore recommended, to maximize the potential for
resolving evolutionary relationships in corals.
131

CHAPTER 6: GENERAL DISCUSSION
6.1 EVOLUTIONARY RELATIONSHIPS IN THE ACROPORA HUMILIS
SPECIES GROUP
In this thesis, the recognition of morphs within and between currently defined species
greatly enhanced the interpretation of evolutionary relationships in the Acropora
humilis species group. I demonstrate that, rather than considering species as discrete
units, assessing their patterns of morphological variability provided valuable
information, complementary to the molecular and reproductive criteria, for interpreting
evolutionary affinities in this group of corals (Tables 6.1 and 6.2). Although, most
studies that have examined evolutionary relationships in the genus Acropora have only
recognized species as discrete units (e.g. Wallace 1999; van Oppen et al. 2001;
Márquez et al. 2002b), recognition of morphs within the species A. millepora, A. nasuta
and A. prolifera also helped to resolve evolutionary relationships for these species
(Wallace and Willis 1994; Hatta et al. 1999; Vollmer and Palumbi 2002). In this thesis,
all criteria contributed to the interpretation of evolutionary relationships. However,
different levels of resolution for different combinations of species and morphs indicated
variable patterns and rates of divergence for each of the criteria. Reproductive evidence
revealed the greatest level of divergence, morphological characters revealed a moderate
level of divergence and molecular criteria revealed the least divergence.
Acropora humilis, A. samoensis and A. gemmifera were shown to be valid biological
species on the basis of the reproductive criteria, despite their morphological similarity
and a lack of genetic differentiation between these species. The morphological and
genetic affinities within and between these species appear to be due to recent
divergence, with each of these species and their intermediate and sub-morphs sharing a
close genetic relationship across the geographic range sampled. Although these species
showed no potential to interbreed, it is possible that introgression through interbreeding
between some of these morphs and species is retarding the rate of species divergence.
Further research is necessary to confirm the taxonomic status of A. globiceps, as it was
not distinguished from these three species based on the molecular data or from A.
humilis for the morphological data.
132

Reproductive data indicates that A. digitifera is a valid biological species, and was
distinct from all other species of the A. humilis species group for the mtDNA intergenic
region across the geographic range of this project. This species may share a closer
evolutionary relationship with species of the A. nasuta and A. divaricata species
groups, as suggested by comparison of sequence data for this marker, and a
morphological phylogeny of the genus Acropora (Wallace 1999). Recognition of the
intermediate morph “dig-gem” was particularly important because it is evolutionarily
distinct from both A. digitifera and A. gemmifera, on the basis of reproductive and
molecular criteria respectively. Further research, incorporating reproductive and
molecular criteria, is necessary to confirm that skeletal samples identified as “dig-gem”
Table 6.1a Summary of inferred affinities of the species of the Acropora humilis
species group for each of the criteria examined in this study. Species Morphological
Appearance All Chapters
Morphometric Analysis Chapters 2 & 4
28S rDNA Unit (Domains 1 and 2) Chapter 2
mtDNA Intergenic Region Chapters 3 & 5
Reproduction Chapters 3 & 5
A. samoensis A. humilis A. humilis A. humilis A. globiceps A. gemmifera
None
A. humilis A. samoensis
A. globiceps A. gemmifera
A. samoensis A. globiceps
“mont-gem” A. samoensis A. globiceps A. gemmifera
None
A. globiceps A. humilis A. humilis A. samoensis
A. humilis A. gemmifera
A. gemmifera A. humilis
A. digitifera A. monticulosa A. digitifera
A. samoensis A. humilis A. globiceps
None
A. monticulosa A. gemmifera A. gemmifera “Samoan dig”
“digitate mont” A. samoensis A. humilis A. globiceps A. gemmifera
None
A. digitifera A. gemmifera A. gemmifera None None A. retusa None None None A. multiacuta None None None Notes: Blank cells indicate criteria that were not tested for that species; Acropora gemmifera, “branching mont” and
A. digitifera from chapter 2 are reclassified as “mont-gem”, A. monticulosa and “Samoan dig”, respectively in
chapters 4 and 5; “digitate A. monticulosa” in chapter 2 is renamed “digitate mont” in chapters 4 and 5.
133

Table 6.1b Summary of inferred affinities of the intermediate and sub-morphs of the
Acropora humilis species group for each of the criteria examined in this study. Morph Morphological
Appearance All Chapters
Morphometric Analysis Chapters 2 & 4
28S rDNA Unit (Domains 1 and 2) Chapter 2
mtDNA Intergenic Region Chapters 3 & 5
Reproduction Chapters 3 & 5
Intermediate Morphs
“sam-hum” A. samoensis A. humilis
A. samoensis A. humilis
A. samoensis A. humilis A. globiceps A. gemmifera
A. samoensis * & **
“sam-gem” A. samoensis A. gemmifera
A. samoensis A. gemmifera
A. samoensis A. humilis A. globiceps A. gemmifera
A. samoensis **
“hum-gem” A. humilis A. gemmifera
A. humilis A. gemmifera
A. samoensis A. humilis A. globiceps A. gemmifera
A. gemmifera *
“hum-gem plate”
A. humilis A. gemmifera
A. digitifera A. samoensis A. humilis A. globiceps A. gemmifera
“mont-hum” A. monticulosa A. humilis
A. humilis A. humilis * A. monticulosa **
“mont-gem” A. monticulosa A. gemmifera
A. gemmifera A. humilis A. samoensis A. humilis A. globiceps A. gemmifera
“dig-gem” A. digitifera A. gemmifera
A. gemmifera A. monticulosa A. digitifera
A. digitifera A. digitifera ** A. gemmifera **
Sub-Morphs “fine sam” A. samoensis A. samoensis A. samoensis
A. humilis A. globiceps A. gemmifera
“Penghu hum” A. humilis A. samoensis A. humilis
A. samoensis A. humilis A. globiceps A. gemmifera
“terete mont” A. monticulosa A. gemmifera A. humilis
A. gemmifera A. monticulosa
A. monticulosa A. humilis *
“digitate mont” A. monticulosa “Samoan dig”
A. monticulosa A. monticulosa “Samoan dig”
A. monticulosa
“Samoan dig” A. digitifera “digitate mont”
A. monticulosa A. monticulosa “digitate mont”
A. monticulosa
“encrusting dig”
None A. digitifera
Notes: Blank cells indicate criteria that were not tested for that morph; Species and morphs were reclassified or
renamed, as in Table 6.1a; For the reproductive criteria * indicates affinity is based on fertilization potential and **
indicates affinity is based on spawning details.
134

Table 6.2 Summary of inferred affinities of each morph, of the Acropora humilis
species group based on the combined evidence for each of the criteria examined in this
study.
Species Affinities Intermediate Morphs
A. samoensis “sam-hum”
A. samoensis “sam-gem”
“hum-gem” A. humilis A. gemmifera
“hum-gem plate” A. humilis A. gemmifera
“mont-hum” A. humilis A. monticulosa
A. gemmifera “mont-gem”
A. digitifera “dig-gem” Sub-morphs
A. samoensis “fine sam”
“Penghu hum” A. humilis A. samoensis
“terete mont” A. humilis A. monticulosa
A. monticulosa “digitate mont”
A. monticulosa “Samoan dig”
A. digitifera “encrusting dig”
in the museum collections from locations beyond the geographic range of this project
(chapter 4) are also this morph, and therefore resolve the taxonomic status and
biogeographic range of this morph.
The criteria examined in this project revealed a complex evolutionary relationship for
Acropora monticulosa. It is a valid biological species based on reproductive criteria,
while morphs of this species indicate that it has a range of evolutionary affinities with
other species of the A. humilis species group. Phylogenetic analysis of the mtDNA
intergenic region indicated that this species shares a close relationship with A. humilis,
A. samoensis, A. globiceps and A. gemmifera for this marker. However, the grouping of
135

sequences from A. monticulosa in separate sub-clades for all regions suggests
divergence from these four species. The grouping of sequences from all colonies of the
morph “mont-gem” in the same sub-clade as A. gemmifera rather than A. monticulosa
suggests that this morph is an ecological variant of A. gemmifera, with morphological
appearance being determined by environmental rather than evolutionary factors. The
low levels of fertilization between A. monticulosa and “mont-hum” and low to
moderate levels between colonies of A. humilis and this morph, suggested that “mont-
hum” was distinct from both species. Classification probabilities of colonies of “mont-
hum” indicated that all but one colony of this morph were most morphologically
similar to A. humilis. Based on the combined assessment of these criteria, overall
appearance and the low abundance of this morph, “mont-hum” is tentatively proposed
as a hybrid of these species. Similarly, the morph “terete mont” is proposed as a
possible hybrid morph of the same pair of species, on the basis of morphological
appearance, low abundance, lack of molecular distinction from A. monticulosa, a
moderate within-morph level of fertilization and low potential to interbreed with either
of these species. The morphs “digitate mont” and “Samoan dig” were morphologically
similar but distinct from each other, with the shape of the radial corallites suggesting
greatest affinity with A. monticulosa and A. digitifera respectively. However, based on
the appearance of these morphs and evidence obtained in this study, they may each be
derived from both of these species. Phylogenetic analysis of the 28S marker grouped
sequences from the morph “digitate mont” with A. monticulosa and sequences from the
mtDNA marker with A. digitifera, while all colonies of this morph consistently
classified with the former species. In the case of “Samoan dig”, although it appeared to
most closely resemble A. digitifera, phylogenetic analysis of sequences from both
markers grouped this morph with A. monticulosa, while four colonies were classified as
A. monticulosa and one as A. digitifera in the morphometric analysis.
Acropora multiacuta and A. retusa were both distinct from all other species of the A.
humilis species group, based on morphological characters and phylogenetic analysis of
the mtDNA intergenic region. Analyses of the same criteria presented in this thesis,
which incorporate other species of the genus Acropora, are therefore necessary to
resolve evolutionary affinities of these species.
136

6.2 CONCLUSIONS
This study demonstrates the value of incorporating intraspecific and interspecific
variation for clarifying evolutionary boundaries, as proposed by Wiens (1999), by
revealing patterns that would not have been evident if only species categories were
used. Recognition of morphs within and between species of the Acropora humilis group
also reduced the chance of taxonomic error, by not ‘forcing’ colonies into incorrect or
inappropriate species categories. In addition, the interspecific (intermediate) morphs
provided a valuable means of exploring evolutionary links between species, while the
absence of intermediate morphs between other species was consistent with apparent
evolutionary distinction. Development of phylogenetic analysis programs that can
incorporate this variability (e.g. Wiens 2001; Legendre and Makarenkov 2002) will
greatly enhance the potential of accurately interpreting evolutionary relationships in
scleractinian corals.
The broad biogeographic scale of this project also enhanced the interpretation of
evolutionary relationships within and between species of the Acropora humilis group.
Most importantly, I demonstrate that relationships are determined by taxonomic rather
than geographic affinities, indicating that incomplete or recent divergence, rather than
hybridization within populations, is the predominant explanation for the low or lack of
divergence in this group of corals. If hybridization is the predominant process, genetic
relationships between taxa would be expected to vary in different geographic locations,
because of a variable potential of different combinations of species to interbreed.
Factors influencing which species are able to interbreed in different regions include
taxonomic composition, due to the different geographic ranges of species (Wallace
1999; Veron 2000), and patterns of spawning. The potential of species to interbreed
may differ in different locations due to variable patterns in timing of spawning and
fertilization (e.g. compare Knowlton et al. 1997; Szmant et al. 1997). However, as
demonstrated in this project, species and morphs from the different regions show
consistent molecular phylogenetic relationships, and species within one location
(Lizard Island, chapter 3) showed no potential to interbreed, supporting the proposal
that relationships are predominantly due to ancestral patterns of divergence.
In scleractinian corals, including the genus Acropora, the role of divergence appears to
have been underemphasized and the significance of hybridization may have been
137

overemphasized as evolutionary processes (Knowlton 2001; Vollmer and Palumbi
2002), as demonstrated in this study. The combined assessment of the morphological,
molecular and reproductive criteria indicates that lack of genetic distinction between
the species A. humilis, A. samoensis, A. globiceps, A. gemmifera and morphs of these
species appears to be due to incomplete or recent divergence, rather than hybridization.
Furthermore, in situations where hybrids have formed, they may contribute little to the
evolutionary history in the genus Acropora or other scleractinian corals. Two studies
have shown that A. prolifera is a hybrid of A. cervicornis and A. palmata (van Oppen et
al. 2000; Vollmer and Palumbi 2002). In this case, hybridization has produced new
morphologies without speciation, due to the limited potential of A. prolifera to
interbreed (Vollmer and Palumbi 2002). Although hybridization does not appear to be
as widespread and unstructured as suggested in previous studies, (e.g. Veron 1995; van
Oppen et al. 2001), the role of hybridization in the formation of new species (Arnold
1997) remains unresolved in scleractinian corals. Proposed examples of hybrids in this
study include the morphs “dig-gem”, “mont-hum”, “terete mont”, “digitate mont” and
“Samoan dig”. Continued detailed studies, which incorporate morphological,
reproductive and molecular criteria, are necessary to resolve whether these morphs are
indicative of incipient speciation. With respect to the molecular criteria, phylogenetic
analysis of sequences from proteins directly involved in regulating fertilization are
likely to be particularly informative (reviewed in Palumbi 1994; Swanson and Vacquier
2002), compared to mitochondrial markers which appear to be evolving unusually
slowly and are therefore inadequate for resolving boundaries between species of
anthozoans (reviewed in Shearer et al. 2002).
As demonstrated in this study, interpreting evolutionary relationships in scleractinian
corals requires the integration of multiple criteria, including morphological, molecular
and reproductive data (Willis 1990; Stobart 2000), and examination of patterns of
intraspecific and interspecific polymorphism (Wiens 1999). Further research,
particularly with increasingly sophisticated molecular analytical tools, is likely to
reveal even more complex relationships in scleractinian corals than those recognized in
this and previous studies. It is therefore essential that skeletal voucher samples be
lodged in museums for permanent housing, enabling specimens from previous studies
to be reexamined and possibly reinterpreted as more information becomes available
(Paulay 1997; Wheeler 2001). This is particularly necessary with the public availability
138

of sequence and other molecular data from databases such as GenBank, so that species
and morphs from which such data are derived can be revised in the light of new
evidence.
139

REFERENCES CITED
Arnold ML (1997) Natural hybridization and evolution. Oxford University Press, New
York
Avise J (1994) Molecular markers, natural history and evolution. Chapman & Hall,
New York London
Avise J and Ball RJ (1990) Principles of genealogical concordance in species concepts
and biological taxonomy. In: Futuyama D, Antonovics J (eds) Oxford Surveys
in Evolutionary Biology. Oxford University Press, New York, pp 45-67
Avise JC (2000) Phylogeography: the history and formation of species. Harvard
University Press, Cambridge
Avise JC and Wollenberg K (1997) Phylogenetics and the origin of species. Proc Nat
Acad Sci USA 94: 7748-7755
Ayre DJ, Veron JEN, Dufty SL (1991) The corals Acropora palifera and Acropora
cuneata are genetically and ecologically distinct. Coral Reefs 10: 13-18
Babcock R (1995) Synchronous multispecific spawning on coral reefs: potential for
hybridization and roles of gamete recognition. Reprod Fertil Dev 7: 943-950
Babcock R and Miller K (1997) Genus Goniastrea: insights from morphological,
genetic and reproductive variation. Proc ACRS 75th Anniversary Conf: 248
Abstract
Babcock RC, Bull GD, Harrison PL, Heyward AJ, Oliver JK, Wallace CC, Willis BL
(1986) Synchronous spawnings of 105 scleractinian coral species on the Great
Barrier Reef. Mar Biol 90: 379-394
Babcock RC, Willis BL, Simpson CJ (1994) Mass spawning of corals on a high latitude
coral reef. Coral Reefs 13: 161-169
Baird AH, Marshall PA, Wolstenholme J (2002) Latitudinal variation in the
reproduction of Acropora in the Coral Sea. Proc 9th Int Coral Reef Symp 1:
385-389
Bookstein FL (1990) Introduction to methods for landmark data. In: Rohlf FJ,
Bookstein FL (eds) Proceedings of the Michigan morphometrics workshop.
University of Michigan Museum of Zoology, Michigan, pp 380
Brakel WH (1977) Corallite variation in Porites and the species problem in corals. Proc
3rd Int Coral Reef Symp 1: 457-462.
Brook G (1891) Descriptions of new species of Madrepora in the collections of the
British Museum. Ann Mag Nat Hist 8: 458-471
140

Brook G (1892) Preliminary descriptions of new species of Madrepora in the
collections of the British Museum. Part II. Ann Mag Nat Hist 10: 451-465
Brower AVZ, Desalle R, Vogler A (1996) Gene trees, species trees, and systematics - a
cladistic perspective. Annu Rev Ecol Syst 27: 423-450
Brüggemann F (1879) Corals in Zoology of Rodriguez. Phil Trans R Soc Lond B 168:
569-579
Bruno JF and Edmunds PJ (1998) Metabolic consequences of phenotypic plasticity in
the coral Madracis mirabilis (Duchassaing and Michelotti): the effect of
morphology and water flow on aggregate respiration. J Exp Mar Biol Ecol 229:
187-195
Budd AF, Johnson KG, Potts DC (1994) Recognizing morphospecies in colonial reef
corals: I. Landmark-based methods. Paleobiol 20: 484-505
Budd AF and Klaus JS (2001) The origin and early evolution of the Montastraea
"annularis" species complex (Anthozoa : Scleractinia). J Paleont 75: 527-545
Chen CA, Odorico DM, ten Louis M, Veron JEN, Miller DJ (1995) Systematic
relationships within the Anthozoa (Cnidaria: Anthozoa) using 5'-end of 28s
rDNA. Mol Phyl Evol 4: 175-183
Chen CA, Wallace CC, Yu J-K, Wei NV (2000) Strategies for amplification by
polymerase chain reaction of the complete sequence of the gene encoding
nuclear large subunit ribosomal RNA in corals. Mar Biotechnol 2: 558-570
Chen CA and Yu J-K (2000) Universal primers for amplification of mitochondrial
small subunit ribosomal RNA-encoding gene in scleractinian corals. Mar
Biotechnol 2: 146-153
Claridge M, Dawah H, Wilson M (1997) Practical approaches to species concepts for
living organisms. In: Claridge M, Dawah H, Wilson M (eds) Species: the units
of biodiversity. Chapman & Hall, London, pp 1-15
Coll JC, Bowden BF, Meehan GV, Konig GM, Carroll AR, Tapiolas DM, Aliño PM,
Heaton A, De Nys R, Leone PA, Maida M, Aceret TL, Willis RH, Babcock RC,
Willis BL, Florian Z, Clayton MN, Miller RL (1994) Chemical aspects of mass
spawning in corals. I. Sperm-attractant molecules in the eggs of the
scleractinian coral Montipora digitata. Mar Biol 118: 177-182
Dana JD (1846) Zoophytes. US Explor Exped 7: 1-740
141

Diekmann OE, Bak RPM, Stam WT, Olsen JL (2001) Molecular genetic evidence for
probable reticulate speciation in the coral genus Madracis from a Caribbean
fringing reef slope. Mar Biol 139: 221-233
Doyle JJ (1997) Trees within trees: genes and species, molecules and morphology. Syst
Biol 46: 537-553
Dupré J (1999) On the impossibility of a monistic account of species. In: Wilson RA
(ed) Species: new interdisciplinary essays. The MIT Press, Cambridge,
Massachusetts, pp 3-22
Foster AB (1979) Phenotypic plasticity in the reef corals Montastraea annularis (Ellis
and Solander) and Siderastrea siderea (Ellis and Solander). J Exp Mar Biol
Ecol 39: 25-54
Foster AB (1985) Variation within coral colonies and its importance for interpreting
fossil species. J Paleont 59: 1359-1381
Frank U and Mokady O (2002) Coral biodiversity and evolution: recent molecular
contributions. Can J Zool 80: 1723-1734
Fukami H, Omori M, Hatta M (2000) Phylogenetic relationships in the coral family
Acroporidae, reassessed by inference from mitochondrial genes. Zool Sci 17:
689-696
Fukami H, Omori M, Shimoike K, Hayashibara T, Hatta M (2003) Ecological and
genetic aspects of reproductive isolation by different spawning times in
Acropora corals. Mar Biol 142: 679-684
Garthwaite RL, Potts DC, Veron JEN, Done TJ (1994) Electrophoretic identification of
poritid species (Anthozoa: Scleractinia). Coral Reefs 13: 49-56
Gilbert DG (1994) SEQAPP 1.9. A biological sequence editor and analysis program for
Macintosh computers. Available from ftp.bio.indiana.edu
Harrison PL, Babcock RC, Bull GD, Oliver JK, Wallace CC, Willis BL (1984) Mass
spawning in tropical reef corals. Science 223: 1186-1189
Hatta M, Fukami H, Wang W, Omori M, Shimoike K, Hayashibara T, Ina Y, Sugiyama
T (1999) Reproductive and genetic evidence for a reticulate evolutionary history
of mass-spawning corals. Mol Biol Evol 16: 1607-1613
Hayashibara T and Shimoike K (2002) Cryptic species of Acropora digitifera. Coral
Reefs 21: 224-225
142
Hayashibara T, Shimoike K, Kimura T, Hosaka S, Heyward A, Harrison P, Kudo K,
Omori M (1993) Patterns of coral spawning at Akajima Island, Okinawa, Japan.
Mar Ecol Prog Ser 101: 253-262
Hillis D (1987) Molecular versus morphological approaches to systematics. Annu Rev
Ecol Syst 18: 23-42
Hillis DM and Dixon MT (1991) Ribosomal DNA: molecular evolution and
phylogenetic inference. Quat Rev Biol 66: 411-453
Hughes TP, Bellwood DR, Connolly SR (2002) Biodiversity hotspots, centres of
endemicity, and the conservation of coral reefs. Ecol. Lett 5: 775-784
Hunter CL, Morden CW, Smith CM (1997) The utility of ITS sequences in assessing
relationships among zooxanthellae and corals. Proc 8th Int Coral Reef Symp 2:
1599-1602
Jameson SC (1997) Morphometric analysis of the Poritidae (Anthozoa: Scleractinia)
off Belize. Proc 8th Int Coral Reef Symp 2: 1591-1596
Johnson KG and Budd AF (1996) Three-dimensional landmark techniques for the
recognition of reef coral species. In: Marcus LF, Corti M, Loy A, Naylor GJP,
Slice DE (eds) Advances in Morphometrics. Plenum Press, New York, pp 345-
353
Kenyon JC (1997) Models of reticulate evolution in the coral genus Acropora based on
chromosome numbers: parallels with plants. Evolution 51: 756-767
Knowlton N (2000) Molecular genetic analyses of species boundaries in the sea.
Hydrobiologia 420: 73-90
Knowlton N (2001) Who are the players on coral reefs and does it matter? The
importance of coral taxonomy for coral reef management. Bull Mar Sci 69: 305-
308
Knowlton N and Jackson JBC (1994) New taxonomy and niche partitioning on coral
reefs: jack of all trades or master of some? Trends Ecol Evol 9: 7-9
Knowlton N, Maté JL, Guzmán HM, Rowan R, Jara J (1997) Direct evidence for
reproductive isolation among the three species of the Montastraea annularis
complex in Central America (Panamá and Honduras). Mar Biol 127: 705-711
Knowlton N, Weil E, Weigt L, Guzmán H (1992) Sibling species in Montastraea
annularis, coral bleaching, and the coral climate record. Science 255: 330-333
Lang JC (1984) Whatever works: the variable importance of skeletal and of non-
skeletal characters in scleractinian taxonomy. Palaeontogr Am 54: 18-44
143

Legendre P and Makarenkov V (2002) Reconstruction of biogeographic and
evolutionary networks using reticulograms. Syst Biol 51: 199-216
Lopez JV, Kersanach R, Rehner SA, Knowlton N (1999) Molecular determination of
species boundaries in corals: genetic analysis of the Montastraea annularis
complex using amplified fragment length polymorphisms and a microsatellite
marker. Biological Bulletin 196: 80-93
Maddison DR and Maddison WP (2001) MacClade 4.03: Analysis of phylogeny and
character evolution. Sinauer Associates, Sunderland, Massachusetts
Maddison WP (1997) Gene trees in species trees. Syst Biol 46: 523-536
Maddison WP (1996) Molecular approaches and the growth of phylogenetic biology.
In: Ferraris JD, Palumbi SR (eds) Molecular Zoology: Advances, strategies, and
protocols. Wiley-Liss, New York, pp 47-63
Márquez LM, van Oppen MJH, Willis BL, Miller DJ (2002a) Sympatric populations of
the highly cross-fertile coral species Acropora hyacinthus and Acropora
cytherea are genetically distinct. Proc R Soc Lond B 269: 1289-1294
Márquez LM, van Oppen MJH, Willis BL, Reyes A, Miller DJ (2002b) The highly
cross-fertile coral species, Acropora hyacinthus and Acropora cytherea,
constitute statistically distinguishable lineages. Mol Ecol 11: 1339-1349
Maté JL (2003) Ecological, genetic, and morphological differences among three
Pavona (Cnidaria: Anthozoa) species from the Pacific coast of Panama. Mar
Biol 142: 427-440
Mayr E (1963) Animal species and evolution. The Belknap Press, Cambridge, MA
McCall J, Rosen B, Darrell J (1994) Carbonate deposition in accretionary prism
settings: early Miocene coral limestones and corals of the Makran mountain
range in southern Iran. Facies 31: 141-178
Medina M, Weil E, Szmant AM (1999) Examination of the Montastraea annularis
species complex (Cnidaria: Scleractinia) using ITS and COI sequences. Mar
Biotechnol 1: 89-97
Miller K (1994) Morphological variation in the coral genus Platygyra: environmental
influences and taxonomic implications. Mar Ecol Prog Ser 110: 19-28
Miller K and Babcock R (1997) Conflicting morphological and reproductive species
boundaries in the coral genus Platygyra. Biol Bull 192: 98-110
Miller KJ and Benzie JAH (1997) No clear genetic distinction between morphological
species within the coral genus Platygyra. Bull Mar Sci 61: 907-917
144

Muko S, Kawasaki K, Sakai K, Takasu F, Shigesada N (2000) Morphological plasticity
in the coral Porites sillimaniani and its adaptive significance. Bull Mar Sci 66:
225-239
Nemenzo F (1967) Systematic studies on Philippine shallow-water scleractinians. VI.
Suborder Astrocoeniina (Montipora and Acropora). Nat Appl Sci Bull Uni
Philippines 20: 1-223
Odorico DM and Miller DJ (1997a) Internal and external relationships of the Cnidaria:
implications of primary and predicted secondary structure of the 5' -end of the
23S-like rDNA. Proc R Soc Lon B 264: 77-82
Odorico DM and Miller DJ (1997b) Variation in the ribosomal internal transcribed
spacers and 5.8S rDNA among five species of Acropora (Cnidaria;
Scleractinia): patterns of variation consistent with reticulate evolution. Mol Biol
Evol 14: 465-473
Palumbi SR (1994) Genetic divergence, reproductive isolation, and marine speciation.
Annu Rev Ecol Syst 25: 547-572
Paulay G (1997) Diversity and distribution of reef organisms. In: Birkeland C (ed) Life
and death of coral reefs. Chapman and Hall, New York, pp 298-353
Posada D and Crandall KA (1998) MODELTEST: testing the model of DNA
substitution. Bioinformatics 14: 817-818
Potts D (1983) Evolutionary disequilibrium among Indo-Pacific corals. Bull Mar Sci
33: 619-632
Radford B (1998) Ecological perspectives on species boundaries in the coral genus
Acropora. James Cook University, Townsville
Rieseberg LH (1997) Hybrid origins of plant species. Annu Rev Ecol Syst 28: 359-389
Rieseberg LH, Archer MA, Wayne RK (1999) Transgressive segregation, adaptation
and speciation. Heredity 83: 363-372
Rohlf F (1986-2000) NTSYS-pc Numerical taxonomy and multivariate analysis
system. Exeter Software, New York
Romano SL and Cairns SD (2000) Molecular phylogenetic hypotheses for the evolution
of scleractinian corals. Bull Mar Sci 67: 1043-1068
Saiki RK, Scharf S, Faloona F, Mullis KB, Horn GT, Erlich HA, Arnheim N (1985)
Enzymatic amplification of ß-Globin genomic sequences and restriction site
analysis for diagnosis of sickle cell anemia. Science 230: 1350-1354
145

Sattler R and Rutishauser R (1997) The fundamental relevance of morphology and
morphogenesis to plant research. Ann Bot 80: 571-582
Shearer TL, van Oppen MJH, Romano SL, Wörheide G (2002) Slow mitochondrial
DNA sequence evolution in the Anthozoa (Cnidaria). Mol Ecol 11: 2475-2487
Stobart B (1994) Delimiting coral species using alternative techniques: M. digitata
(Dana, 1846), a case study Mar Biol. James Cook University, Townsville
Stobart B (2000) A taxonomic reappraisal of Montipora digitata based on genetic and
morphometric evidence. Zool Stud 39: 179-190
Stobart B and Benzie JAH (1994) Allozyme electrophoresis demonstrates that the
scleractinian coral Montipora digitata is two species. Mar Biol 118: 183-190
Stuessy TF (1990) Plant taxonomy. Columbia University Press, New York
Swanson WJ and Vacquier VD (2002) Reproductive protein evolution. Annu Rev Ecol
Syst 33: 161-179
Swofford DL (2002) PAUP*. Phylogenetic Analysis Using Parsimony (* and other
methods). Sinauer Associates, Massachusetts
Szmant AM, Weil E, Miller MW, Colón DE (1997) Hybridization within the species
complex of the scleractinian coral Montastraea annularis. Mar Biol 129: 561-
572
Thompson JD, Gibson TJ, Plewniak F, Jeanmougin F, Higgins DG (1997) The
ClustalX windows interface: flexible strategies for multiple sequence alignment
aided by quality analysis tools. Nucleic Acids Res 24: 4876-4882
van Oppen MJH, Catmull J, McDonald BJ, Hislop NR, Hagerman PJ, Miller DJ
(2002a) The mitochondrial genome of Acropora tenuis (Cnidaria; Scleractinia)
contains a large group I intron and a candidate control region. J Mol Evol 55: 1-
13
van Oppen MJH, Hislop NR, Hagerman PJ, Miller DJ (1999a) Gene content and
organization in a segment of the mitochondrial genome of the scleractinian
coral Acropora tenuis: major differences in gene order within the Anthozoan
subclass Zoantharia. Mol Biol Evol 16: 1812-1815
van Oppen MJH, McDonald BJ, Willis B, Miller DJ (2001) The evolutionary history of
the coral genus Acropora (Scleractinia, Cnidaria) based on a mitochondrial and
a nuclear marker: reticulation, incomplete lineage sorting, or morphological
convergence? Mol Biol Evol 18: 1315-1329
146

van Oppen MJH, Willis BL, Miller DJ (1999b) Atypically low rate of cytochrome b
evolution in the scleractinian coral genus Acropora. Proc R Soc Lond B 266:
179-183
van Oppen MJH, Willis BL, van Rheede T, Miller DJ (2002b) Spawning times,
reproductive compatibilities and genetic structuring in the Acropora aspera
group: evidence for natural hybridization and semi-permeable species
boundaries in corals. Mol Ecol 11: 1363-1376
van Oppen MJH, Willis BL, van Vugt HWJA, Miller DJ (2000) Examination of species
boundaries in the Acropora cervicornis group (Scleractinia, Cnidaria) using
nuclear DNA sequence analyses. Mol Ecol 9: 1363-1373
Veron JEN (1995) Corals in space and time: the biogeography and evolution of the
Scleractinia. University of New South Wales Press, Sydney
Veron JEN (2000) Corals of the World. Australian Institute of Marine Science,
Townsville
Veron JEN, Odorico DM, Chen CA, Miller DJ (1996) Reassessing evolutionary
relationships of scleractinian corals. Coral Reefs 15: 1-9
Veron JEN and Pichon M (1976) Scleractinia of eastern Australia. Part I. Families
Thamnasteriidae, Astrocoeniidae, Pocilloporidae. Australian Government
Publishing Service, Canberra
Veron JEN and Pichon M (1982) Scleractinia of Eastern Australia. Part IV. Families
Poritidae. Australian National University Press, Canberra
Veron JEN and Wallace CC (1984) Scleractinia of eastern Australia. Part V. Family
Acroporidae. Australian National University Press, Canberra
Vogler AP (2001) The genic view: a useful model of the process of speciation? J Evol
Biol 14: 876-877
Vollmer SV and Palumbi SR (2002) Hybridization and the evolution of reef coral
diversity. Science 296: 2023-2025
Wallace CC (1985) Reproduction, recruitment and fragmentation in nine sympatric
species of the coral genus Acropora. Mar Biol 88: 217-233
Wallace CC (1999) Staghorn corals of the world: a revision of the coral genus
Acropora (Scleractinia; Astrocoeniina; Acroporidae) worldwide, with emphasis
on morphology, phylogeny and biogeography. CSIRO Publishing, Collingwood
147

Wallace CC, Pandolfi JM, Young A, Wolstenholme J (1991) Indo-Pacific coral
biogeography: a case study from the Acropora selago group. Aust Syst Bot 4:
199-210
Wallace CC and Willis BL (1994) Systematics of the coral genus Acropora:
implications of new biological findings for species concepts. Annu Rev Ecol
Syst 25: 237-262
Weil E (1992) Genetic and morphological variation in Caribbean and Eastern Pacific
Porites (Anthozoa, Scleractinia). Preliminary results. Proc 7th Int Coral Reef
Symp 2: 643-656
Weil E and Knowlton N (1994) A multi-character analysis of the Caribbean coral
Montastraea annularis (Ellis and Solander, 1786) and its two sibling species,
M. faveolata (Ellis and Solander, 1786) and M. franksi (Gregory, 1895). Bull
Mar Sci 55: 151-175
Wells J (1954) Recent corals of the Marshall Islands. Prof Pap US Geol Surv 260: 385-
486
Wells JW (1956) Scleractinia. In: Moore RC (ed) Treatise on invertebrate
paleontology: Coelenterata. Geological Survey of America and University of
Kansas Press, Kansas, pp F328-F443
Wheeler QD (2001) Systematics, overview. Encyclopedia of Biodiversity 5: 569-588
Wiens JJ (2001) Character analysis in morphological phylogenetics: problems and
solutions. Syst Biol 50: 689-699
Wiens JJ (1999) Polymorphism in systematics and comparative biology. Annu Rev Ecol
Syst 30: 327-362
Wilcox D, Dove B, McDavid D, Greer D (1995-96) UTHSCSA Image Tool for
Windows. The University of Texas Health Science Center, San Antonio
Willis BL (1985) Phenotypic plasticity versus phenotypic stability in the reef corals
Turbinaria mesenterina and Pavona cactus. Proc 5th Int Coral Reef Symp 4:
107-112
Willis BL (1990) Species concepts in extant scleractinian corals: considerations based
on reproductive biology and genotypic population structures. Syst Bot 15: 136-
149
Willis BL, Babcock RC, Harrison PL, Oliver JK (1985) Patterns in the mass spawning
of corals on the Great Barrier Reef from 1981 to 1984. Proc 5th Int Coral Reef
Symp 4: 343-348
148

Willis BL, Babcock RC, Harrison PL, Wallace CC (1997) Experimental hybridization
and breeding incompatibilities within the mating systems of mass spawning reef
corals. Coral Reefs 16 Suppl: S53-S65
Wilson MEJ and Rosen BR (1998) Implications of paucity of corals in the Paleogene of
SE Asia: plate tectonics or Centre of Origin. In: Hall R, Holloway JD (eds)
Biogeography and Geological Evolution of SE Asia. Backhuys Publishers,
Leiden, The Netherlands, pp 165-195
Wilson RA (ed.) (1999) Species: new interdisciplinary essays. The MIT Press,
Cambridge, Massachusetts
Wolstenholme JK, Wallace CC, Chen CA (2003) Species boundaries within the
Acropora humilis species group (Cnidaria; Scleractinia): a morphological and
molecular interpretation of evolution. Coral Reefs 22: 155-166
Wu C-I (2001) The genic view of the process of speciation. J Evol Biol 14: 851-865
149
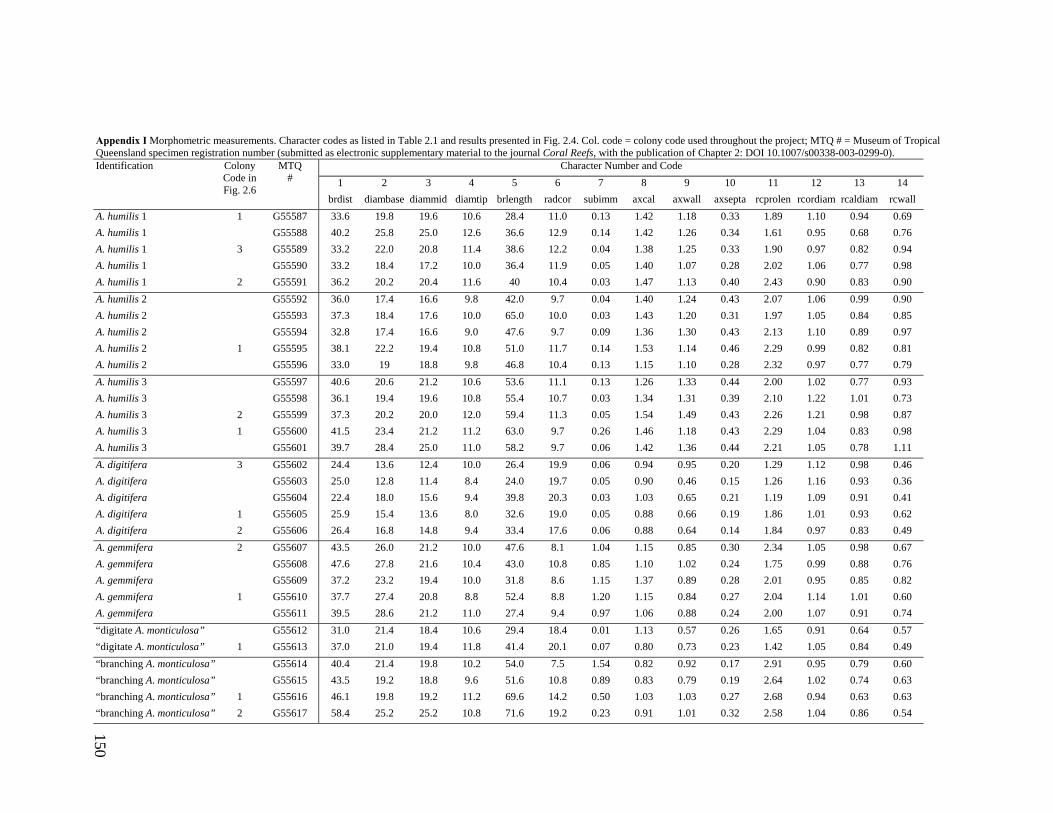
Appendix I Morphometric measurements. Character codes as listed in Table 2.1 and results presented in Fig. 2.4. Col. code = colony code used throughout the project; MTQ # = Museum of Tropical Queensland specimen registration number (submitted as electronic supplementary material to the journal Coral Reefs, with the publication of Chapter 2: DOI 10.1007/s00338-003-0299-0).
Character Number and Code 1 2 3 4 5 6 7 8 9 10 11 12 13 14
Identification Colony Code in Fig. 2.6
MTQ #
brdist diambase diammid diamtip brlength radcor subimm axcal axwall axsepta rcprolen rcordiam rcaldiam rcwall A. humilis 1 1 G55587 33.6 19.8 19.6 10.6 28.4 11.0 0.13 1.42 1.18 0.33 1.89 1.10 0.94 0.69 A. humilis 1 G55588 40.2 25.8 25.0 12.6 36.6 12.9 0.14 1.42 1.26 0.34 1.61 0.95 0.68 0.76 A. humilis 1 3 G55589 33.2 22.0 20.8 11.4 38.6 12.2 0.04 1.38 1.25 0.33 1.90 0.97 0.82 0.94 A. humilis 1 G55590 33.2 18.4 17.2 10.0 36.4 11.9 0.05 1.40 1.07 0.28 2.02 1.06 0.77 0.98 A. humilis 1 2 G55591 36.2 20.2 20.4 11.6 40 10.4 0.03 1.47 1.13 0.40 2.43 0.90 0.83 0.90 A. humilis 2 G55592 36.0 17.4 16.6 9.8 42.0 9.7 0.04 1.40 1.24 0.43 2.07 1.06 0.99 0.90 A. humilis 2 G55593 37.3 18.4 17.6 10.0 65.0 10.0 0.03 1.43 1.20 0.31 1.97 1.05 0.84 0.85 A. humilis 2 G55594 32.8 17.4 16.6 9.0 47.6 9.7 0.09 1.36 1.30 0.43 2.13 1.10 0.89 0.97 A. humilis 2 1 G55595 38.1 22.2 19.4 10.8 51.0 11.7 0.14 1.53 1.14 0.46 2.29 0.99 0.82 0.81 A. humilis 2 G55596 33.0 19 18.8 9.8 46.8 10.4 0.13 1.15 1.10 0.28 2.32 0.97 0.77 0.79 A. humilis 3 G55597 40.6 20.6 21.2 10.6 53.6 11.1 0.13 1.26 1.33 0.44 2.00 1.02 0.77 0.93 A. humilis 3 G55598 36.1 19.4 19.6 10.8 55.4 10.7 0.03 1.34 1.31 0.39 2.10 1.22 1.01 0.73 A. humilis 3 2 G55599 37.3 20.2 20.0 12.0 59.4 11.3 0.05 1.54 1.49 0.43 2.26 1.21 0.98 0.87 A. humilis 3 1 G55600 41.5 23.4 21.2 11.2 63.0 9.7 0.26 1.46 1.18 0.43 2.29 1.04 0.83 0.98 A. humilis 3 G55601 39.7 28.4 25.0 11.0 58.2 9.7 0.06 1.42 1.36 0.44 2.21 1.05 0.78 1.11 A. digitifera 3 G55602 24.4 13.6 12.4 10.0 26.4 19.9 0.06 0.94 0.95 0.20 1.29 1.12 0.98 0.46 A. digitifera G55603 25.0 12.8 11.4 8.4 24.0 19.7 0.05 0.90 0.46 0.15 1.26 1.16 0.93 0.36 A. digitifera G55604 22.4 18.0 15.6 9.4 39.8 20.3 0.03 1.03 0.65 0.21 1.19 1.09 0.91 0.41 A. digitifera 1 G55605 25.9 15.4 13.6 8.0 32.6 19.0 0.05 0.88 0.66 0.19 1.86 1.01 0.93 0.62 A. digitifera 2 G55606 26.4 16.8 14.8 9.4 33.4 17.6 0.06 0.88 0.64 0.14 1.84 0.97 0.83 0.49 A. gemmifera 2 G55607 43.5 26.0 21.2 10.0 47.6 8.1 1.04 1.15 0.85 0.30 2.34 1.05 0.98 0.67 A. gemmifera G55608 47.6 27.8 21.6 10.4 43.0 10.8 0.85 1.10 1.02 0.24 1.75 0.99 0.88 0.76 A. gemmifera G55609 37.2 23.2 19.4 10.0 31.8 8.6 1.15 1.37 0.89 0.28 2.01 0.95 0.85 0.82 A. gemmifera 1 G55610 37.7 27.4 20.8 8.8 52.4 8.8 1.20 1.15 0.84 0.27 2.04 1.14 1.01 0.60 A. gemmifera G55611 39.5 28.6 21.2 11.0 27.4 9.4 0.97 1.06 0.88 0.24 2.00 1.07 0.91 0.74 “digitate A. monticulosa” G55612 31.0 21.4 18.4 10.6 29.4 18.4 0.01 1.13 0.57 0.26 1.65 0.91 0.64 0.57 “digitate A. monticulosa” 1 G55613 37.0 21.0 19.4 11.8 41.4 20.1 0.07 0.80 0.73 0.23 1.42 1.05 0.84 0.49 “branching A. monticulosa” G55614 40.4 21.4 19.8 10.2 54.0 7.5 1.54 0.82 0.92 0.17 2.91 0.95 0.79 0.60 “branching A. monticulosa” G55615 43.5 19.2 18.8 9.6 51.6 10.8 0.89 0.83 0.79 0.19 2.64 1.02 0.74 0.63 “branching A. monticulosa” 1 G55616 46.1 19.8 19.2 11.2 69.6 14.2 0.50 1.03 1.03 0.27 2.68 0.94 0.63 0.63 “branching A. monticulosa” 2 G55617 58.4 25.2 25.2 10.8 71.6 19.2 0.23 0.91 1.01 0.32 2.58 1.04 0.86 0.54
100150

Appendix II Descriptive morphological characters. Codes as listed in Table 2.2 and results presented in Fig. 2.5. Col. code = colony code used during the study; MTQ # = Museum of Tropical Queensland specimen registration number (submitted as electronic supplementary material to the journal Coral Reefs, with the publication of Chapter 2: DOI 10.1007/s00338-003-0299-0).
Character Number and Code Identification 1 2 3 4 5 6 7 8 9 10 11 12 13 14 15 16 17 18 19 20
Colony Code in Fig. 2.6
MTQ #
determ growth axvsrad coentype radcoen axcoen spinules rcsize rcinwall rcshape rcopen axdiam relsize brthick taper brlength crowding axrings porosity rcringsA. humilis 1 1 G55587 0 1 1 1 0 1 1 0 2 0 0 0 0 2 1 5 0 1 1 1 A. humilis 1 G55588 0 1 1 1 0 1 1 0 2 0 0 0 0 0 0 4 0 1 1 1 A. humilis 1 3 G55589 0 1 1 1 0 1 1 0 2 0 0 0 0 1 1 4 0 1 1 1 A. humilis 1 G55590 0 1 1 1 0 1 1 0 2 0 0 0 0 2 1 4 0 1 1 1 A. humilis 1 2 G55591 0 1 1 1 0 1 1 0 2 0 0 0 0 1 1 4 0 1 1 1 A. humilis 2 G55592 0 1 1 1 0 0 1 0 2 0 0 0 0 2 2 3 0 2 1 1 A. humilis 2 G55593 0 1 1 1 0 0 1 0 2 0 0 0 0 2 2 1 0 2 1 1 A. humilis 2 G55594 0 1 1 1 0 0 1 0 2 0 0 0 0 2 2 2 0 2 1 1 A. humilis 2 1 G55595 0 1 1 1 0 0 1 0 2 0 0 0 0 1 1 2 0 2 1 1 A. humilis 2 G55596 0 1 1 1 0 0 1 0 2 0 0 0 0 2 2 3 1 2 1 1 A. humilis 3 G55597 0 1 1 1 0 1 1 0 2 0 0 0 0 1 2 2 1 1 1 1 A. humilis 3 G55598 0 1 1 1 0 0 1 0 2 0 0 0 0 2 2 2 0 1 1 1 A. humilis 3 2 G55599 0 1 1 1 0 0 1 0 2 0 0 0 0 1 2 1 0 1 1 1 A. humilis 3 1 G55600 0 1 1 1 0 0 1 0 2 0 0 0 0 1 2 1 0 1 1 1 A. humilis 3 G55601 0 1 0 1 0 0 1 0 2 0 0 0 0 0 1 1 0 1 1 1 A. digitifera 3 G55602 0 2 0 1 0 1 0 0 1 2 1 2 2 3 1 4 2 0 0 0 A. digitifera G55603 0 2 0 1 0 1 0 0 1 2 1 2 2 3 1 5 2 0 0 0 A. digitifera G55604 0 2 0 1 0 1 0 0 1 2 1 2 2 2 1 4 2 0 0 0 A. digitifera 1 G55605 0 2 0 1 0 1 0 0 1 2 1 2 2 3 1 4 2 0 0 0 A. digitifera 2 G55606 0 2 0 1 0 1 0 0 1 2 1 2 2 2 1 4 2 0 0 0 A. gemmifera 2 G55607 0 2 0 1 1 1 0 1 2 1 1 1 1 0 0 3 1 1 1 0 A. gemmifera G55608 0 2 0 1 1 1 0 1 2 1 1 1 1 0 0 3 1 1 1 0 A. gemmifera G55609 0 2 0 1 1 1 0 1 2 1 1 1 1 1 0 4 1 1 1 0 A. gemmifera 1 G55610 0 2 0 1 1 1 0 1 2 1 1 1 1 0 0 2 1 1 1 0 A. gemmifera G55611 0 2 0 1 1 1 0 1 2 1 1 1 1 0 0 5 1 1 1 0 “digitate A. monticulosa”
G55612 0 2 0 1 0 0 0 0 2 0 1 2 2 1 1 5 2 0 0 0
“digitate A. monticulosa”
1 G55613 0 2 0 1 0 0 0 0 2 0 1 2 2 1 1 3 2 0 0 0
“branching A. monticulosa”
G55614 1 0 0 0 1 2 2 2 0 3 1 2 2 1 1 1 2 2 1 0
“branching A. monticulosa”
G55615 1 0 0 0 1 2 2 2 0 3 1 2 2 1 1 2 2 2 1 0
“branching A. monticulosa”
1 G55616 1 0 0 0 1 2 2 2 0 3 1 1 2 1 2 0 2 2 1 0
“branching A. monticulosa”
2 G55617 1 0 0 0 1 2 2 2 0 3 1 1 2 0 1 0 2 2 1 0
151