Embed Size (px)
Citation preview

Vol. 107: 263-272, 1994 MARINE ECOLOGY PROGRESS SERIES Mar. Ecol. Prog. Ser.
Published April 28
Speciation of the tintinnid genus Cymatocylis by morphometric analysis of the loricae
'Plymouth Marine Laboratory, Prospect Place. The Hoe. Plymouth PL1 3DH. United Kingdom
'Graduate School of Oceanography, University of Rhode Island, Narragansett. Rhode Island 02882, USA
'Biology Department and Center for Marine Science and Technology, University of Massachusetts, Dartmouth, Massachusetts 02747, USA
ABSTRACT: Samples of the tintinnid genus Cymatocylis were collected at an oceanic site near South Georgia in January 1990. The shapes and sizes of loricae observed included most forms previously reported by other authors and were representative of the entire genus. Measurements were taken from the loricae of over 700 specimens and 201 photomicrographs were obtained. from which further detailed measurements were taken. Univariate frequency histograms and bivariate scatter plots of the morpho- metric measurements were compared with multivanate techniques mcluding: hierarchical nearest neigh- bour cluster analysis, linear discrlrninant analysis and canonical analysis with resubstitution on the model to 95 % confidence intervals. Fourier transforms of digitised lmages of the photomicrographs were utilised as functions of the overall shape of the organisms, and input to both the linear discriminant function and canonical function with resubstitution on the model to 99% confidence Intervals for comparison with results obtained from the manual morphometric measurements. Linear discriminant analysis showed 5 clear taxonomic classes corresponding to the origlnal descriptions of C. calyciformjs, C. convallaria, C. vanhoffenj, C. parva and C. drygalskii. Resubstitution onto the canon~cal models gave correct classifi- cation for the manual morphometric data and 100 % correct classification for the Fourier transform data. These results showed that a clearer discrimination was obtained by utilising a multivariate 'description' of the overall shape. The cluster analysis showed that absolute size was not necessary for the identifica- tion. The univariate and bivariate approaches demonstrated some discernible separation, but with con- siderable overlap between species, especially C. vanhoffenj and C. drygalskii. These statistical methods were used to demonstrate that clear discrimination can be obtained from morphometric data and should allow for the development of automated taxonomic classification.
KEY WORDS: Antarctic. Tintinnids . Taxonomy
INTRODUCTION
The plankton food web of the Antarctic Ocean is tra- ditionally thought of as consisting of diatoms, krill and whales, but recent discoveries suggest that the micro- bial component may play a n important role, as in other ecosystems (reviewed in Garrison 1991). One of the most conspicuous components of the protozooplankton in the Southern Ocean is the tintinnids.
The tintinnid genus Cymatocylis is endemic to the Antarctic Ocean (Pierce &Turner 1993) and is often the dominant genus present (Boltovskoy et al. 1989, Wasik & Mikolajczyk 1990, Alder & Boltovskoy 1991). Despite this, and the fact that this genus has been known since 1907 (Laackmann 1907), identification at the species
level remains problematic. The main source of taxo- nomic confusion in the tintinnids stems from the natural phenotypic variability expressed in the loricae, and the failure of most taxonomic works to address this variabil- ity in the species descriptions. Thus there have been several papers calling for abandonment of lorica mor- phology as the basis of species identification, or at least for the inclusion of cytological characteristics in consid- ering species identification (Davis 1978, 1981, Bakker & Phaff 1979, Laval-Peuto 1981, 1983, Laval-Peuto & Brownlee 1986). While cytological characteristics are extremely valuable, especially in determining taxo- nomic relationships and in original descriptions of spe- cies, it is simply not practical to abandon the lorica as the primary means of identification, especially in ecological
O Inter-Research 1994 Resale of full article not permitted

Mar. Ecol. Prog. Ser. 107: 263-272, 1994
studies. Thus it is very important that the variation of lor- ica morphology be studied and guidelines be estab- lished for accurately speciating tintinnids by their mor- phological characteristics. In this study, morphometric measurements of the loricae of the genus Cymatocylis are taken and a comparison made between the tradi- tional univariate and certain multivariate approaches to the problem of classification. It is hoped that the adop- tion of a multivariate approach to morphometric classifi- cation will avoid the limitations of broad overlapping ranges of univariate measurements and bivariate rela- tionshps. The results from this approach to classification lead into the description of an automated approach to multivariate classification by artificial neural networks given in the accompanying paper (Culverhouse et al. 1994, this volume).
MATERIALS AND METHODS
Tintinnids were collected from several stations near South Georgia in January 1990 using the Longhurst Hardy Plankton Recorder (Williams et al. 1983, Atkinson et al. 1992) and preserved in 10 YO buffered formalin. Near surface samples were used because they contained the greatest abundance of Cymatocylis. The Cymatocylis specimens were measured using 2 tech- niques: (1) all specimens were measured directly from the microscope using an image analysis system linked to an Olympus BH2 compound microscope with phase contrast, and (2) a subset of these specimens were mea- sured from photornicrographs. These were obtained us- ing a 35 mm camera fitted to the compound microscope, the photomicrographs having a final magnification of x240. The photomicrographs were digitised using a Panasonic wv-cd50 camera to provide grey-level images for input to the neural network described by Culverhouse et al. (1994). Fourier transforms (Gonzalez & Woods 1992) were computed from contrast enhanced copies of these 256 X 256 pixel grey-level images.
Microscope measurements. Measurements were taken from 718 specimens of the genus Cymatocylis. Only relatively undamaged loricae, laying relatively flat, were measured. Total length, bowl length and internal lorica oral diameter were measured. The bowl length, on the image analysis system, was measured from a line actually drawn across the long axis of the oral diameter elipse to another line drawn at an arbi- trary point where ~t was judged that the lorica would end if it did not have a pedicel. The pedicel length was not measured but calculated from total length minus bowl length.
Photomicrograph measurements. A subset of 201 photomicrographs of CymatocyLis were measured using vernier calipers. Measurements taken were total lorica
length, bowl length and lorica oral diameter, with pedi- cel length again being derived from the difference be- tween bowl and total length. An additional measure- ment, depth of oral opening equating to the maximum depth of the oral elipse, was taken to correct for rotation in the perpendicular plane. The loricae were assumed to be cylindrical for the purpose of this correction. The point at which the bowl met the pedicel was taken to be the lowest point of the lorica bowl's internal cavity so as to provide a more objective locus for measurements.
Morphometric analysis. Univariate histograms were prepared from the 718 microscope specimens and bivariate scatter plots were prepared for both data sets for comparison. Three multivariate techniques were applied to the photomicrograph data. A hierarchical nearest neighbour cluster analysis (Clarke 1993) was used as an unsupervised procedure to establish any natural tendency for the specimens to cluster on the parameters measured. Initially no scale bars were included for the photomicrographs and arbitrary units were used for the measurements; the similarity table was derived from a correlation matrix to remove absolute size from the equation. The analysis was per- formed with software developed at Plymouth Marine Laboratory. Two discriminant functions were applied to the photomicrograph data (Phillips et al. 1973) using the statistical package SAS (SAS Institute 1985). A linear parametric discriminant function was utilized to compute the Mahalanobis distances, assuming a normal distribution. The Mahalanobis is the general- ized squared distance between the means of groups derived from the within-group covariances. This makes allowance for the possibility of features overlap- ping between species such that an aberrant specimen from one species might be closer to the bounds of another species rather than its own. In this case the specimen is still likely to be closer to its own species mean as derived from the within-group covariance than to the mean of the other species. This is only pos- sible because this is a supervised procedure requiring prior knowledge of the assumed class. A canonical dis- criminant function was applied to test each specimen for probability of inclusion in each class (species). This function folds the multidimensional data into 2 canoni- cal variables providing, at each fold, the maximum separation between all loci. Confidence intervals of 95 % were set on the probabilities and plots of the first 2 canonical variables for each specimen, in both the photomicrograph and microscope data, were pro- duced. The Fourier transforms from the contrast enhanced grey-level images were sampled to give 127 interpolated means for the 128 frequencies repre- sented. The 127 interpolated means were used as input to the discriminant functions to compare with the man- ually measured parameters.

Willidms et al.. Spec~ation of Cymatocylis by morphometric analys~s
RESULTS cies, with examples of their range of lnorphological vari- ability, a re shown in Fig. 1. Total lorica length ranged
Univariate analysis from 48 to 444 pm and oral diameters ranged from 39 to 113 {pm. A frequency histogram of lorica oral diameter
Five different forms of Cyrnatocylis were observed in clearly demonstrates at least 2 species present with the data corresponding to C. calyciformis, C. conval- mean oral diameters of 46 and 92 pm, Fig. 2 . The lower laria, C. vanhoffeni, C. parva and C. drygalskii. The spe- size range comprised all the C. parva with the remain-
Fig. - . -,,. (a) -. ,-. ..I, (b) -. :onv rid, I-, - cal, S , (d, -. drygalskii, ( c , -. vanhdffeni, s h o w n g the range of morphological variability

266 Mar. Ecol. Prog. Ser. 107: 263-272, 1994
Q, Q
100 - 0 C
0 C
Fig. 2. Cyrnatocylis spp. Fre- quency histogram of lorica oral
60 64 68 ??!! ryi ~ir ryl YZ ~b IYY I U ~ 108 112 diameter Oral diameter (pm)
180
1 60
140 0
m-
8 120 C
l00 0
80 3 v g 60 U.
40 Fig. 3. Cyrnatocylis spp. Fre-
20 quency histogram of total lorica 60 80 100 120 140 160 180 200 220 240 260 280 300 320 340 360 380 400 420 440 length
Total lorica length (pm)
ing species in the upper size range. A frequency histo- gram of total lorica length (Fig. 3) shows 4 normally dis- tributed groupings with C, drygalskii overlapping be- tween C. calyciformis and C. vanhoffeni.
The scatter plots of bowl length against total length (Fig. 4a) show a good separation for all 5 species on the photomicrograph data which were corrected for per- pendicular orientation; only C. drygalskii and C. van- hoffeni overlap to any degree. This plot also clearly shows 2 horizontal broad bands corresponding to the short-bowled group of C. calyciformis, C. convallaria and C. parva and the long-bowled group of C. vanhof- fen1 and C. drygalskii. However, it also shows that there is a continuous sequence of overlapping ranges of bowl lengths across the genus with only a small reduction in frequency at the meeting of C. calyci- formis and C. drygalskii, which may be an artifact of sampling. The scatter plot for the microscope data given in Fig. 4b shows more overlap between species
though there is a sharper division between long- and short-bowled species.
Multivariate analysis
The cluster analysis (Fig. 5) shows the 201 specimens clustering at a 95% similarity into 5 single-species clusters and 2 two-species complex clusters. This analysis utilises a correlation matrix, therefore, the absolute values of the measurements are standardised out leaving the results dependent on the relative pro- portions of the morphological features. Cymatocylis vanhoffeni, C. parva and C. calyciformis each clus- tered to single loci suggesting a low variability in their relative proportions, the aberrant C. calyciformis hav- ing an abnormally long pedicel. The C. drygalskii clus- tered with the C. vanhoffeni. These 2 species have very similar proportions and sizes with the main distin-

Willlams et al.: Speciation of CymatocyD's by morphometric analysis 267
Fig. 4 . Cymatocylis spp. Scatter plots of bowl length against total length of lonca for data measured from (a) photomicrographs and (b) rmcroscope
a. Photomicrograph data 0
o calyciformis i convallaria A drygalskll C parva
Total lorica length (arbitary units)
0 0 100 200 300 400 500
Total lorica length (pm)
.
quishing feature being the long fluting of the bowl into clustered with 1 of the 3 groups of C. convallaria, the pedicel of C. vanhoffeni. Seven of the C. drygalskii although this is an artifact because of the removal of
absolute size. The C. convallaria were divided into 3
b. Microscope data
+ convallarla o A drygalskl~ O parva
AA
t
+ L3
-.
Percentage similarity 0 10 20 30 40 50 60 70 80 90 100
1. 45 vanhoffeni 20 drygalski1
2. 12 convallaria 3. 1 calyciformis 4. 41 calyc~formis 5. 10 convallar~a
7 drygalskii @ 6. 41 parva
7. 24 convallar~a
Fig. 5. Dendrogram of percentage similarity of Cymatocyhs species using data measured from the photomicrographs
clusters, interspersed amongst the other species. This shows for C. convallana that despite the absolute size range being narrow and isolated from the other spe- cies (Figs. 3 & 4) there is still a large variability in the relative proportions of the features of this species.
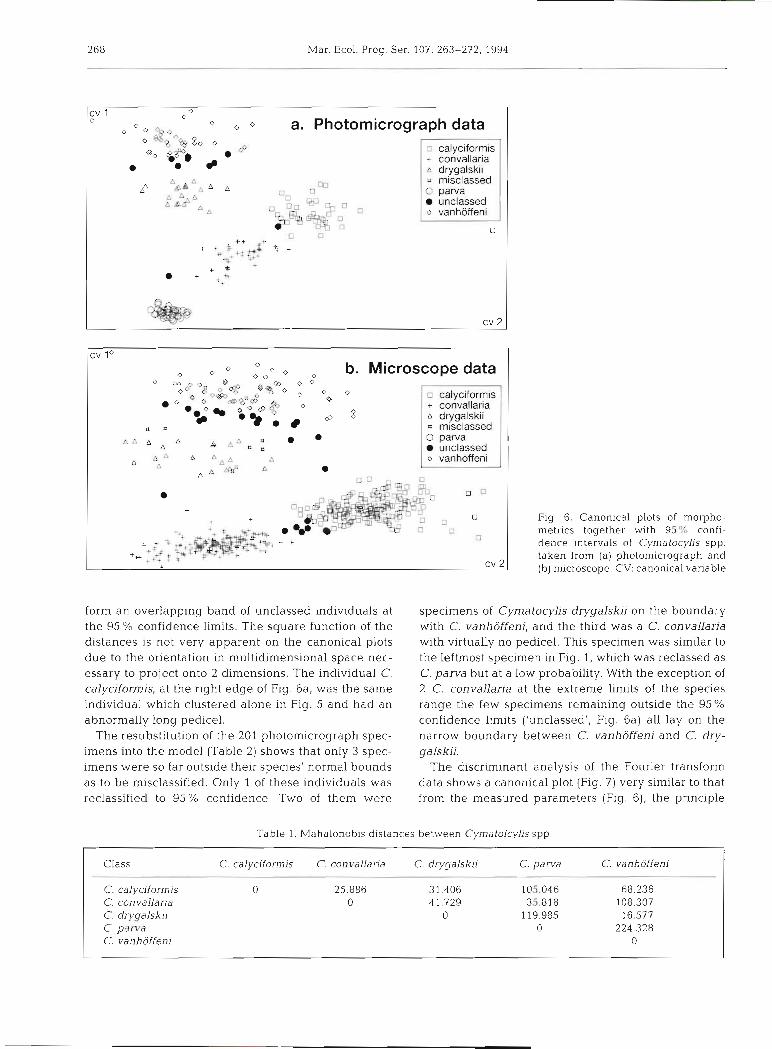
The Mahalanobis distances from the discriminant analysis (Table 1) show a minimum of 16.6 between Cymatocylis drygalskii and C. vanhoffeni. Since these distances are a function of a square, they give greater resolution for the shorter distances. The canonical plot for the photomicrograph data (Fig. 6a) shows a 2- dimensional projection of the individual specimen dis- tances on resubstitution into the model and clearly fol- lows the same trend as the Mahalanobis distances for the overall classes, with C. vanhoffeni and C. parva being at maximum separation. In contrast, C. vanhof- feni and C. drygalslu are at minimum separation and
Mar. Ecol. Prog. Ser. 107: 263-272, 1994
0
0 O o ' 0 o a. Photomicrograph data 80 0
b s P . OO .m' + convallaria
m A drygalskii A A rn~sclassed
p B I . A A Q parva :A?&" unclassed
A L,
P P
CV l0
0 o 0 0 b. Microscope data
e, + convallaria
S 8 A drygalskii n = rnisclassed
A A * A A d c ; • o parva unclassed A AAA A 6. A A A
a &S= A . Flg 6. Canonical plots of morpho- metrics together with 95% confl- dence ~ntervals of Cymatocylis spp. taken from (a) photomicrograph and (b) microscope CV: canonical variable
form an overlapping band of unclassed individuals at specimens of Cymatocylis drygalskii on the boundary the 95 % con.fid.ence limits. The square function of the with C. vanhoffeni, and the third was a C. convallaria distances is not very apparent on the canonical plots with virtually no pedicel. This specimen was similar to due to the orientation in multidimensional space nec- the leftmost specimen in Fig. 1, which was reclassed as essary to project onto 2 dimensions. The individual C. C. parva but at a low probability. With the exception of calyciformis, at the right edge of Fig. 6a, was the same 2 C. convallaria at the extreme limits of the species individual which clustered alone in Fig. 5 and had an range the few specimens remaining outside the 95% abnormally long pedicel. confidence limits ('unclassed', Fig. 6a) all lay on the
The resubstitution of the 201 photomicrograph spec- narrow boundary between C. vanhoffeni and C. dry- imens into the model (Table 2) shows that only 3 spec- galskii. imens were so far outside their species' normal bounds The discriminant analysis of the Fourier transform as to be misclassified. Only 1 of these individuals was data shows a canonical plot (Fig. 7) very similar to that reclassified to 95% confidence. Two of them were from the measured parameters (Fig. 6), the principle
Table 1. Mahalonobis distances between Cymafolcylis spp.
Class C. calyaformis C. convallana C. dryqalskii C. p a rva C. vanhoffenl
C. calyciforrnis 0 25.886 31.406 105.046 68.236 C. convallaria 0 41.729 35.81 8 108.307 C. drygalsk~l 0 119.985 16.577 C. parva 0 224.328 C. vanhdfeni 0

Williams et al.. Speciation of Cymatocylls by morphometric analys~s
Table 2. Cymatolcylis spp. Resubstitution on the model using data from the photomicrograph specimens
I Re-classed Total
Class C. calyciformis C. convallaria C, drygalskli C. parva C vanlioffeni
- C. calyclform~s 42 0 0 0 0 42 C. convallaria 0 45 0 1 0 46
'B .- C. drygalskii 0 0 25 0 2 27 C. parva 0 0 0 4 1 0 4 1 C. vanhoffeni 0 0 0 0 45 45
Total 4 2 45 25 42 47 201
Error rates
Table 3. Mahalonobis distances for Cymatolcylis transforms
Class C. calyciformis C. convallaria C. drygalskii C. parva C. vanhoffeni
C. calyciformis 0 101.425 97.576 184.989 301.807 C. con vallaria 0 186.1 14 87.435 448.698 C. drygalskii 0 303.324 260.499 C. parva 0 565.389 C. vanhoffeni 0
difference being the lateral shift of Cymatocylis dry- galskii to the nght. The Mahalanobis distances for the classes derived from the Fourier transforms (Table 3) are an order higher than those obtained with manually measured parameters. A resubstitution on the canoni- cal model gave correct classification to all specimens within 99 O/o confidence limits.
DISCUSSION
It can be seen from the results that the classical approach to morphometric taxonomy, utilising univari- ate parameters, provides a high degree of overlap
between the species. The oral diameter of the lorica is thought to be fairly invariate within species of the genus Cymatocylis (Laval-Peuto 1982, Boltovskoy et al. 1990). Although this measurement is considered by many to be the most conservative and practical of lorica morphometric characteristics (Gold & Morales 1975, 1976, Laval-Peuto 1981, Laval-Peuto & Brownlee 1986) it can be seen (Fig. 2) to divide the genus into only 2 normally distributed populations. These distnb- utions correspond to C. parva in one and the remain- der of the species in the other. The histogram of fre- quency to total length (Fig. 3) demonstrates clearly the degree of overlap between the species. Certainly these univariate parameters are insufficient to discriminate
Fourier data p&zXcalytifamirl + convallaria A drygalskii 0 parva
Fig. 7 . Cymatocyhsspp. Canonical plots of Fourier transforms of photomicrographs

210 Mar. Ecol Prog. Ser. 107: 263-272, 1994
between species of Cymatocylis. In previous studies of Cymatocylis (Boltovskoy et al. 1990) and Favella (Laval-Peuto 1981), total length and oral diameter show unimodal and relatively normal-appearing distri- butions.
The bivariate plots (Fig. 4a, b) show good separation using bowl and pedicel length for the 5 species from the photomicrograph data, with significant overlap only between Cymatocylis vanhoffeni and C. drygal- skii. The same plot performed for the much larger sam- ple population from the microscope data shows a cor- responding increase in overlap due to the greater range of variability sampled. For the large sample the distances shorten dramatically between C. calyci- formis and C. convallaria and between C. calyciformis and C. drygalskii. Therefore, a larger sample popula- tion does not improve separation into the respective species. One reason bowl length may be more constant in Cymatocylis than in other genera is that no speci- mens were observed with any modifications to the original lorica such as extra collars. Such extra collars have been observed in several genera such as Favella, Helicostomella and Tintinnopsis (Gold & Morales 1976, Laval-Peuto & Brownlee 1986). Similar to other genera, Cymatocylis does appear to form a coxlielliform re- placement lorica. While rare in the samples, a few specimens were observed with such loricae (Fig. 8). These loricae match the dimensions of C. parva, and the short-bowled Cymatocylis.
Previously assigned to the genus Coxliella, such specimens have been reported before from Antarctic
-4. .' ._ . . I
S).'. .. Flg. 8 Coxllelliform replacement lonca of Cymatocylis sp
samples (Laackmann 1907, Balech 1958a, b, 1973, Sassi & Me10 1986), but until now, have not been asso- ciated with the genus Cymatocylis. Coxlielliform lori- cae have been previously reported in the genera Fa vella, Parafa vella, Helicostomella and Tintinnopsis (Laval-Peuto & Brownlee 1986). Although the reliabil- ity of highly variable features, such as total length and especially pedicel length, may be controversial, there are no alternative explanations for the size distribu- tions observed. Previous studies of a single species have not shown multimodal distributions of these char- acters. There are no life cycle events known which would explain these distributions either. Sexual dimor- phism and alternation of generations are unknown in the tintinnids and coxlielliform replacement loricae approximate the same dimensions as the normal lori- cae. Therefore it is reasonable to assume that these 5 classes represent discrete species.
A!though these uni- and bivariate plots demonstrate the presence of different 'species' in the data, it is only the results from the multivanate analyses which pro- vide the direct methods for grouping these individuals into separate classes or species. In the multivanate plots (Fig. 6 ) the inter-class distances are derived from within-class covariance. Therefore, the broader range of parameters from the larger sample population sim- ply fine-tune the overall class means such that the inter-class distances between Cymatocylis calyciformis and C. convallaria and between C. calyciformis and C. drygalskii remain reasonably constant for the larger sample. This means that the discrimination is not degraded by a broader range of specimens. The sepa- ration between C. drygalskii and C. vanhoffeni is poor throughout the univariate, bivariate and multivariate techniques. The principal cause for this is that their respective ranges for the measured parameters over- lap to a considerable degree. From Fig. 1 it can be seen that the most easily identifiable discriminating feature between these 2 species is the angle at which the bowl meets the pedicel, the specimens of C. vanhoffeni con- sistently having a more obtuse angle resulting in the long fluting of the lorica. Some of the increased overlap between these 2 species found in the canonical plots, for the rmcroscope data, could be due to inaccuracies in the measurements. The C. drygalskii specimens measured with the microscope were the same set as for the photomicrographs, due to the low numbers of this species in the data set. Within the 95% confidence intervals only one of these C. drygalslu~ was mis- classed from the photomicrograph data but several were misclassed with the microscope data. This was probably due to the more arbitrary locus chosen to rep- resent the junction of the bowl and pedicel. This would be difficult to determine for C. vanhoffeni with its long fluted transition between bowl and pedicel; although

Williams et al.: Speciation of C) matocylis by morphometric analysis 27 1
accuracy could also be influenced by the lack of cor- rection for perpendicular olientation in the microscope data. The difficulty in separating these species can be overcome by using Fourier transform data.
The Fourier transform is a mathematical analogue of a diffraction pattern obtained from the interference patterns generated by an object impinging on the transmission path from a coherent light source. It is therefore a function of the shape of the object. The close concurrence between the canonical plots for the photomicrograph measurement data (Fig. G ) and the Fourier transform data (Fig. 7) clearly demonstrates the value of the Fourier transforms as a mathematical func- tion of the entire shape of the organisms. The use of the Fourier transform data in the discriminant analysis pro- vides a clearer separation. The major differences be- tween the 2 canonical plots are that Cymatocylis dry- galskii is shifted to the right in the plot and C. vanhoffeni forms a much tighter distribution. The only easily observable discriminatory feature which was not measured was the angle at which the bowl joins the pedicel. Therefore, it may be reasonable to assume that the improved separation of the 2 species obtained with the Fourier data is due to the inclusion of that fea- ture in the overall functlon of the shape.
We have illustrated a steady improvement of the dis- crimination achieved by the different methods, from a simple univariate statistic to increasing degrees of multivariate relationships. It can be appreciated that any morphometric classification which uses a function of overall shape of an organism will be more useful than any using individual morphometrics. A taxono- mist identifying plankton will recognise the pattern of the overall shape of organisms, only resorting to mor- phometrics when there is uncertainty in the identifca- tion. It is hoped that we can assist the taxonomist in this labourious task of classification by automating this process by taking a video image from the microscope and feeding the overall function in the form of a Fourier transform into an artificial neural network. The excercise in this paper is intended to demonstrate that discrimination is feasible, even in this very difficult congeneric protozoan group, and that this approach can provide the basis for the development of an artifi- cial neural network discriminator (Culverhouse et al. 1994).
Acknowledgements. We thank the captain and crew of RRS 'John Biscoe' and our colleagues in British Antarctic Survey for allowing one of us (R.W.) to join cruise No. 10 to South Georgia in 1989/1990. We thank Martin Carr for his guidance on the statistical analysis. This work formed part of the Labo- ratory Project 3 of the Plymouth Marine Laboratory of the U.K. Natural Environment Research Council. This work was partly funded by MAST 2 project number MAS2-92-0015~.
LITERATURE CITED
Alder, V. A., Boltovskoy, D. (1991). Microplanktonic distribu- tional patterns west of the Antarctic Peninsula, with spe- cial emphasis on the tintinnids. Polar Biol. l l : 103-112
Atkinson, A., Ward, P., Williams, R., Poulet, S. A. (1992). Die1 vertical migration and feeding of copepods at a n oceanic station near South Georgia. Mar. Biol. 113(4): 583-593
Bakker. C., Phaff, W. J. (1979). The genus Tintinnopsis Stein. Hydrobiologia 50: 101-111
Balech, E. (1958a). Dinoflagelles Tintinnides de la Terre Adelle (Secteur Francais Antarctique). Vie Milieu 8: 382-408
Balech, E (1958b). Plancton de la Campana Antarchca Argentina. Physis, B. Aires 21: 75-108
Balech. E. (1973). Segunda contribucion a1 conocimiento del plancton del Mar d e Bellingshausen. Contrnes Inst. antarct. argent. 107: 3-63
Boltovskoy, D., Alder, V. A., Spinelli, F. (1989). Summer Wed- dell Sea microplankton: assemblage structure, distribution and abundance, with special empahsis on the Tintlnnina. Polar Biol. 9: 447-456
Boltovskoy, D., Dinofrio, E. O., Alder, V. A. (1990). Intra- specific variability in Antarctic tlntinnids: the Cymatocylis affinisl convallarja species group. J. Plankton Res. 12: 403-413
Clarke. K. R. (1993). Non-parametric multivariate analysis of changes in community structure. Aust. J. Ecol. 18: 117-143
Culverhouse, P. F., ELlis, R. E.. Simpson, R. G., Williams, R., Pierce, R . W., Turner, J. T (1994). Auton~atic categonsa- tion of five species of Cymatocylis (Protozoa, Tintinnida) by artificial neural network. Mar. Ecol. Prog Ser. 107: 273-280
Davis, C. C. (1978). Variations of the lorica in the genus ParafaveUa (Protozoa: Tintinnida) in northern Norway waters. Can. J . Zool. 56: 1822-1827
Davis, C. C. (1981). Variations in the lorica shape in the genus Ptychocyljs (Protozoa: Tintinnina) in relation to species identification. J . Plankton Res. 3: 433-443
Garrison, D. L. (1991). An overview of the abundance and role of protozooplankton in Antarctic waters. J . mar. Sys. 2: 317-331
Gold. K.. Morales, E. A. (1975). Seasonal changes in lorica sizes and the species of Tintinnida in the New York Bight. J. Protozool. 22: 520-528
Gold, K., Morales, E. A. (1976). Studies on the sizes, shapes and development of the lorica of agglutinated Tintinnida. Biol. Bull. 150: 377-392
Gonzalez, R. C., Woods, R. E. (1992). Digital image process- ing. Addison-Wesley, Massachusetts
Laackmann, H. (1907). Antarktische Tintinnen. 2.001. Anz. 31: 235-239
Laval-Peuto, M. (1981). Construction of the lorica in Ciliata, Tintinnina. In vivo study of Favella ehrenbergii: variability of the phenotypes during the cycle, biology, statistics, bio- metry. Protistologica 17: 249-272
Laval-Peuto, M. (1982). Methods of taxonomy and selection of criteria for determination of marine planktonic protozoa. Annls Inst. oceanogr., Paris 58:151-168
Laval-Peuto, M. (1983). Sexual reproduction in FaveUa ehren- bergii (Ciliophora, Tintinnina). Taxonomical implications. Protistologica 29: 503-512
Laval-Peuto, M., Brownlee, D. C. (1986). Identification and systematics of the Tintinnina (Ciliophora): evaluation and suggestions for improvement. Annls Inst. oceanogr., Paris 62. 69-84

3 3
2;
4 LI m
CO' -
tQ .-
2 G B
2 'U
E.(
"g
2
< z
" 5 pz
2,1
gB
p
-0 5- >z-ID
5 p
z$
?"
.n
-- a
n
c- , (0
3 C
ID%"
G'
zgE
z$ oz
8
."
~~
~.
g
~z
>2
?-
?~
r
p.
- U
)?
'zC
G"
p
- - lIDoG-g?
;-<
---
gm?
6";;
"'go
c%n?o-
tT-
Q
,c;
OL
I
g~g;
?.?
?g
"
,?
U
:p
:z. -
EL
?
-3
p
,g
E
c,ro
;s Q
52
I ID
E-
- M0 F+'
e,a
<
O
g
'5
2 ". " I-
c3
a
o
S *
25
?F
u,
%
E.;
-


![Histogram [Www.nikonians.org]](https://img.pdfslide.us/doc/110x75/577cd8911a28ab9e78a17d60/histogram-wwwnikoniansorg.jpg)