Embed Size (px)
Citation preview
Ž .Chemical Geology 146 1998 155–170
Speciation and isotopic composition of sedimentary sulfur in theEverglades, Florida, USA
Anne L. Bates a,), Elliott C. Spiker a, Charles W. Holmes b
a US Geological SurÕey, National Center, MS 956, Reston, VA 20192, USAb US Geological SurÕey, Studebaker Building, 600 4th Street South, St. Petersburg, FL 33701, USA
Abstract
We have studied the sulfur speciation and isotopic composition of two peat cores from Water Conservation Area 2AŽ .WCA 2A in the Florida Everglades. Core site E1 is affected by agricultural runoff from the Hillsboro Canal which drainsthe Everglades Agricultural Area; Core site U3 is distant from the canal and relatively unaffected by agricultural runoff.
Ž .Depth profiles of the total sulfur content of both cores show fairly constant levels ;0.7 wt.% below about 25–30 cmdepth in Core E1 and below 40–45 cm in Core U3. Above these depths, total sulfur increases to as much as 1.52 wt.% inCore E1 and 1.74 wt.% in Core U3, suggesting that more sulfur has entered the sediments andror that more sulfur is beingretained in recent times at both sampling sites. The changes in total sulfur content with depth in Core E1 correlate withchanges in total phosphorus that have been observed in other studies at core sites near the Hillsboro Canal. This correlationof total sulfur with phosphorus with depth is not seen in Core U3 located away from the canal, possibly because phosphorus
Ž .is more effectively retained than sulfur in the organic sediment near the canal. Organic-sulfur OS concentrations are at leastŽ .twice as high as the disulfide-sulfur DS concentrations in the upper parts of both cores suggesting that iron is presently
Ž .limiting the amount of disulfide minerals formed in these sediments. The degree of pyritization DOP in the upper parts ofthe cores suggest that sulfide mineralization is limited by the availability of highly reactive iron during the earliest stages ofdiagenesis. Positive d 34S values for reduced sulfur forms in both cores indicate a relatively restricted sulfate reservoir,consistent with nearly complete reduction of the sulfate available in the sediment at any given time. Differences between thetwo cores appear in the d 34S values for the near-surface sediments. The DS d 34S values in the upper 10.0 cm of sedimentare more positive at site E1, with a mean d 34S value of q12.9 per mil, than at site U3, with a mean d 34S value of q2.9per mil. These results may indicate that increased rates of organic deposition due to nutrient loading near the canal have
Ž .increased the rate of sulfate reduction at the E1 site in recent times. Acid-volatile-sulfide AVS concentrations are lowerthan DS and OS concentrations by at least a factor of 10. Increasing d 34S values for AVS with increasing depth in bothcores suggests ongoing reduction of a limited porewater sulfate reservoir after deposition. The disulfide and organic-sulfurd 34S values diverge from the d 34S values for AVS with depth, suggesting that most of the transformation of AVS intodisulfide minerals or incorporation of sulfur into organic matter occurs in the near-surface sediments. A comparison of
34 Ž . 34organic-sulfur d S values in the dominant flora at the U3 site sawgrass leaves and periphyton with organic-sulfur d Svalues at the top of the U3 core indicates that there was early incorporation of an isotopically light sulfide species into theorganic matter. Published by Elsevier Science B.V.
Keywords: Speciation and isotopic composition; Sedimentary sulfur; Everglades
) Corresponding author.
0009-2541r98r$19.00 Published by Elsevier Science B.V.Ž .PII: S0009-2541 98 00008-4
( )A.L. Bates et al.rChemical Geology 146 1998 155–170156
1. Introduction
The Everglades are being intensively studied todetermine the effects of agricultural and water man-agement practices on this historically oligotrophic
Ž .ecosystem Lodge, 1994 . The historical EvergladesŽ .i.e., pre-anthropogenic perturbations included alarge part of southeast Florida south of Lake Okee-chobee. Since implementation of the Central andSouthern Florida Project for Flood Control and OtherPurposes, passed by the United States Congress in1948, the historic Everglades has been divided bycanals and levees into three major areas: the Ever-
Ž .glades Agricultural Areas EAAs , the Water Con-Ž .servation Areas WCAs , and Everglades National
Ž . ŽPark Fig. 1 . Water in the northern Everglades the.EAAs and WCAs is fresh and derived from rainfall
and outflow from Lake Okeechobee. Water fromLake Okeechobee irrigates the EAAs and then flowsinto the WCAs via a network of canals and pumpingstations where it is impounded in wetlands and even-
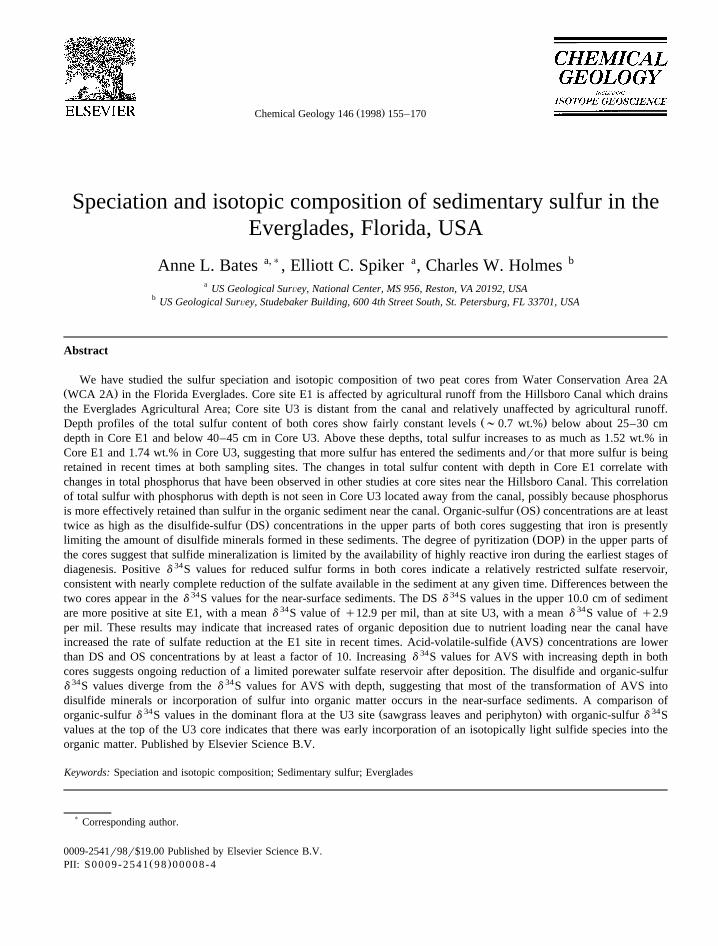
Fig. 1. Schematic map of South Florida with the EvergladesŽ . Ž .Agricultural Area EAA , Water Conservation Areas WCAs , and
Everglades National Park.
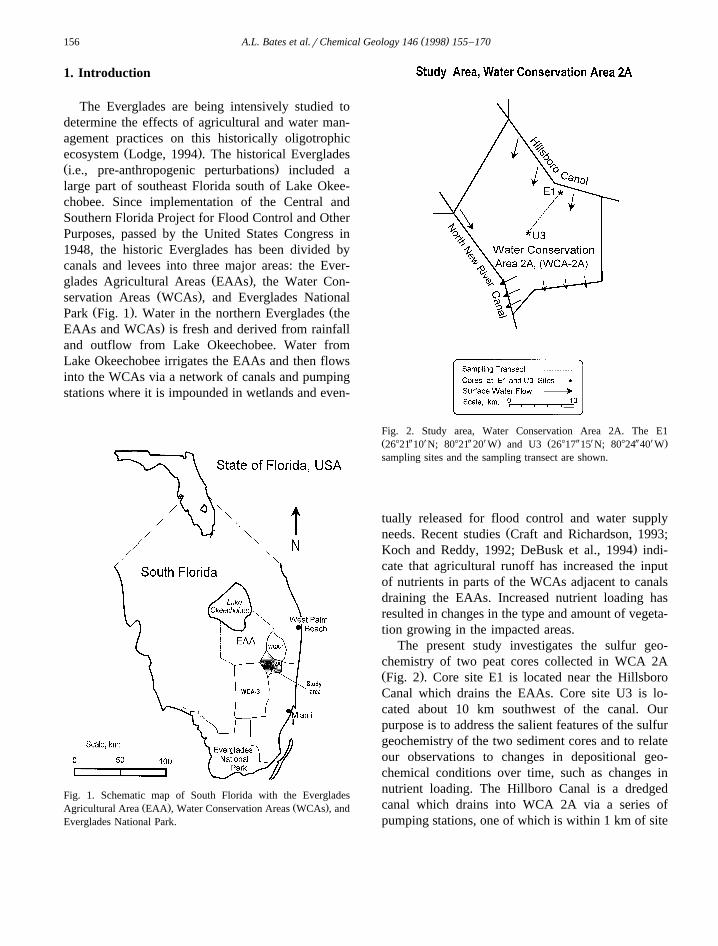
Fig. 2. Study area, Water Conservation Area 2A. The E1Ž Y X Y X . Ž Y X Y X .26821 10 N; 80821 20 W and U3 26817 15 N; 80824 40 Wsampling sites and the sampling transect are shown.
tually released for flood control and water supplyŽneeds. Recent studies Craft and Richardson, 1993;
.Koch and Reddy, 1992; DeBusk et al., 1994 indi-cate that agricultural runoff has increased the inputof nutrients in parts of the WCAs adjacent to canalsdraining the EAAs. Increased nutrient loading hasresulted in changes in the type and amount of vegeta-tion growing in the impacted areas.
The present study investigates the sulfur geo-chemistry of two peat cores collected in WCA 2AŽ .Fig. 2 . Core site E1 is located near the HillsboroCanal which drains the EAAs. Core site U3 is lo-cated about 10 km southwest of the canal. Ourpurpose is to address the salient features of the sulfurgeochemistry of the two sediment cores and to relateour observations to changes in depositional geo-chemical conditions over time, such as changes innutrient loading. The Hillboro Canal is a dredgedcanal which drains into WCA 2A via a series ofpumping stations, one of which is within 1 km of site
( )A.L. Bates et al.rChemical Geology 146 1998 155–170 157
E1. Both sampling sites are characterized by marshcommunities; water depth above the sediment variesbetween approximately 5 to 50 cm, depending mainlyon rainfall, which tends to be highest in the summer
Žmonths. At the time the cores were collected March.1994 , the water depth above the sediment surface at
site E1 was about 5 cm, while at site U3, the waterdepth was about 30 cm.
Ž .Craft and Richardson 1993 have shown thatŽthere is significant phosphorus enrichment ;1400
.mgrg in sediments near the canal within a kilome-ter of core site E1, whereas sediments within akilometer of core site U3 have background levels of
Ž .phosphorus ;600 mgrg . Craft and RichardsonŽ .1993 also observed variation in the vertical distri-bution of phosphorus from about 400 mgrg at 25-cmdepth increasing to a maximum of about 2900 mgrgnear the sediment surface in cores collected near thecanal. In recent times, increased plant productivitynear the canal has produced a higher rate of sedimen-
Ž .tation ;6.0 mmryr in comparison to sites awayŽ . 137from the canal ;2.5 mmryr based on Cs activ-
Žity from bomb test deposition Craft and Richardson,. 2101993 . Using Pb methods, we found sediment
accretion rates of 32 mmryr in the upper 8 cm ofsediment and 1.3 mmryr from 8–20-cm depth at theE1 site and 0.9 mmryr from 0–30 cm depth at the
Ž .U3 site unpublished data . The discrepancy betweenthe 137Cs and 210 Pb results may be due to intersitedifferences in sedimentation rates. Sedimentationrates deeper in the sediment column are not known.
Nutrient loading from agricultural runoff isthought to be responsible for the emergence of cat-
Ž .tails Typha domingensis Pers. and T. latifolia L.Ž .where sawgrass Cladium jamaicense was once
Ždominant. Cattails are seen only in small stands for.example, around ‘alligator holes’ in undisturbed
areas of the Everglades; they can compete success-fully with the dominant sawgrass when nutrient lev-
Ž .els are elevated Lodge, 1994 . The spatial distribu-tion of cattails near the canals corresponds to the
Ž .areas enriched by soil nutrients DeBusk et al., 1994 .Site E1, near the Hillsboro Canal, is dominated bydense stands of cattails, whereas site U3, away fromthe canal, is dominated by low density stands ofsawgrass and open water with discontinuous mats ofperiphytic algae. The density of stands of both saw-grass and cattails increases from site U3 towards the
canal. The higher density of vascular vegetation, aswell as the faster growing cycle and leaf turnover
Ž .rates for cattails compared to sawgrass Davis, 1994 ,are probably responsible for the higher sedimentationrates currently observed at the E1 site.
The subsurface and surficial waters of the fresh-water Everglades are components of a continuous,non-confined, surficial aquifer system, the uppermost
Žunit of which is the Biscayne Aquifer Sonntag,.1987 . Limestone bedrock underlies the EvergladesŽ .peat Gleason and Stone, 1994 . Recharge to the
aquifer is primarily from rainwater, with lesseramounts supplied by drainage from Lake Okee-
Žchobee and other areas to the west and north Fish,.1988; Waller and Earle, 1975 . Groundwater flow
patterns in the WCAs vary seasonally and are notŽwell-known surface water flow in WCA 2A is as
.shown in Fig. 2 , although the WCAs and the canalsare known to be hydrostatic high points on a regional
Ž .scale Fish, 1988 . The surface waters are slightlyŽ .basic DeBusk et al., 1994 with pH values between
Ž .7 and 8 unpublished data . Dissolved sulfate con-centrations in the freshwater areas of the Evergladesrange from ;0.001 mM to ;0.45 mM in the
Žsurface water Altschuler et al., 1983; Waller and.Earle, 1975 and from ;0.01 mM to ;0.15 mM in
Ž .the Biscayne Aquifer Sonntag, 1987 . Surface watersamples collected between March 1995 and June1997 from various locations in WCA 2A have sul-fate concentrations from 0.25 to 0.98 mM; watersamples collected from the Hillsboro Canal duringthe same time period have sulfate concentrations
Ž .from 0.38 to 1.3 mM unpublished data . Groundwa-ter collected at two sites in WCA 2A in May–June1997 had sulfate concentrations of 0.025 mM and0.010 mM; surface water collected at the same timeat those sites had sulfate concentrations of 0.62 mMand 0.44 mM. The concentration of sulfate in rain-water over the southeastern Florida area averages
Ž .about 0.03 mM Waller and Earle, 1975 . We havefound that concentrations of sulfate in surface waterin WCA 2A are quite variable over time and do notshow a consistent pattern related to distance from thecanal. We believe that sulfate concentrations in thesurface water are highly dependent on the amount ofrainfall, on variable amounts of input from the canal,and on oxidation of sulfidic sulfur in drier areas ofthe marsh. Significant seawater influence on sulfate
( )A.L. Bates et al.rChemical Geology 146 1998 155–170158
concentrations in surface water or groundwater is notŽapparent in our data from WCA 2A seawater influ-
ence is significant in the southern Everglades near.Florida Bay .
The sulfur geochemistry of the organic-rich surfi-cial sediments is of interest because the distributionof sulfur species and their isotopic compositions aresensitive to changing depositional conditions. Thesulfur contents, speciation trends, and isotopic com-positions of sediments in the northern Evergladeshave historically been controlled predominantly bylow, freshwater levels of dissolved sulfate in thewater supplied from rainfall, groundwater, and LakeOkeechobee, and by low levels of iron diffusingupward into the sediment from the limestone bedrock
Ž .underlying the Everglades Altschuler et al., 1983 .Changes in sulfur contents with depth in the coresmay reveal changes in sulfur loading and sulfurretention in the sediments over time. Furthermore, acomparison of the sulfur speciation results and iso-topic compositions between the two core sites mayreveal differences that can be related to nutrientsupply as discussed above.
The speciation of sulfur in sediment is markedlyinfluenced by factors such as redox potential, pH,organic productivity, sulfate content, rate of micro-bial sulfate reduction, and reactive iron availabilityŽ .Berner, 1984 . Sulfur usually enters a wetland assulfate from terrestrial runoff or from groundwaterrecharge; sulfate assimilated by aquatic or terrestrialplants enters sediment with plant detritus as organi-
Ž .cally bound sulfur Tuttle et al., 1990 . In anoxicsediments containing dissimilatory sulfate reducingbacteria, sulfate is reduced to H S using organic2
Žmatter as a reducing agent Goldhaber and Kaplan,.1974 . The amount of H S produced and the rate of2
its production through bacterial sulfate reduction willbe limited by the availability of biodegradable or-
Žganic matter Berner, 1980; Berner and Raiswell,1984; Canfield, 1991; Sweeney, 1972; Westrich and
.Berner, 1984 and by low sulfate concentrationsŽ .Bondreau and Westrich, 1984 .
Ž .The formation of iron sulfides FeS and FeS2
from H S is limited by the availability of reactive2
iron when excess H S is available. When the rate of2
H S production exceeds the rate of its fixation with2
iron, excess porewater H S accumulates and can2
react with organic matter to form diagenetic
organosulfur compounds, or it can diffuse toward thesediment surface where it is oxidized to sulfate or toother sulfur species with intermediate oxidation statesŽelemental sulfur, polysulfides, thiosulfate, poly-
. Žthionate by sulfur oxidizing bacteria Jørgensen,.1990; Tuttle et al., 1990; Mossmann et al., 1991 .
Porewater H S can react with elemental sulfur near2
the sediment surface to form sulfidesrpolysulfidesŽ .Mossmann et al., 1991 which can be incorporatedinto organic matter, the rates of incorporation being
Ždependent on pH Sinninghe Damste et al., 1989;.Vairavamurthy and Mopper, 1989 .
Sulfur isotopes can be used to evaluate the rela-tive importance of the processes discussed aboveduring sedimentary deposition. Isotopic fractionationoccurs during the bacterial reduction of sulfate toH S, with the H S being depleted in 34S relative to2 2
Žsulfate references summarized in Goldhaber and. 34 32 ŽKaplan, 1974 . Very low Sr S ratios expressed
as negative d 34 S values in per mil units relative tothe CDT standard, sometimes as low as y40 per
.mil are characteristic of H S produced from an2Žunlimited reservoir of sulfate i.e., open-system con-
.ditions by bacterial reduction. However, if the reser-voir of sulfate is small, the d 34 S values of thesulfide and of the residual sulfate will become in-creasingly enriched in 34S as the sulfate is consumedŽ .Nakai and Jensen, 1964 . The sulfur isotopic frac-tionation is also affected by the rate of sulfate reduc-tion; a slower rate of reduction generally results in
34 Žlower d S values in the H S product i.e., a greater2. Ž .kinetic isotope effect Kaplan and Rittenberg, 1964 .
Significant isotopic fractionation is not involved ineither the non-microbial reoxidation of H S to sul-2
fate or the incorporation of H Srpolysulfides into2Žorganic-sulfur Nakai and Jensen, 1964; Fry et al.,
.1988 . Similarly, isotopic fractionations are smallŽ .maximum of y3 per mil during assimilatorymetabolic incorporation of sulfate into primary or-
Žganic matter Goldhaber and Kaplan, 1974; Kaplan.and Rittenberg, 1962 . There is evidence for the
enrichment of 34S in the intermediate products ofŽmicrobial oxidation of H S Anderson and Pratt,2
.1995 , including polysulfides which react with or-ganic matter to form organic-sulfur. Thus, organic-sulfur may be enriched in 34S compared to inorganicsulfides which are formed contemporaneously from acommon sulfide reservoir.
( )A.L. Bates et al.rChemical Geology 146 1998 155–170 159
2. Methods
The sediments were collected in 9-cm inner diam-eter plexiglass core tubes on March 1, 1994 from site
Ž Y X Y X .E1 26821 10 N; 80821 20 W and site U3Ž Y X Y X . Ž .26817 15 N; 80824 40 W Fig. 2 . The depths ofpenetration were 80 cm in depth for the E1 core and73 cm in depth for the U3 core. The cores were
Ždivided into 5-cm segments some segments near the.bottom of the cores were longer . The core segments
were placed in airtight plastic bags, returned to thelab, and were then frozen until analysis. There wasbrief exposure to air when the samples were trans-ferred between containers. Aliquots of freshly-thawed, wet sample were used for sulfur speciesanalyses. The remaining portions of the samples
Žwere freeze-dried for other analyses total sulfur,total organic carbon, nitrogen, hydrogen, oxygen,
.carbonate, and ash yield . Water contents of thesamples were determined by weight difference be-fore and after drying.
ŽSpecimens of mature cattail leaves at the E1 core. Ž .site and mature sawgrass leaves at the U3 core site
were also collected. A sample of an algal periphytonmat was collected at the U3 site. These specimenswere rinsed with distilled–deionized water, air-dried,
Ž .and ground to a coarse powder y60 mesh inpreparation for sulfide and organic-sulfur analyses;sub-samples were treated with cold 1 N HCl to
Žremove any calcium carbonate before elemental hy-.drogen, nitrogen, and total organic carbon analyses.
Aliquots of selected freshly-thawed core segmentsŽ .were assayed gravimetrically for disulfides DS ,
Ž .acid-volatile-sulfides AVS , sulfate and organic-Ž .sulfur OS after separation of these sulfur species by
an HCl–CrCl –Eschka sequential extraction scheme2Ž .described in detail in Bates et al., 1993 , which is
Ž .similar to methods used by Tuttle et al. 1986 andŽ .Canfield et al. 1986 . Briefly, acid-volatile-sulfides
were extracted from the samples using hot 6 N HClunder a nitrogen atmosphere in a sealed reactionvessel and reprecipitated as silver sulfide. Disulfideswithin the HCl-insoluble residue were then reducedby chromous chloride in hot 6 N HCl under nitrogenand reprecipitated as silver sulfide. The sediment
Žresidue was then filtered. Sulfate in the filtrate in-cluding sulfate derived from both pore-water and
.solid-phases in the sample was precipitated as bar-
ium sulfate. Organic-sulfur in the residual sedimentwas oxidized to sulfate by Eschka’s fusion and thenprecipitated as barium sulfate. The percentage byweight in the sediment of each sulfur fraction wasdetermined gravimetrically from the silver sulfide orbarium sulfate recovered. Total sulfur contents infreeze-dried sub-samples were determined chromato-graphically using a Carlo Erba 11061 elemental ana-lyzer.
All but four of the core segments were analyzedfor sulfur species contents within 2 months of corecollection. Samples from 67.5 and 78.0-cm depths inthe E1 core, and from 7.5 and 68.0-cm depths in theU3 core were analyzed 7 months after core collec-tion. Even though the samples were stored frozen inair-tight plastic bags, there may have been oxidation
Ž .of sulfides predominantly acid-volatile-sulfides tosulfate because of the time-lag between sample col-lection and analysis and because of the brief expo-sure to air during the transfer from the cores to thesample storage bags and then to the reaction vessels.For these reasons, we consider sulfide contents to belower limits and sulfate contents to be upper limits.Oxidation of sulfides should not appreciably affecttheir isotopic ratios; however, sulfate–sulfur isotopicratios will be affected by oxidation of sulfides.
The air-dried samples of cattail and sawgrassleaves and of periphyton were assayed for organic-sulfur content using the Eschka fusion techniqueafter treatment with chromous chloride–HCl solutionto remove any sulfides or sulfate. Sulfide contentsŽ .total of acid-volatile-sulfides and disulfides andisotopic ratios were determined if enough silver sul-fide was recovered for analysis. Sulfate was notfound in these samples.
The 34Sr 32 S ratios of each sulfur fraction recov-ered from the sediment or from the plant specimenswere determined as described in detail in Bates et al.Ž .1993 . The recovered silver sulfide or barium sul-fate for each sulfur fraction was converted to SO by2
combustion. The SO was then purified by vacuum2
line methods. The 34Sr 32 S of SO was determined2
using a Finnigan MAT 251 1 stable isotope massspectrometer, and the results are reported in delta
1 Use of brand names is for descriptive purposes only and doesnot imply endorsement by the US Geological Survey.
( )A.L. Bates et al.rChemical Geology 146 1998 155–170160
Ž 34 .notation d S as parts per thousand deviation fromŽ .Canyon Diablo Triolite CDT reference standard
Ž .Thode et al., 1961 :
34 32Sr SŽ . x34d Ss y1 =1000.34 32Sr SŽ .CDT
Ž .Smaller samples SO derived from AVS were con-2
centrated for analysis on the mass spectrometer usingliquid nitrogen. Duplicate runs of the separationprocedure on samples have indicated that the analyti-cal precision of the d 34 S values is approximately"0.2‰.
The total carbon content in freeze-dried, untreatedsub-samples was determined chromatographically us-ing a Carlo-Erba 1106 1 elemental analyzer. Carbon-ates in these samples were then removed by 1 N HClfollowed by filtration and washing with deionizedwater. Carbon, hydrogen, nitrogen, and oxygen con-tents in the carbonate-free samples were assayedchromatographically using the Carlo-Erba 1106 ele-mental analyzer. Carbonate contents were estimatedstoichiometrically from the difference between totalcarbon and carbon in the carbonate-free sample, withdata presented as weight percent on a dried samplebasis. Non-carbonate, refractory inorganic and bio-
Table 1Sample intervals and analytical data for Everglades WCA 2A sediment E1 and U3 cores
a a a a b b b aCore depth Average depth % % % % % % % %Ž . Ž .cm cm TOC Total sulfur Non-carbonate ash Carbonate Nitrogen TOC Hydrogen Oxygen
E1 Core0–5 2.5 44.8 1.26 3.1 13.3 3.92 51.7 5.56 30.55–10 7.5 44.9 1.36 4.9 12.1 3.85 51.1 5.55 29.8
10–15 12.5 44.3 1.52 2.7 14.8 3.89 52.0 5.34 30.315–20 17.5 47.0 1.21 3.4 11.2 3.61 52.9 5.48 30.320–25 22.5 48.7 1.03 1.2 9.2 3.28 53.7 5.20 33.125–30 27.5 49.5 0.89 4.1 8.0 3.16 53.8 5.22 30.730–35 32.5 45.6 0.56 2.6 16.4 3.32 54.5 5.04 28.435–40 37.5 48.9 0.76 4.2 10.1 2.63 54.3 5.00 30.140–45 42.5 48.6 0.61 0.0 11.8 2.85 55.1 5.21 33.345–50 47.5 47.9 0.70 13.9 2.72 55.6 5.1050–55 52.5 50.2 0.71 9.8 3.22 55.7 5.4855–60 57.5 49.9 0.74 3.7 10.0 3.40 55.5 5.65 28.260–65 62.5 50.8 0.80 0.0 10.8 3.53 56.9 5.96 32.365–70 67.5 49.2 0.83 1.8 6.5 3.53 54.4 5.63 32.470–76 73.0 50.9 0.75 11.8 3.22 57.7 5.5276–80 78.0 52.6 0.69 2.5 7.9 2.59 57.1 5.19 29.8
U3 Core0–5 2.5 42.4 1.57 8.2 12.1 3.32 48.2 5.46 29.65–10 7.5 45.5 1.74 6.0 7.2 3.98 49.0 5.83 32.2
10–15 12.5 45.1 1.40 6.5 6.2 4.05 49.9 6.02 31.115–20 17.5 51.8 1.32 3.6 4.38 53.8 6.3320–25 22.5 50.7 1.34 6.0 5.9 3.92 53.8 5.97 28.125–30 27.5 51.3 1.22 6.5 3.47 54.9 5.4130–35 32.5 51.2 0.92 5.4 8.6 3.12 56.0 5.42 27.035–40 37.5 48.9 0.82 8.7 2.74 53.6 5.0940–45 42.5 49.7 0.71 0.0 13.9 3.04 57.8 5.52 29.845–50 47.5 53.8 0.60 6.8 2.81 57.7 5.3350–55 52.5 52.2 0.65 6.9 7.1 3.09 56.2 5.41 26.455–63 59.0 43.8 0.62 9.6 13.2 3.18 50.7 5.29 25.963–73 68.0 52.1 0.61 0.4 7.8 3.83 56.5 5.93 30.7
a Percent total dry sample weight.b Percent dry weight determined after removal of carbonate.
( )A.L. Bates et al.rChemical Geology 146 1998 155–170 161
genic material, which we will define as ‘non-carbonate ash’ in this report, were calculated inselected carbonate-free samples as the difference be-tween 100% and the sum of percent organic carbon,hydrogen, nitrogen, and oxygen. The non-carbonateash contents were then calculated on a whole samplebasis by applying a correction for weight loss due tothe acid treatment.
Iron contents extractable from the sediment sam-ples by room temperature 1 N HCl after 1 h werequantified by the Ferrozine spectrophotometric assay
Ž .as described by Stookey 1970 . Contents of 6 NHCl-extractable iron were assessed on separatealiquots of sediment using boiling 6 N HCl for 3 h.
Ž .The degree of pyritization DOP , a measure of thecompleteness of reaction between reactive iron andsulfidic sulfur and an indicator of iron limitation of
Ž .pyrite formation high DOP , was calculated as theŽ .ratio of pyritic iron Fe to the sum of HCl-extrac-py
Ž . Žtable iron Fe and Fe Emeis and Morse, 1990;HCl py.Leventhal and Taylor, 1990 . Pyritic iron was calcu-
lated stoichiometrically from the disulfide concentra-tion data assuming that nearly all disulfide is con-
Ž .tained in pyrite FeS .2
3. Results
3.1. Bulk chemistry
Ž .Calcium carbonate contents Table 1 vary be-tween 6.5 and 16.4 wt.% in the E1 core and between3.6 and 13.9 wt.% in the U3 core. The non-carbonate
Ž .ash contents Table 1 vary between 0.0 and 4.9% ofdry weight in the E1 core and between 0.0 and 9.6%in the U3 core. The non-carbonate ash content of theU3 core is higher than in the E1 core throughoutmost of the core intervals. The surface samples fromthe two cores show the most dramatic differences.
Ž .The content of total organic carbon TOC , calcu-lated as a percent of total sample weight, increases
Ž .with depth in both cores Table 1 . Hydrogen to
Table 2Ž . Ž . Ž . Ž . Ž .Disulfide sulfur DS to total organic carbon TOC , carbon to nitrogen CrN , hydrogen to carbon HrC , and oxygen to carbon OrC
ratios in the organic matter for Everglades WCA 2A sediment E1 and U3 cores
Depth of core segment DSrTOC OSrTOC CrN HrC OrCŽ .cm
E1 Core2.5 0.0048 0.019 15.4 1.28 0.517.5 0.0048 0.024 15.5 1.29 0.50
12.5 0.0062 0.025 15.6 1.22 0.5017.5 0.0052 0.017 17.1 1.23 0.4827.5 0.0030 0.012 19.9 1.16 0.4737.5 0.0026 0.011 20.7 1.14 0.4657.5 0.0030 0.012 19.0 1.21 0.4267.5 0.0033 0.010 18.9 1.23 0.4878.0 0.0023 0.009 25.7 1.08 0.43Cattail leaves n.d. n.d. 55.9 1.56 n.d.
U3 Core2.5 0.011 0.019 16.9 1.35 0.527.5 0.022 0.022 14.4 1.42 0.53
12.5 0.008 0.016 13.1 1.40 0.5022.5 0.008 0.015 16.0 1.32 0.4232.5 0.004 0.012 20.9 1.15 0.4052.5 0.002 0.011 21.2 1.15 0.3868.0 0.002 0.009 17.2 1.25 0.44Sawgrass leaves n.d. n.d. 68.6 1.40 n.d.Periphyton mat n.d. n.d. 12.1 1.64 n.d.
n.d.sNo data.
( )A.L. Bates et al.rChemical Geology 146 1998 155–170162
Ž . Ž .carbon HrC and oxygen to carbon OrC ratios inŽ .the organic matter Table 2 decrease with increasing
Ž .core depth. Conversely, carbon to nitrogen CrNŽ .ratios in the organic matter Table 2 increases with
depth. Cattail leaves, sawgrass leaves, and periphy-ton HrC ratios are high compared with the degradedorganic matter in the sediment. When compared withthe organic matter in the sediment, the periphytonhas a low CrN ratio, while the cattail and sawgrassleaves show high ratios.
3.2. Iron content of the sediment
Iron extractable from the sediment with 1 N HClŽ .is between 0.04 and 0.10 wt.% Table 3 for samples
Žfrom the upper parts of the cores above 35-cm.depth , and as high as 0.27% near the bottom of the
cores. Iron extractable with hot 6 N HCl is betweenŽ .0.09 and 0.13% Table 3 for samples from upper
parts of the cores and as high as 0.23% betweenŽ .50–55 cm in Core 2. The DOP ratios Table 3 ,
calculated using either 1 N HCl- or 6 N HCl-extrac-table iron, are higher in the upper parts of the coresand decrease with depth. The DOP ratios that werecalculated using hot 6 N HCl-extractable iron arelower than the DOP ratios that were calculated usingcold 1 N HCl by from about 12 to 23%.
3.3. Sulfur contents
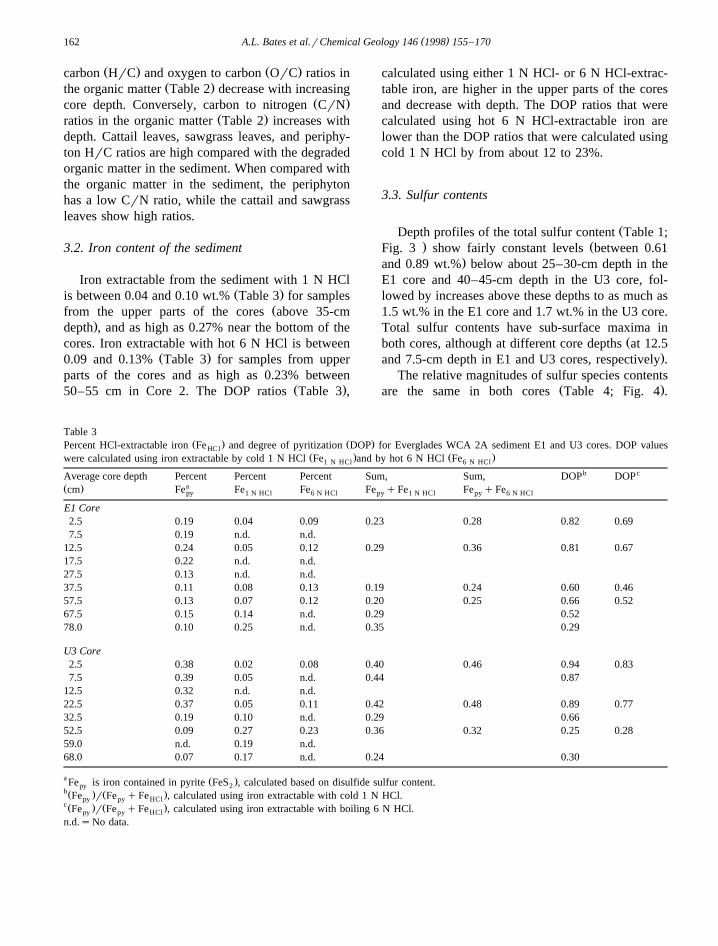
ŽDepth profiles of the total sulfur content Table 1;. ŽFig. 3 show fairly constant levels between 0.61
.and 0.89 wt.% below about 25–30-cm depth in theE1 core and 40–45-cm depth in the U3 core, fol-lowed by increases above these depths to as much as1.5 wt.% in the E1 core and 1.7 wt.% in the U3 core.Total sulfur contents have sub-surface maxima in
Žboth cores, although at different core depths at 12.5.and 7.5-cm depth in E1 and U3 cores, respectively .
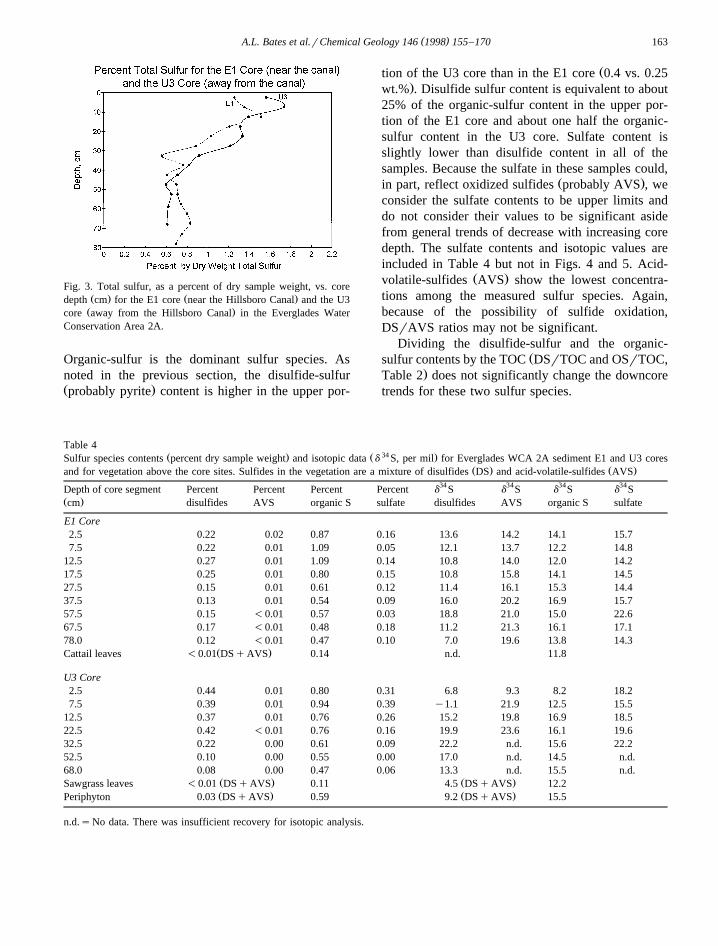
The relative magnitudes of sulfur species contentsŽ .are the same in both cores Table 4; Fig. 4 .
Table 3Ž . Ž .Percent HCl-extractable iron Fe and degree of pyritization DOP for Everglades WCA 2A sediment E1 and U3 cores. DOP valuesHCl
Ž . Ž .were calculated using iron extractable by cold 1 N HCl Fe and by hot 6 N HCl Fe1 N HCl 6 N HCl
b cAverage core depth Percent Percent Percent Sum, Sum, DOP DOPaŽ .cm Fe Fe Fe Fe qFe Fe qFepy 1 N HCl 6 N HCl py 1 N HCl py 6 N HCl
E1 Core2.5 0.19 0.04 0.09 0.23 0.28 0.82 0.697.5 0.19 n.d. n.d.
12.5 0.24 0.05 0.12 0.29 0.36 0.81 0.6717.5 0.22 n.d. n.d.27.5 0.13 n.d. n.d.37.5 0.11 0.08 0.13 0.19 0.24 0.60 0.4657.5 0.13 0.07 0.12 0.20 0.25 0.66 0.5267.5 0.15 0.14 n.d. 0.29 0.5278.0 0.10 0.25 n.d. 0.35 0.29
U3 Core2.5 0.38 0.02 0.08 0.40 0.46 0.94 0.837.5 0.39 0.05 n.d. 0.44 0.87
12.5 0.32 n.d. n.d.22.5 0.37 0.05 0.11 0.42 0.48 0.89 0.7732.5 0.19 0.10 n.d. 0.29 0.6652.5 0.09 0.27 0.23 0.36 0.32 0.25 0.2859.0 n.d. 0.19 n.d.68.0 0.07 0.17 n.d. 0.24 0.30
a Ž .Fe is iron contained in pyrite FeS , calculated based on disulfide sulfur content.py 2bŽ . Ž .Fe r Fe qFe , calculated using iron extractable with cold 1 N HCl.py py HClcŽ . Ž .Fe r Fe qFe , calculated using iron extractable with boiling 6 N HCl.py py HCl
n.d.sNo data.
( )A.L. Bates et al.rChemical Geology 146 1998 155–170 163
Fig. 3. Total sulfur, as a percent of dry sample weight, vs. coreŽ . Ž .depth cm for the E1 core near the Hillsboro Canal and the U3Ž .core away from the Hillsboro Canal in the Everglades Water
Conservation Area 2A.
Organic-sulfur is the dominant sulfur species. Asnoted in the previous section, the disulfide-sulfurŽ .probably pyrite content is higher in the upper por-
Žtion of the U3 core than in the E1 core 0.4 vs. 0.25.wt.% . Disulfide sulfur content is equivalent to about
25% of the organic-sulfur content in the upper por-tion of the E1 core and about one half the organic-sulfur content in the U3 core. Sulfate content isslightly lower than disulfide content in all of thesamples. Because the sulfate in these samples could,
Ž .in part, reflect oxidized sulfides probably AVS , weconsider the sulfate contents to be upper limits anddo not consider their values to be significant asidefrom general trends of decrease with increasing coredepth. The sulfate contents and isotopic values areincluded in Table 4 but not in Figs. 4 and 5. Acid-
Ž .volatile-sulfides AVS show the lowest concentra-tions among the measured sulfur species. Again,because of the possibility of sulfide oxidation,DSrAVS ratios may not be significant.
Dividing the disulfide-sulfur and the organic-Žsulfur contents by the TOC DSrTOC and OSrTOC,
.Table 2 does not significantly change the downcoretrends for these two sulfur species.
Table 4Ž . Ž 34 .Sulfur species contents percent dry sample weight and isotopic data d S, per mil for Everglades WCA 2A sediment E1 and U3 cores
Ž . Ž .and for vegetation above the core sites. Sulfides in the vegetation are a mixture of disulfides DS and acid-volatile-sulfides AVS34 34 34 34Depth of core segment Percent Percent Percent Percent d S d S d S d S
Ž .cm disulfides AVS organic S sulfate disulfides AVS organic S sulfate
E1 Core2.5 0.22 0.02 0.87 0.16 13.6 14.2 14.1 15.77.5 0.22 0.01 1.09 0.05 12.1 13.7 12.2 14.8
12.5 0.27 0.01 1.09 0.14 10.8 14.0 12.0 14.217.5 0.25 0.01 0.80 0.15 10.8 15.8 14.1 14.527.5 0.15 0.01 0.61 0.12 11.4 16.1 15.3 14.437.5 0.13 0.01 0.54 0.09 16.0 20.2 16.9 15.757.5 0.15 -0.01 0.57 0.03 18.8 21.0 15.0 22.667.5 0.17 -0.01 0.48 0.18 11.2 21.3 16.1 17.178.0 0.12 -0.01 0.47 0.10 7.0 19.6 13.8 14.3
Ž .Cattail leaves -0.01 DSqAVS 0.14 n.d. 11.8
U3 Core2.5 0.44 0.01 0.80 0.31 6.8 9.3 8.2 18.27.5 0.39 0.01 0.94 0.39 y1.1 21.9 12.5 15.5
12.5 0.37 0.01 0.76 0.26 15.2 19.8 16.9 18.522.5 0.42 -0.01 0.76 0.16 19.9 23.6 16.1 19.632.5 0.22 0.00 0.61 0.09 22.2 n.d. 15.6 22.252.5 0.10 0.00 0.55 0.00 17.0 n.d. 14.5 n.d.68.0 0.08 0.00 0.47 0.06 13.3 n.d. 15.5 n.d.
Ž . Ž .Sawgrass leaves -0.01 DSqAVS 0.11 4.5 DSqAVS 12.2Ž . Ž .Periphyton 0.03 DSqAVS 0.59 9.2 DSqAVS 15.5
n.d.sNo data. There was insufficient recovery for isotopic analysis.
( )A.L. Bates et al.rChemical Geology 146 1998 155–170164
Ž . Ž . Ž . Ž . ŽFig. 4. Percent disulfide sulfur DS , acid-volatile-sulfur AVS , and organic-sulfur OS vs. core depth cm for the E1 core near the. Ž .Hillsboro Canal and the U3 core away from the Hillsboro Canal in the Everglades Water Conservation Area 2A.
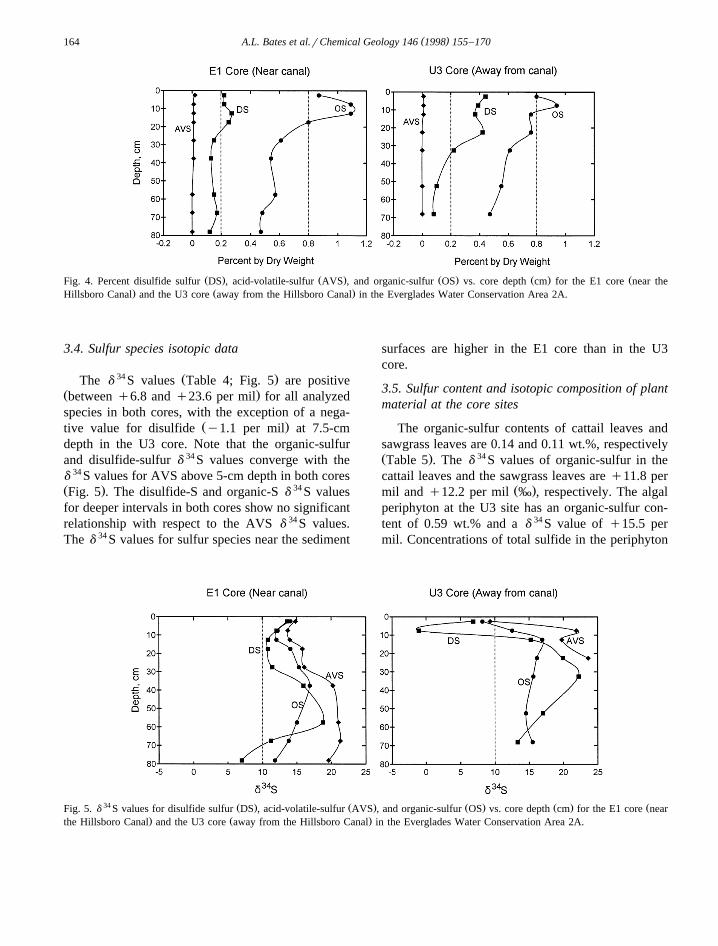
3.4. Sulfur species isotopic data
34 Ž .The d S values Table 4; Fig. 5 are positiveŽ .between q6.8 and q23.6 per mil for all analyzedspecies in both cores, with the exception of a nega-
Ž .tive value for disulfide y1.1 per mil at 7.5-cmdepth in the U3 core. Note that the organic-sulfurand disulfide-sulfur d 34 S values converge with thed 34 S values for AVS above 5-cm depth in both coresŽ . 34Fig. 5 . The disulfide-S and organic-S d S valuesfor deeper intervals in both cores show no significantrelationship with respect to the AVS d 34 S values.The d 34 S values for sulfur species near the sediment
surfaces are higher in the E1 core than in the U3core.
3.5. Sulfur content and isotopic composition of plantmaterial at the core sites
The organic-sulfur contents of cattail leaves andsawgrass leaves are 0.14 and 0.11 wt.%, respectivelyŽ . 34Table 5 . The d S values of organic-sulfur in thecattail leaves and the sawgrass leaves are q11.8 per
Ž .mil and q12.2 per mil ‰ , respectively. The algalperiphyton at the U3 site has an organic-sulfur con-tent of 0.59 wt.% and a d 34 S value of q15.5 permil. Concentrations of total sulfide in the periphyton
34 Ž . Ž . Ž . Ž . ŽFig. 5. d S values for disulfide sulfur DS , acid-volatile-sulfur AVS , and organic-sulfur OS vs. core depth cm for the E1 core near. Ž .the Hillsboro Canal and the U3 core away from the Hillsboro Canal in the Everglades Water Conservation Area 2A.
( )A.L. Bates et al.rChemical Geology 146 1998 155–170 165
Table 5Ž 34 .Sulfide and organic-sulfur content and isotopic data d S, per mil for sawgrass leaves, cattail leaves, and periphyton at the Everglades
WCA 2A E1 and U3 sampling sites34 34Sample I.D. Percent organic sulfur d S organic sulfur Percent sulfides d S sulfides
Cattail leaves at the E1 site 0.14 11.8 -0.01 n.d.Sawgrass leaves at the U3 site 0.11 12.2 -0.01 4.5Periphyton mat at the U3 site 0.59 15.5 0.03 9.2
Ž .0.03 wt.%; Table 4 are higher than those within theŽ .leaf material -0.01 wt.% .
4. Discussion
4.1. Bulk chemistry
No significant trends in calcium carbonate contentŽ .with depth core are observed in either core Table 1 .
The ash contents also do not appear to vary in anysignificant way with depth in either core, exceptpossibly for a slight maximum between 50 to 63-cm
Ž .depth in the U3 core Table 1 . Furthermore, theredoes not appear to be a strong correlation between
Žnon-carbonate ash content and iron content Tables 1.and 3 , which indicates that iron enrichments at
depth in the cores are more likely derived fromgroundwater than from minerals associated with thepeat.
Decreasing trends in the HrC and OrC ratios inŽ .the organic matter Table 2 indicate increasing
degradation of the hydrogen and oxygen-rich organicŽ .matter i.e., carbohydrates with depth in the sedi-
ment cores andror a progressive temporal shift inthe organic matter source. The increasing trend in
Ž .carbon to nitrogen CrN ratios in the organic matterwith core depths is probably due to the diageneticloss of protein and to denitrification processes. TheHrC ratios are quite low at 2.5-cm depth compared
Ž .with undegraded plant material Table 2 . This resultsuggests that the organic material near the top of theE1 core is already highly degraded.
4.2. Iron content of the sediment
The DSrTOC weight ratios in the two coresŽ .Table 2 are well below the typical marine value of
Ž .about 0.36 Berner and Raiswell, 1984 , indicating
that sulfate or reactive iron, rather than biodegrad-able organic matter, limited sedimentary pyrite for-mation. This is consistent with deposition in a low-sulfate, freshwater, carbonate and organic matterdominated environment with an absence of detritalinputs. Clay input, a source of iron, is minimal in the
Ž .Everglades Altschuler et al., 1983 because of thearea’s remoteness from sources of silicates and be-cause of filtering by the abundant vegetation. Dis-solved iron contents in the surface waters in the area
Žrange from ;0.4 mM to ;5.5 mM Altschuler et.al., 1983; Waller and Earle, 1975 , while the dis-
solved iron contents of the Biscayne Aquifer rangeŽ .from -0.2 mM to 35 mM Sonntag, 1987 .
High organic-sulfur content relative to concentra-tions of mineralized sulfur suggests iron limitation of
Ž .sulfide mineral deposition Bates et al., 1993 . AŽ .high ‘degree of pyritization’ DOP can be indicative
of iron limitation of iron sulfide formation in sedi-Ž .ments Berner, 1970; Raiswell et al., 1988 . As noted
previously, the DOP is defined as the ratio of pyriticŽ . Ž .iron Fe to the sum of HCl-extractable iron Fepy HCl
and Fe . The DOP ratios in the surface sedimentspy
are 0.82 in the E1 core and 0.94 in the U3 coreŽ .Table 3 , when iron is extracted using cold 1 NHCl. DOP ratios in this range are strongly suggestiveof iron limitation. By contrast, when iron is extractedwith hot 6 N HCl, the DOP ratios in the surfacesediments, although still quite high, are 0.69 in theE1 core and 0.83 in the U3 core. Evidently, there is apopulation of iron in the sediment that is not ex-tracted with cold 1 N HCl and that is not readilyreactive with respect to HSy. Cold 1 N HCl has beenshown to dissolve ferrihydrite and lepidocrocite, butpossibly not goethite and haematite, which may re-
Žquire extraction with stronger, hot acid Raiswell et.al., 1994 . The iron phase most reactive with dis-
solved sulfide is ferrihydrite, with a reaction half-lifeŽwith sulfide on the order of hours Canfield et al.,
( )A.L. Bates et al.rChemical Geology 146 1998 155–170166
.1992 . Lepidocrocite, goethite, and haematite havereaction half-lives with respect to sulfide on theorder of days or weeks, while magnetite and Fe-sili-cates have reaction half-lives that are no less than
Ž .100 years Canfield et al., 1992 . If sulfide mineraldeposition in our samples is iron limited, it would bea limitation based on the availability of highly reac-tive iron phases during the very earliest stages ofdiagenesis as suggested by high DOP values for thesurficial sediment layers. If this is the case, it wouldimply that most sulfide mineralization occurs at avery early stage of diagenesis. Excess sulfide wouldbe incorporated into organic matter or lost from thesediment by diffusion to the overlying water column.An additional factor limiting the availability of reac-tive iron would be the accumulation rate of organicmatter if the effective content of iron in the peat isbeing diluted by the OM.
4.3. Sulfur contents
The increases in total sulfur above 30-cm depth inthe E1 core and 45-cm depth in the U3 core suggestthat sulfur delivery to the wetland has increasedandror that the sediments are retaining more sulfurabove these depths, which may be a result of theestablishment of the Water Conservation Area. Wa-ter impoundment in WCA 2A could be reducing theperiods of natural drying and exposure of the sedi-ments to air during the dry season, resulting in lessfrequent episodes of oxidation of reduced sulfur andits subsequent mobilization and loss from the sedi-ment as sulfate.
Because the higher organic-sulfur content of theE1 core in comparison to the U3 core is not accom-
Žpanied by correspondingly higher TOC contents Ta-.bles 1 and 2 , the high organic-sulfur content in the
E1 core is probably not linked to the TOC content.Also, the organic-sulfur content of the cattail leavesis not significantly higher than in the sawgrass leavesŽ .Table 4 ; thus, the high organic-sulfur content of thesediment at E1 is not a result of differences in thesulfur content in the vegetation at the two sites. Thehigher ratios of organic-sulfur to disulfide-sulfur inthe near surface sediments of the E1 core in compar-
Ž .ison to the U3 core Table 4; Fig. 4 could be theresult of differing amounts of reactive iron at the twosites, with more pyrite precipitation at U3 where the
Ž .sum Fe qFe is greater in the upper sediments.py HCl
Rates of sulfate reduction also could affect theOSrDS ratio. Rates of sulfate reduction should notbe a function of sulfate concentrations unless those
Žconcentrations are very low Bondreau and Westrich,.1984 ; however, differences in the accumulation rates
Ž .or the reactivities of the organic matter carbon atthe two sites can affect sulfate reduction rates. Ahigh rate of sulfide production at the E1 core site, inthe presence of a limited amount of highly reactiveiron, could favor the incorporation of sulfide intoorganic matter rather than disulfides. If the rate ofsulfate reduction exceeds the rates of incorporationinto either organic matter or sulfide minerals, then alarge proportion of H S may be lost through diffu-2
sion to the water column, and the percentage of thetotal sulfide that becomes fixed may be relatively
Ž .low Jørgensen, 1982 . The amounts of total sulfurand organic-sulfur at the two sites may not differmuch even though the total amount of sulfide pro-duced at E1 may be greater. Higher d 34 S values inthe near-surface sediment of the E1 core in compari-son to the U3 core values are consistent with a
Žhigher rate of sulfate reduction at the E1 site Table.4; Fig. 5 .
The increase in sulfur concentration in the upper30 cm of the E1 core is similar to the increase inphosphorus found in cores from near the canal by
Ž .previous workers Craft and Richardson, 1993 . Thissuggests that the increase in sulfur could be relatedto increases in nutrients. However, the total sulfurcontent in the U3 core does not appear to correlatewith phosphorus, which does not change signifi-cantly with depth in cores collected from sites away
Ž .from the canal Craft and Richardson, 1993 .Several explanations could account for the differ-
ences between the sulfur and phosphorus distribu-tions. The sources andror reactivity of sulfur andphosphorus may be different. Remobilization of fixedsulfur will affect its distribution in comparison withphosphorus, which tends to remain fixed in thesediment because of precipitation with calcium ionsŽ .DeBusk et al., 1994; Otsuki and Wetzel, 1972 .Little phosphorus ever reaches the U3 site because itis nearly completely taken up and retained by thesediments near the canal site, whereas sulfur is lesseffectively fixed and retained by these sediments.There are many complicating factors which influence
( )A.L. Bates et al.rChemical Geology 146 1998 155–170 167
the delivery, fixation, and retention of sulfur in thesediment at the two core sites. These factors mayinclude the type of vegetation growing at each siteŽ .cattail at E1 vs. sawgrass at U3 and its rate ofaccumulation and decay, both of which can affectrates of sulfate diffusion and sulfate reduction andthe capacity of OM to fix sulfur.
4.4. Sulfur species isotopic data
The most salient feature of the sulfur isotopic data34 Ž .is positive d S values Table 4; Fig. 5 for the four
Žsulfur species at all but one of the core horizons 7.5.cm, U3 core , which is consistent with a restricted
supply of sulfate for reduction to sulfide. By con-trast, sulfides formed from an unrestricted supply ofsulfate typically have highly negative d 34 S values.The d 34 S values for OS, AVS, and DS are closest to
Ž .each other at the sediment surfaces 0–5-cm depth .The divergent trends of the organic-sulfur and disul-fide-sulfur d 34 S values with respect to the AVS
34 Ž .d S values with depth Fig. 5 suggest that mostdisulfide mineral formation and uptake of porewatersulfides into organic matter take place near the sedi-ment surface. The OS and the DS isotopic composi-tions vary downcore either because of temporal dif-ferences in the isotopic composition of the initial
Žsulfate changes in the sulfate entering the marsh orchanges in the amount of isotopically light sulfate
.generated in situ by sulfide oxidation or because ofchanging diagenetic conditions affecting isotopic
Žfractionation availability of sulfate; rates of sulfate.reduction at the time of deposition. Highly positive
d 34 S values, up to q23.6 per mil for the AVS foundat depth, indicate these acid-volatile-sulfides includesulfide formed from reduction of residual porewatersulfate enriched in 34S. AVS found at depth withhighly positive d 34 S values may have formed byisotopic exchange between early-formed FeS andlate-formed, isotopically heavy porewater sulfide, orby late formation of FeS from late-formed porewatersulfide.
A contrasting feature of the two cores is that thed 34 S values near the sediment surfaces are quitedifferent. The d 34 S values for reduced sulfur speciesŽ .AVS, DS, and OS are more positive in the top 10.0cm of the E1 core than in the corresponding top 5.0
Žcm of the U3 core recall that sedimentation rates are
. 34higher at the E1 core site . The more positive d Svalues for reduced sulfur species near the top of theE1 core may reflect higher rates of sulfate reduction.This may be the result of a higher deposition rate of
Ž .carbon OM at the E1 site. The biodegradability ofŽ .the organic matter cattails vs. sawgrass could be a
factor influencing rates of sulfate reduction; saw-Ž .grass has a well-developed leaf cuticle Davis, 1994
which could protect the sawgrass leaf material fromrapid microbial attack. Lower HrC and OrC ratiosin the organic matter in the E1 core compared to the
Ž .U3 core Table 2 are consistent with a higher rate ofdegradation and loss of carbohydrates in the organicmatter in the E1 core. The high accumulation rates ofOM at the E1 site may also lower the effectivesulfate concentrations in the sediment by dilutionand by slowing the diffusion of sulfate into thesediment from the overlying surface water. In otherwords, the balance of sulfate consumption and sul-fate renewal has been shifted towards greater 34S
Ženrichment in the sulfate reduction products Zaback.et al., 1993 .
Alternatively, the differences between d 34 S val-ues near and far from the Hillsboro Canal could alsobe caused by differences in the d 34 S values of thesource sulfate in the surface water supply in WCA2A. Compared to surface water near the HillsboroCanal, water far from the canal tends to have highersulfate concentrations and lighter sulfate d 34 S values
Ž .during periods of low rainfall unpublished data ,probably because there is more oxidation of sulfidesto sulfate in dryer areas away from the canal. How-ever, sulfate concentration and d 34 S data from sur-face water in WCA 2A collected during periods ofnormal to heavy rainfall are quite variable and do notconsistently show a pattern related to position in theWCA.
The anomalously low d 34 S value for disulfideŽ .sulfur y1.1 per mil at 7.5-cm depth in the U3 core
indicates a large increase in available sulfate withouta corresponding increase in organic productivity atthe time of deposition, possibly because of impound-ment of WCA 2A. Alternatively, the low DS d 34 Svalue could reflect the reduction of light sulfategenerated via sulfide oxidation. Note that the disul-fide d 34 S values in the E1 core also show a subsur-face minimum; however, increased organic produc-tivity at the E1 site may have raised the reduction
( )A.L. Bates et al.rChemical Geology 146 1998 155–170168
rate of sulfate resulting in a less negative shift ind 34 S values. The total sulfur and organic-sulfur con-tent maxima correspond to the d 34 S value minima.
4.5. Sulfur content and isotopic composition of plantmaterial at the core sites
The results of sulfur analyses of the plant materialŽ .overlying the core sites Table 5 provide clues
concerning the derivation of the organic-sulfur in thesediment. Organic-sulfur in the benthic periphytonmat is enriched in d 34 S relative to organic-sulfur insawgrass and cattail, suggesting that bacterial sulfatereduction is occurring in the periphyton mat and thatresidual sulfate enriched in 34S is then assimilatedinto the organic matter. The higher amounts of sul-
Žfide found associated with the periphyton 0.03%;.Table 5 in comparison with the sawgrass and cattailŽ .leaves -0.01% likewise suggest that sulfate reduc-
tion is occurring in the living periphyton mat. Peri-phyton is known to be chemically active; it has beenshown to facilitate the precipitation of calcium car-bonate on sawgrass leaves in the Florida EvergladesŽ .Gleason, 1972 , and sulfate reduction commonly
Žoccurs in cyanobacterial mats Canfield and Des.Marais, 1993 .
The organic-sulfur content of the surface sedimentat the U3 site is 0.80% with a d 34 S value of 8.2 permil, which is at least 4 per mil lower than in the
Ž .living plants Table 4 . If we assume that the organiccontent of the peat at the U3 site is derived mostlyfrom sawgrass and periphyton, then it appears thatmost of the organic-sulfur at the sediment surface isderived diagenetically from an early-formed, isotopi-cally light sulfide species. A more extensive anddetailed analysis of living plant material and surfacesediment at these sites will be necessary to confirmthese preliminary observations.
5. Conclusions
Total sulfur contents increase above 25–30-cmdepth in the E1 core near the Hillsboro Canal and40–45-cm depth in the U3 core away from the canal,suggesting that more sulfur has entered the sedi-ments recently. More sulfur may also have beenretained in the peat in recent times as a result of the
recently implemented practice of water impound-ment in WCA 2A, which could prevent the dryingand exposure of the sediments to air, thus reducingoxidation and mobilization of reduced sulfur fixed inthe sediment. Depth profiles of total sulfur in thesediment appear to correlate with total phosphorusŽ .Craft and Richardson, 1993 in the E1 core near thecanal but not in the U3 core away from the canal,where phosphorus does not change much with coredepth. This difference is probably due to the morerapid uptake and greater retention of phosphorus inthe peat near the canal. The increase in phosphorusŽ .i.e., nutrient loading near the canal has caused achange in the type of vegetation, with cattail nowdominant over sawgrass, and an increase in theamount and rate of turnover of organic matter at theE1 site. Changes in the abundance and reactivity oforganic matter have affected sulfur cycling.
Positive d 34 S values for sulfur species in bothcores indicate a relatively restricted sulfate reservoir,consistent with freshwater conditions. One low d 34 Svalue for disulfides at 2.5-cm depth in the U3 coreindicates an increase in sulfate availability at thetime of deposition, or, possibly, changes in the d 34 Sof the initial sulfate reservoir. The major differencesbetween the E1 and U3 sites are in the d 34 S valuesin the near-surface sediments, with d 34 S values nearthe sediment surface more positive at the E1 site.These differences may be linked to the increase innutrient loading at the E1 site. The more positived 34 S values may indicate higher reactivity of organicmatter and thus, higher rates of sulfate reduction at
Ž .the E1 site near the canal since impoundment ofWCA 2A.
Increasing d 34 S values for AVS with increasingcore depth suggest ongoing reduction of a limitedporewater sulfate reservoir after deposition. Diver-gence of the disulfide and organic-sulfur d 34 S valuesfrom the d 34 S values for AVS with depth suggeststhat most incorporation of AVS into disulfide miner-als or into organic matter occurs in the near-surfacesediments. Comparison of the organic-sulfur contentand d 34 S values of the surface sediment and ofsawgrass and algal periphyton at the U3 site supportsthe hypothesis that most of the organic-sulfur isdiagenetically derived at a very early stage fromsulfide species depleted in 34S. Downcore variationsin the OS and DS d 34 S values at both sites could
( )A.L. Bates et al.rChemical Geology 146 1998 155–170 169
have been caused by historical changes in the iso-topic composition or abundance of the source sulfate,or by changing diagenetic conditions, includingchanges in nutrient loading, affecting rates of sulfatereduction.
Low ratios of disulfide sulfur to total organicŽ .carbon DSrTOC are consistent with freshwater
conditions when sulfide deposition is limited by lowsulfate or low reactive iron availability. High concen-trations of organic-sulfur relative to disulfide-sulfurthroughout the cores suggest that the system is ironlimited. The HCl-extractable iron contents and the
Ž .degree of pyritization DOP in the upper parts of thecores suggest that the availability of highly reactiveiron during the very early stages of diagenesis ispresently limiting the amount of disulfide mineralsformed in these sediments.
Acknowledgements
We thank the South Florida Water ManagementDistrict, especially Fred Sklar and Pete Rawlik, forassistance with sample collection. We also thank
ŽLarry P. Gough US Geological Survey, Denver,.CO , Rama K. Kotra, Harry T. Lerch III, William H.
ŽOrem, and Vicki C. Weintraub US Geological Sur-.vey, Reston, VA for help with sample collection
and preparation for analysis. Thanks also to TimŽ .Lyons University of Missouri for his helpful re-
view of this manuscript. This study was funded bythe US Geological Survey National Mapping Pro-gram and by the US Geological Survey CriticalEcosystems Program.
References
Altschuler, Z.S., Schnepfe, M.M., Silber, C.C., Simon, F.O.,1983. Sulfur diagenesis in Everglades peat and origin of pyritein coal. Science 221, 221–227.
Anderson, T.F., Pratt, L.M., 1995. Isotopic evidence for the originof organic-sulfur and elemental sulfur in marine sediments. In:
Ž .Vairavamurthy, M.A., Schoonen, M.A.A. Eds. , GeochemicalTransformation of Sedimentary Sulfur. ACS Symposium Se-ries 612, pp. 378–396.
Bates, A.L., Spiker, E.C., Orem, W.H., Burnett, W.C., 1993.Speciation and isotopic composition of sulfur in sedimentsfrom Jellyfish Lake, Palau. Chem. Geol. 106, 63–76.
Berner, R.A., 1970. Sedimentary pyrite formation. Am. J. Sci.268, 1–23.
Berner, R.A., 1980. Early Diagenesis, A Theoretical Approach.Princeton Univ. Press, Princeton, NJ, 241 pp.
Berner, R.A., 1984. Sedimentary pyrite formation: an update.Geochim. Cosmochim. Acta 48, 605–615.
Berner, R.A., Raiswell, R., 1984. CrS method for distinguishingfreshwater from marine sedimentary rock. Geology 12, 365–368.
Boudreau, B.P., Westrich, 1984. The dependence of bacterialsulfate reduction on sulfate concentration in marine sediments.Geochim. Cosmochim. Acta 48, 2503–2516.
Canfield, D.E., 1991. Sulfate reduction in deep-sea sediments.Am. J. Sci. 291, 177–189.
Canfield, D.E., Des Marais, D.J., 1993. Biogeochemical cycles ofcarbon, sulfur and free oxygen in a microbial mat. Geochim.Cosmochim. Acta 57, 3971–3984.
Canfield, D.E., Raiswell, R., Westrick, J.T., Reaves, C.M., Berner,R.A., 1986. The use of chromium reduction in the analysis ofreduced inorganic-sulfur in sediments and shales. Chem. Geol.54, 149–155.
Canfield, D.E., Raiswell, R., Bottrell, S., 1992. The reactivity ofsedimentary iron minerals toward sulfide. Am. J. Sci. 292,659–683.
Craft, C.B., Richardson, C.J., 1993. Peat accretion and phosphorusaccumulation along a eutrophication gradient in the northernEverglades. Biogeochemistry 22, 133–156.
Davis, S.M., 1994. Phosphorus inputs and vegetation sensitivity inŽ .the Everglades. In: Davis, S.M., Ogden, J.C. Eds. , Ever-
glades—The Ecosystem and Its Restoration. St. Lucie Press,Delray Beach, FL, pp. 357–378.
DeBusk, W.F., Reddy, K.R., Roch, M.S., Want, Y., 1994. Spatialdistribution of soil nutrients in a Northern Everglades Marsh:water conservation area 2A. Soil Sci. Soc. Am. J. 58, 543–552.
Emeis, K.C., Morse, J.W., 1990. Organic carbon, reduced sulfur,and iron relationships in sediments of the Peru Margin, ODPsites 680 and 688. Proc. Ocean Drilling Program Sci. Rep.112B, 441–454.
Fish, J.E., 1988. Hydrology, aquifer characteristics, and ground-water flow of the surficial aquifer system, Broward County,Florida. US Geological Survey Water-Resources Investiga-tions Report 87-4034, Tallahassee, FL, p. 92.
Fry, B., Ruf, W., Gest, H., Hayes, J.M., 1988. Sulfur isotopeeffects associated with oxidation of sulfide by O in aqueous2
solution. Chem. Geol. 73, 205–210.Gleason, J.P., 1972. The Origin, Sedimentation and Stratigraphy
of a Calcitic Mud Located in the Southern Fresh-water Ever-glades. PhD Thesis, The Pennsylvania State University, De-partment of Geosciences, 223 pp.
Gleason, P.J., Stone, P., 1994. Age, origin, and landscape evolu-tion of the Everglades peatland. In: Davis, S.M., Ogden, J.C.Ž .Eds. , Everglades—The Ecosystem and Its Restoration. St.Lucie Press, Delray Beach, FL, pp. 149–197.
Goldhaber, M.B., Kaplan, I.R., 1974. The sulfur cycle. In: Gold-Ž .berg, E.D. Ed. , The Sea, Vol. 5. Wiley, Chichester, pp.
569–655.Jørgensen, B.B., 1982. Mineralization of organic matter in the sea
bed—the role of sulphate reduction. Nature 296, 643–645.
( )A.L. Bates et al.rChemical Geology 146 1998 155–170170
Jørgensen, B.B., 1990. A thiosulfate shunt in the sulfur cycle ofmarine sediments. Science 249, 152–154.
Kaplan, I.R., Rittenberg, S.C., 1962. The microbiological fraction-Ž .ation of fur isotopes. In: Jensen, M.L. Ed. , Biogeochemistry
of Sulfur Isotopes. Yale Univ. Press, pp. 89–93.Kaplan, I.R., Rittenberg, S.C., 1964. Microbiological fractionation
of sulfur isotopes. J. Microbiol. 34, 195–212.Koch, M.S., Reddy, K.R., 1992. Distribution of soil and plant
nutrients along a trophic gradient in the Florida Everglades.Soil Sci. Soc. Am. J. 56, 1492–1499.
Leventhal, J., Taylor, C., 1990. Comparison of methods to deter-mine degree of pyritization. Geochim. Cosmochim. Acta 54,2621–2625.
Lodge, T.E., 1994. The Everglades Handbook—Understandingthe Ecosystem. St. Lucie Press, pp. 167–192.
Mossmann, J.-R., Aplin, A.C., Curtis, C.D., Coleman, M.L.,1991. Geochemistry of inorganic and organic sulphur in or-ganic-rich sediments from the Peru Margin. Geochim. Cos-mochim. Acta 55, 3581–3595.
Nakai, N., Jensen, M.L., 1964. The kinetic isotope effect in thebacterial reduction and oxidation of sulfur. Geochim. Cos-mochim. Acta 28, 1893–1912.
Otsuki, A., Wetzel, R.G., 1972. Coprecipitation of phosphate withcarbonates in a marl lake. Limnol. Oceanogr. 17, 763–767.
Raiswell, R., Buckley, F., Berner, R.A., Anderson, T.F., 1988.Degree of pyritization of iron as a paleoenvironmental indica-tor of bottom-water oxygenation. J. Sed. Pet. 58, 812–819.
Raiswell, R., Canfield, D.E., Berner, R.A., 1994. A comparison ofiron extraction methods for the determination of degree ofpyritization and the recognition of iron-limited pyrite forma-tion. Chem. Geol. 111, 101–110.
Sinninghe Damste, J.S., Rijpstra, W.I., Dock-van Dalen, A.C., deLeeuw, J.W., Schenck, P.A., 1989. Quenching of labile func-tionalised lipids by inorganic sulphur species: evidence for theformation of sedimentary organic sulphur compounds at the
early stages of diagenesis. Geochim. Cosmochim. Acta 53,1343–1355.
Sonntag, W.H., 1987. Chemical characteristics of water in thesurficial aquifer system, Dade County, Florida. US GeologicalSurvey Water Resources Investigations Report 87-4080, Talla-hassee, FL, 42 pp.
Stookey, L.L., 1970. Ferrozine—a new spectrophotometric reagentfor iron. Anal. Chem. 42, 779–781.
Sweeney, R.E., 1972. Pyritization during diagenesis of marinesediments. PhD Dissertation, University of California.
Thode, H.G., Monster, J., Dunford, H.B., 1961. Sulfur isotopegeochemistry. Geochim. Cosmochim. Acta 25, 159–174.
Tuttle, M.L., Goldhaber, M.B., Williamson, D.L., 1986. An ana-lytical scheme for determining forms of sulphur in oil shales
Ž .and associated rocks. Talanta 33 12 , 956–961.Tuttle, M.L., Rice, A.C., Goldhaber, M.B., 1990. Geochemistry of
organic and inorganic-sulfur in ancient and modern lacustrineenvironments: case studies of freshwater and saline lakes. In:
Ž .Orr, W.L., White, C.M. Eds. , Geochemistry of Sulfur inFossil Fuels. ACS Symposium Series 429, pp. 114–148.
Vairavamurthy, A., Mopper, K., 1989. Mechanistic studies ofŽ .organosulfur thiol formation in coastal marine sediments. In:
Ž .Saltzman, E.S., Cooper, W.J. Eds. , Biogenic Sulfur in theEnvironment. ACS Symposium Series 393, pp. 231–242.
Waller, B.G., Earle, J.E., 1975. Chemical and biological quality ofwater in part of the Everglades, Southeastern Florida. USGeological Survey Water-Resources Investigations Report 56-75, Tallahassee, FL, pp. 156.
Westrich, J.T., Berner, R.A., 1984. The role of sedimentaryorganic matter in bacterial sulfate reduction: the G model
Ž .tested. Limnol. Oceanogr. 29 2 , 236–249.Zaback, D.A., Pratt, L.M., Hayes, J.M., 1993. Transport and
reduction of sulfate and immobilization of sulfide in marineblack shales. Geology 21, 141–144.


![V. SPECIATION A. Allopatric Speciation B. Parapatric Speciation (aka Local or Progenitor - Derivative) C. Adaptive Radiation D. Sympatric Speciation [Polyploidy]](https://img.pdfslide.us/doc/110x75/56649d3f5503460f94a186e2/v-speciation-a-allopatric-speciation-b-parapatric-speciation-aka-local.jpg)