Embed Size (px)
Citation preview
Special Study
TurnAround Management Programme (TAM)
Regional
April 2004
OPER No: PE03-251S
ab0cdProject Evaluation Department
FOR OFFICIAL USE ONLY. This document has a restricted internal distribution and may be used by recipients only in the performance of their official duties. Its contents may not otherwise be disclosed without the Bank’s authorisation.
PREFACE This report presents the findings of an evaluation of the Bank’s TurnAround Management Programme (TAM, the Programme) by the Bank’s Project Evaluation Department (PED). Wolfgang Gruber, Senior Evaluation Manager, PED, and Walter I. Cohn of Walter I. Cohn & Associates, LLC (hereafter referred to as “the Evaluation Team”) carried out the evaluation and prepared this report. EBRD administers the Programme through the TurnAround Management Group (TMG).1 The need for an evaluation of the TAM Programme arises from the Bank’s obligation to extend the same treatment to third-party financed operations as it does to the operations funded from the Bank’s own resources. The Bank, thus, has an obligation to carry out independent evaluations of donor-funded operations and, beyond this obligation, it has an interest in ensuring that the donors are satisfied that the Bank is adequately assessing the relevance, efficacy, efficiency and impact of the programmes they are funding and using the evaluation findings to guide future efforts. PED considered that 2003 was an appropriate time for the evaluation. It believes that programme-type activities call for independent evaluation every 3-5 years, and its only prior evaluation of TAM took place in 1997, when the Programme, after only four years of operations, was still in its infancy. Moreover, its consultations with members of the Board of Directors (notably members of the Audit Committee) and members of banking teams supported inclusion of the evaluation in PED’s 2003 work programme.
1 Until August 2003, TMG reported to the Vice President, Evaluation, Operational and Environmental Support, i.e., the same vice-presidency as PED. Just as the PED team was starting work on the evaluation, TMG was transferred to the First Vice President, responsible for Banking, and PED to the Office of the Secretary General. This transfer eliminated any possible concerns about PED’s independence in this evaluation. (The Multilateral Development Bank’s (MDB’s) Good Practice Standards for Evaluation of Private Sector Investment Operations call for an evaluation department’s reporting line to be organizationally independent from the MDB’s operational departments. When the Vice-President, Operational & Environmental Support, supervised both PED and TMG, PED lacked the necessary organizational independence. PED would still have carried out a fully independent evaluation, but the evaluation would not have met the requirements of the Good Practice Standards and could have been subject to criticism on this account.) TMG has asked that this footnote comment on “the concurrent and possibly conflicting activity of the ‘external’ evaluator, who was also involved in the evaluation of the SEED Programme.” Mr. Cohn did indeed concurrently supervise the evaluation of Southeast Europe Enterprise Development as part of an overall evaluation of the project development facilities managed by the International Finance Corporation. PED, however, sees no conflict, inter alia, because SEED’s activities do not overlap with TAM’s (though they do with TMG’s Business Advisory Services, which are not covered by this evaluation). In any event, for an evaluator to have assessed similar programmes does not compromise his independence. On the contrary, his assessment of similar programs, particularly if done recently, adds to his ability to contribute to an evaluation.
SPECIAL STUDY OF THE TURNAROUND MANAGEMENT PROGRAMME (TAM)
REGIONAL
Contents Page Preface Abbreviations and defined terms iii Executive Summary iv 1. INTRODUCTION 1 1.1 THIS STUDY 1 1.2 TAM’S MISSION 2 1.3 HOW TAM CARRIES OUT ITS MISSION 3 1.4 GOVERNANCE 4 2. TAM’S OUTPUT 5 2.1 VOLUME OF CAPACITY 5 2.2 OTHER SOURCES OF COMPARABLE ASSISTANCE 6 2.3 CLIENTS 7 3. THE RESULTS 9 3.1 CLIENT AND PED RATINGS 9 3.2 CHANGES AS A RESULT OF TAM ADVICE OR ASSISTANCE 10 3.3 RESULTS AT ENTERPRISE LEVEL 12 3.4 INCREASES IN SALES AND PROFITS 14 3.5 EMPLOYMENT 16 3.6 TRANSITION IMPACT 16 4. INTERNAL EFFICIENCY 16 5. COSTS AND BENEFITS 19 6. TAM’S SUSTAINABILITY 19 6.1 DEPENDENCE ON DONOR FUNDING 19 6.2 COST RECOVERY FROM CLIENTS 21 7. REPORTING AND EVALUATION 23 7.1 REPORTING 23 7.2 EVALUATION 24 7.2.1 Evaluation system 24 7.2.2 Evaluation results 25 8. COLLABORATION WITHIN THE BANK 26 8.1 JOINT CLIENTS 26 8.2 CROSS-RECOMMENDATIONS 28 8.3 BANK STRATEGIES & POLICIES 29 8.4 POLICY DIALOGUE 29 8.5 STRUCTURAL REASONS FOR PROBLEMS IN COLLABORATION 30 9. CONCLUSIONS AND RECOMMENDATIONS 30 9.1 CONCLUSIONS 30 9.2 RECOMMENDATIONS 31 *APPENDICES 1.1 TAM – PREVIOUS EVALUATIONS 1.2 SUMMARY OF STUDY DESIGN & REPORT ON SAMPLING 1.3 KEY DATES 1.4 COMPARABLE PROGRAMMES 2.1 PROJECTS BY REGION AND COUNTRY, YEARLY 4.1 TMG RECEIPT S AND EXPENDITURES 6.1 FUNDS FROM DONORS 6.2 TMG ARGUMENTS AGAINST SEEKING TO RECOVER COSTS FROM CLIENTS 7.1 FORMAT FOR FINANCIAL STATEMENTS 7.2 EVALUATION SYSTEM 8.1 RECOMMENDATIONS OF 1997 MID-TERM REVIEW
*PLEASE NOTE THAT THE FIRST DIGIT IN THE APPENDIX NUMBERING REFERS TO THE CORRESPONDING CHAPTER IN THE MAIN BODY OF THE REPORT
ABBREVIATIONS AND DEFINED TERMS
Bank European Bank for Reconstruction and Development BAS Business Advisory Service, managed by TMG CED Central Evaluation Department CEO Chief executive officer CIS Commonwealth of Independent States, i.e., the former Soviet
Republics, other than the Baltic states CY Calendar year DIF Direct Investment Facility Enlargement countries
Bulgaria, Czech Republic, Estonia, Hungary, Latvia, Lithuania, Poland, Romania, Slovak Republic and Slovenia
Evaluation Team
Wolfgang Gruber, Senior Evaluation Officer, & Walter I. Cohn, consultant, from Walter I. Cohn & Associates, LLC
Excom EBRD’s Executive Committee EU European Union FSU Former Soviet Union FYR Macedonia Former Yugoslav Republic of Macedonia FY Financial years ending last day of February. MDB Multilateral Development Bank OPER PED Operational Performance Evaluation Review Opscom EBRD’s Operations Committee p.a. Per annum PED Project Evaluation Department Phare Poland & Hungary: Aid for Economic Restructuring (an EU
programme) Phare Bangkok An EU programme providing grant financing for EBRD to use for TC
activities for the preparation and implementation of investments and for the TAM and BAS Programmes.
Programme The TAM Programme RO EBRD Resident Office(s) in countries of operation. SIA Senior Industrial Advisor SOE State-owned enterprise South East Europe
Albania, Bosnia & Herzegovina, Croatia, Serbia & Montenegro, and FYR Macedonia
Tacis Technical Assistance for CIS Countries (a EU programme) Tacis Countries The members of the Commonwealth of Independent States, i.e., the
former Soviet Republics other than the Balkan states—Armenia, Azerbaijan, Belarus, Georgia, Kazakhstan, Kyrgyz Republic, Moldova, Russian Federation, Tajikistan, Ukraine and Uzbekistan
TAM TurnAround Management Programme TERF TACIS Enterprise Restructuring Facility covering the Russian
Federation TMG TurnAround Management Group TTCC TAM Team Country Coordinator UNDP United Nations Development Programme XMRA Expanded Monitoring Report Assessment
EXECUTIVE SUMMARY
The TurnAround Management Programme (TAM, the Programme), which is managed by the EBRD through the TurnAround Management Group (TMG), seeks to enhance the knowledge, confidence and capabilities of senior management in potentially viable enterprises in central and eastern Europe and the former Soviet Union. In addition, it seeks to assist these managers lead their enterprises into sustainable economic success in a market-oriented economy and, where appropriate, assist in their transition towards privatisation. This report presents the findings of an evaluation of the Programme’s 1998-2002 operations and has been prepared by the Bank’s Project Evaluation Department (PED).1 The evaluation is based on: (1) a review of TAM documents and databases, prior evaluations, and evaluations and other reports on comparable programmes; (2) structured interviews with 63 TAM clients in six countries; (3) structured interviews with 21 TMG staff members and country coordinators and 24 Bank managers and staff members; (4) a questionnaire sent to 15 donor representatives; and (5) the PED team’s experience with management support programmes in developing and transition economies. The evaluation does not cover TMG’s Business Advisory Service Programme, which is designed to help micro, small and medium-sized enterprises make the transition to market-driven economies and to develop the professional capabilities of local consultants.
CONCLUSIONS
The TAM Programme, a fully grant-funded advisory facility of the Bank, has been highly successful. The majority of the companies visited have acted on TAM’s advice and have made significant changes to their businesses. The vast majority of companies visited reported higher capacity utilisation, higher direct labour productivity, higher sales, higher market share and higher profits. Nearly all the firms assisted agreed that they were materially closer to being profitable, stand-alone private companies than they would have been without TAM. Companies that provided information on their actual sales and profits and what they believed their sales and profits would have been without TAM estimated that TAM’s contributions had increased annual sales by an average of US$ 1.6 million and profits by an average of US$ 0.25 million. With one-off costs of a TAM assignment of less than US$ 0.1 million, the internal rate of return would be well over 100 per cent a year (without even considering the contributions to transition). Few technical cooperation programmes would be likely to generate comparable returns. Although the Evaluation Team could not document the transition impact beyond the enterprises assisted, the Programme is undoubtedly playing a significant role. Successful TAM projects improve the competitiveness of the firms assisted. The increased competitiveness of these firms puts pressure on their peers, forcing them to improve their
1 This draft includes some, but not all, of the comments received from TMG.
iv
operations in order to survive. Moreover, the TAM projects have developed local skills – particularly in management and marketing – that have spread to other enterprises. A significant number of managers in the TAM-assisted ventures had moved on to other companies between the time that TAM provided assistance and the time of the evaluation. Finally, the TAM projects are contributing to the development of a market for consulting services that can play an important role in the transition process. Despite the proven benefits, TAM is totally dependent on donor funding, and the unreliability of this funding threatens the Group’s sustainability, constrains its ability to meet the demand for its services, and reduces its efficiency. TMG has had to deal with this issue from the Programme’s inception in 1993. Over its first 10 years of operation, it has mobilised €66 million, and in the past few years, it has successfully increased the relative importance of funding under framework agreements. Nevertheless, TMG and the Bank have not yet developed adequate arrangements regarding the provision of multi-year funding that can be used for a wide range of countries, that is not tied to the use of advisors from specific donor countries, and that can reduce its own administrative burdens. The evaluation also expresses concerns about a number of other issues, including: (i) TAM’s provision of donor-funded services to foreign controlled enterprises, very large enterprises, and enterprises owned by large business groups; (ii) TAM’s very low cost recovery from clients; (iii) TAM’s reliance on operating cost allocations that may not be adequate, depending on the euro/GBP exchange rate and the volume of new assignments; (iv) TAM’s attention to environmental concerns; (v) governance, reporting and evaluation arrangements; and (vi) TAM’s integration within the Bank. RECOMMENDATIONS 1. TMG and the Bank’s Official Co-financing Unit, with active support from the
Bank’s senior management, should jointly give top priority to arranging a three to five-year multi-donor facility that would provide funding for a wide range of countries, which is not tied to the use of advisors from specific donor countries. Arranging a multi-year, multi-donor facility will require preparation of a three to five-year business plan, a Bank-supported effort to convince donors to participate in the facility, periodic donors’ meetings to present the programme and call for pledges, and greater visibility to TAM’s accomplishments and the donors’ role in making the accomplishments possible.
2. The Bank should consider sharing in the costs of the TAM Programme as part
of its normal operating budget. The prospects of generating donor support for a multi-year, multi-donor facility may depend in part on the Bank’s willingness to contribute to the facility itself, for example, by absorbing TAM’s administrative costs. Although the Bank has not shared in the cost of TC programmes in the past, its Establishing Agreement provides an adequate basis for including expenditures on TAM in its administrative expenses.
v
3. TMG should focus its efforts primarily on companies that are in early to
intermediate transition countries, companies located outside the capital cities, companies entirely owned by local investors, and smaller enterprises. TMG has selected clients subject to the guidelines provided by various donors and, in some cases, has had to seek donor approval for specific clients. Although it has generally done a good job in selecting clients, TMG and the donors should consider certain changes in emphasis. Providing subsidised services to very large enterprises, enterprises owned by large groups, and foreign controlled enterprises raises serious questions, in the Evaluation Team’s view, about whether serving these enterprises meets the criteria of additionality and whether, by serving these enterprises, TAM is competing with private consulting firms. Moreover, companies entirely owned by local investors, smaller companies, companies in early to intermediate transition countries, and companies located outside the capital cities reported greater impacts, in terms of incremental sales. Although TMG is already moving to some extent in this direction, subject to donor funding constraints, it should focus its efforts primarily on these smaller, local companies in early to intermediate transition countries. TMG need not exclude others, but to avoid subsidising enterprises that could hire private consultants without TAM and to maximise its impact, TMG should focus its efforts on companies in the categories suggested.
4. TMG should develop a framework which provides substantial subsidies (albeit
not necessarily at the current level) for first-time assignments with small, locally owned companies. In addition, subsidies for follow-up assignments, assignments for larger companies (or companies owned by large companies) and companies with foreign shareholders should be phased out. TMG should seek to recover a share of the cost of its services. Subsidising a first assignment or subsidising small enterprises entirely owned by local shareholders may be justified on the grounds that clients may not recognise the value of TAM’s advisory services. But this justification would not apply to follow-up assignments, assignments for large enterprises or assignments for enterprises in which foreign shareholders hold substantial stakes. TMG should not be barred from assisting these enterprises, but it should not use scarce donor funding to subsidise them.
5. TMG should review annually the standard project budgets and allowances for
its administrative costs. Annual reviews of the adequacy of the project budgets and allowances for administrative costs should be carried out, primarily because of the changes in unit costs arising from changes in TAM’s volume of operations and the mismatch between TAM’s operating expenditures, which are mostly denominated in GBP, and its receipts, denominated in euros. The last review was in 2000.
6. TMG should consider its Supervisory Board as a source of advice and
guidance that can contribute to improving TMG’s operations and should seek to use Board meetings as a forum for discussing policy and strategic issues. TMG has used its Supervisory Board meetings primarily to provide information and
vi
respond to questions. It should seek to use these meetings rather as a source of advice and guidance. The Board may wish to discuss, among other things, the recommendations of this report.
7. The EBRD should appoint a senior executive, other than a member of TMG’s
management team, as chairman of TMG’s Supervisory Board. Current thinking on good governance practices calls for separating the roles of chairman and chief executive.
8. TMG should ensure that environmental issues are systematically addressed by
its advisory teams. These issues should be covered by all screening reports, the terms of reference for its advisors, and periodic visits and final enterprise reports.
9. To facilitate understanding of TAM’s performance, the problems it is facing,
and issues requiring consideration TMG should (subject to TMG’s Supervisory Board considering whether the improved information would be worth the incremental cost):
• provide information on medium-term trends in funding under framework
agreements and bilateral authorisations; the number of projects initiated, in progress and completed; TMG’s income and expenditures; and the composition of its pre-qualified database of advisors and advisors contracted;
• ensure that its reports all cover the same periods, not periods ending at different times;
• provide more informative reports on income and expenditure; and • base its income and expenditure reports on the final figures, not estimates, and
arrange for these figures to be reviewed by the EBRD’s auditors. 10. While the Evaluation Team does not dispute the findings of TMG’s evaluation
efforts, it nevertheless has a number of recommendations:
• TMG’s Senior Evaluation Officer should have a TMG Board-approved mandate and TMG’s Board should oversee his work. The governance arrangements should be designed to ensure his independence and autonomy; and he should transmit his final products (materials/report) to the TMG Board without any clearance from management.
• The evaluation rating system should clearly distinguish between judgments on what TMG does and judgments on the results.
• The criteria used for rating judgments should be clearly specified. • The evaluation rating scale should provide four (instead of the current three)
options for projects that have not been terminated prematurely. • The evaluation system should systematically draw anddisseminate lessons
from the evaluation work. • In view of the importance that TMG rightly attributes to confidentiality, its
evaluation reports to its Supervisory Board should not include specific information on individual clients.
vii
viii
11. Although the recent reintegration of TMG into the Banking Vice-Presidency
may contribute to improved collaboration between TAM and the Bank, further steps are needed:
• The Steering Committee appointed to deal with “coordination and support
among all of the groups involved in the small business activities of the Bank” should ensure that it includes TAM in its purview. TAM’s activities cover large as well as small businesses, but to the extent that it serves small enterprises, the Steering Committee should take steps to integrate TAM with related Bank activities.
• TMG and the Bank should take steps to ensure that TAM Team Country
Coordinators and advisors are aware of the types of investment proposals the Bank can consider and what other Bank-supported sources of financing might be available for TAM clients in individual countries. The TAM team must seek to foster the interests of the companies being served, rather than the interests of the Bank, but this mandate does not bar TAM from assisting its clients by recommending possible sources of financing. TAM advisors should be aware of what types of financing might be available from the Bank and of financial institutions supported by the Bank and, when needs arise, should suggest that the companies they are advising approach these sources of financing.
• TMG and the Bank should take steps to ensure that bankers are aware of
what TAM can and cannot do and consequently what types of companies they might recommend to TAM. Many enterprises approach the Bank for assistance. Whether the Bank can help them or not, it can provide a useful service by recommending that appropriate enterprises seek assistance from TAM.
• The Bank should put mechanisms in place to draw on TMG’s experience
and to ensure that whatever views TMG expresses on its own are consistent with positions being taken by the Banking Department and the Office of the Chief Economist. TMG’s grassroots experience may help identify problems affecting the private sector in individual countries and general problems affecting the transition process. Making this experience available to the countries of operation, directly or indirectly, may be useful.
SPECIAL STUDY OF THE TURNAROUND MANAGEMENT PROGRAMME (TAM) REGIONAL
1. INTRODUCTION 1.1 THIS STUDY
This report presents the findings of an evaluation of the Bank’s TurnAround Management Programme (TAM, the Programme) by the Bank’s Project Evaluation Department (PED). PED previously reviewed TAM’s operations in 1997, and other donors have carried out separate reviews at various times (Appendix 1.1). This evaluation focuses on TAM’s operations during 1998-2002. The evaluation considers five broad issues: (1) Relevance – the extent to which the Programme’s stated mission and operational objectives have addressed and continue to address the high priority needs of business enterprises in the countries of operation and the extent to which the Programme’s mission and objectives are consistent with the EBRD’s mandate. (2) Effectiveness – the extent to which the Programme’s outputs correspond to the intended objectives. (3) Efficiency – the extent to which TMG is employing its staff and financial resources efficiently in providing services to target enterprises, and the extent to which the benefits of the TAM Programme justify the resources used. The evaluation also considers the extent to which TMG takes advantage of potential opportunities for synergy with other programmes, within and outside the Bank. (4) Transition impact – focusing mainly on the Programme’s success in transforming assisted enterprises into profitable, standalone private companies, capable of surviving and competing in market economies. (5) Sustainability – the extent to which the companies assisted survive and maintain their operating results after external assistance is withdrawn.1 The evaluation is based on:
• a review of TAM reports, documents, and databases, prior evaluations of the Programme, and evaluations and other reports on comparable programmes;
• structured interviews with 21 TMG staff members and TAM Team Country Coordinators and 24 Bank managers and staff members;
• a questionnaire sent to 15 donor representatives; • structured interviews with 63 TAM clients in Hungary, Lithuania, Mongolia,
Romania, Russia, and Ukraine; • the PED team’s experience with management support programs in developing
and transition economies. The PED team selected the companies to be visited based on stratified random sampling, subject to certain constraints. Appendix 1.2 summarises the study design, and reports on the selection of the sample and the response rate. Because cost constraints made it
1 This Study does not cover TMG compliance with internal Bank administrative procedures, which belong to the remit of the Bank’s internal and external auditors (see also Section 7.1). The Bank’s Internal Audit Department has carried out only one review of TMG’s activities, “TurnAround Management Programme – Russian Privatisation Centre (RPC)-TAM contract,” February 1999.
Page 2 of 35 Special Study: TAM Programme (Regional)
necessary to exclude some countries and companies from the sampling frame and because interviews could not be arranged with some companies in the sampling frame, the results may be biased to a certain extent. The evaluation team nevertheless believes that the research for the evaluation, conducted during August–October 2003, provides a reliable basis for the findings and recommendations.
1.2 TAM’S MISSION
In 1993, the EBRD, the United Nations Development Programme (UNDP) and the European Union (EU) established the TurnAround Management Programme (TAM, the Programme) to assist enterprises to transform themselves, so as to survive and compete in market economies. TAM’s mission is:2
“To enhance the knowledge, confidence and capabilities of the senior management of potentially viable enterprises in central and eastern Europe and the former Soviet Union, and to assist them to lead these enterprises into sustainable economic success in a market oriented economy and, where appropriate, in their transition to privatisation.”
This mission is consistent with the EBRD’s mandate, which calls, among other things, for the Bank “to foster the transition towards open market-oriented economies . . .” and to promote the “improvement . . .of productive, competitive and private sector activity, in particular small and medium-sized enterprises . . .”3 Similarly, TAM’s mission is consistent with the needs of the countries where it operates. Many enterprises have made substantial progress on the transition path, particularly in the advanced transition countries. But others still need assistance in learning how to operate in a market economy. This need is widespread in the less advanced transition countries, but is also found – to a lesser extent – in the more advanced countries. Not only do levels of development differ drastically among regions within a country, but even in the higher income regions of these countries enterprises may still need assistance with transition. For example, the Bank’s latest strategy paper on Hungary points out that GDP per capita in northern Hungary is equivalent to only 35% of the EU average. And, in commenting on the prospects for medium-scale enterprises, the paper suggests that, “In the absence of targeted action. Hungary is likely to experience difficulties in coping with competitive pressures following the country’s accession to the European Union.”4
2 EBRD, “The TurnAround Management Programme: Rules & Regulations,” July 1999, para. 3.1. 3 EBRD, “Agreement Establishing the European Bank for Reconstruction and Development,” Chapter I. 4 EBRD, “Strategy for Hungary,” BDS/HU/03-1 (Rev 1), 31 July 2003, p. 24.
Special Study: TAM Programme (Regional) Page 3 of 35
1.3 HOW TAM CARRIES OUT ITS MISSION
In carrying out its mission, TAM seeks to:5
•
•
•
•
• • •
•
•
•
•
Select potentially viable enterprises where senior management is most likely to benefit from TAM’s support. Engage suitably experienced Senior Industrial Advisors (SIA) to work closely with the Enterprises’ Chief Executive Officers (CEO) and their management teams and to provide them with the required specialist support. Build the confidence of the CEO and the Enterprise senior management in their own ability to manage their businesses successfully in a market-driven economy and to adapt to the demands of international markets. Assist the Enterprises to establish strategic direction and, in particular, to install the standards and processes necessary to comply with the industrial legislation in their export markets. Assist management to introduce and develop sound environmental practices. Meet EU accession requirements wherever relevant. Support and advise the CEOs in the preparation of a realistic three-year Business Plan based on best international business practices to achieve strategic direction and, where relevant, to act as the vehicle for attracting equity investment and external finance. Demonstrate how the competitive position of the Enterprise can be improved by the development of marketing strategies for specific products and markets, and assist in the implementation of market-driven sales activities. Help enterprises to establish and develop a network of international contacts with customers, suppliers, distributors, investors and foreign partners. Provide specialist advice to update design and production capabilities comparable with the Enterprises’ international competitors.
To achieve these objectives, the Programme assigns teams of senior (often retired) high-level business executives to advise the enterprises it seeks to assist. Rather than determining specific problems to be addressed before an assignment, the Programme calls for the advisors to take a global view and to deal with the key issues identified. These teams, working on a part-time basis, typically comprise:
A TAM Team Country Coordinator (TTCC) – an experienced senior manager with a strong financial background, who acts as the programme coordinator and as the liaison between TMG, the enterprise, and the other members of the TAM project team. The TTCC screens enterprises for their Programme eligibility, selects teams intended to match the needs of each enterprise, advises them, and coordinates the work on projects. The TTCC is normally responsible for about
5 TAM, “Handbook,” January 2003. These objectives are broadly similar to those laid down in TAM’s Rules & Regulations, op. cit., para. 3.2.
Page 4 of 35 Special Study: TAM Programme (Regional)
twelve enterprises in one or more countries or regions. Most countries have a single TTCC, but several have two to four active TTCCs.
•
•
A Senior Industrial Advisor (SIA) – a manager who should have at least 15 years’ experience in the client’s industry and who leads the team and works closely with the company’s chief executive and senior management. One or more industrial specialists with experience, for example, in production, marketing, finance, quality control, or human resources.
To develop the capabilities and self-confidence of local management, the team members are expected to serve as advisors, not managers. They make brief visits, ranging from three to five days, with six to eight weeks between visits, to discourage the chief executives and their managers from becoming dependent on the TAM team. The Programme calls for team members to make six to eight visits spread over 12-18 months, depending largely on the nature and complexity of the problems encountered and the rate at which the enterprise can absorb and apply the advice. TAM projects are assigned standard budgets, funded entirely by donor grants (Chapter 6). Depending on the region and, hence, travel expenses, the total funds allocated for a project range from €60,000 in Accession Countries to, for example, €110,000 in Mongolia.6 These funds cover the advisors’ fees, international travel and other costs, and TMG’s overhead expenses (approximately 11 per cent, see Chapter 4). The client companies pay only the local costs, e.g., local transport, lodging and meals. The team members work on a fixed, non-negotiable fee basis, often well below the market rate for managers of their calibre.7 For many of these team members, TAM relies largely on non-financial motivations. Nevertheless, the majority of the SIAs for the companies visited also work as consultants independently of the TAM Programme. The TAM fees may be lower than the level they charge for other clients but are still sufficiently attractive for them to accept the TAM assignments.
1.4 GOVERNANCE The EBRD is responsible for managing TAM and carries out this responsibility through the TurnAround Management Group (TMG), which it created to run the Programme in 1997. Initially, TMG reported to the Vice President for Banking Operations; then, between mid-1999 and August 2003, to the Vice President for Evaluation, Operational and Environmental Support; and, since then, again to the Vice President for Banking Operations, through the Business Group Director (BGD), Southern & Eastern Europe
6 At its meeting on 4 April 2000, EBRD’s Board approved Mongolia’s application as an ordinary shareholder of the Bank (BDS00-20, Rev. 2). Thus, Mongolia became the 61st member of the Bank as a non-recipient country. Consistent with the Board of Directors’ August 1999 interpretation of the Agreement Establishing the Bank (BDS99-84, the “August 1999 Interpretation Document”), the Bank may be authorised to carry out activities in a non-recipient country such as Mongolia if certain conditions are met. The Board confirmed that Mongolia had met these conditions on 28 March 2001 (BDS01-29 (Final). The Bank’s TAM and BAS instruments were specifically referred to (Annex 1) as useful tools to foster private sector development in Mongolia. 7 In addition, the TTCCs do not always get fully reimbursed for their efforts to identify clients for the Programme, and the per diem allowances for hotels and food often fall short of actual costs.
Special Study: TAM Programme (Regional) Page 5 of 35
and the Caucasus (SEEC). Already in 1997, PED had called for closer cooperation between TAM and other banking units (Appendix 8.1). The four years of separation from the Banking Department may have further contributed to some shortfalls in collaboration between TAM and the Bank, discussed in Chapter 8. Appendix 1.3 summarises the key dates in the development of the TAM Programme. Since 1996, TMG has also managed the EBRD’s Business Advisory Services Programme (BAS), designed to help micro-, small- and medium-scale enterprises make the transition to market-driven economies, and to develop the professional capabilities of local consultants. TAM and BAS share substantially the same headquarters staff, and TMG has begun to use TTCCs as part-time Regional Directors or Programme Directors for BAS. This evaluation does not cover BAS.8 TMG’s Rules and Regulations provide for a Supervisory Board to meet semi-annually “to review and advise on the overall strategic direction of the TAM Programme and to provide a mechanism to satisfy the Bank and the Donors that TMG has complied with all relevant reporting and other requirements . . .”9 Judging from the minutes of the 1998-2003 meetings, the Supervisory Board has been used essentially to provide information on TAM’s and BAS’ activities and problems, and to respond to questions from the Board members, rather than as a source of advice. Board members have made a number of suggestions over the years, but the minutes provide no indication of TMG’s using the Supervisory Board as a source of advice on TAM strategies. The Supervisory Board consists of nine members – three from the Bank and six from the donors. TMG’s Managing Director, a representative from the Bank’s Evaluation, Operational and Environmental Support Vice Presidency, and a representative from the Bank’s Official Co-Financing Unit, hold the Bank seats. The European Union holds three seats. And the Council of Nordic Ministers, the Japan-Europe Cooperation Fund and the UK’s Department for International Development hold the remaining seats.10 Contrary to current thinking on good governance practices, TMG’s Managing Director chairs the Supervisory Board.
2. TAM’S OUTPUT 2.1 VOLUME OF ACTIVITY
For the five-year period ending February 2003, TMG reported initiating a total of 777 assignments, including 74 follow-up projects. The number started was triple the number accounted for in TAM’s first five years of operation. Although TMG has not set any
8 PED, however, evaluated the programme’s operations in the Baltic states in 1997, “Mid-term Review of Baltic Business Advisory Services (BAS) Fund Project,” September 1997, OPER No. PE97-69S; and Investissement Developpement Conseil, a consulting firm contracted by TMG, evaluated the programme’s operations in South East Europe in 2003, “EBRD/TMG South East Europe BAS Programme, Independent Operational Review,” June 2003. 9 EBRD, “The TurnAround Management Programme: Rules & Regulations”, July 1999, p. 5. 10 TMG’s Rules and Regulations are out of date, inter alia, as they still call for a six-person Board and not yet reflecting TMG’s recent transfer to the Vice President for Banking Operations.
Page 6 of 35 Special Study: TAM Programme (Regional)
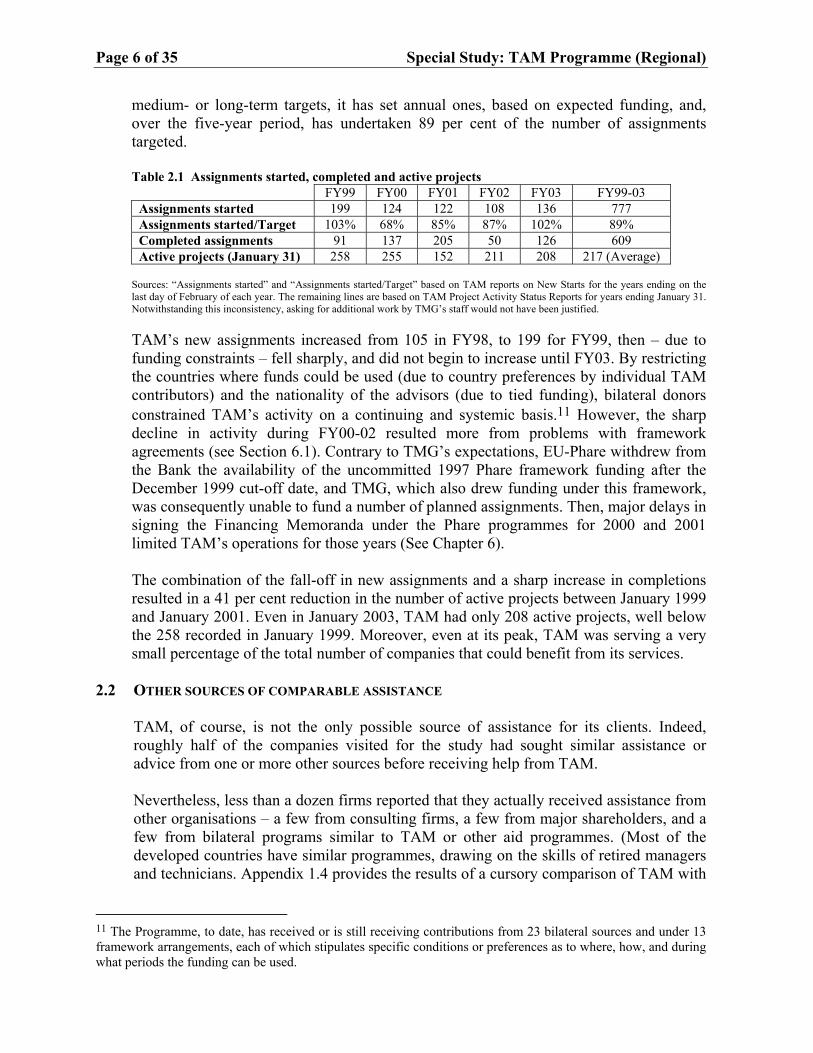
medium- or long-term targets, it has set annual ones, based on expected funding, and, over the five-year period, has undertaken 89 per cent of the number of assignments targeted. Table 2.1 Assignments started, completed and active projects
FY99 FY00 FY01 FY02 FY03 FY99-03 Assignments started 199 124 122 108 136 777 Assignments started/Target 103% 68% 85% 87% 102% 89% Completed assignments 91 137 205 50 126 609 Active projects (January 31) 258 255 152 211 208 217 (Average)
Sources: “Assignments started” and “Assignments started/Target” based on TAM reports on New Starts for the years ending on the last day of February of each year. The remaining lines are based on TAM Project Activity Status Reports for years ending January 31. Notwithstanding this inconsistency, asking for additional work by TMG’s staff would not have been justified. TAM’s new assignments increased from 105 in FY98, to 199 for FY99, then – due to funding constraints – fell sharply, and did not begin to increase until FY03. By restricting the countries where funds could be used (due to country preferences by individual TAM contributors) and the nationality of the advisors (due to tied funding), bilateral donors constrained TAM’s activity on a continuing and systemic basis.11 However, the sharp decline in activity during FY00-02 resulted more from problems with framework agreements (see Section 6.1). Contrary to TMG’s expectations, EU-Phare withdrew from the Bank the availability of the uncommitted 1997 Phare framework funding after the December 1999 cut-off date, and TMG, which also drew funding under this framework, was consequently unable to fund a number of planned assignments. Then, major delays in signing the Financing Memoranda under the Phare programmes for 2000 and 2001 limited TAM’s operations for those years (See Chapter 6). The combination of the fall-off in new assignments and a sharp increase in completions resulted in a 41 per cent reduction in the number of active projects between January 1999 and January 2001. Even in January 2003, TAM had only 208 active projects, well below the 258 recorded in January 1999. Moreover, even at its peak, TAM was serving a very small percentage of the total number of companies that could benefit from its services.
2.2 OTHER SOURCES OF COMPARABLE ASSISTANCE TAM, of course, is not the only possible source of assistance for its clients. Indeed, roughly half of the companies visited for the study had sought similar assistance or advice from one or more other sources before receiving help from TAM. Nevertheless, less than a dozen firms reported that they actually received assistance from other organisations – a few from consulting firms, a few from major shareholders, and a few from bilateral programs similar to TAM or other aid programmes. (Most of the developed countries have similar programmes, drawing on the skills of retired managers and technicians. Appendix 1.4 provides the results of a cursory comparison of TAM with
11 The Programme, to date, has received or is still receiving contributions from 23 bilateral sources and under 13 framework arrangements, each of which stipulates specific conditions or preferences as to where, how, and during what periods the funding can be used.
Special Study: TAM Programme (Regional) Page 7 of 35
these other programmes.) Most of the companies visited had not received any assistance, either because of not having sought it or not having been able to arrange it. Of the 28 companies that had not sought assistance, 12 indicated that they had been unaware of alternative sources or did not know where to find assistance. Five others had felt that they did not need assistance. Only two had not sought assistance because they believed that alternative sources would be too expensive. Most of the 24 companies that had not been able to arrange assistance did not provide reasons. Six, however, indicated that the bilateral programmes similar to TAM or their investment company shareholders did not have available the expertise they felt they needed. None attributed its failure to arrange for assistance to other sources’ being too expensive. The study found no evidence that TAM’s clients abandoned thoughts of using commercial consultants because of the free services provided by TAM.
2.3 CLIENTS Although TMG has a number of policies specifying the types of enterprises that can or cannot be served,12 the choice of clients largely reflects donor priorities. Individual donors specify the regions or countries where their funds can be used and the size of the enterprises that can be selected.13 The donors, however, have not imposed restrictions on the ownership of the client companies. Location. Over the five-year period ending July 2003, the accession countries accounted for 75 per cent of TAM’s operations, the CIS countries 11 per cent, South East Europe 10 per cent, and Mongolia 4 per cent. The availability of donor funding has determined the overall composition of TAM’s activities and has resulted in sharp fluctuations from year to year. For example, TAM started 162 new assignments in the accession countries during the year ending July 1999 (75 per cent of total), but only 29 (40 per cent of total) the following year and did not approach 100 again until the year ending July 2003. Similarly, operations initiated in the CIS countries ranged between 38 and 51 during the four years ending July 2002 (24-52 per cent of total) and then fell to 13 (11 per cent of total) the following year. (Appendix 2.1 provides further details.) Size. Although the conditions set by individual donors and the demands for TAM assistance have been the determining factors, TAM has periodically articulated criteria for the size of enterprises it will assist. Its July 1999 Rules & Regulations call for it to serve medium- to large-scale enterprises, normally employing not less than 300 workers but seldom more than 5,000 or, alternatively, having annual sales of at least US$ 2 million (with no upper limit specified). In response to donor wishes, TAM has increasingly turned its attention to smaller enterprises. During FY99-03, the average size
12 TMG’s Rules & Regulations bar TAM from assisting business involved in military products, gambling, and tobacco or in financial intermediaries, and none of the companies visited was involved in these businesses. The Evaluation Team recognises that the Bank has other instruments to assist the financial sector but is not convinced that TAM should be barred from serving this sector, particularly in light of the importance of an efficient financial system to the transition process. 13 Most of the donors also impose limits on the nationality of the TAM advisors.
Page 8 of 35 Special Study: TAM Programme (Regional)
of the enterprises selected fell sharply: average revenues for the companies chosen fell from US$ 22.8 million to US$ 7.8 million, and the firms’ average employment fell from 1,300 to 360.14 Nevertheless, TAM has served some very large enterprises or enterprises owned by very large groups.15 At the time of screening, 65 per cent of the companies visited for the study had more than 250 workers, putting them outside the EBRD and EU definitions of small- and medium-sized enterprises.16 Moreover, 48 per cent had 500 workers or more, 29 per cent had 1,000 workers or more, and two even exceeded TAM’s normal limit of 5,000 workers. In terms of sales, 17 per cent of the companies visited had annual sales of US$ 25 million or more, and three had annual sales in excess of US$ 100 million. TMG may have accepted some clients at the request of government agencies or the Bank, and it must have had the approval of specific donors for these operations. Still, characterising TAM as an SME programme is not entirely accurate. Ownership. In accordance with donor restrictions limiting TAM assistance to locally owned companies, TAM generally seeks to avoid serving companies that are not predominantly owned by local shareholders, and usually seeks donor approval before accepting such clients. Nevertheless, at the time of screening by TMG, foreign investors owned 50 per cent or more of the equity in six of the 62 companies visited for the study (about 10 per cent of the sample) and 75 per cent or more in four of them. TAM’s provision of subsidised advisory services to very large enterprises, enterprises owned by large groups, and foreign controlled enterprises raises serious questions about additionality and about competition with private consulting firms. Most foreign companies that invest in the EBRD’s countries of operation are likely to be sufficiently sophisticated to know what consultants can do, to know how to find consultants, and to know how to assess them. Very large enterprises, enterprises owned by large groups, and foreign controlled enterprises can generally afford to engage private consultants without needing donor subsidies. As such, to the extent that these companies received services from TAM, private consultants presumably suffered from unfair competition. Based on the sample estimate that 10 per cent of TAM’s clients are foreign controlled and the per assignment costs shown in Chapter 4, about €1 million per year of donor contributions are being allocated to clients that could probably afford to hire private consultants on their own. If large enterprises (discussed earlier) are also taken into consideration, the donor contributions allocated to clients that could afford to hire private consultants on their own would be even larger.
14 TMG, minutes of Supervisory Board Review Meeting for March 2003. 15 The figures in this paragraph reflect group employment where information is available. 16 EBRD’s definition of SMEs sets an upper limit of 250 employees. (Technical cooperation: Helping build a brighter future, EBRD Report to the Donor and Official Co-financing Community, 2002-03, p. 95.) EU’s definition sets upper limits of 250 employees, annual sales of €40 million, and total assets of €27 million. (http://europa.eu.int/ISPO/ecommerce/sme/definition.html)
Special Study: TAM Programme (Regional) Page 9 of 35
3. THE RESULTS
The companies visited by the Evaluation Team were pleased with TAM’s assistance, and many of the senior management staff interviewed explicitly expressed their gratitude to the donors, the Bank and TMG. Overall, these companies had made substantial changes in their businesses due to TAM’s advice, and that these changes had had a significant impact.17
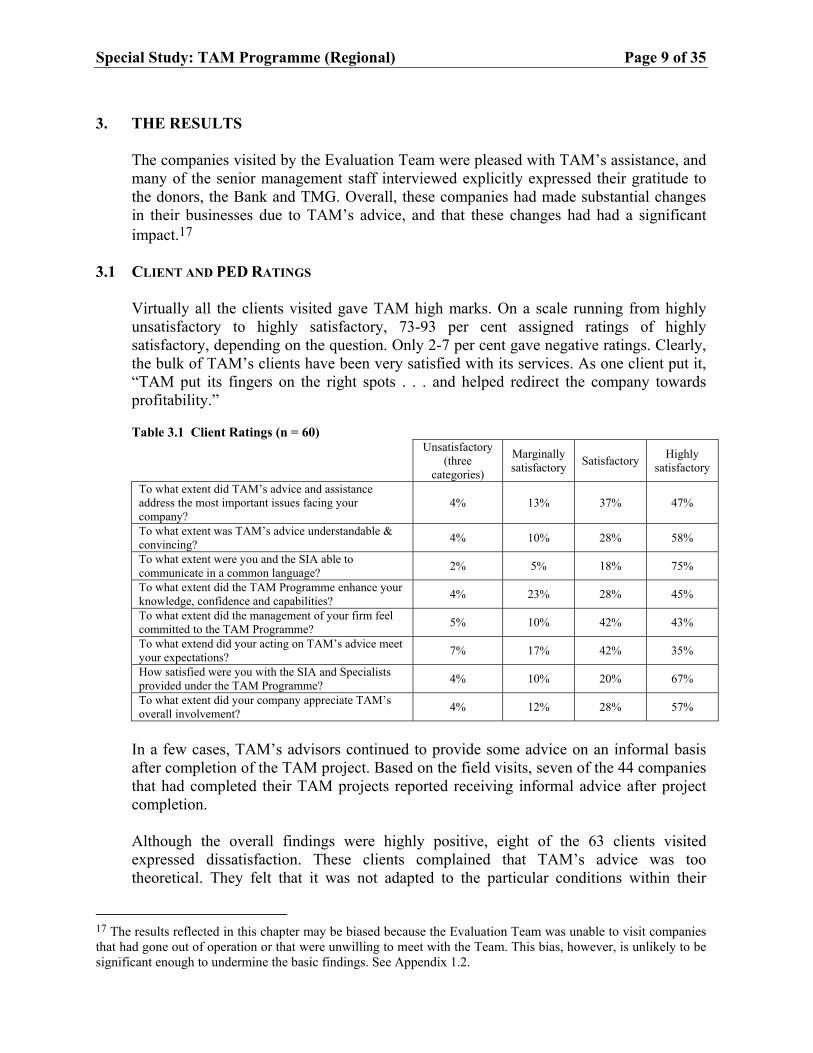
3.1 CLIENT AND PED RATINGS Virtually all the clients visited gave TAM high marks. On a scale running from highly unsatisfactory to highly satisfactory, 73-93 per cent assigned ratings of highly satisfactory, depending on the question. Only 2-7 per cent gave negative ratings. Clearly, the bulk of TAM’s clients have been very satisfied with its services. As one client put it, “TAM put its fingers on the right spots . . . and helped redirect the company towards profitability.” Table 3.1 Client Ratings (n = 60)
Unsatisfactory (three
categories)
Marginally satisfactory Satisfactory Highly
satisfactory
To what extent did TAM’s advice and assistance address the most important issues facing your company?
4% 13% 37% 47%
To what extent was TAM’s advice understandable & convincing? 4% 10% 28% 58%
To what extent were you and the SIA able to communicate in a common language? 2% 5% 18% 75%
To what extent did the TAM Programme enhance your knowledge, confidence and capabilities? 4% 23% 28% 45%
To what extent did the management of your firm feel committed to the TAM Programme? 5% 10% 42% 43%
To what extend did your acting on TAM’s advice meet your expectations? 7% 17% 42% 35%
How satisfied were you with the SIA and Specialists provided under the TAM Programme? 4% 10% 20% 67%
To what extent did your company appreciate TAM’s overall involvement? 4% 12% 28% 57%
In a few cases, TAM’s advisors continued to provide some advice on an informal basis after completion of the TAM project. Based on the field visits, seven of the 44 companies that had completed their TAM projects reported receiving informal advice after project completion. Although the overall findings were highly positive, eight of the 63 clients visited expressed dissatisfaction. These clients complained that TAM’s advice was too theoretical. They felt that it was not adapted to the particular conditions within their
17 The results reflected in this chapter may be biased because the Evaluation Team was unable to visit companies that had gone out of operation or that were unwilling to meet with the Team. This bias, however, is unlikely to be significant enough to undermine the basic findings. See Appendix 1.2.
Page 10 of 35 Special Study: TAM Programme (Regional)
companies, that it reflected a lack of understanding of the domestic markets where they sold their output, or that it did not take into consideration the political conditions, involving rampant corruption, government interference, and unclear tax and other laws. In several cases, the clients complained that the advisors did not spend sufficient time to understand the local situation, and that the advisors’ experience was not relevant to local conditions. Still, all but two of the 63 clients visited said that they would be willing to recommend TAM to others, and over 80 per cent said that they would be willing to pay for comparable advice in the future. These client ratings were broadly consistent with the Evaluation Team’s own assessments on the quality and timeliness of TAM’s services. Leaving aside two projects where no opinion was possible, the Evaluation Team assigned satisfactory ratings for 93 per cent of the companies visited.
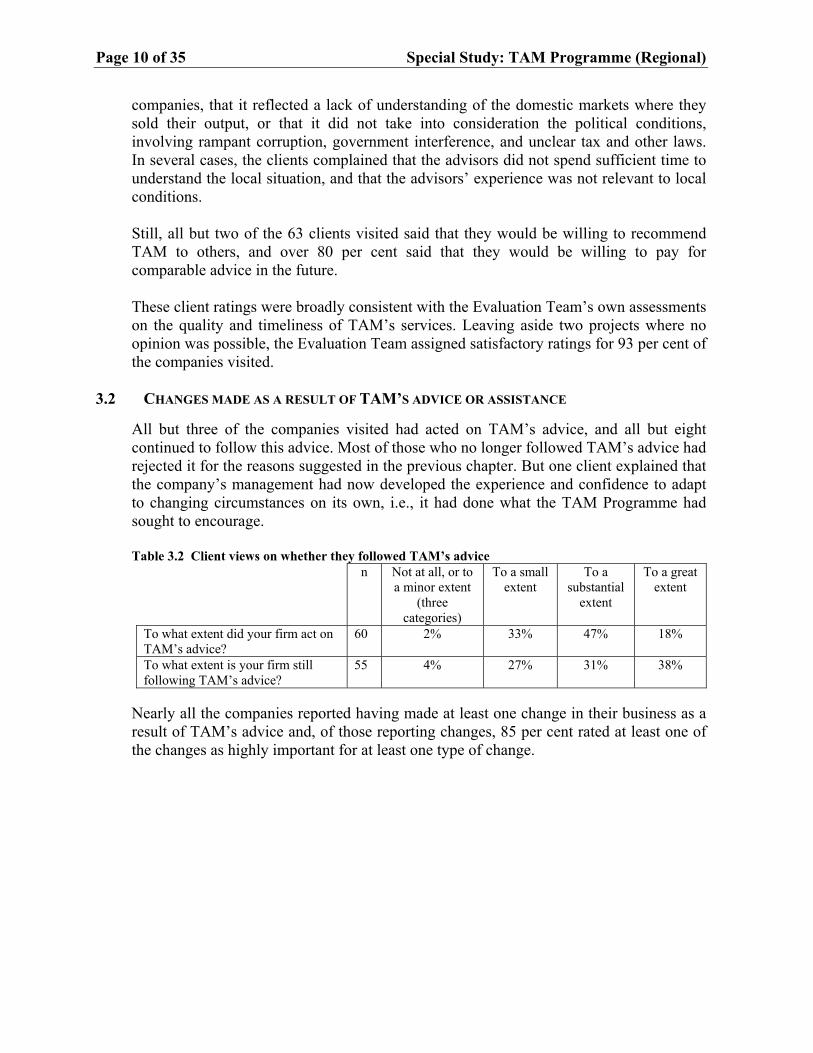
3.2 CHANGES MADE AS A RESULT OF TAM’S ADVICE OR ASSISTANCE All but three of the companies visited had acted on TAM’s advice, and all but eight continued to follow this advice. Most of those who no longer followed TAM’s advice had rejected it for the reasons suggested in the previous chapter. But one client explained that the company’s management had now developed the experience and confidence to adapt to changing circumstances on its own, i.e., it had done what the TAM Programme had sought to encourage. Table 3.2 Client views on whether they followed TAM’s advice
n Not at all, or to a minor extent
(three categories)
To a small extent
To a substantial
extent
To a great extent
To what extent did your firm act on TAM’s advice?
60 2% 33% 47% 18%
To what extent is your firm still following TAM’s advice?
55 4% 27% 31% 38%
Nearly all the companies reported having made at least one change in their business as a result of TAM’s advice and, of those reporting changes, 85 per cent rated at least one of the changes as highly important for at least one type of change.
Special Study: TAM Programme (Regional) Page 11 of 35
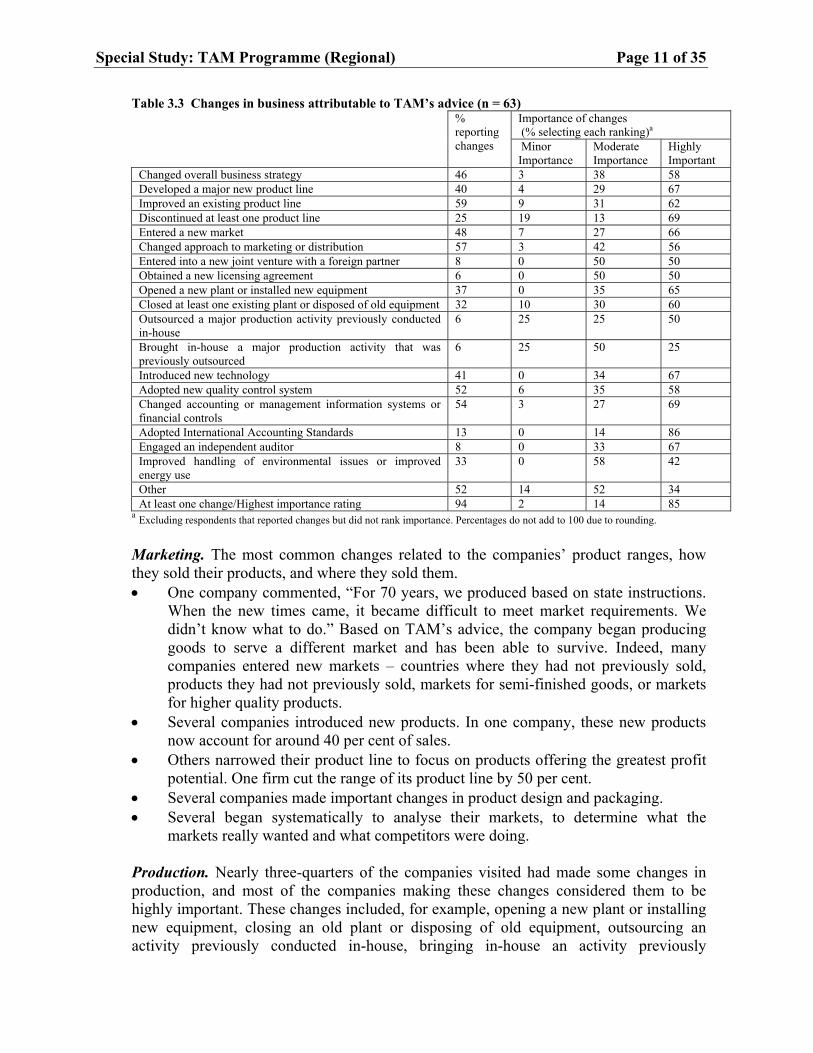
Table 3.3 Changes in business attributable to TAM’s advice (n = 63) Importance of changes (% selecting each ranking)a
% reporting changes Minor
Importance Moderate Importance
Highly Important
Changed overall business strategy 46 3 38 58 Developed a major new product line 40 4 29 67 Improved an existing product line 59 9 31 62 Discontinued at least one product line 25 19 13 69 Entered a new market 48 7 27 66 Changed approach to marketing or distribution 57 3 42 56 Entered into a new joint venture with a foreign partner 8 0 50 50 Obtained a new licensing agreement 6 0 50 50 Opened a new plant or installed new equipment 37 0 35 65 Closed at least one existing plant or disposed of old equipment 32 10 30 60 Outsourced a major production activity previously conducted in-house
6 25 25 50
Brought in-house a major production activity that was previously outsourced
6 25 50 25
Introduced new technology 41 0 34 67 Adopted new quality control system 52 6 35 58 Changed accounting or management information systems or financial controls
54 3 27 69
Adopted International Accounting Standards 13 0 14 86 Engaged an independent auditor 8 0 33 67 Improved handling of environmental issues or improved energy use
33 0 58 42
Other 52 14 52 34 At least one change/Highest importance rating 94 2 14 85
a Excluding respondents that reported changes but did not rank importance. Percentages do not add to 100 due to rounding.
Marketing. The most common changes related to the companies’ product ranges, how they sold their products, and where they sold them. • One company commented, “For 70 years, we produced based on state instructions.
When the new times came, it became difficult to meet market requirements. We didn’t know what to do.” Based on TAM’s advice, the company began producing goods to serve a different market and has been able to survive. Indeed, many companies entered new markets – countries where they had not previously sold, products they had not previously sold, markets for semi-finished goods, or markets for higher quality products.
• Several companies introduced new products. In one company, these new products now account for around 40 per cent of sales.
• Others narrowed their product line to focus on products offering the greatest profit potential. One firm cut the range of its product line by 50 per cent.
• Several companies made important changes in product design and packaging. • Several began systematically to analyse their markets, to determine what the
markets really wanted and what competitors were doing.
Production. Nearly three-quarters of the companies visited had made some changes in production, and most of the companies making these changes considered them to be highly important. These changes included, for example, opening a new plant or installing new equipment, closing an old plant or disposing of old equipment, outsourcing an activity previously conducted in-house, bringing in-house an activity previously
Page 12 of 35 Special Study: TAM Programme (Regional)
outsourced, introducing new technology, or adopting a new quality control system. Several companies had closed plant and consolidated production in a single factory. A chemical company, for instance, outsourced production of valves and pumps that served its core market but that called for different technological capabilities. And many sought and received International Standards Organisation certificates. Reporting. Only about half the companies visited had changed their accounting or management information systems (MIS) based on TAM’s advice, but over two-thirds of those making these changes considered them to be highly important. The relatively low number of companies reporting these changes, however, reflects many companies’ reporting that new accounting standards (mainly International Accounting Standards) had already been introduced prior to TAM’s intervention, or that these new standards were required anyway, either by strategic shareholders or by the government. The companies that made changes in reporting attributable to TAM mentioned in particular the installation of new computers and software and the development of cost accounting systems. One of them attributed a 10 per cent reduction in costs to the new management information system. Given the limited time available for TAM’s work with individual companies and the importance of devoting time to strategic issues, TMG has begun to draw on BAS to cover specific needs that can be addressed by local consultants, including accounting and management information systems. This initiative makes good sense. When BAS assistance is not an option, for example, because of enterprise size, TMG may be able to reduce the demands on the TAM team by calling for the use of private consultants. Environment. One third of the companies surveyed reported improvements in their handling of environmental issues and/or improved energy use. TAM provided useful advice in a number of cases, including a few where it called for shifting environmentally sensitive activities from their urban sites. Still, TAM’s interest, efforts, and results on environmental issues have been variable. Of the 46 TMG screening reports the Evaluation Team reviewed, 22 per cent did not cover environmental issues. Some of the visit reports reviewed dealt with environmental issues, but most did not. And TMG’s Final Evaluation Forms as well as the Evaluation Team’s own brief field visits made clear that environmental problems remained for a number of client companies, particularly where financial constraints limited their ability to address these problems.
3.3 RESULTS AT ENTERPRISE LEVEL18 The vast majority of the companies with completed TAM projects reported higher capacity utilisation, higher direct labour productivity, higher sales, higher market share and higher profits as a result of changes they made based on the services provided by TAM.19
18 See previous footnote. 19 A myriad of other factors, of course, influenced the performance of the enterprises as well. Attribution of improvements to TAM here and in the rest of this chapter implies only that TAM was a necessary condition for these improvements, not that it was a sufficient condition.
Special Study: TAM Programme (Regional) Page 13 of 35
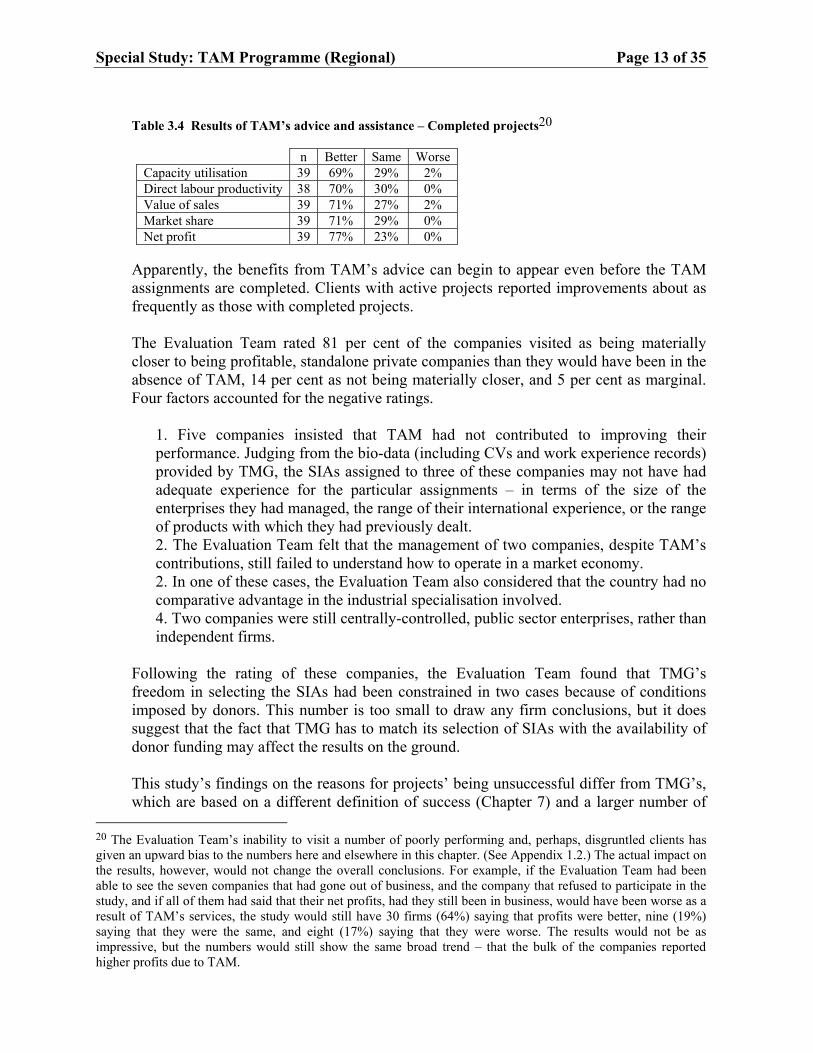
Table 3.4 Results of TAM’s advice and assistance – Completed projects20
n Better Same Worse Capacity utilisation 39 69% 29% 2% Direct labour productivity 38 70% 30% 0% Value of sales 39 71% 27% 2% Market share 39 71% 29% 0% Net profit 39 77% 23% 0%
Apparently, the benefits from TAM’s advice can begin to appear even before the TAM assignments are completed. Clients with active projects reported improvements about as frequently as those with completed projects. The Evaluation Team rated 81 per cent of the companies visited as being materially closer to being profitable, standalone private companies than they would have been in the absence of TAM, 14 per cent as not being materially closer, and 5 per cent as marginal. Four factors accounted for the negative ratings.
1. Five companies insisted that TAM had not contributed to improving their performance. Judging from the bio-data (including CVs and work experience records) provided by TMG, the SIAs assigned to three of these companies may not have had adequate experience for the particular assignments – in terms of the size of the enterprises they had managed, the range of their international experience, or the range of products with which they had previously dealt. 2. The Evaluation Team felt that the management of two companies, despite TAM’s contributions, still failed to understand how to operate in a market economy. 2. In one of these cases, the Evaluation Team also considered that the country had no comparative advantage in the industrial specialisation involved. 4. Two companies were still centrally-controlled, public sector enterprises, rather than independent firms.
Following the rating of these companies, the Evaluation Team found that TMG’s freedom in selecting the SIAs had been constrained in two cases because of conditions imposed by donors. This number is too small to draw any firm conclusions, but it does suggest that the fact that TMG has to match its selection of SIAs with the availability of donor funding may affect the results on the ground. This study’s findings on the reasons for projects’ being unsuccessful differ from TMG’s, which are based on a different definition of success (Chapter 7) and a larger number of
20 The Evaluation Team’s inability to visit a number of poorly performing and, perhaps, disgruntled clients has given an upward bias to the numbers here and elsewhere in this chapter. (See Appendix 1.2.) The actual impact on the results, however, would not change the overall conclusions. For example, if the Evaluation Team had been able to see the seven companies that had gone out of business, and the company that refused to participate in the study, and if all of them had said that their net profits, had they still been in business, would have been worse as a result of TAM’s services, the study would still have 30 firms (64%) saying that profits were better, nine (19%) saying that they were the same, and eight (17%) saying that they were worse. The results would not be as impressive, but the numbers would still show the same broad trend – that the bulk of the companies reported higher profits due to TAM.
Page 14 of 35 Special Study: TAM Programme (Regional)
unsuccessful projects, including prematurely terminated assignments. In contrast to the factors discussed in the preceding paragraphs, TMG has attributed its less successful projects primarily to changes in ownership or management, management’s refusal to face market realities, financial constraints, or government interference.21
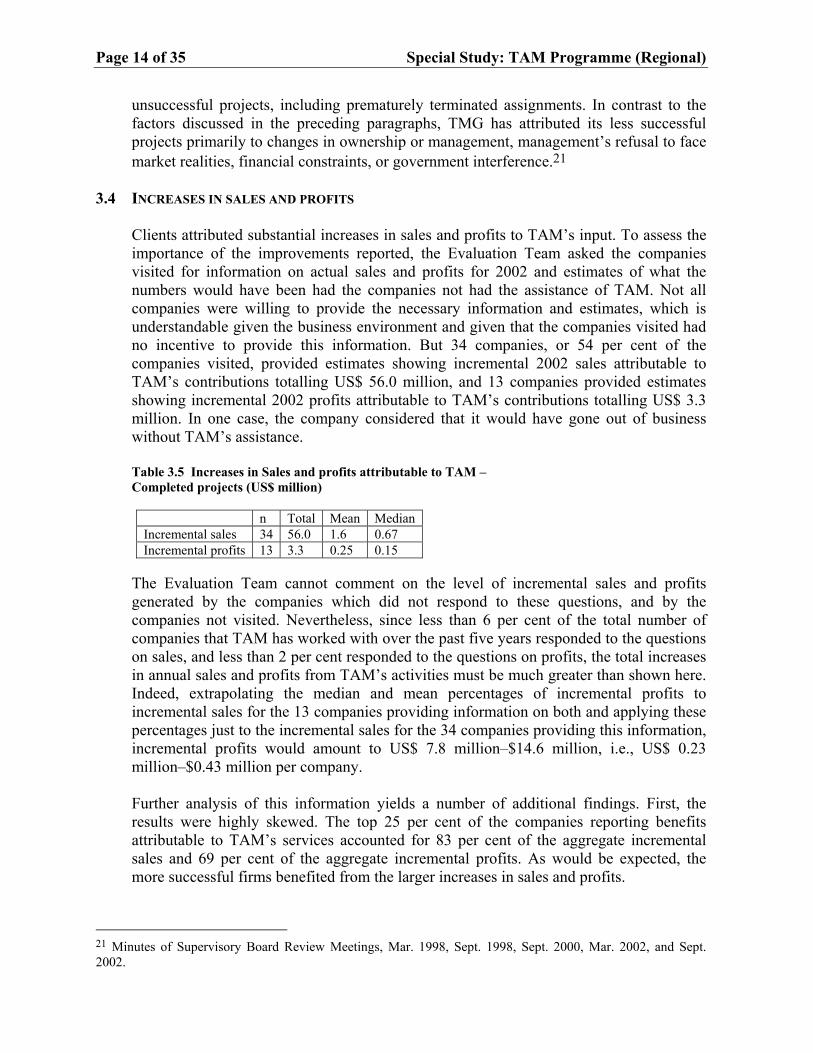
3.4 INCREASES IN SALES AND PROFITS Clients attributed substantial increases in sales and profits to TAM’s input. To assess the importance of the improvements reported, the Evaluation Team asked the companies visited for information on actual sales and profits for 2002 and estimates of what the numbers would have been had the companies not had the assistance of TAM. Not all companies were willing to provide the necessary information and estimates, which is understandable given the business environment and given that the companies visited had no incentive to provide this information. But 34 companies, or 54 per cent of the companies visited, provided estimates showing incremental 2002 sales attributable to TAM’s contributions totalling US$ 56.0 million, and 13 companies provided estimates showing incremental 2002 profits attributable to TAM’s contributions totalling US$ 3.3 million. In one case, the company considered that it would have gone out of business without TAM’s assistance. Table 3.5 Increases in Sales and profits attributable to TAM – Completed projects (US$ million)
n Total Mean Median Incremental sales 34 56.0 1.6 0.67 Incremental profits 13 3.3 0.25 0.15
The Evaluation Team cannot comment on the level of incremental sales and profits generated by the companies which did not respond to these questions, and by the companies not visited. Nevertheless, since less than 6 per cent of the total number of companies that TAM has worked with over the past five years responded to the questions on sales, and less than 2 per cent responded to the questions on profits, the total increases in annual sales and profits from TAM’s activities must be much greater than shown here. Indeed, extrapolating the median and mean percentages of incremental profits to incremental sales for the 13 companies providing information on both and applying these percentages just to the incremental sales for the 34 companies providing this information, incremental profits would amount to US$ 7.8 million–$14.6 million, i.e., US$ 0.23 million–$0.43 million per company. Further analysis of this information yields a number of additional findings. First, the results were highly skewed. The top 25 per cent of the companies reporting benefits attributable to TAM’s services accounted for 83 per cent of the aggregate incremental sales and 69 per cent of the aggregate incremental profits. As would be expected, the more successful firms benefited from the larger increases in sales and profits.
21 Minutes of Supervisory Board Review Meetings, Mar. 1998, Sept. 1998, Sept. 2000, Mar. 2002, and Sept. 2002.
Special Study: TAM Programme (Regional) Page 15 of 35
Second, enterprises wholly owned by local investors benefited much more than enterprises with some foreign ownership. Locally owned companies reported that sales had increased as a direct result of TAM’s contributions by an average of US$ 2.1 million (median US$ 1.0 million, or 9 per cent), compared with US$ 0.5 million (median US$ 0.2 million, or 1 per cent) for companies with some foreign ownership.22 Clearly, the opportunities for TAM to make a difference were greater in the companies that could not turn to foreign shareholders for assistance. Third, although larger companies (in terms of initial sales or initial employment) tended to show larger increases in sales in dollar terms, the differences were not statistically significant. Indeed, in percentage terms, the smaller companies reported larger increases in sales due to TAM. The median increase in sales attributable to TAM by companies with pre-TAM sales in excess of US$ 10 million p.a. was 5 per cent, compared with 16 per cent for companies with pre-TAM sales below $10 million. Similarly, the median increase in sales attributable to TAM by companies with pre-TAM employment of 1,000 workers or more was 5.7 per cent, compared with 7.2 per cent for companies with pre-TAM employment below 1,000. Fourth, enterprises in countries at an early to intermediate stage of the transition process benefited more than enterprises in more advanced transition countries. The companies visited in Romania, the Russian Federation, and Ukraine reported that sales had increased as a direct result of TAM’s contributions by an average of US$ 2.4 million (median US$ 1.1 million, or 9 per cent), compared with US$ 0.6 million (median zero) for companies in Hungary and Lithuania.23 Although incremental sales may not be the only indicator of TAM’s impact, the substantial differences found by the evaluation suggest that the opportunities for TAM to make a difference were greater in the countries at an early to intermediate stage of the transition process, than in the more advanced countries.24 Fifth, enterprises outside the capital cities tended to benefit more than enterprises in the capital cities. Companies headquartered outside of the capital cities reported that sales had increased by an average of US$ 2.5 million (median US$ 0.9 million, or 11 per cent), compared with US$ 0.9 million (median US$ 0.5 million, or 5 per cent) for companies in the capital cities.25 Again, the opportunities for TAM to make a difference were greater outside the capital cities, where access to new ideas and approaches was less readily available.
22 The difference is significant at the 5 per cent level, i.e., the probability that a survey of the entire population would find that the two means are truly different is 95 per cent. 23 The difference is significant at the 5 per cent level. 24 This finding runs counter to observations made in TMG’s March 2000 and September 2000 Supervisory Board Review meetings, which suggested that results were better in advanced countries because management had a clearer vision of how TAM could help and because the business environment was more supportive in the advanced transition countries. 25 Based on data for 18 firms in capital cities and 16 outside capital cities. The difference falls just barely short of being significant at the 10 per cent level.
Page 16 of 35 Special Study: TAM Programme (Regional)
3.5 EMPLOYMENT The findings on employment present a different picture. Of the companies responding, 15 laid off a total of 1,642 workers as a result of TAM’s services, or an average of 109 per company, and eight increased their employment by a total of 514, or an average of 64 per company. These findings are not surprising. Companies in transition economies have typically been over-staffed, and TAM advisors had to encourage staff reductions to improve the financial viability of the enterprises assisted and, thus, the job security of the remaining employees. Some companies, however, expanded their sales volume enough to require additional workers. The three companies that accounted for 88 per cent of the incremental jobs attributable to TAM also reported that TAM’s advice had resulted in increases in annual sales aggregating over US$ 6 million per year.
3.6 TRANSITION IMPACT As indicated in Section 3.3, the Evaluation team considered that 81 per cent of the companies visited were materially closer to being profitable, standalone private companies than they would have been in the absence of TAM. Thus, based on the narrow definition suggested in Section 1.1, TAM can be considered to have contributed to transition at the company level. Although the Evaluation Team could not document the Transition Impact beyond the enterprises assisted, the Programme is undoubtedly playing a role.
• Successful TAM projects improve the competitiveness of the firms assisted. The increased competitiveness of these firms puts pressure on their peers, forcing them to improve their operations in order to survive.
• The TAM projects have developed local skills – particularly in management and marketing – that have spread to other enterprises. A significant number of managers in the TAM-assisted ventures had moved on to other companies between the time TAM provided assistance and the time of the evaluation.
• The TAM projects are contributing to the development of a market for consulting services that can play an important role in the transition process. Of the 63 companies visited, 55 per cent said that, as a result of their participation in the TAM Programme, the likelihood of their using private consulting services in the future had increased. Only one said that it had decreased, and 44 per cent said that it had remained the same.
4. INTERNAL EFFICIENCY
TAM’s costs are low because the Programme relies heavily on retired executives and former executives now working as consultants, all of whom are willing to work for relatively modest fees. All of TMG’s TTCCs, SIAs and other advisors fall into this category. The SIAs and other advisors receive €500 per day, typically well below what they are likely to have earned before retirement or what they would be likely to charge as consultants. Moreover, the TTCCs, SIAs and other advisors are paid only for the days they work on TAM assignments.
Special Study: TAM Programme (Regional) Page 17 of 35
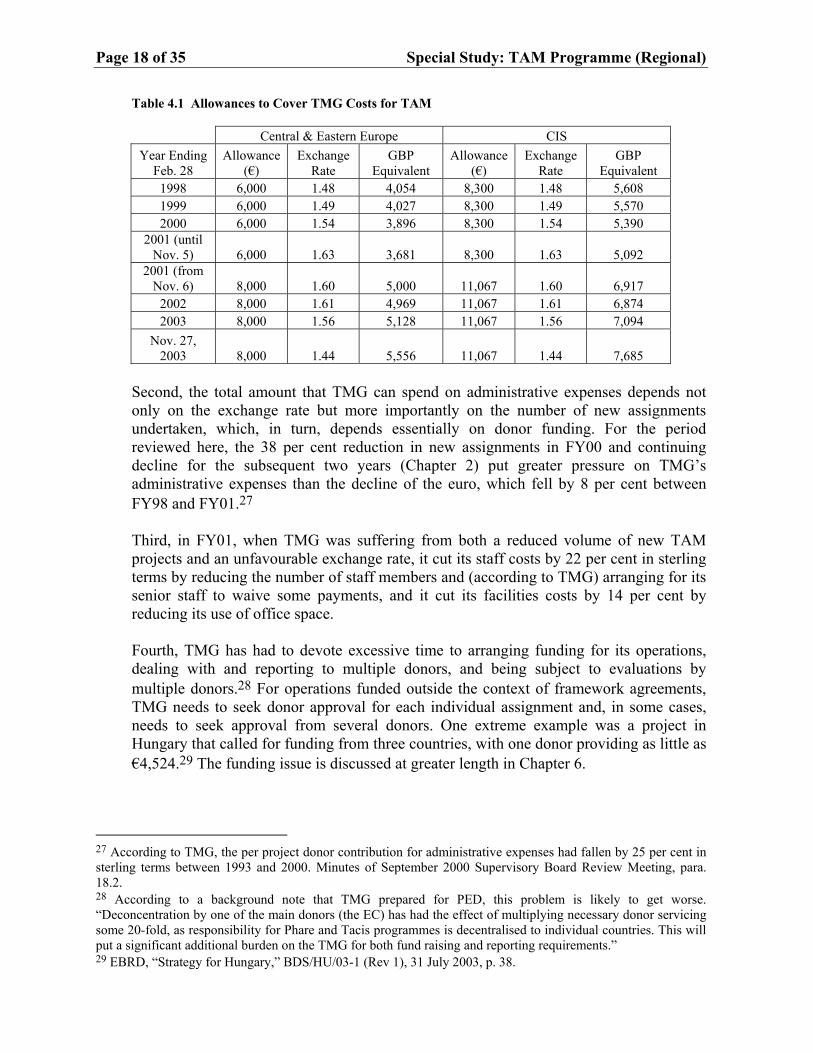
Nevertheless, aside from reporting that the donors allow a total of €60,000 per assignment in Central and Eastern Europe, €85,500 in the CIS countries, and €110,000 in Mongolia, TMG provides little useful information on the overall costs of the Programme (Chapter 7). The reports submitted to its Supervisory Board provide no summary information on the costs of the TTCCs, SIAs and other advisors, and the information provided on TMG’s own administrative costs cannot be used to assess TMG’s internal efficiency. Most of TMG’s headquarters’ staff serve both TAM and BAS, and TMG’s financial reports do not allocate its expenses between the two programmes. TMG’s headquarters staffing (including part time staff but excluding staff specifically assigned to BAS) fell from 14 in March 1998 to 13 in March 2003. But the number of TTCCs reported in TMG’s Organigrammes, who are paid for their work on a daily basis out of the budgets assigned to specific projects and whose costs are not reported in TMG’s Income and Expenditure Account, increased significantly during this period from 16 to 40. TMG’s administrative costs for the TAM and BAS Programmes combined increased gradually from €0.8 million for FY98 to €1.3 million for FY03 (Appendix 4.1).26 During this period, the average number of active TAM projects increased slightly, from 181 to 203, but the number of projects initiated by BAS increased sharply, from 130 to 776. The available information does not allow us to make any significant conclusions about TAM’s internal efficiency. Nevertheless, a few observations are possible. First, TMG’s administrative expenses are limited by the allowances from donor contributions for TAM and BAS. If TMG has sufficient cash reserves from earlier years or if the Bank is willing to treat accounts receivable from donors as the equivalent of cash, expenses can exceed these allowances for a year or two (as they did in FY98, FY00, and FY01), but cash constraints prevent them from doing so for an extended period. From 1993 through to November 2000, TMG received €6,000 for each project in Central and Eastern Europe and €8,300 for each project in the CIS. These sums were equivalent to about 11 per cent of the total cost allowed for each project. Since TMG’s expenses are incurred in sterling, however, the adequacy of these allowances depends, in part, on the exchange rate between the euro and sterling. Because of the decline in the value of the euro, the sterling equivalent of these allowances had fallen significantly by FY01. The donors, thus, agreed that TMG could retain €8,000 for each project in Central and Eastern Europe and €11,067 for each project in the CIS. Since the total donor contributions per project remained constant, TMG’s share increased to approximately 15 per cent. With the increased euro allowances and the strengthening of the euro, TMG’s per project allowances for administrative expenses are now 51 per cent higher in sterling terms than during most of 2000. As indicated earlier, TMG’s financial reports do not allow an assessment of whether TMG’s administrative expenditures per TAM project have increased by 51 per cent.
26 TMG’s financial years end on the last day of February each year.
Page 18 of 35 Special Study: TAM Programme (Regional)
Table 4.1 Allowances to Cover TMG Costs for TAM Central & Eastern Europe CIS Year Ending
Feb. 28 Allowance
(€) Exchange
Rate GBP
Equivalent Allowance
(€) Exchange
Rate GBP
Equivalent 1998 6,000 1.48 4,054 8,300 1.48 5,608 1999 6,000 1.49 4,027 8,300 1.49 5,570 2000 6,000 1.54 3,896 8,300 1.54 5,390
2001 (until Nov. 5) 6,000 1.63 3,681 8,300 1.63 5,092
2001 (from Nov. 6) 8,000 1.60 5,000 11,067 1.60 6,917
2002 8,000 1.61 4,969 11,067 1.61 6,874 2003 8,000 1.56 5,128 11,067 1.56 7,094
Nov. 27, 2003 8,000 1.44 5,556 11,067 1.44 7,685
Second, the total amount that TMG can spend on administrative expenses depends not only on the exchange rate but more importantly on the number of new assignments undertaken, which, in turn, depends essentially on donor funding. For the period reviewed here, the 38 per cent reduction in new assignments in FY00 and continuing decline for the subsequent two years (Chapter 2) put greater pressure on TMG’s administrative expenses than the decline of the euro, which fell by 8 per cent between FY98 and FY01.27 Third, in FY01, when TMG was suffering from both a reduced volume of new TAM projects and an unfavourable exchange rate, it cut its staff costs by 22 per cent in sterling terms by reducing the number of staff members and (according to TMG) arranging for its senior staff to waive some payments, and it cut its facilities costs by 14 per cent by reducing its use of office space. Fourth, TMG has had to devote excessive time to arranging funding for its operations, dealing with and reporting to multiple donors, and being subject to evaluations by multiple donors.28 For operations funded outside the context of framework agreements, TMG needs to seek donor approval for each individual assignment and, in some cases, needs to seek approval from several donors. One extreme example was a project in Hungary that called for funding from three countries, with one donor providing as little as €4,524.29 The funding issue is discussed at greater length in Chapter 6.
27 According to TMG, the per project donor contribution for administrative expenses had fallen by 25 per cent in sterling terms between 1993 and 2000. Minutes of September 2000 Supervisory Board Review Meeting, para. 18.2. 28 According to a background note that TMG prepared for PED, this problem is likely to get worse. “Deconcentration by one of the main donors (the EC) has had the effect of multiplying necessary donor servicing some 20-fold, as responsibility for Phare and Tacis programmes is decentralised to individual countries. This will put a significant additional burden on the TMG for both fund raising and reporting requirements.” 29 EBRD, “Strategy for Hungary,” BDS/HU/03-1 (Rev 1), 31 July 2003, p. 38.
Special Study: TAM Programme (Regional) Page 19 of 35
5. COSTS AND BENEFITS
As indicated in Chapter 3, the mean incremental profit for 2002 reported by the 13 companies responding to the counter-factual question was US$ 250,000 per company, and the median was US$ 150,000. Moreover, applying the ratio of incremental profits to incremental sales for the 13 companies to the incremental sales of the 34 companies providing this information, incremental annual profits might be US$ 230,000 to US$ 430,000 per company. Even if these figures were adjusted to take into consideration the lack of impact for the unsatisfactory assignments, the annual benefits would still far exceed the one-time costs of €60,000 to €85,500 per assignment. Both the financial and the economic internal rates of return on the TC costs are likely to exceed 100 per cent per year and support this evaluation’s recommendation for introducing a scheme for cost recovery from clients, possibly to be tested initially on a pilot basis, and considering a scaling of recovery rates as deemed appropriate (see Section 6.2 for further details). Three factors account for the unusually high cost effectiveness of the TAM Programme. First, most of TAM’s clients were operating inefficiently and well below capacity before TAM began to assist them. The opportunities for improvement were significant. Second, the Programme generates benefits from existing assets, with little new investment. The incremental costs are minimal. Third, the Programme benefits from the contributions of retired high-level executives, typically from the same industry, who receive only modest fees. These fees are well below the level that would be charged for consultants with comparable experience by major private firms.
6. TAM’s SUSTAINABILITY 6.1 DEPENDENCE ON DONOR FUNDING
TAM’s activities have been financed to date entirely by donor grants. Up to July 2003, donors had allocated a total of €66.3 million, including €50.6 million (76 per cent) under framework agreements, which TAM can use without seeking further donor approvals, and €15.8 million (24 per cent) under bilateral grants.30 During 2002, TAM accounted for €12.5 million of the €102 million raised for the Bank’s broader Technical Cooperation Funds Programme (TCFP).31 The European Union, mainly through Phare and Tacis, has been the principal source of funding, accounting for 53 per cent of the total (Appendix 6.1). The Bank itself does not contribute.32
30 TMG, Working Papers for September 2003 Supervisory Board Review Meeting. 31 Overall donor commitments from EBRD, Technical Cooperation: Helping Build a Brighter Future, EBRD Report to the Donor and Official Co-Financing Community, 2002-03, p. 15. Commitments for TAM from TMG email dated November 6, 2003. 32 The Bank provides facilities and other services, but TAM pays for these services out of the funds received from donors. TMG’s semi-annual reports since March 1999, however, have shown a commitment to TAM of €65,000 from EBRD itself. Although Article 36.1 of the Agreement Establishing the European Bank for Reconstruction and Development restricts allocation or distribution of the Bank’s net income, Article 2.1 provides a sufficient basis for the Bank to incur technical assistance expenditures as part of its general administrative expenses.
Page 20 of 35 Special Study: TAM Programme (Regional)
As is the case for other Bank units, TMG has to complete a series of steps to mobilise donor funding. Problems in completing these steps have contributed to the decline in TMG’s volume of operations (Section 2.1).
•
•
•
•
TMG has to seek the agreement in principle of individual donors for framework agreements. The amounts that donors are willing to provide set the ceiling for TAM’s funding. It has to seek the approval of the Bank’s Technical Cooperation (TC) Review Committee. Although this process does not affect funding specifically dedicated to TAM, it can reduce the funding available to TAM from grants to the Bank’s TCFP as a whole because of the priority the Bank gives to TC activities that contribute directly to its investment operations.33 Once the funding has been agreed in principle, the legal documentation has to be drawn up, negotiated, and signed. This process, which affects all TC grants, can result in significant delays. As of March 2001, TMG was still awaiting the Addendum to the Financing Memorandum for the funds allocated under Phare Bangkok 2000, and as of March 2002 it was still awaiting the Addendum to the Financing Memorandum for the funds allocated under Phare 2001 (which had been approved in July 2000).34 TMG has to seek donor authorisation for each individual assignment funded under bilateral grants administered by the EBRD. Most bilateral donors impose conditions on the countries for which the funds may be used and the nationality of the advisors used. Matching the needs of individual assignments with the constraints imposed by the donors stretches the capabilities of TMG’s staff, causes material delays, and limits the volume of activities that TAM can undertake.35
Even after completing these steps, TAM cannot always count on the funding allocated. For example, in January 2000, Phare notified the Bank that €1.45 million allocated under the Bangkok 1997 TC programme would not be available for assignments contracted after December 1999. Similarly, the Russian Privatisation Centre cancelled €0.51 million not drawn at the expiration of the contract period.36
33 See PED, “Special Study: Evaluation of the Bank’s Technical Co-operation Funds Programme (TCFP),” July 2000, Appendix 1. In addition, the Evaluation Team’s reading of the “Highlights” section of EBRD’s latest Annual Report on TC supports the view that TC is seen primarily as a means of supporting the Bank’s investment operations. EBRD, Technical Cooperation: Helping Build a Brighter Future, EBRD Report to the Donor and Official Co-Financing Community, 2002-03, pp. 8-10. 34 TMG, minutes of Supervisory Board Review Meetings for March 2001 and March 2002. 35 At the September 1998 Supervisory Board Review Meeting, TMG reported, “ . . . it has taken 45 days, on average, from the date of receipt of a signed enterprise agreement to obtain approval for a bi-laterally funded project, compared to nine days for projects funded under Framework Agreements. On occasions, funding approval has taken so long to obtain that the chosen SIA has lost patience or the enterprise has lost interest and the project has had to be abandoned.” 36 TMG, minutes of Supervisory Board Review Meetings for March 1998, September 2001, September 2002, and March 2003 and annexes. In the Working Papers circulated to the Supervisory Board, TMG showed the full amounts allocated under the Bangkok TC Programme and by the Russian Privatisation Centre (a) as commitments by donors and (b) as having been expended or committed by TMG. After these funds were no longer available, TMG’s reports showed a reduction in commitments by donors and a reduction in the amounts expended or
Special Study: TAM Programme (Regional) Page 21 of 35
The minutes of TMG’s Supervisory Board consistently refer to funding problems and, particularly in the past few years, have called into question the sustainability of the TAM Programme.37 Indeed, inadequate donor funding could prevent TAM from undertaking enough new assignments to cover its administrative expenses (including rent and other charges for services provided by the Bank) and could, thus, make it necessary to close down the Programme. TMG estimates that it needs sufficient funding for 100-120 TAM projects per year to be able to cover its fixed costs. Moreover, unreliable funding has limited TAM’s ability to serve more of the companies that might need its services, and the considerable management efforts needed to access this funding have diverted management attention away from TMG’s core activities. Since 1998, TMG has been talking about dealing with one of its funding problems – the need to seek donor approval for individual assignments funded by the EBRD-administered bilateral grants.38 It has significantly shifted the balance between funding under framework agreements and bilateral authorisations, reducing bilateral authorisations from 58 per cent of new funding for 1999-2001, to 7 per cent for 2002-2003. It takes understandable pride in its ability to develop programmes to match donor priorities, particularly under framework agreements. But TMG and the EBRD have not developed adequate arrangements in terms of providing multi-year funding that can be used for a wide range of countries of operation, that is not tied to use of advisors from specific donor countries, and that can reduce its own administrative burdens. TAM’s sustainability remains uncertain, and the time that needs to be devoted to fund-raising and dealing with donors remains excessive.
6.2 COST RECOVERY FROM CLIENTS TAM might be able to reduce its funding constraints if it were to seek to recover a larger share of the costs of its services. To date, TAM has called on its clients only to cover the costs of translators and local transport. It has used donor funding for the fees paid to the advisors, the costs of international travel, local subsistence costs and its own overhead costs. Calling for clients to pay more would generate cash to support TAM’s activities and might make some donors more willing to provide funding. Indeed, a representative of one potentially important donor specifically said that his country was reluctant to reactivate its role as a contributor because TAM was purely grant-based, not requiring any substantive contribution by clients, even when the company benefited substantially from the assistance. And the reduction in funding from the Russian Privatisation Centre has been attributed to “a condition imposed by the Russian Ministry of Finance that would require enterprises to guarantee repayment of the costs of the TAM projects.”39
committed by TMG. The sources and uses of funds in these cases should presumably have been described as allocations, rather than commitments. 37 TMG, minutes of Supervisory Board Review Meetings for March 2002 and March 2003. 38 TMG, minutes of Supervisory Board Review Meetings for September 1998, March 1999, March 2001 and March 2003. 39 PED, “Mid-Term Review of TurnAround Management (TAM) Programme, Feb. 1998, p. 2.
Page 22 of 35 Special Study: TAM Programme (Regional)
TMG strongly opposes any cost sharing (beyond the costs of translators and local transport), but the Evaluation Team is not convinced by its arguments (summarised in Appendix 6.2) convincing. TMG’s arguments may call for phasing in the extent of cost recovery and exempting some clients, and the Evaluation Team would support these qualifications. But these arguments cannot justify, for example, the provision of free TAM services for a second assignment serving a company with annual pre-tax profits of US$ 6 million at the time of screening. Whether TAM’s undertaking of a second assignment for this company was justified or not,40 TMG’s arguments against requiring companies like this to share in the costs are far from persuasive. Indeed, most donor-funded advisory services call for some cost sharing, including TMG’s own BAS Programme and the bilateral management advisory programmes reviewed in Appendix 1.4.
Increasing the extent of cost recovery would not only contribute to TMG’s ability to continue providing TAM services, but would also help bring the Programme in line with current economic thinking on subsidies. Generally, subsidies to enterprises are justified only to the extent that (a) the expected incremental social benefits are greater than the expected incremental social costs (including the opportunity cost of the subsidies); and (b) the expected incremental private benefits are less than the expected incremental private costs so that, absent the subsidy, the expenditures would not be made. As noted in the chapter on costs and benefits, the incremental private benefits from a TAM assignment typically exceed the incremental private costs and even the incremental social costs, i.e., the full cost of the advisory services. Indeed, TMG implicitly expects this outcome when it decides to provide services to a company. Many clients, however, may not be familiar with the benefits that can be derived from the use of consulting or advisory services. These companies may underestimate the likely benefits. Some subsidies may be justified in these cases, though the subsidies need not necessarily be as high as they are now. In other cases, involving, for instance, more sophisticated companies or companies seeking a follow-up TAM project, subsidies may not be justified.
40 TAM’s screening report for the first assignment had noted the company “seems very advanced in western management terms” for a company in an accession country. Based on the field visit, the Evaluation Team’s judgment was that the company accepted TAM because it was free of charge and that the company’s commitment to the Programme was half hearted. Indeed, in response to a series of questions on whether the company had made any changes as a result of TAM’s advice, the company responded negatively except with respect to having changed its accounting or management information systems or financial controls.
Special Study: TAM Programme (Regional) Page 23 of 35
7. REPORTING AND EVALUATION 7.1 REPORTING
TMG provides extensive information to the EBRD and the donors by means of the working papers and exhibits circulated for the semi-annual Supervisory Board Review Meetings and the oral reports made at these meetings. These reports have improved over the past few years, but more could be done, particularly to facilitate a reader’s understanding of TAM’s performance, the problems it is facing, and issues requiring consideration by the EBRD, TMG’s Board and the donors more broadly. First, the information provided in both the working papers and exhibits is highly detailed, presumably reflecting the desire of individual donors for information relating to their specific contributions. Important points, however, may get lost because of the details, and (judging from the meeting minutes) TMG ends up using the bulk of the time in the meetings reporting on what has happened, rather than encouraging discussion of issues. Second, although TMG, in reaction to a request by a Board member, now provides information showing the trends for overall TAM and BAS funding and funding by region, it does not provide information on medium-term trends in (i) funding under framework agreements and bilateral authorisations; (ii) the number of projects initiated, in progress and completed; (iii) TMG’s income and expenditures; or (iv) the composition of its pre-qualified database of advisors and advisors contracted. Third, a number of difficulties arise from TMG’s current Board presentations:
• The wording used has sometimes been insufficiently precise. For example, TMG had shown the full amounts allocated under the Bangkok TC Programme and by the Russian Privatisation Centre (a) as commitments by donors and (b) as having been expended or committed by TMG. After these funds were no longer available, TMG’s reports showed a reduction in commitments by donors and a reduction in the amounts expended or committed by TMG. Regardless of how others may have used the term “committed” at the time, TMG should have labelled the amounts as allocations, rather than commitments.
• Some issues are covered partly in the working papers and partly in the exhibits. For example, the information on what TAM has done is split between the TAM Project Activity Status report in the working papers and the TAM Projects – New Starts report in the exhibits. Similarly, new funding received is covered in the working papers, but funding initiatives being undertaken is covered in the exhibits. Splitting this information makes it more difficult for the reader to use.
• Although TMG reports on “New Starts” and “Income & Expenditure” based on its financial years ending in February, it reports on funding, project activity, advisors, etc. as of the end of January.
Fourth, TMG’s Income and Expenditure reports provide little information. A comparison with the published audited financial statements for the U.S. International Executive
Page 24 of 35 Special Study: TAM Programme (Regional)
Service Corps, British Executive Service Overseas, and Canadian Executive Services Overseas and the findings of this evaluation suggest a number of things that could be done to make TMG’s financial statements more informative. Appendix 7.1 sets forth a framework that TMG might use for financial reporting. Adopting this format, however, would involve additional costs and, in light of TMG’s tight budget, the Supervisory Board would need to consider whether the value of the additional information would be likely to justify the additional costs. Fifth, the Income and Expenditure reports provided to TMG’s Board appear to be based on estimates for the final two to three months of TMG’s financial year, rather than the final figures, and, although receipts and expenditures for individual grants are covered by the EBRD’s external auditors, TMG’s financial statements themselves are not reviewed by the auditors. TMG’s activities are not material from the point of view of the EBRD’s overall operations, but they are material from the point of view of the donors. The Bank’s obligations to the donors should include external auditing of special purpose TC vehicles, such as TAM.
7.2 EVALUATION 7.2.1 Evaluation system
TMG has had an evaluation system from the outset of its operations.41 The system calls for: (1) the client company’s chief executive to fill out a questionnaire giving his views on the Programme; (2) the SIA to assign ratings for the quality of services delivered, the impact, and an overall rating; (3) the TTCC to assign ratings and provide comments; (4) the Project Evaluation Advisor, based on a desk review, to assign an overall project impact rating, reflecting his judgments on the quality of the services provided by the TAM advisors and the achievement of TAM’s overall objectives and the objectives for the individual assignment; and (5) the TMG Executive Director, Operations, to clear the Final Evaluation Form reflecting these judgments. (See Appendix 7.2.) Although relatively commendable in many respects, the system does not fully meet current evaluation standards. First, TMG’s Project Evaluation Advisor does not have a Board-approved mandate providing for TMG’s Board to oversee his work; ensuring his independence and autonomy, and authorising him to transmit his final products to the TMG Board without any clearance from management.42 Second, the rating system blurs the distinction between what TMG does (the performance of TAM’s delivery system) and what the results are (results on the ground, impacts). The MDB Good Practice Standards clearly distinguish between project performance and
41 In addition, TAM has been subject to external evaluations by PED and others. The Evaluation Team has seen SDA Bocconi, Graduate School of Management, “TurnAround Management Programme: Programme Review,” September 1994; Phare, OMAS Central Unit, “Regional TurnAround Management Programme: Annual Assessment Report,” ZZ-9431, April 1997; and PED, “Mid-term Review of TurnAround Management Programme,” February 1998. 42 Multilateral Development Bank (MDB) Evaluation Cooperation Group, Working Group on Evaluation Criteria and Ratings for Public Sector Evaluation, n.d. pp. 4-5.
Special Study: TAM Programme (Regional) Page 25 of 35
MDB performance.43 Combining them yields less information than assigning separate ratings. Third, the system does not specify the criteria to be used for the rating judgments.44 Fourth, for normal projects, the system uses a scale with only three options for the overall ratings – one negative (unsatisfactory) and two positive (satisfactory and highly satisfactory). It appears to use a four-point scale, but one of the ratings is for projects that have been terminated prematurely, which (through July 2003) represented 8.7 per cent of the total, and is thus, not available for projects that continue for the full term. As in any scale with an odd number of rankings, the persons assigning ratings tend to select the middle option.45 Fifth, despite TMG’s intentions (and the evaluation procedures for the Bank overall), the system has not been systematically drawing and recording lessons from the evaluation work. Since 2002, the Senior Evaluation Advisor has been providing TMG’s Board with comments on projects rated highly satisfactory or unsatisfactory. These comments explain the reasons for the unsatisfactory ratings but do not draw prescriptive lessons focusing on what TMG might have done (or might do in future cases) to obtain better results.46 Sixth, contrary to TMG’s Rules and Regulations and the Good Practice Standards, the reports to TMG’s Supervisory Board provide information on the performance of individual clients and name those clients. Provision of this information breaches TMG’s obligations of confidentiality, particularly since the reports go not only to TMG Board members but also to the EBRD staff members, the EBRD Members of the Board (including those from countries where client companies are located), and donors.47
7.2.2 Evaluation results From the inception of TAM through July 2003, TMG’s Project Evaluation Advisor has rated 81 per cent of TAM’s closed projects, or 88.5 per cent of its normally closed projects, as satisfactory or highly satisfactory:
43 Op. cit., p. 8. 44 Op. cit., pp. 10-11. 45 Op. cit., p. 10. TMG changed its earlier five-point scale to this four-point scale in 2001 “to conform to the Bank’s PED rating system.” (Minutes of March 2001 Supervisory Board Review Meeting.) This change may have brought TMG into line with the form of PED’s system but not the substance. 46 Multilateral Development Banks, Evaluation Cooperation Group, Working Group on Private Sector Evaluation, “MDB-ECG Good-Practice Standards for Evaluation of Private Sector Investment Operations, Second Edition,” May 2003, p. 20. 47 Op. cit., p. 23, and TMG, Rules and Regulations, para. 2.3.
Page 26 of 35 Special Study: TAM Programme (Regional)
Table 7.1 Ratings assigned by project evaluation advisor
Rating % of projects closed % of normal projects 1. Terminated prematurely 8.7% Not applicable 2. Unsatisfactory 10.5% 11.5% 3. Satisfactory 45.6% 49.9% 4. Highly Satisfactory 35.2% 38.6% Total 100.0% 100.0%
Based on the field visits (and ignoring incomplete projects, three projects with overdue ratings, and two projects where no opinion was possible), the Evaluation Team concurred with 84 per cent of TMG’s ratings. The Evaluation Team assigned lower ratings for only six of the companies visited. The differences may have arisen because the Evaluation Team’s assessments were generally made well after the TMG’s. Four of the six projects on which the Evaluation Team disagreed were completed in 1999-2001, one in 2002, and one in 2003.
8. COLLABORATION WITHIN THE BANK Although TMG’s Rules and Regulations call for it to “liaise closely with the Bank in all aspects of the TAM Programme.” the Evaluation Team found widespread perceptions that little collaboration takes place. Donors, Members of the Board, Bank managers, and TMG managers all criticised the inadequate collaboration. One Bank manager, for example, commented, “TMG exists to satisfy the needs of donors” and just “lives here.” And one TMG manager lamented, “TMG is an orphan,” and added, “Integration, alignment and communication with other parts of the Bank is probably best described as disastrous.” The actual situation is more complex. TAM and the Bank have jointly served a small number of clients and have introduced a significant number of potential clients to each other. But TAM has generally been ignored in the Bank’s strategies. TMG indicates that it coordinates its policy dialogue activities with the Bank and seeks to provide inputs to the Bank’s thinking on policy issues.48
8.1 JOINT CLIENTS Only 32 companies have received a combination of a financial commitment from the Bank (or investment funds making commitments for the account of the Bank) and technical assistance from TAM. These joint clients represent roughly 0.3 per cent of the companies served by TAM since its creation. A larger number of TAM clients, however, may have benefited from indirect Bank financing, through investment funds or financial intermediaries supported by the Bank. Indeed, The Bank’s Vice President, Operational and Environmental Support, indicated in September 2002, “TAM enterprises had been able to attract . . . about €450 million via the EBRD and the EBRD-financed
48 The evaluation has not independently confirmed this statement.
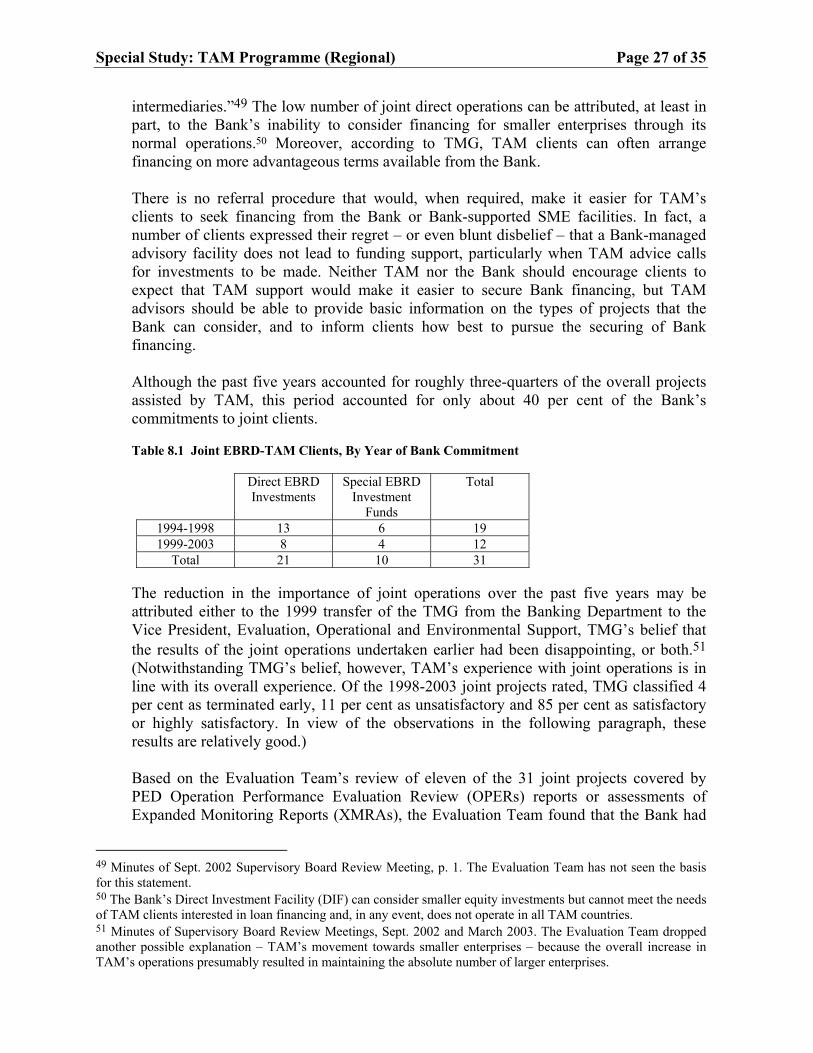
Special Study: TAM Programme (Regional) Page 27 of 35
intermediaries.”49 The low number of joint direct operations can be attributed, at least in part, to the Bank’s inability to consider financing for smaller enterprises through its normal operations.50 Moreover, according to TMG, TAM clients can often arrange financing on more advantageous terms available from the Bank. There is no referral procedure that would, when required, make it easier for TAM’s clients to seek financing from the Bank or Bank-supported SME facilities. In fact, a number of clients expressed their regret – or even blunt disbelief – that a Bank-managed advisory facility does not lead to funding support, particularly when TAM advice calls for investments to be made. Neither TAM nor the Bank should encourage clients to expect that TAM support would make it easier to secure Bank financing, but TAM advisors should be able to provide basic information on the types of projects that the Bank can consider, and to inform clients how best to pursue the securing of Bank financing. Although the past five years accounted for roughly three-quarters of the overall projects assisted by TAM, this period accounted for only about 40 per cent of the Bank’s commitments to joint clients. Table 8.1 Joint EBRD-TAM Clients, By Year of Bank Commitment
Direct EBRD
Investments Special EBRD
Investment Funds
Total
1994-1998 13 6 19 1999-2003 8 4 12
Total 21 10 31 The reduction in the importance of joint operations over the past five years may be attributed either to the 1999 transfer of the TMG from the Banking Department to the Vice President, Evaluation, Operational and Environmental Support, TMG’s belief that the results of the joint operations undertaken earlier had been disappointing, or both.51 (Notwithstanding TMG’s belief, however, TAM’s experience with joint operations is in line with its overall experience. Of the 1998-2003 joint projects rated, TMG classified 4 per cent as terminated early, 11 per cent as unsatisfactory and 85 per cent as satisfactory or highly satisfactory. In view of the observations in the following paragraph, these results are relatively good.) Based on the Evaluation Team’s review of eleven of the 31 joint projects covered by PED Operation Performance Evaluation Review (OPERs) reports or assessments of Expanded Monitoring Reports (XMRAs), the Evaluation Team found that the Bank had
49 Minutes of Sept. 2002 Supervisory Board Review Meeting, p. 1. The Evaluation Team has not seen the basis for this statement. 50 The Bank’s Direct Investment Facility (DIF) can consider smaller equity investments but cannot meet the needs of TAM clients interested in loan financing and, in any event, does not operate in all TAM countries. 51 Minutes of Supervisory Board Review Meetings, Sept. 2002 and March 2003. The Evaluation Team dropped another possible explanation – TAM’s movement towards smaller enterprises – because the overall increase in TAM’s operations presumably resulted in maintaining the absolute number of larger enterprises.
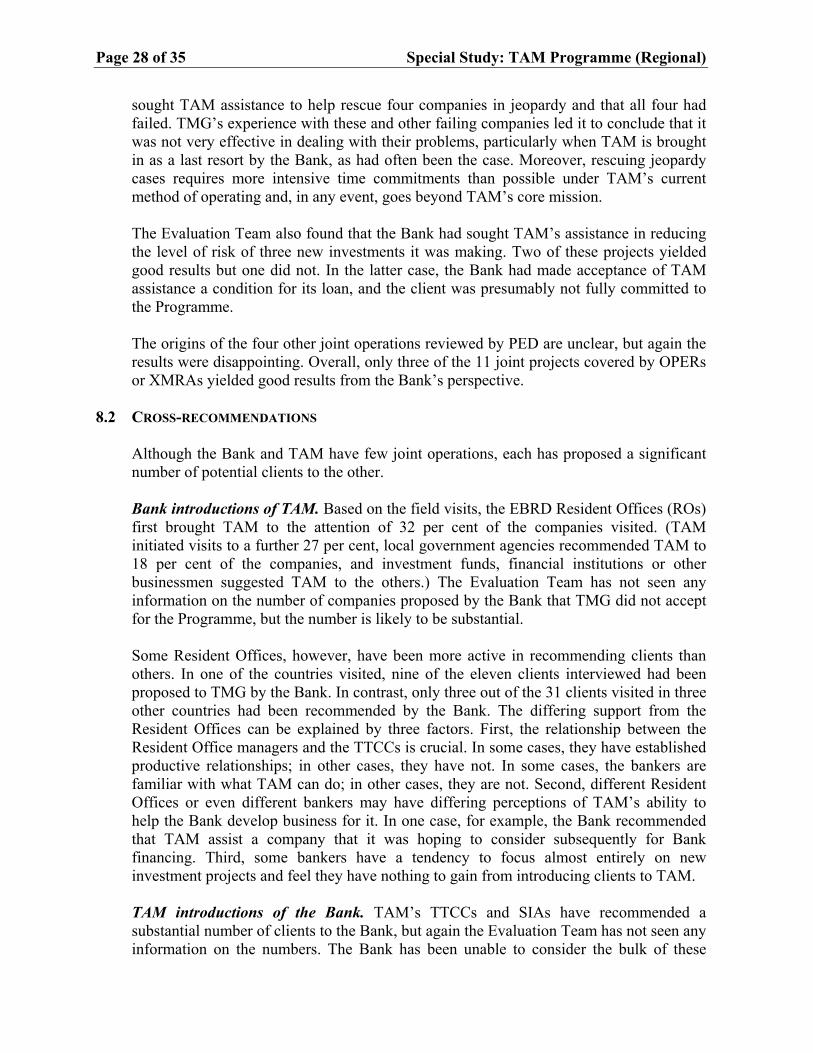
Page 28 of 35 Special Study: TAM Programme (Regional)
sought TAM assistance to help rescue four companies in jeopardy and that all four had failed. TMG’s experience with these and other failing companies led it to conclude that it was not very effective in dealing with their problems, particularly when TAM is brought in as a last resort by the Bank, as had often been the case. Moreover, rescuing jeopardy cases requires more intensive time commitments than possible under TAM’s current method of operating and, in any event, goes beyond TAM’s core mission. The Evaluation Team also found that the Bank had sought TAM’s assistance in reducing the level of risk of three new investments it was making. Two of these projects yielded good results but one did not. In the latter case, the Bank had made acceptance of TAM assistance a condition for its loan, and the client was presumably not fully committed to the Programme. The origins of the four other joint operations reviewed by PED are unclear, but again the results were disappointing. Overall, only three of the 11 joint projects covered by OPERs or XMRAs yielded good results from the Bank’s perspective.
8.2 CROSS-RECOMMENDATIONS Although the Bank and TAM have few joint operations, each has proposed a significant number of potential clients to the other. Bank introductions of TAM. Based on the field visits, the EBRD Resident Offices (ROs) first brought TAM to the attention of 32 per cent of the companies visited. (TAM initiated visits to a further 27 per cent, local government agencies recommended TAM to 18 per cent of the companies, and investment funds, financial institutions or other businessmen suggested TAM to the others.) The Evaluation Team has not seen any information on the number of companies proposed by the Bank that TMG did not accept for the Programme, but the number is likely to be substantial. Some Resident Offices, however, have been more active in recommending clients than others. In one of the countries visited, nine of the eleven clients interviewed had been proposed to TMG by the Bank. In contrast, only three out of the 31 clients visited in three other countries had been recommended by the Bank. The differing support from the Resident Offices can be explained by three factors. First, the relationship between the Resident Office managers and the TTCCs is crucial. In some cases, they have established productive relationships; in other cases, they have not. In some cases, the bankers are familiar with what TAM can do; in other cases, they are not. Second, different Resident Offices or even different bankers may have differing perceptions of TAM’s ability to help the Bank develop business for it. In one case, for example, the Bank recommended that TAM assist a company that it was hoping to consider subsequently for Bank financing. Third, some bankers have a tendency to focus almost entirely on new investment projects and feel they have nothing to gain from introducing clients to TAM. TAM introductions of the Bank. TAM’s TTCCs and SIAs have recommended a substantial number of clients to the Bank, but again the Evaluation Team has not seen any information on the numbers. The Bank has been unable to consider the bulk of these
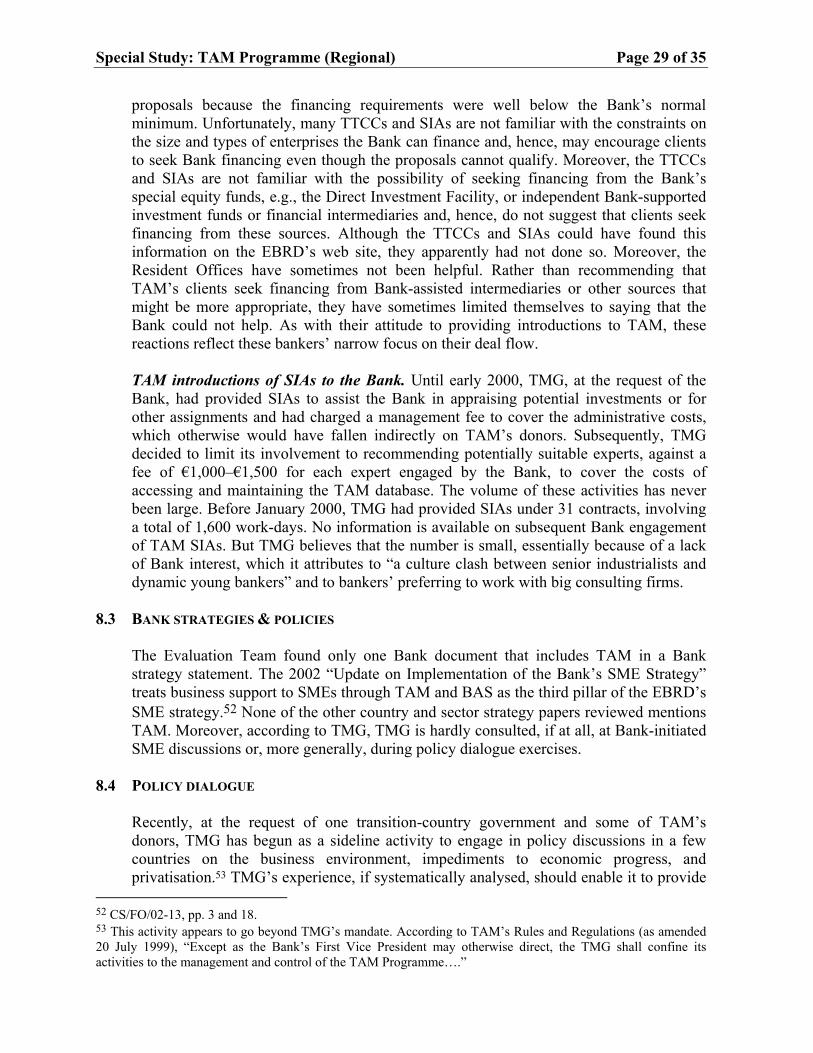
Special Study: TAM Programme (Regional) Page 29 of 35
proposals because the financing requirements were well below the Bank’s normal minimum. Unfortunately, many TTCCs and SIAs are not familiar with the constraints on the size and types of enterprises the Bank can finance and, hence, may encourage clients to seek Bank financing even though the proposals cannot qualify. Moreover, the TTCCs and SIAs are not familiar with the possibility of seeking financing from the Bank’s special equity funds, e.g., the Direct Investment Facility, or independent Bank-supported investment funds or financial intermediaries and, hence, do not suggest that clients seek financing from these sources. Although the TTCCs and SIAs could have found this information on the EBRD’s web site, they apparently had not done so. Moreover, the Resident Offices have sometimes not been helpful. Rather than recommending that TAM’s clients seek financing from Bank-assisted intermediaries or other sources that might be more appropriate, they have sometimes limited themselves to saying that the Bank could not help. As with their attitude to providing introductions to TAM, these reactions reflect these bankers’ narrow focus on their deal flow. TAM introductions of SIAs to the Bank. Until early 2000, TMG, at the request of the Bank, had provided SIAs to assist the Bank in appraising potential investments or for other assignments and had charged a management fee to cover the administrative costs, which otherwise would have fallen indirectly on TAM’s donors. Subsequently, TMG decided to limit its involvement to recommending potentially suitable experts, against a fee of €1,000–€1,500 for each expert engaged by the Bank, to cover the costs of accessing and maintaining the TAM database. The volume of these activities has never been large. Before January 2000, TMG had provided SIAs under 31 contracts, involving a total of 1,600 work-days. No information is available on subsequent Bank engagement of TAM SIAs. But TMG believes that the number is small, essentially because of a lack of Bank interest, which it attributes to “a culture clash between senior industrialists and dynamic young bankers” and to bankers’ preferring to work with big consulting firms.
8.3 BANK STRATEGIES & POLICIES The Evaluation Team found only one Bank document that includes TAM in a Bank strategy statement. The 2002 “Update on Implementation of the Bank’s SME Strategy” treats business support to SMEs through TAM and BAS as the third pillar of the EBRD’s SME strategy.52 None of the other country and sector strategy papers reviewed mentions TAM. Moreover, according to TMG, TMG is hardly consulted, if at all, at Bank-initiated SME discussions or, more generally, during policy dialogue exercises.
8.4 POLICY DIALOGUE Recently, at the request of one transition-country government and some of TAM’s donors, TMG has begun as a sideline activity to engage in policy discussions in a few countries on the business environment, impediments to economic progress, and privatisation.53 TMG’s experience, if systematically analysed, should enable it to provide
52 CS/FO/02-13, pp. 3 and 18. 53 This activity appears to go beyond TMG’s mandate. According to TAM’s Rules and Regulations (as amended 20 July 1999), “Except as the Bank’s First Vice President may otherwise direct, the TMG shall confine its activities to the management and control of the TAM Programme….”
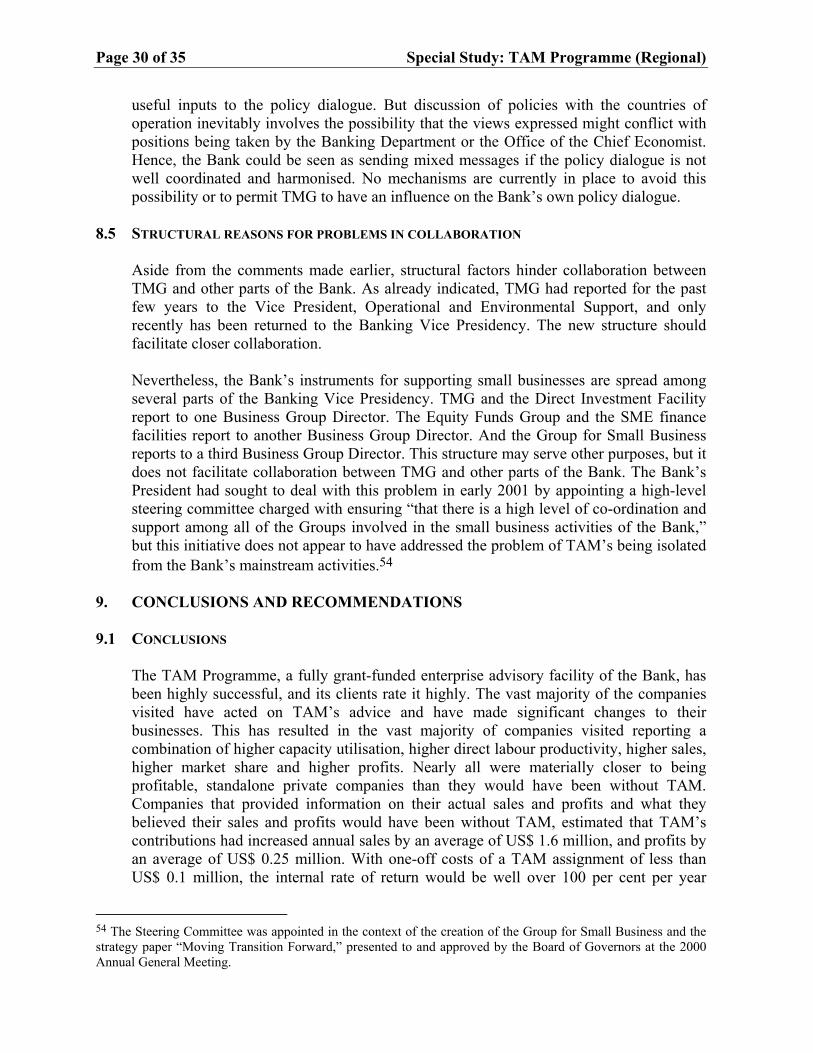
Page 30 of 35 Special Study: TAM Programme (Regional)
useful inputs to the policy dialogue. But discussion of policies with the countries of operation inevitably involves the possibility that the views expressed might conflict with positions being taken by the Banking Department or the Office of the Chief Economist. Hence, the Bank could be seen as sending mixed messages if the policy dialogue is not well coordinated and harmonised. No mechanisms are currently in place to avoid this possibility or to permit TMG to have an influence on the Bank’s own policy dialogue.
8.5 STRUCTURAL REASONS FOR PROBLEMS IN COLLABORATION Aside from the comments made earlier, structural factors hinder collaboration between TMG and other parts of the Bank. As already indicated, TMG had reported for the past few years to the Vice President, Operational and Environmental Support, and only recently has been returned to the Banking Vice Presidency. The new structure should facilitate closer collaboration. Nevertheless, the Bank’s instruments for supporting small businesses are spread among several parts of the Banking Vice Presidency. TMG and the Direct Investment Facility report to one Business Group Director. The Equity Funds Group and the SME finance facilities report to another Business Group Director. And the Group for Small Business reports to a third Business Group Director. This structure may serve other purposes, but it does not facilitate collaboration between TMG and other parts of the Bank. The Bank’s President had sought to deal with this problem in early 2001 by appointing a high-level steering committee charged with ensuring “that there is a high level of co-ordination and support among all of the Groups involved in the small business activities of the Bank,” but this initiative does not appear to have addressed the problem of TAM’s being isolated from the Bank’s mainstream activities.54
9. CONCLUSIONS AND RECOMMENDATIONS
9.1 CONCLUSIONS The TAM Programme, a fully grant-funded enterprise advisory facility of the Bank, has been highly successful, and its clients rate it highly. The vast majority of the companies visited have acted on TAM’s advice and have made significant changes to their businesses. This has resulted in the vast majority of companies visited reporting a combination of higher capacity utilisation, higher direct labour productivity, higher sales, higher market share and higher profits. Nearly all were materially closer to being profitable, standalone private companies than they would have been without TAM. Companies that provided information on their actual sales and profits and what they believed their sales and profits would have been without TAM, estimated that TAM’s contributions had increased annual sales by an average of US$ 1.6 million, and profits by an average of US$ 0.25 million. With one-off costs of a TAM assignment of less than US$ 0.1 million, the internal rate of return would be well over 100 per cent per year
54 The Steering Committee was appointed in the context of the creation of the Group for Small Business and the strategy paper “Moving Transition Forward,” presented to and approved by the Board of Governors at the 2000 Annual General Meeting.
Special Study: TAM Programme (Regional) Page 31 of 35
(without even considering the contributions towards transition costs). Few TC programmes are likely to generate comparable returns. Despite this level of success, TAM is totally dependent on donor funding, and the unreliability of this funding threatens its sustainability, constrains its ability to meet the demand for its services, and reduces its efficiency. TMG has had to deal with this issue from the Programme’s inception in 1993. Over its first 10 years, it has mobilised a total of €66 million, and in the past few years, it has successfully increased the relative importance of funding under framework agreements. Still, TMG and the Bank have not yet developed adequate arrangements providing multi-year funding that can be used for a wide range of countries, that is not tied to the use of advisors from specific donor countries, and that can reduce its own administrative burdens. The evaluation also expressed concern about a number of other issues: • TAM’s provision of donor-funded services to foreign controlled enterprises, very
large enterprises, and enterprises owned by large business groups; • TAM’s very low cost recovery from clients; • TAM’s having to rely on operating cost allocations that may or may not be
adequate, depending on the Euro/GBP exchange rate and the volume of new assignments;
• TAM’s attention to environmental concerns; • Governance, reporting and evaluation arrangements; and • TAM’s integration within the Bank.
9.2 RECOMMENDATIONS
The recommendations drawn from this evaluation55 are as follows: Funding. A multi-year, multi-donor facility would reduce the uncertainty regarding TAM’s sustainability, enable TAM to serve more clients, and reduce inefficiencies.56 Arranging a multi-year, multi-donor facility will require preparation of a three- to five-year business plan, a Bank-supported effort to convince donors to participate in the facility, periodic donors’ meetings to present the programme and call for pledges, and greater visibility to TAM’s accomplishments and the donors’ role in making the accomplishments possible. Recommendation With active support by the Bank’s senior Management, TMG and the Bank’s Official Co-financing Unit should jointly give top priority to arranging a three- to five-year multi-donor facility that would provide funding usable for a wide range of countries and not tied to use of advisors from specific donor countries.
55 The 1997 PED evaluation made a number of recommendations. TMG has adopted some of these recommendations, but not others (Appendix 8.1). 56 Among other things, in the context of a multi-donor, multi-year facility, it should be possible to arrange for a single evaluation to serve the needs of each of the individual donors. IFC has succeeded in doing so in the context of its project development facilities that is comparable to the TAM Programme.
Page 32 of 35 Special Study: TAM Programme (Regional)
Bank contributions to TAM. . The prospects of generating donor support for a multi-year, multi-donor facility may depend in part on the Bank’s willingness to contribute to the facility itself, for example, by absorbing TAM’s administrative costs. Although the Bank has not shared in the cost of TC programmes in the past, its Establishing Agreement provides an adequate basis for including expenditures on TAM in its administrative expenses, as earlier noted. Recommendation The Bank, as part of its normal operating budget, should share in the costs of the TAM Programme. Clientele served. TMG has selected clients subject to the guidelines provided by various donors and, in some cases, has had to seek donor approval for specific clients. Although it has generally done a good job in selecting clients, TMG and the donors should consider certain changes in emphasis. Providing subsidised services to very large enterprises, enterprises owned by large groups, and foreign controlled enterprises raises serious questions, in the Evaluation Team’s view, about whether this meets the test of additionality and whether, in so doing, TAM competes directly with private consulting firms. Moreover, companies entirely owned by local investors, smaller companies, companies in early to intermediate transition countries, and companies located outside the capital cities reported greater impacts, in terms of incremental sales. TMG need not exclude others, but to avoid subsidising enterprises that could hire private consultants without TAM and to maximise its impact generally, TMG should focus its efforts on enterprises in the categories suggested. Recommendation TMG, subject to donor funding constraints, should focus its efforts primarily on companies entirely owned by local investors, smaller companies, companies in early to intermediate transition countries, and companies located outside the capital cities.
Cost sharing. TMG should seek to recover a share of the cost of its services. Subsidising a first assignment or subsidising small enterprises entirely owned by local shareholders may be justified on the grounds that clients may not recognise the value of TAM’s advisory services. But this justification would not apply to follow-up assignments, assignments for larger enterprises, or enterprises in which foreign shareholders hold substantial stakes. TMG should not be barred from assisting these enterprises, but it should not use scarce donor funding to subsidise them. Recommendation TMG should develop a framework calling for continuing to provide substantial subsidies (albeit not necessarily at the current level) for first assignments for small, locally owned companies and for phasing out these subsidies for follow-up assignments, assignments for larger companies (or companies owned by large companies) and companies with foreign shareholders. (Revision of 1997 recommendation.)
Special Study: TAM Programme (Regional) Page 33 of 35
Standard project budget. The changes in unit costs arising from changes in TAM’s volume of operations, the mismatch between TAM’s operating expenditures, which are mostly denominated in GBP, and its receipts, denominated in euros, and miscellaneous factors that can influence TAM’s administrative costs, should be reviewed. Recommendation TMG should review annually the standard project budgets and allowances for its administrative costs. (Repeat of 1997 recommendation.) Governance. TMG has used its Supervisory Board meetings primarily to provide information and respond to questions. Recommendation TMG should seek to use Supervisory Board meetings as a forum for discussing policy and strategic issues. The Supervisory Board should be seen as a source of advice and guidance that can contribute to improving TMG’s operations. In addition, good governance practices calls for the separation of the chairman and chief executive roles. Recommendation The EBRD should appoint a senior executive, other than TMG’s Managing Director, as chairman of TMG’s Supervisory Board. Environmental issues. These issues should be covered by all screening reports, the TORs for SIAs, and periodic visits and final enterprise reports. Recommendation TMG should ensure that environmental and social issues are addressed by its advisory teams. (Revision of 1997 recommendation.) Reporting. TMG has improved its reporting in recent years but could do more to facilitate understanding of TAM’s performance, the problems it is facing, and issues requiring consideration. Recommendation Subject to TMG’s Supervisory Board considering whether the improved information would be worth the incremental cost, TMG should: • Provide information on medium-term trends in funding under framework agreements
and bilateral authorisations; the number of projects initiated, in progress and completed; TMG’s income and expenditures; and the composition of its pre-qualified database of advisors and advisors contracted.
• Ensure that its reports all cover the same periods, not periods ending at different times.
• Provide more informative reports on income and expenditure (Appendix 7.1). • Base its income and expenditure reports on the final figures, not estimates, and
arrange for these figures to be reviewed by the EBRD’s auditors.
Page 34 of 35 Special Study: TAM Programme (Regional)
Evaluation. TMG’s internal evaluation function could be improved. Recommendations • TMG’s Senior Evaluation Officer should have a Board-approved mandate and
TMG’s Board should oversee his work. The governance arrangements should be designed to ensure his independence and autonomy, and he should transmit his final products to TMG’s Board without any clearance from management.
• The evaluation rating system should clearly distinguish between judgments on what TMG does and judgments on the results.
• The criteria used for rating judgments should be clearly specified. • The evaluation rating scale should provide four options for projects that have not
been terminated prematurely. • The evaluation system should draw and systematically disseminate lessons from the
evaluation work. • In view of the importance that TMG rightly attributes to confidentiality, its evaluation
reports to its Supervisory Board should not include information on individual clients. Collaboration. Although the recent reintegration of TMG into the Banking Vice-Presidency may contribute to improved collaboration between TAM and the Bank, further steps are needed.57 • TAM’s activities cover large as well as small businesses, but to the extent that it
serves small enterprises, the Steering Committee should take steps to integrate TAM with related Bank activities.
Recommendation The Steering Committee appointed to deal with “coordination and support among all of the Groups involved in the small business activities of the Bank” should ensure that it includes TAM in its purview.
• The TAM team must seek to foster the interests of the companies being served,
rather than the interests of the Bank, but this mandate does not bar TAM from assisting its clients by recommending possible sources of financing.TAM’s advisors should be aware of the types of financing that might be available from the Bank and financial institutions supported by the Bank and, when needs arise, should suggest that the companies they are advising approach these sources of financing. The necessary information can be provided in the form of a one-page summary and need not call for formal – and time-consuming – presentations.
57 Some donors may be concerned that the TAM Programme could be used to subsidise the Bank’s investment operations. The recommendations suggested here would not entail this risk. They would contribute to the effectiveness of each without involving material costs.
Special Study: TAM Programme (Regional) Page 35 of 35
Recommendation TMG and the Bank should take steps to ensure that TTCCs and advisors are aware of the types of proposals the Bank can consider and what other Bank-supported sources of financing might be available for TAM clients in individual countries.
• A one-page summary is likely to be more cost effective than formal presentations.
Recommendation TMG and the Bank should take steps to ensure that bankers are aware of what TAM can and cannot do and consequently what types of companies they might recommend to TAM.
In addition, TMG’s grassroots experience may help identify both problems affecting the private sector in individual countries and general problems affecting the transition process. Making this experience available to the countries of operation, directly or indirectly, may be useful. Recommendation The Bank should put mechanisms in place to draw on TMG’s experience and to ensure that whatever views TMG expresses on its own are consistent with positions being taken by the Banking Department and the Office of the Chief Economist.
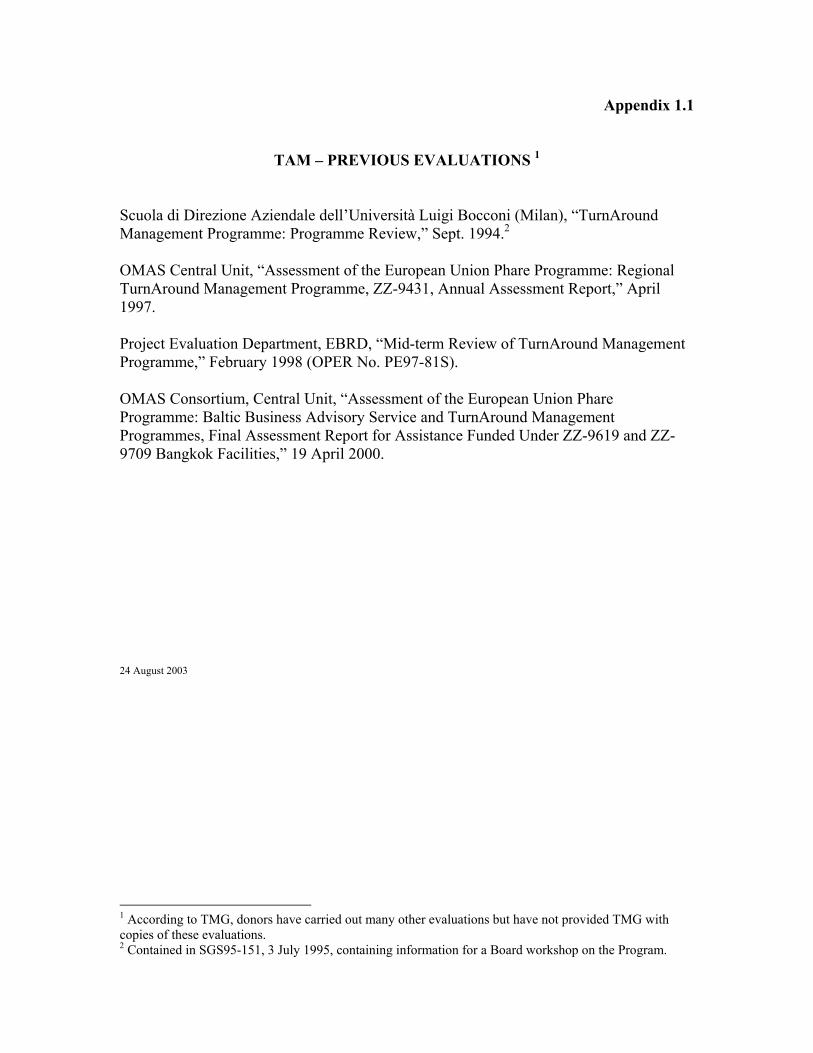
Appendix 1.1
TAM – PREVIOUS EVALUATIONS 1
Scuola di Direzione Aziendale dell’Università Luigi Bocconi (Milan), “TurnAround Management Programme: Programme Review,” Sept. 1994.2 OMAS Central Unit, “Assessment of the European Union Phare Programme: Regional TurnAround Management Programme, ZZ-9431, Annual Assessment Report,” April 1997. Project Evaluation Department, EBRD, “Mid-term Review of TurnAround Management Programme,” February 1998 (OPER No. PE97-81S). OMAS Consortium, Central Unit, “Assessment of the European Union Phare Programme: Baltic Business Advisory Service and TurnAround Management Programmes, Final Assessment Report for Assistance Funded Under ZZ-9619 and ZZ-9709 Bangkok Facilities,” 19 April 2000. 24 August 2003
1 According to TMG, donors have carried out many other evaluations but have not provided TMG with copies of these evaluations. 2 Contained in SGS95-151, 3 July 1995, containing information for a Board workshop on the Program.
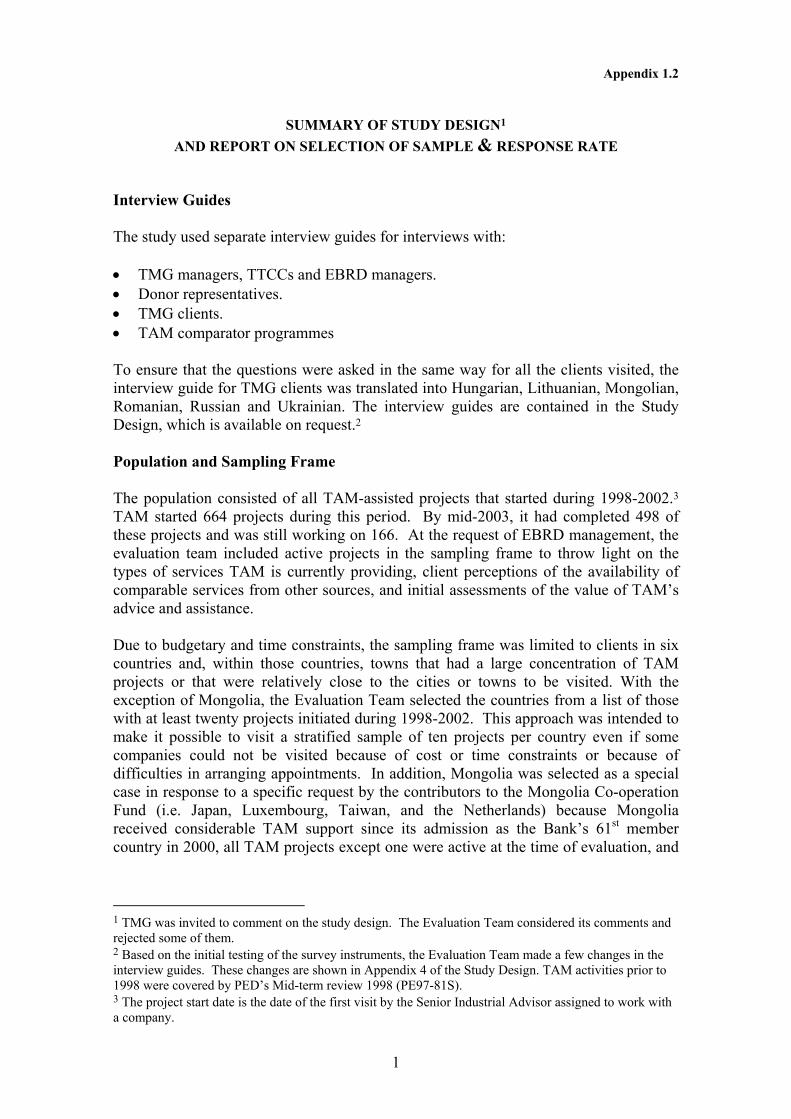
Appendix 1.2
SUMMARY OF STUDY DESIGN1 AND REPORT ON SELECTION OF SAMPLE & RESPONSE RATE
Interview Guides The study used separate interview guides for interviews with: • • • •
TMG managers, TTCCs and EBRD managers. Donor representatives. TMG clients. TAM comparator programmes
To ensure that the questions were asked in the same way for all the clients visited, the interview guide for TMG clients was translated into Hungarian, Lithuanian, Mongolian, Romanian, Russian and Ukrainian. The interview guides are contained in the Study Design, which is available on request.2
Population and Sampling Frame The population consisted of all TAM-assisted projects that started during 1998-2002.3 TAM started 664 projects during this period. By mid-2003, it had completed 498 of these projects and was still working on 166. At the request of EBRD management, the evaluation team included active projects in the sampling frame to throw light on the types of services TAM is currently providing, client perceptions of the availability of comparable services from other sources, and initial assessments of the value of TAM’s advice and assistance. Due to budgetary and time constraints, the sampling frame was limited to clients in six countries and, within those countries, towns that had a large concentration of TAM projects or that were relatively close to the cities or towns to be visited. With the exception of Mongolia, the Evaluation Team selected the countries from a list of those with at least twenty projects initiated during 1998-2002. This approach was intended to make it possible to visit a stratified sample of ten projects per country even if some companies could not be visited because of cost or time constraints or because of difficulties in arranging appointments. In addition, Mongolia was selected as a special case in response to a specific request by the contributors to the Mongolia Co-operation Fund (i.e. Japan, Luxembourg, Taiwan, and the Netherlands) because Mongolia received considerable TAM support since its admission as the Bank’s 61st member country in 2000, all TAM projects except one were active at the time of evaluation, and
1 TMG was invited to comment on the study design. The Evaluation Team considered its comments and rejected some of them. 2 Based on the initial testing of the survey instruments, the Evaluation Team made a few changes in the interview guides. These changes are shown in Appendix 4 of the Study Design. TAM activities prior to 1998 were covered by PED’s Mid-term review 1998 (PE97-81S). 3 The project start date is the date of the first visit by the Senior Industrial Advisor assigned to work with a company.
1
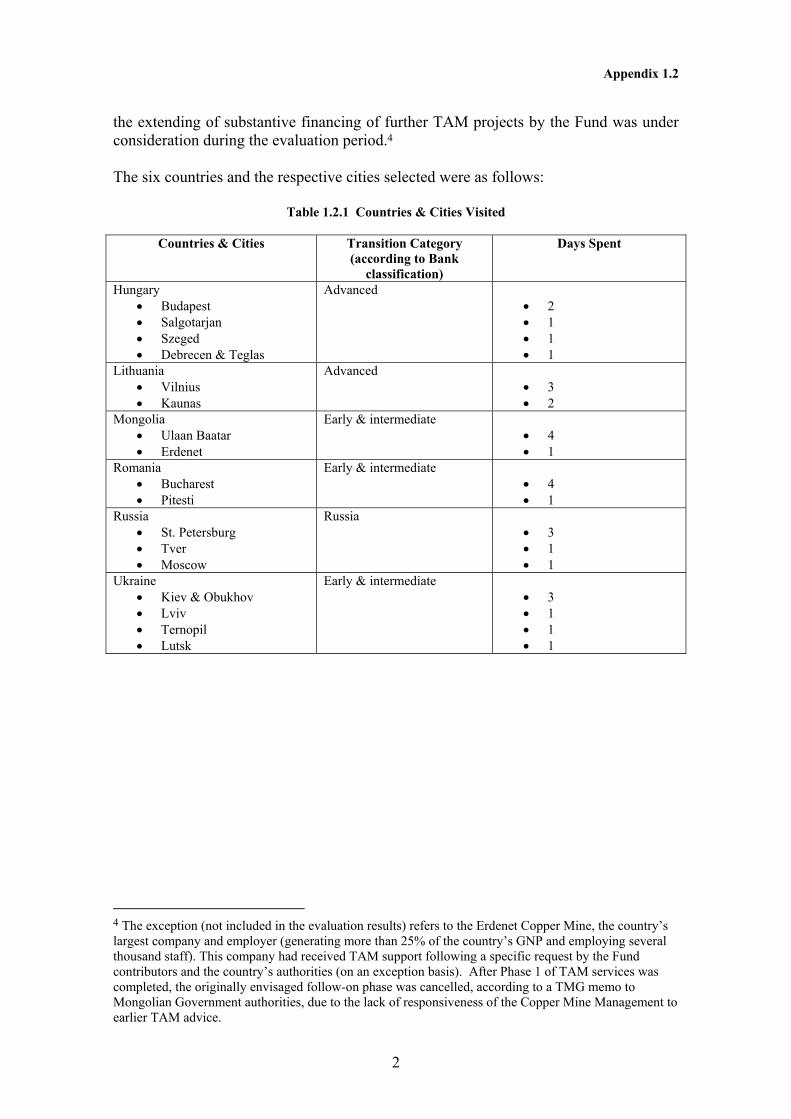
Appendix 1.2
the extending of substantive financing of further TAM projects by the Fund was under consideration during the evaluation period.4 The six countries and the respective cities selected were as follows:
Table 1.2.1 Countries & Cities Visited
Countries & Cities Transition Category (according to Bank
classification)
Days Spent
Hungary • Budapest • Salgotarjan • Szeged • Debrecen & Teglas
Advanced • 2 • 1 • 1 • 1
Lithuania • Vilnius • Kaunas
Advanced • 3 • 2
Mongolia • Ulaan Baatar • Erdenet
Early & intermediate • 4 • 1
Romania • Bucharest • Pitesti
Early & intermediate • 4 • 1
Russia • St. Petersburg • Tver • Moscow
Russia • 3 • 1 • 1
Ukraine • Kiev & Obukhov • Lviv • Ternopil • Lutsk
Early & intermediate • 3 • 1 • 1 • 1
4 The exception (not included in the evaluation results) refers to the Erdenet Copper Mine, the country’s largest company and employer (generating more than 25% of the country’s GNP and employing several thousand staff). This company had received TAM support following a specific request by the Fund contributors and the country’s authorities (on an exception basis). After Phase 1 of TAM services was completed, the originally envisaged follow-on phase was cancelled, according to a TMG memo to Mongolian Government authorities, due to the lack of responsiveness of the Copper Mine Management to earlier TAM advice.
2
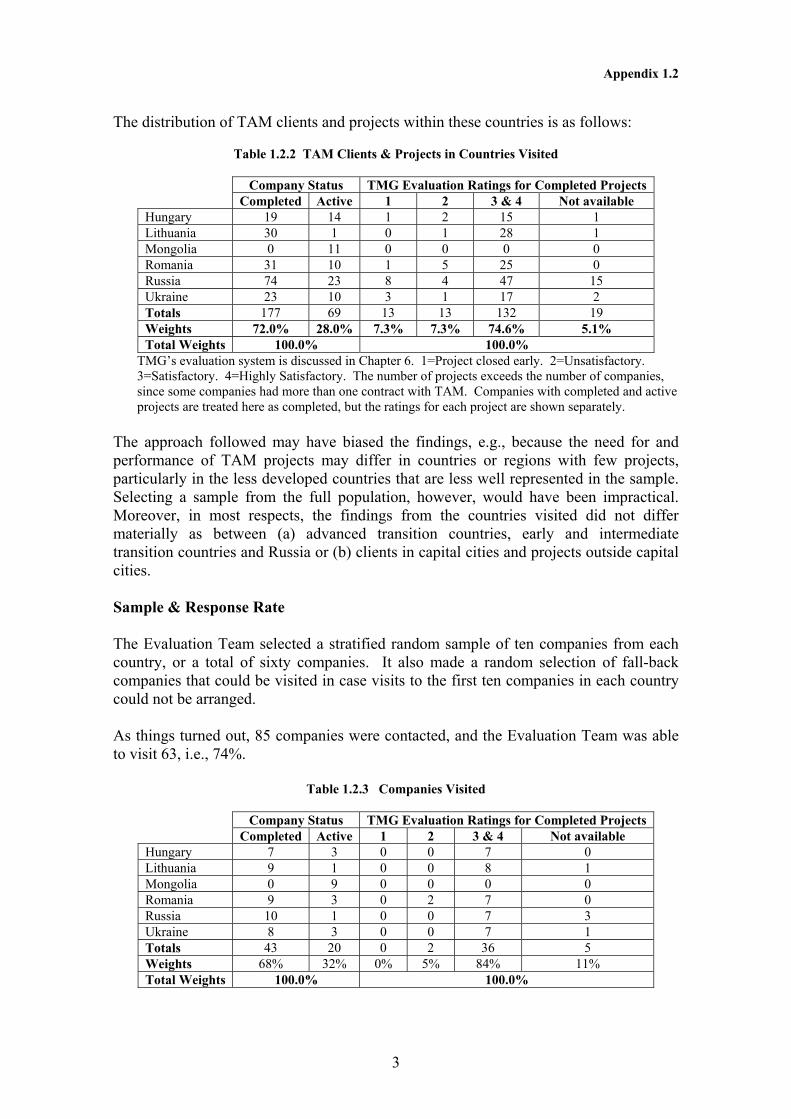
Appendix 1.2
The distribution of TAM clients and projects within these countries is as follows:
Table 1.2.2 TAM Clients & Projects in Countries Visited
Company Status TMG Evaluation Ratings for Completed Projects Completed Active 1 2 3 & 4 Not available Hungary 19 14 1 2 15 1 Lithuania 30 1 0 1 28 1 Mongolia 0 11 0 0 0 0 Romania 31 10 1 5 25 0 Russia 74 23 8 4 47 15 Ukraine 23 10 3 1 17 2 Totals 177 69 13 13 132 19 Weights 72.0% 28.0% 7.3% 7.3% 74.6% 5.1% Total Weights 100.0% 100.0%
TMG’s evaluation system is discussed in Chapter 6. 1=Project closed early. 2=Unsatisfactory. 3=Satisfactory. 4=Highly Satisfactory. The number of projects exceeds the number of companies, since some companies had more than one contract with TAM. Companies with completed and active projects are treated here as completed, but the ratings for each project are shown separately.
The approach followed may have biased the findings, e.g., because the need for and performance of TAM projects may differ in countries or regions with few projects, particularly in the less developed countries that are less well represented in the sample. Selecting a sample from the full population, however, would have been impractical. Moreover, in most respects, the findings from the countries visited did not differ materially as between (a) advanced transition countries, early and intermediate transition countries and Russia or (b) clients in capital cities and projects outside capital cities. Sample & Response Rate The Evaluation Team selected a stratified random sample of ten companies from each country, or a total of sixty companies. It also made a random selection of fall-back companies that could be visited in case visits to the first ten companies in each country could not be arranged. As things turned out, 85 companies were contacted, and the Evaluation Team was able to visit 63, i.e., 74%.
Table 1.2.3 Companies Visited
Company Status TMG Evaluation Ratings for Completed Projects Completed Active 1 2 3 & 4 Not available Hungary 7 3 0 0 7 0 Lithuania 9 1 0 0 8 1 Mongolia 0 9 0 0 0 0 Romania 9 3 0 2 7 0 Russia 10 1 0 0 7 3 Ukraine 8 3 0 0 7 1 Totals 43 20 0 2 36 5 Weights 68% 32% 0% 5% 84% 11% Total Weights 100.0% 100.0%
3
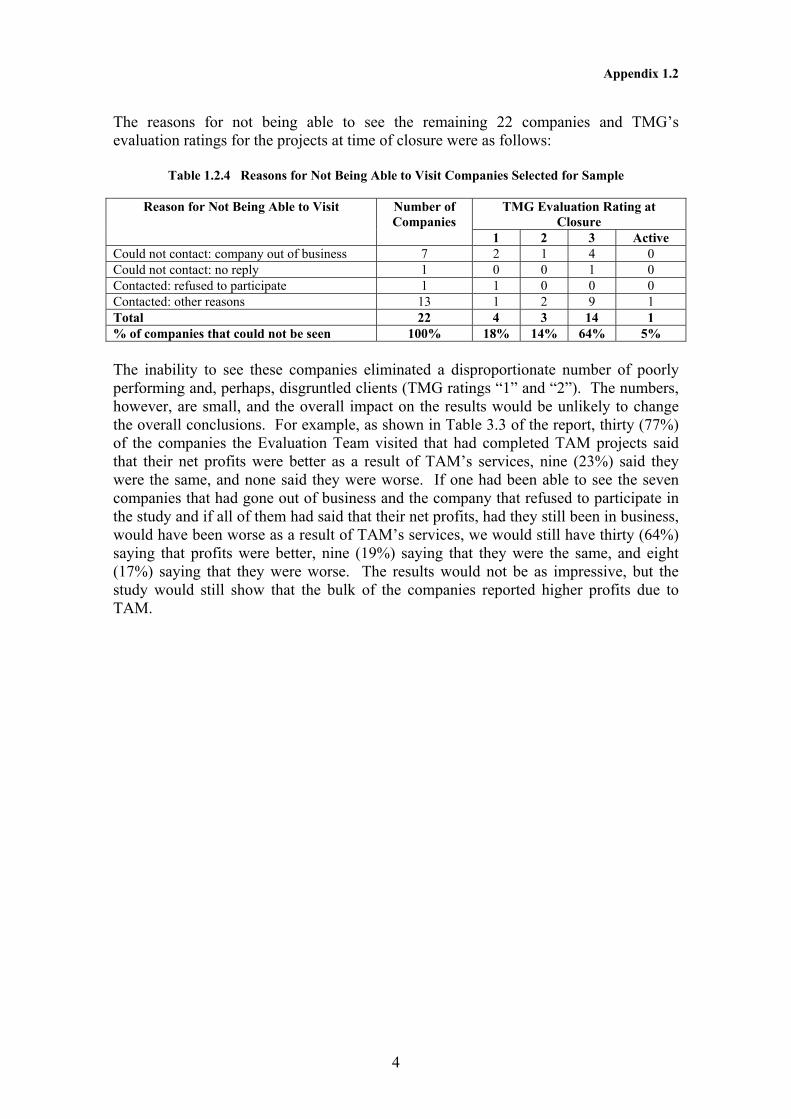
Appendix 1.2
4
The reasons for not being able to see the remaining 22 companies and TMG’s evaluation ratings for the projects at time of closure were as follows:
Table 1.2.4 Reasons for Not Being Able to Visit Companies Selected for Sample
TMG Evaluation Rating at Closure
Reason for Not Being Able to Visit Number of Companies
1 2 3 Active Could not contact: company out of business 7 2 1 4 0 Could not contact: no reply 1 0 0 1 0 Contacted: refused to participate 1 1 0 0 0 Contacted: other reasons 13 1 2 9 1 Total 22 4 3 14 1 % of companies that could not be seen 100% 18% 14% 64% 5% The inability to see these companies eliminated a disproportionate number of poorly performing and, perhaps, disgruntled clients (TMG ratings “1” and “2”). The numbers, however, are small, and the overall impact on the results would be unlikely to change the overall conclusions. For example, as shown in Table 3.3 of the report, thirty (77%) of the companies the Evaluation Team visited that had completed TAM projects said that their net profits were better as a result of TAM’s services, nine (23%) said they were the same, and none said they were worse. If one had been able to see the seven companies that had gone out of business and the company that refused to participate in the study and if all of them had said that their net profits, had they still been in business, would have been worse as a result of TAM’s services, we would still have thirty (64%) saying that profits were better, nine (19%) saying that they were the same, and eight (17%) saying that they were worse. The results would not be as impressive, but the study would still show that the bulk of the companies reported higher profits due to TAM.
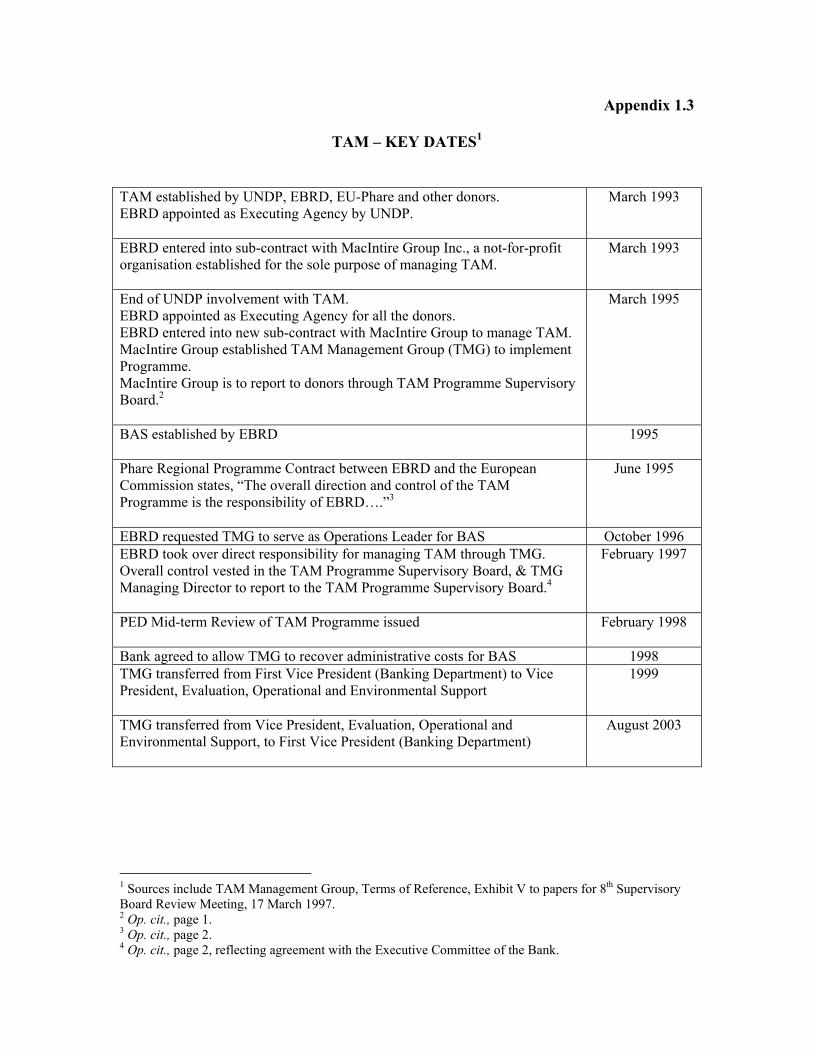
Appendix 1.3
TAM – KEY DATES1
TAM established by UNDP, EBRD, EU-Phare and other donors. EBRD appointed as Executing Agency by UNDP.
March 1993
EBRD entered into sub-contract with MacIntire Group Inc., a not-for-profit organisation established for the sole purpose of managing TAM.
March 1993
End of UNDP involvement with TAM. EBRD appointed as Executing Agency for all the donors. EBRD entered into new sub-contract with MacIntire Group to manage TAM. MacIntire Group established TAM Management Group (TMG) to implement Programme. MacIntire Group is to report to donors through TAM Programme Supervisory Board.2
March 1995
BAS established by EBRD
1995
Phare Regional Programme Contract between EBRD and the European Commission states, “The overall direction and control of the TAM Programme is the responsibility of EBRD….”3
June 1995
EBRD requested TMG to serve as Operations Leader for BAS October 1996 EBRD took over direct responsibility for managing TAM through TMG. Overall control vested in the TAM Programme Supervisory Board, & TMG Managing Director to report to the TAM Programme Supervisory Board.4
February 1997
PED Mid-term Review of TAM Programme issued
February 1998
Bank agreed to allow TMG to recover administrative costs for BAS 1998 TMG transferred from First Vice President (Banking Department) to Vice President, Evaluation, Operational and Environmental Support
1999
TMG transferred from Vice President, Evaluation, Operational and Environmental Support, to First Vice President (Banking Department)
August 2003
1 Sources include TAM Management Group, Terms of Reference, Exhibit V to papers for 8th Supervisory Board Review Meeting, 17 March 1997. 2 Op. cit., page 1. 3 Op. cit., page 2. 4 Op. cit., page 2, reflecting agreement with the Executive Committee of the Bank.
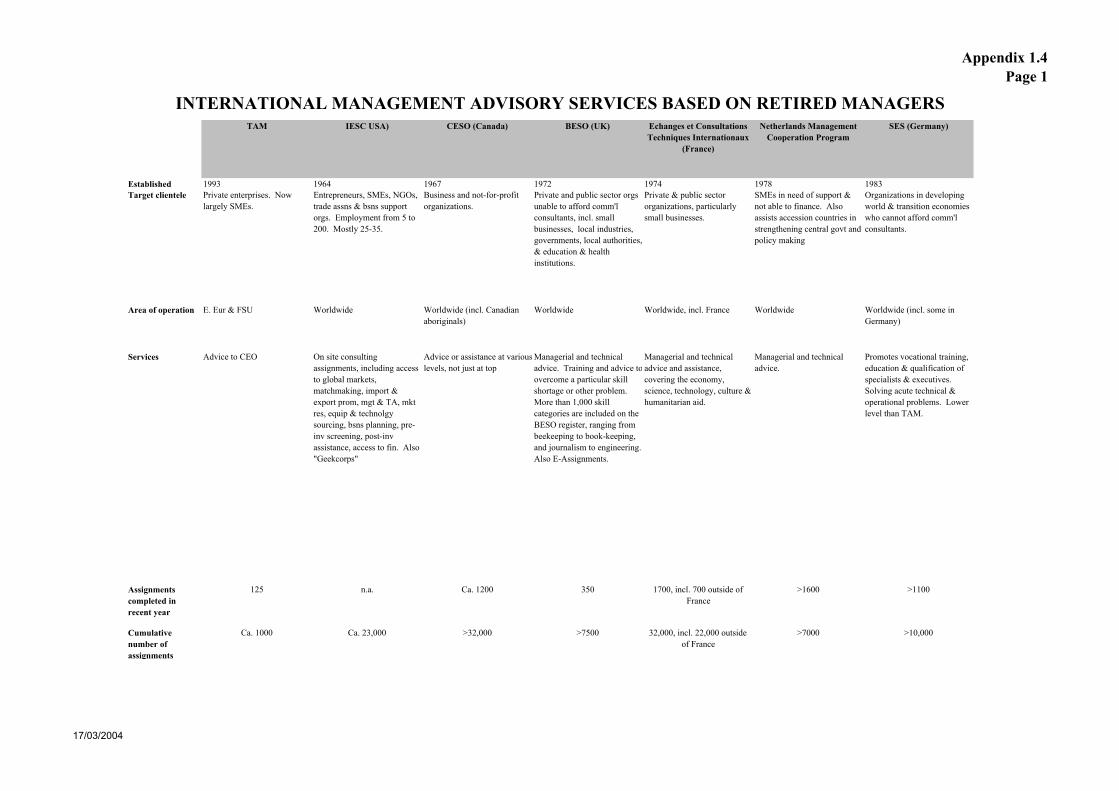
INTERNATIONAL MANAGEMENT ADVISORY SERVICES BASED ON RETIRED MANAGERS
Appendix 1.4Page 1
TAM IESC USA) CESO (Canada) BESO (UK) Echanges et Consultations Techniques Internationaux
(France)
Netherlands Management Cooperation Program
SES (Germany)
Established 1993 1964 1967 1972 1974 1978 1983Target clientele Private enterprises. Now
largely SMEs.Entrepreneurs, SMEs, NGOs, trade assns & bsns support orgs. Employment from 5 to 200. Mostly 25-35.
Business and not-for-profit organizations.
Private and public sector orgs unable to afford comm'l consultants, incl. small businesses, local industries, governments, local authorities,& education & health institutions.
Private & public sector organizations, particularly small businesses.
SMEs in need of support & not able to finance. Also assists accession countries in strengthening central govt and policy making
Organizations in developing world & transition economies who cannot afford comm'l consultants.
Area of operation E. Eur & FSU Worldwide Worldwide (incl. Canadian aboriginals)
Worldwide Worldwide, incl. France Worldwide Worldwide (incl. some in Germany)
Services Advice to CEO On site consulting assignments, including access to global markets, matchmaking, import & export prom, mgt & TA, mkt res, equip & technolgy sourcing, bsns planning, pre-inv screening, post-inv assistance, access to fin. Also "Geekcorps"
Advice or assistance at variouslevels, not just at top
Managerial and technical advice. Training and advice toovercome a particular skill shortage or other problem. More than 1,000 skill categories are included on the BESO register, ranging from beekeeping to book-keeping, and journalism to engineering. Also E-Assignments.
Managerial and technical advice and assistance, covering the economy, science, technology, culture & humanitarian aid.
Managerial and technical advice.
Promotes vocational training, education & qualification of specialists & executives. Solving acute technical & operational problems. Lower level than TAM.
Assignments completed in recent year
125 n.a. Ca. 1200 350 1700, incl. 700 outside of France
>1600 >1100
Cumulative number of assignments
Ca. 1000 Ca. 23,000 >32,000 >7500 32,000, incl. 22,000 outside of France
>7000 >10,000
17/03/2004
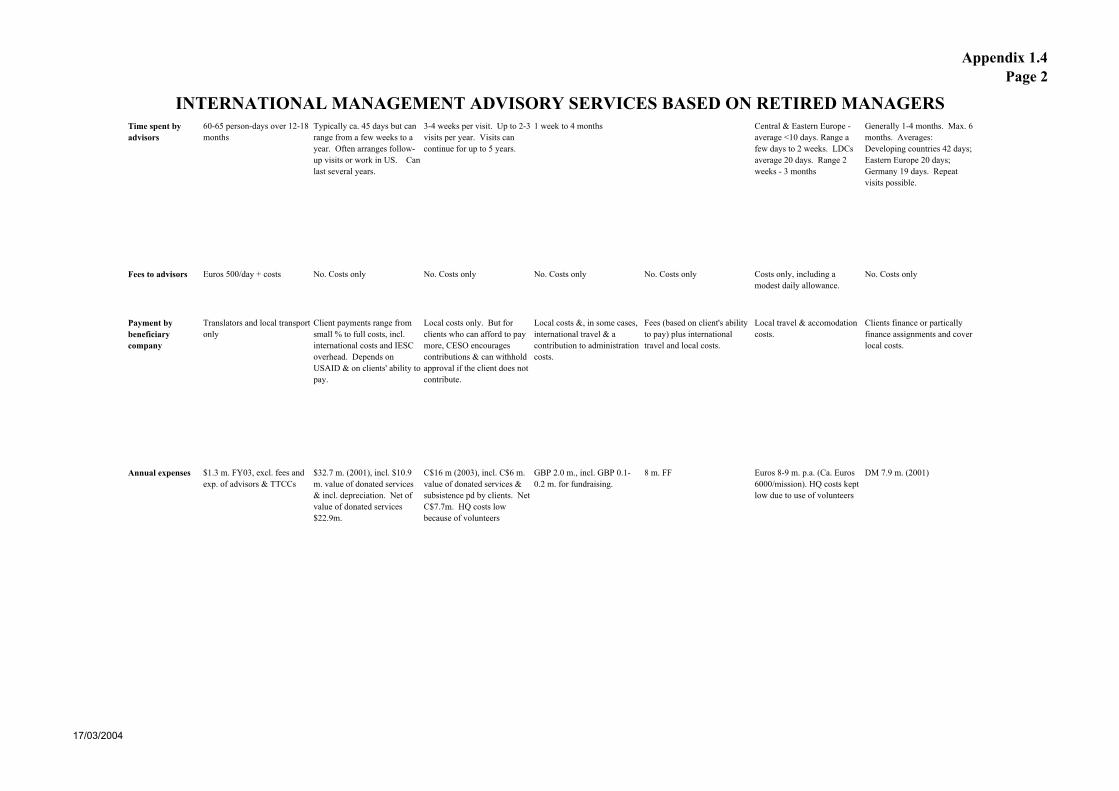
INTERNATIONAL MANAGEMENT ADVISORY SERVICES BASED ON RETIRED MANAGERS
Appendix 1.4Page 2
Time spent by advisors
60-65 person-days over 12-18 months
Typically ca. 45 days but can range from a few weeks to a year. Often arranges follow-up visits or work in US. Can last several years.
3-4 weeks per visit. Up to 2-3 visits per year. Visits can continue for up to 5 years.
1 week to 4 months Central & Eastern Europe - average <10 days. Range a few days to 2 weeks. LDCs average 20 days. Range 2 weeks - 3 months
Generally 1-4 months. Max. 6 months. Averages: Developing countries 42 days; Eastern Europe 20 days; Germany 19 days. Repeat visits possible.
Fees to advisors Euros 500/day + costs No. Costs only No. Costs only No. Costs only No. Costs only Costs only, including a modest daily allowance.
No. Costs only
Payment by beneficiary company
Translators and local transport only
Client payments range from small % to full costs, incl. international costs and IESC overhead. Depends on USAID & on clients' ability to pay.
Local costs only. But for clients who can afford to pay more, CESO encourages contributions & can withhold approval if the client does not contribute.
Local costs &, in some cases, international travel & a contribution to administration costs.
Fees (based on client's ability to pay) plus international travel and local costs.
Local travel & accomodation costs.
Clients finance or partically finance assignments and cover local costs.
Annual expenses $1.3 m. FY03, excl. fees and exp. of advisors & TTCCs
$32.7 m. (2001), incl. $10.9 m. value of donated services & incl. depreciation. Net of value of donated services $22.9m.
C$16 m (2003), incl. C$6 m. value of donated services & subsistence pd by clients. Net C$7.7m. HQ costs low because of volunteers
GBP 2.0 m., incl. GBP 0.1-0.2 m. for fundraising.
8 m. FF Euros 8-9 m. p.a. (Ca. Euros 6000/mission). HQ costs kept low due to use of volunteers
DM 7.9 m. (2001)
17/03/2004
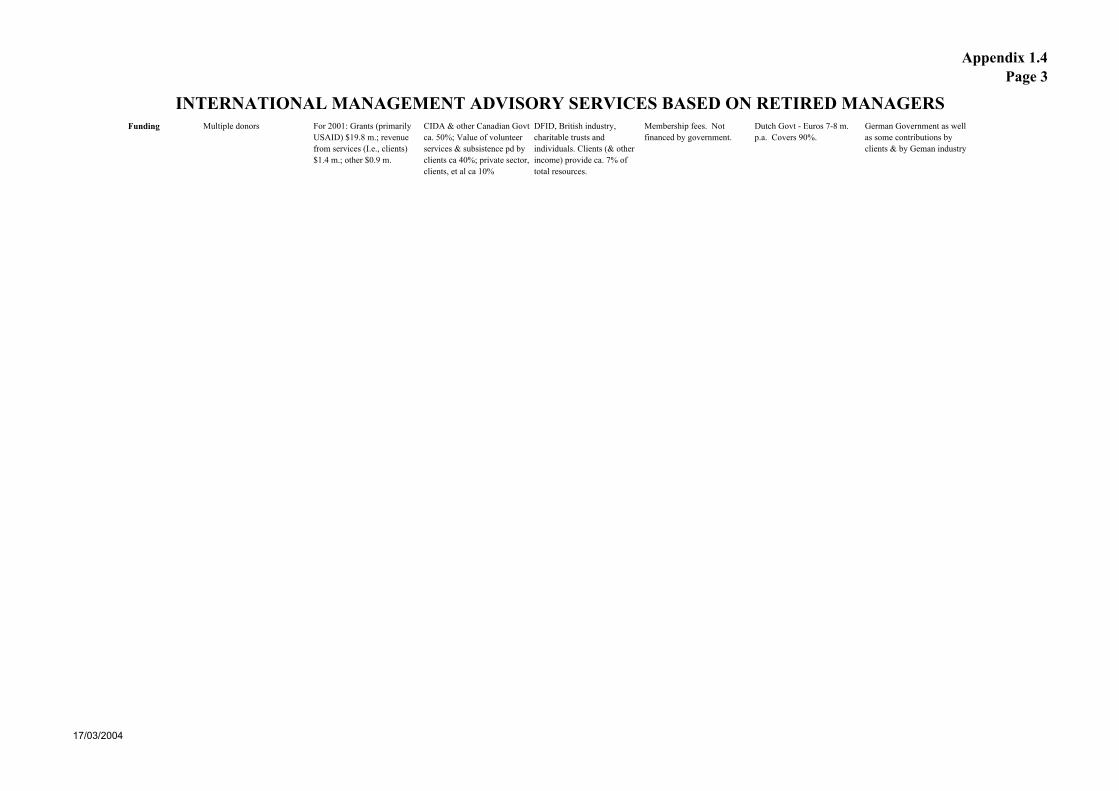
INTERNATIONAL MANAGEMENT ADVISORY SERVICES BASED ON RETIRED MANAGERS
Appendix 1.4Page 3
Funding Multiple donors For 2001: Grants (primarily USAID) $19.8 m.; revenue from services (I.e., clients) $1.4 m.; other $0.9 m.
CIDA & other Canadian Govt ca. 50%; Value of volunteer services & subsistence pd by clients ca 40%; private sector, clients, et al ca 10%
DFID, British industry, charitable trusts and individuals. Clients (& other income) provide ca. 7% of total resources.
Membership fees. Not financed by government.
Dutch Govt - Euros 7-8 m. p.a. Covers 90%.
German Government as well as some contributions by clients & by Geman industry
17/03/2004
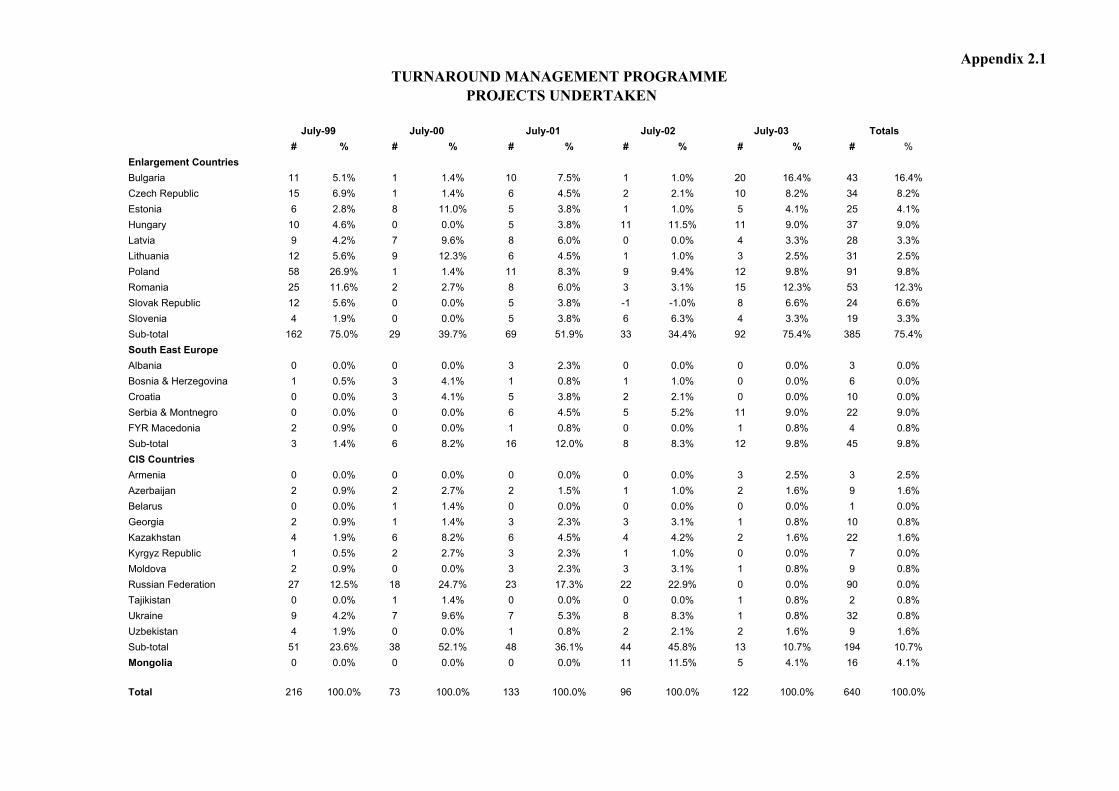
TURNAROUND MANAGEMENT PROGRAMME PROJECTS UNDERTAKEN
Appendix 2.1
# % # % # % # % # % # %Enlargement CountriesBulgaria 11 5.1% 1 1.4% 10 7.5% 1 1.0% 20 16.4% 43 16.4%Czech Republic 15 6.9% 1 1.4% 6 4.5% 2 2.1% 10 8.2% 34 8.2%Estonia 6 2.8% 8 11.0% 5 3.8% 1 1.0% 5 4.1% 25 4.1%Hungary 10 4.6% 0 0.0% 5 3.8% 11 11.5% 11 9.0% 37 9.0%Latvia 9 4.2% 7 9.6% 8 6.0% 0 0.0% 4 3.3% 28 3.3%Lithuania 12 5.6% 9 12.3% 6 4.5% 1 1.0% 3 2.5% 31 2.5%Poland 58 26.9% 1 1.4% 11 8.3% 9 9.4% 12 9.8% 91 9.8%Romania 25 11.6% 2 2.7% 8 6.0% 3 3.1% 15 12.3% 53 12.3%Slovak Republic 12 5.6% 0 0.0% 5 3.8% -1 -1.0% 8 6.6% 24 6.6%Slovenia 4 1.9% 0 0.0% 5 3.8% 6 6.3% 4 3.3% 19 3.3%Sub-total 162 75.0% 29 39.7% 69 51.9% 33 34.4% 92 75.4% 385 75.4%South East EuropeAlbania 0 0.0% 0 0.0% 3 2.3% 0 0.0% 0 0.0% 3 0.0%Bosnia & Herzegovina 1 0.5% 3 4.1% 1 0.8% 1 1.0% 0 0.0% 6 0.0%Croatia 0 0.0% 3 4.1% 5 3.8% 2 2.1% 0 0.0% 10 0.0%Serbia & Montnegro 0 0.0% 0 0.0% 6 4.5% 5 5.2% 11 9.0% 22 9.0%FYR Macedonia 2 0.9% 0 0.0% 1 0.8% 0 0.0% 1 0.8% 4 0.8%Sub-total 3 1.4% 6 8.2% 16 12.0% 8 8.3% 12 9.8% 45 9.8%CIS CountriesArmenia 0 0.0% 0 0.0% 0 0.0% 0 0.0% 3 2.5% 3 2.5%Azerbaijan 2 0.9% 2 2.7% 2 1.5% 1 1.0% 2 1.6% 9 1.6%Belarus 0 0.0% 1 1.4% 0 0.0% 0 0.0% 0 0.0% 1 0.0%Georgia 2 0.9% 1 1.4% 3 2.3% 3 3.1% 1 0.8% 10 0.8%Kazakhstan 4 1.9% 6 8.2% 6 4.5% 4 4.2% 2 1.6% 22 1.6%Kyrgyz Republic 1 0.5% 2 2.7% 3 2.3% 1 1.0% 0 0.0% 7 0.0%Moldova 2 0.9% 0 0.0% 3 2.3% 3 3.1% 1 0.8% 9 0.8%Russian Federation 27 12.5% 18 24.7% 23 17.3% 22 22.9% 0 0.0% 90 0.0%Tajikistan 0 0.0% 1 1.4% 0 0.0% 0 0.0% 1 0.8% 2 0.8%Ukraine 9 4.2% 7 9.6% 7 5.3% 8 8.3% 1 0.8% 32 0.8%Uzbekistan 4 1.9% 0 0.0% 1 0.8% 2 2.1% 2 1.6% 9 1.6%Sub-total 51 23.6% 38 52.1% 48 36.1% 44 45.8% 13 10.7% 194 10.7%Mongolia 0 0.0% 0 0.0% 0 0.0% 11 11.5% 5 4.1% 16 4.1%
Total 216 100.0% 73 100.0% 133 100.0% 96 100.0% 122 100.0% 640 100.0%
July-03 TotalsJuly-99 July-00 July-01 July-02
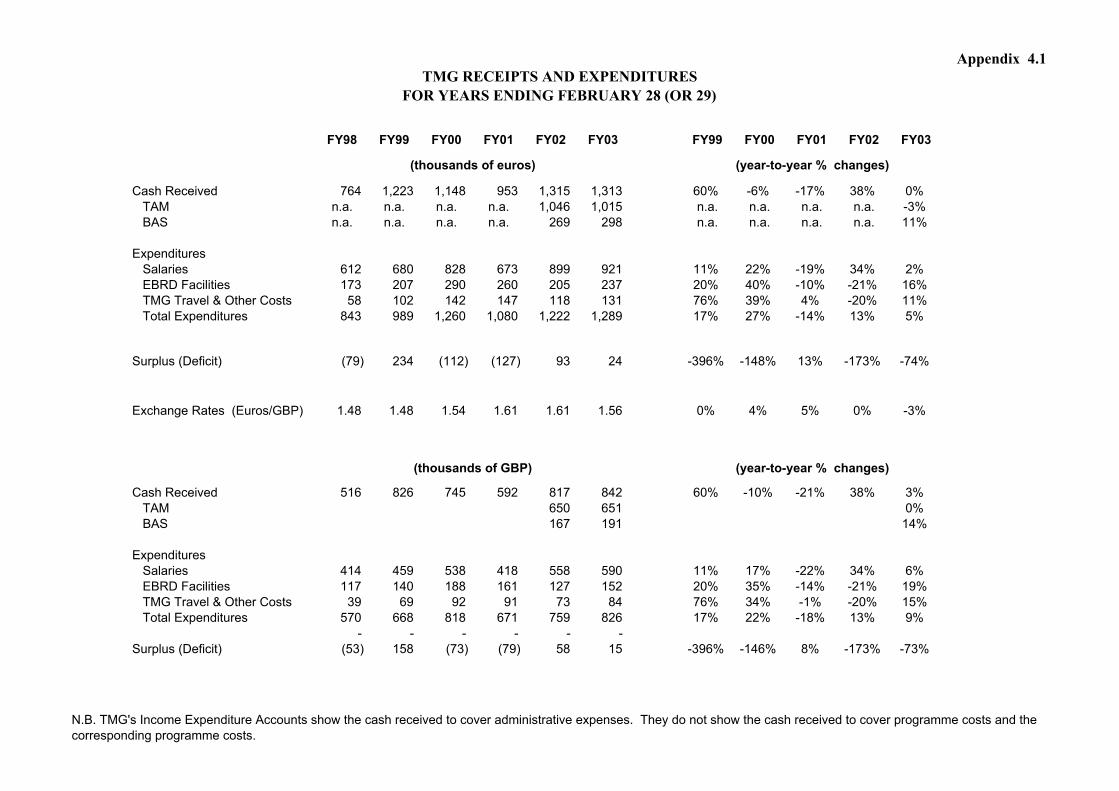
TMG RECEIPTS AND EXPENDITURESFOR YEARS ENDING FEBRUARY 28 (OR 29)
Appendix 4.1
FY98 FY99 FY00 FY01 FY02 FY03 FY99 FY00 FY01 FY02 FY03
Cash Received 764 1,223 1,148 953 1,315 1,313 60% -6% -17% 38% 0% TAM n.a. n.a. n.a. n.a. 1,046 1,015 n.a. n.a. n.a. n.a. -3% BAS n.a. n.a. n.a. n.a. 269 298 n.a. n.a. n.a. n.a. 11%
Expenditures Salaries 612 680 828 673 899 921 11% 22% -19% 34% 2% EBRD Facilities 173 207 290 260 205 237 20% 40% -10% -21% 16% TMG Travel & Other Costs 58 102 142 147 118 131 76% 39% 4% -20% 11% Total Expenditures 843 989 1,260 1,080 1,222 1,289 17% 27% -14% 13% 5%
Surplus (Deficit) (79) 234 (112) (127) 93 24 -396% -148% 13% -173% -74%
Exchange Rates (Euros/GBP) 1.48 1.48 1.54 1.61 1.61 1.56 0% 4% 5% 0% -3%
Cash Received 516 826 745 592 817 842 60% -10% -21% 38% 3% TAM 650 651 0% BAS 167 191 14%
Expenditures Salaries 414 459 538 418 558 590 11% 17% -22% 34% 6% EBRD Facilities 117 140 188 161 127 152 20% 35% -14% -21% 19% TMG Travel & Other Costs 39 69 92 91 73 84 76% 34% -1% -20% 15% Total Expenditures 570 668 818 671 759 826 17% 22% -18% 13% 9%
- - - - - - Surplus (Deficit) (53) 158 (73) (79) 58 15 -396% -146% 8% -173% -73%
(thousands of euros)
(thousands of GBP)
(year-to-year % changes)
(year-to-year % changes)
N.B. TMG's Income Expenditure Accounts show the cash received to cover administrative expenses. They do not show the cash received to cover programme costs and the corresponding programme costs.
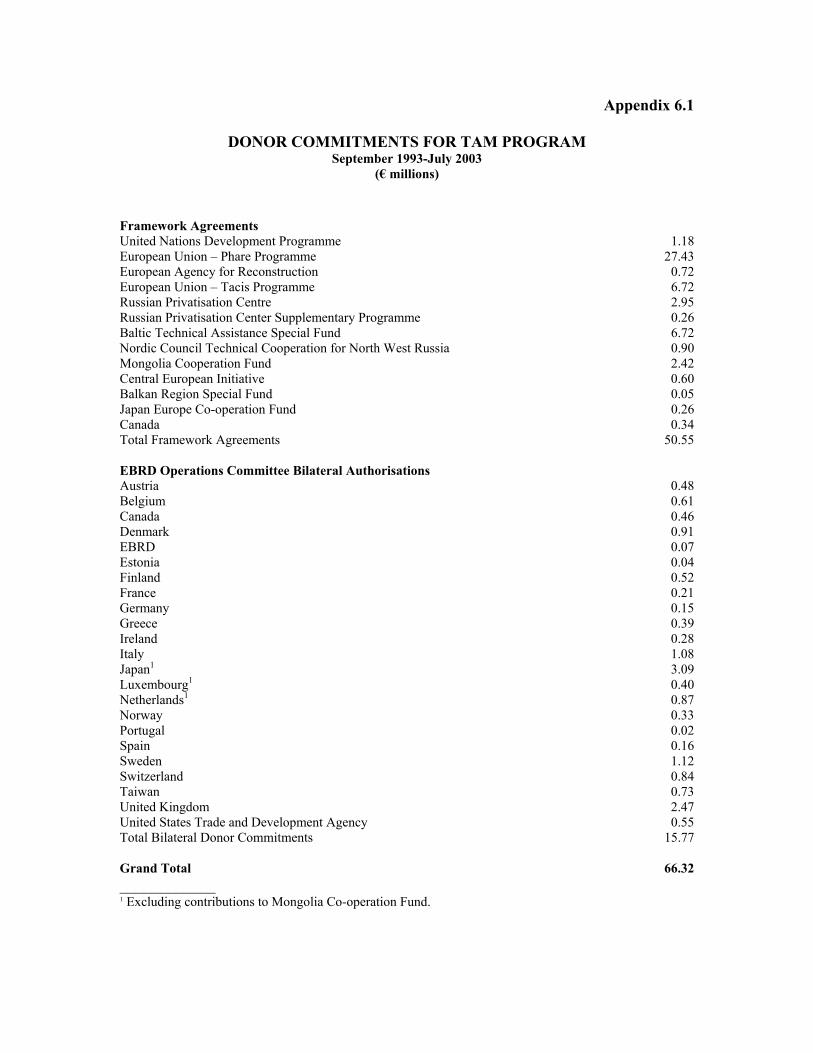
Appendix 6.1
DONOR COMMITMENTS FOR TAM PROGRAM September 1993-July 2003
(€ millions)
Framework Agreements United Nations Development Programme 1.18 European Union – Phare Programme 27.43 European Agency for Reconstruction 0.72 European Union – Tacis Programme 6.72 Russian Privatisation Centre 2.95 Russian Privatisation Center Supplementary Programme 0.26 Baltic Technical Assistance Special Fund 6.72 Nordic Council Technical Cooperation for North West Russia 0.90 Mongolia Cooperation Fund 2.42 Central European Initiative 0.60 Balkan Region Special Fund 0.05 Japan Europe Co-operation Fund 0.26 Canada 0.34 Total Framework Agreements 50.55 EBRD Operations Committee Bilateral Authorisations Austria 0.48 Belgium 0.61 Canada 0.46 Denmark 0.91 EBRD 0.07 Estonia 0.04 Finland 0.52 France 0.21 Germany 0.15 Greece 0.39 Ireland 0.28 Italy 1.08 Japan1 3.09 Luxembourg1 0.40 Netherlands1 0.87 Norway 0.33 Portugal 0.02 Spain 0.16 Sweden 1.12 Switzerland 0.84 Taiwan 0.73 United Kingdom 2.47 United States Trade and Development Agency 0.55 Total Bilateral Donor Commitments 15.77 Grand Total
66.32
____________ 1 Excluding contributions to Mongolia Co-operation Fund.
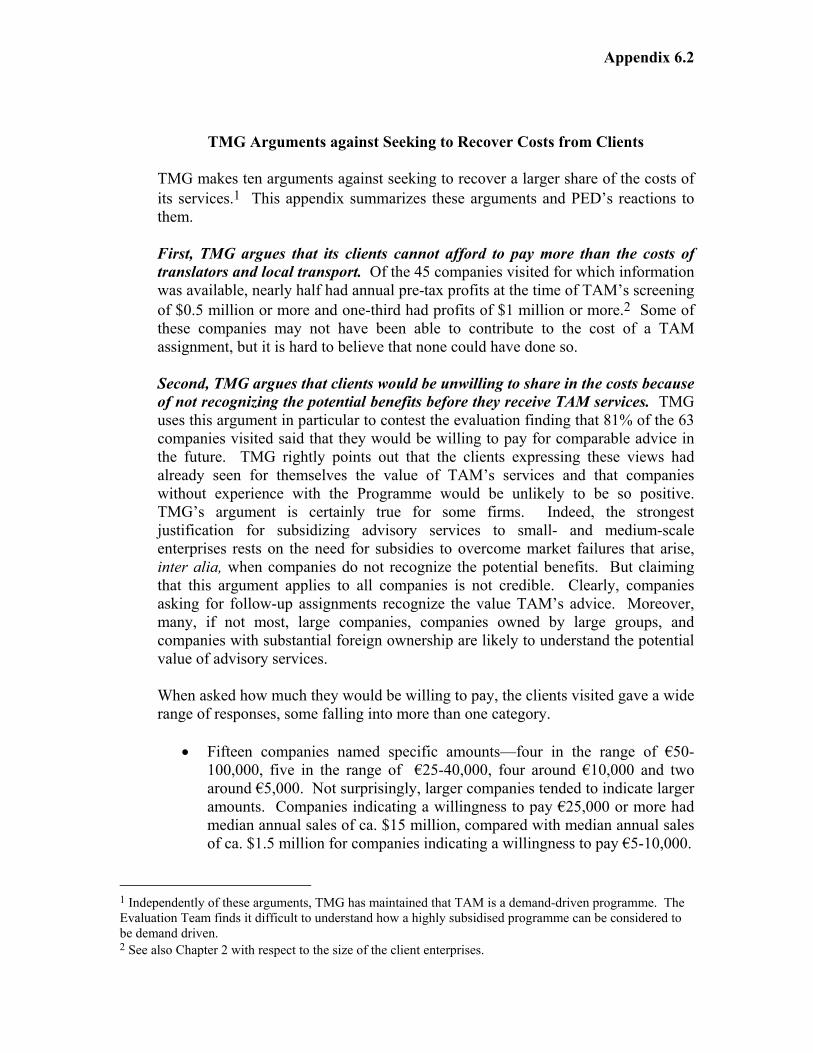
Appendix 6.2
TMG Arguments against Seeking to Recover Costs from Clients TMG makes ten arguments against seeking to recover a larger share of the costs of its services.1 This appendix summarizes these arguments and PED’s reactions to them. First, TMG argues that its clients cannot afford to pay more than the costs of translators and local transport. Of the 45 companies visited for which information was available, nearly half had annual pre-tax profits at the time of TAM’s screening of $0.5 million or more and one-third had profits of $1 million or more.2 Some of these companies may not have been able to contribute to the cost of a TAM assignment, but it is hard to believe that none could have done so. Second, TMG argues that clients would be unwilling to share in the costs because of not recognizing the potential benefits before they receive TAM services. TMG uses this argument in particular to contest the evaluation finding that 81% of the 63 companies visited said that they would be willing to pay for comparable advice in the future. TMG rightly points out that the clients expressing these views had already seen for themselves the value of TAM’s services and that companies without experience with the Programme would be unlikely to be so positive. TMG’s argument is certainly true for some firms. Indeed, the strongest justification for subsidizing advisory services to small- and medium-scale enterprises rests on the need for subsidies to overcome market failures that arise, inter alia, when companies do not recognize the potential benefits. But claiming that this argument applies to all companies is not credible. Clearly, companies asking for follow-up assignments recognize the value TAM’s advice. Moreover, many, if not most, large companies, companies owned by large groups, and companies with substantial foreign ownership are likely to understand the potential value of advisory services. When asked how much they would be willing to pay, the clients visited gave a wide range of responses, some falling into more than one category.
•
Fifteen companies named specific amounts—four in the range of €50-100,000, five in the range of €25-40,000, four around €10,000 and two around €5,000. Not surprisingly, larger companies tended to indicate larger amounts. Companies indicating a willingness to pay €25,000 or more had median annual sales of ca. $15 million, compared with median annual sales of ca. $1.5 million for companies indicating a willingness to pay €5-10,000.
1 Independently of these arguments, TMG has maintained that TAM is a demand-driven programme. The Evaluation Team finds it difficult to understand how a highly subsidised programme can be considered to be demand driven. 2 See also Chapter 2 with respect to the size of the client enterprises.
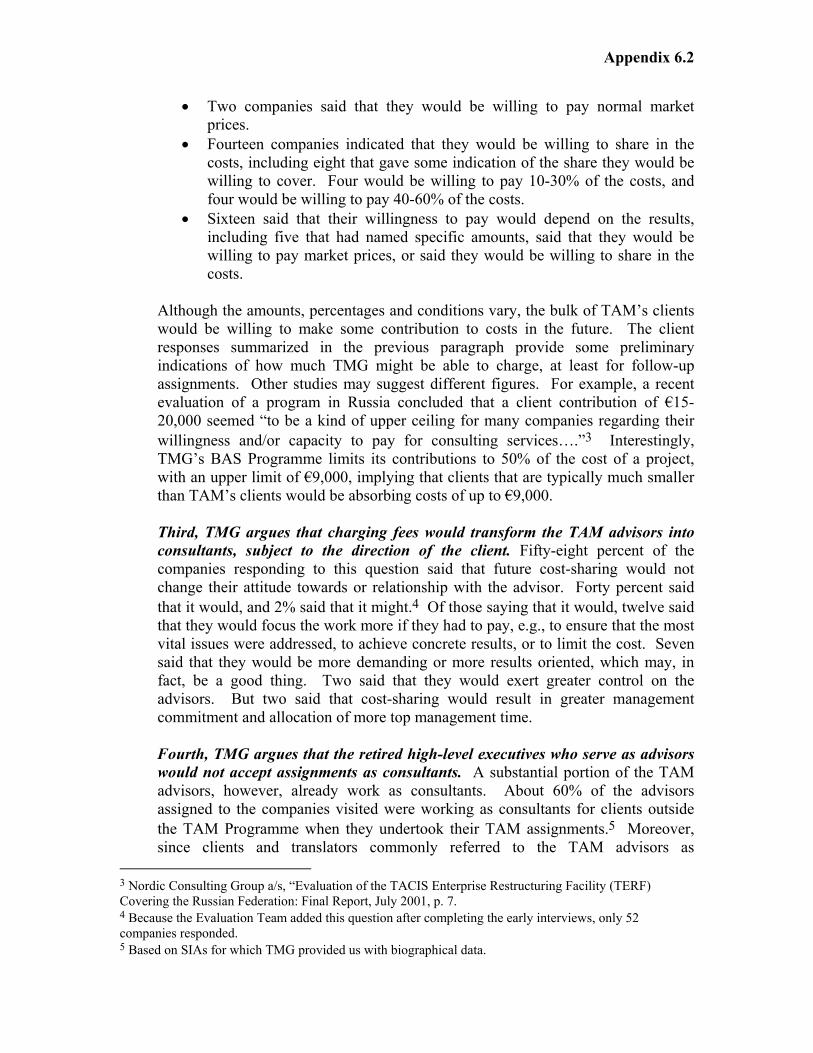
Appendix 6.2
•
•
•
Two companies said that they would be willing to pay normal market prices. Fourteen companies indicated that they would be willing to share in the costs, including eight that gave some indication of the share they would be willing to cover. Four would be willing to pay 10-30% of the costs, and four would be willing to pay 40-60% of the costs. Sixteen said that their willingness to pay would depend on the results, including five that had named specific amounts, said that they would be willing to pay market prices, or said they would be willing to share in the costs.
Although the amounts, percentages and conditions vary, the bulk of TAM’s clients would be willing to make some contribution to costs in the future. The client responses summarized in the previous paragraph provide some preliminary indications of how much TMG might be able to charge, at least for follow-up assignments. Other studies may suggest different figures. For example, a recent evaluation of a program in Russia concluded that a client contribution of €15-20,000 seemed “to be a kind of upper ceiling for many companies regarding their willingness and/or capacity to pay for consulting services….”3 Interestingly, TMG’s BAS Programme limits its contributions to 50% of the cost of a project, with an upper limit of €9,000, implying that clients that are typically much smaller than TAM’s clients would be absorbing costs of up to €9,000. Third, TMG argues that charging fees would transform the TAM advisors into consultants, subject to the direction of the client. Fifty-eight percent of the companies responding to this question said that future cost-sharing would not change their attitude towards or relationship with the advisor. Forty percent said that it would, and 2% said that it might.4 Of those saying that it would, twelve said that they would focus the work more if they had to pay, e.g., to ensure that the most vital issues were addressed, to achieve concrete results, or to limit the cost. Seven said that they would be more demanding or more results oriented, which may, in fact, be a good thing. Two said that they would exert greater control on the advisors. But two said that cost-sharing would result in greater management commitment and allocation of more top management time. Fourth, TMG argues that the retired high-level executives who serve as advisors would not accept assignments as consultants. A substantial portion of the TAM advisors, however, already work as consultants. About 60% of the advisors assigned to the companies visited were working as consultants for clients outside the TAM Programme when they undertook their TAM assignments.5 Moreover, since clients and translators commonly referred to the TAM advisors as
3 Nordic Consulting Group a/s, “Evaluation of the TACIS Enterprise Restructuring Facility (TERF) Covering the Russian Federation: Final Report, July 2001, p. 7. 4 Because the Evaluation Team added this question after completing the early interviews, only 52 companies responded. 5 Based on SIAs for which TMG provided us with biographical data.
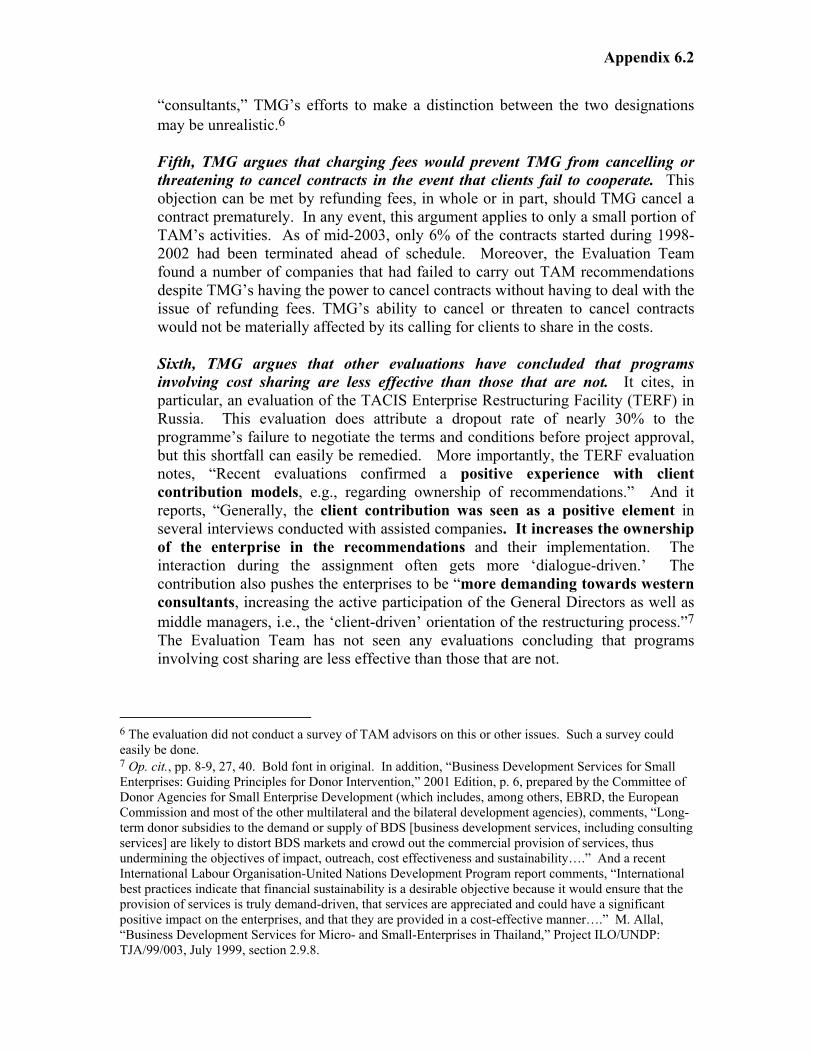
Appendix 6.2
“consultants,” TMG’s efforts to make a distinction between the two designations may be unrealistic.6 Fifth, TMG argues that charging fees would prevent TMG from cancelling or threatening to cancel contracts in the event that clients fail to cooperate. This objection can be met by refunding fees, in whole or in part, should TMG cancel a contract prematurely. In any event, this argument applies to only a small portion of TAM’s activities. As of mid-2003, only 6% of the contracts started during 1998-2002 had been terminated ahead of schedule. Moreover, the Evaluation Team found a number of companies that had failed to carry out TAM recommendations despite TMG’s having the power to cancel contracts without having to deal with the issue of refunding fees. TMG’s ability to cancel or threaten to cancel contracts would not be materially affected by its calling for clients to share in the costs. Sixth, TMG argues that other evaluations have concluded that programs involving cost sharing are less effective than those that are not. It cites, in particular, an evaluation of the TACIS Enterprise Restructuring Facility (TERF) in Russia. This evaluation does attribute a dropout rate of nearly 30% to the programme’s failure to negotiate the terms and conditions before project approval, but this shortfall can easily be remedied. More importantly, the TERF evaluation notes, “Recent evaluations confirmed a positive experience with client contribution models, e.g., regarding ownership of recommendations.” And it reports, “Generally, the client contribution was seen as a positive element in several interviews conducted with assisted companies. It increases the ownership of the enterprise in the recommendations and their implementation. The interaction during the assignment often gets more ‘dialogue-driven.’ The contribution also pushes the enterprises to be “more demanding towards western consultants, increasing the active participation of the General Directors as well as middle managers, i.e., the ‘client-driven’ orientation of the restructuring process.”7 The Evaluation Team has not seen any evaluations concluding that programs involving cost sharing are less effective than those that are not.
6 The evaluation did not conduct a survey of TAM advisors on this or other issues. Such a survey could easily be done. 7 Op. cit., pp. 8-9, 27, 40. Bold font in original. In addition, “Business Development Services for Small Enterprises: Guiding Principles for Donor Intervention,” 2001 Edition, p. 6, prepared by the Committee of Donor Agencies for Small Enterprise Development (which includes, among others, EBRD, the European Commission and most of the other multilateral and the bilateral development agencies), comments, “Long-term donor subsidies to the demand or supply of BDS [business development services, including consulting services] are likely to distort BDS markets and crowd out the commercial provision of services, thus undermining the objectives of impact, outreach, cost effectiveness and sustainability….” And a recent International Labour Organisation-United Nations Development Program report comments, “International best practices indicate that financial sustainability is a desirable objective because it would ensure that the provision of services is truly demand-driven, that services are appreciated and could have a significant positive impact on the enterprises, and that they are provided in a cost-effective manner….” M. Allal, “Business Development Services for Micro- and Small-Enterprises in Thailand,” Project ILO/UNDP: TJA/99/003, July 1999, section 2.9.8.
Appendix 6.2
Seventh, TMG argues that EBRD would be exposed to potential liabilities if it charged fees for its advisors. Insurance can be arranged to cover this risk. TMG believes that the premium would be very high. This question can easily be resolved by checking with EBRD’s insurance brokers. The cost is unlikely to exceed the additional revenue that TMG could generate by cost sharing. Eighth, TMG argues that negotiating the fees would take additional time and that companies in dire straits would suffer from these delays. Fees need not be charged to companies in dire straits. In any event, very few TAM clients fit this category. Ninth, TMG argues that charging fees would impose an additional administrative burden on TMG. The incremental costs are likely to be far below the incremental revenues. Tenth, TMG argues that changing a highly successful programme opens up risks of undermining the programme. This argument has some validity, but it also has important flaws. It ignores the fact that failure to address problems can also undermine a programme. TMG’s continuing concern about its own sustainability calls for it to give serious consideration to the possibility of recovering some of its costs from its clients. TAM may be very effective today, but it will not be effective tomorrow if it cannot raise sufficient funding to survive. Moreover, the argument ignores the fact that TAM has started only about 120 new assignments per year over the past few years. This number is miniscule in comparison with the number of companies that could benefit from TAM advisors. For TAM to expand its coverage, it needs additional resources.
Despite all these arguments, TMG does seek a significant level of cost sharing on its BAS Programme. It typically calls for BAS clients, which are generally much smaller than those served by TAM, to cover 50% of the cost of the services provided. Although the sums involved are lower, one would expect BAS clients to be less able and willing to pay. Nevertheless, since BAS contributes up to €9,000per project, it must call for some of its clients to pay €9,000.
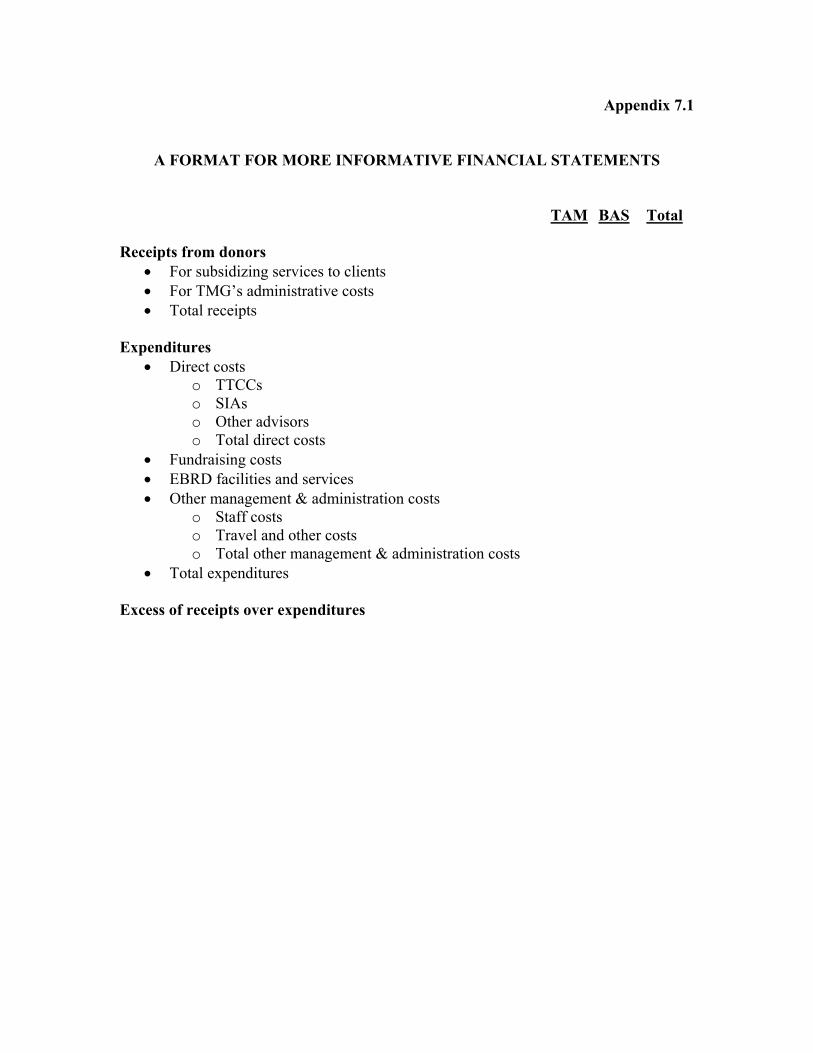
Appendix 7.1
A FORMAT FOR MORE INFORMATIVE FINANCIAL STATEMENTS
TAM BAS Total Receipts from donors
• • •
•
• • •
•
For subsidizing services to clients For TMG’s administrative costs Total receipts
Expenditures
Direct costs o TTCCs o SIAs o Other advisors o Total direct costs
Fundraising costs EBRD facilities and services Other management & administration costs
o Staff costs o Travel and other costs o Total other management & administration costs
Total expenditures Excess of receipts over expenditures
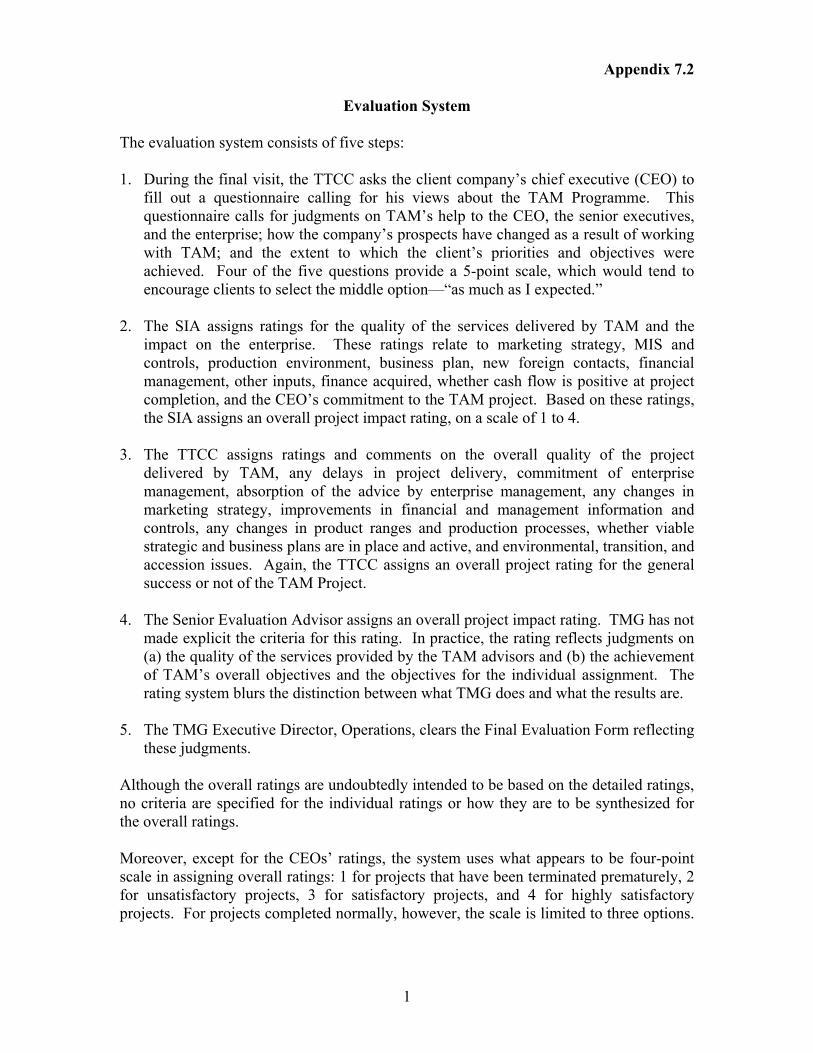
Appendix 7.2
Evaluation System
The evaluation system consists of five steps: 1. During the final visit, the TTCC asks the client company’s chief executive (CEO) to
fill out a questionnaire calling for his views about the TAM Programme. This questionnaire calls for judgments on TAM’s help to the CEO, the senior executives, and the enterprise; how the company’s prospects have changed as a result of working with TAM; and the extent to which the client’s priorities and objectives were achieved. Four of the five questions provide a 5-point scale, which would tend to encourage clients to select the middle option—“as much as I expected.”
2. The SIA assigns ratings for the quality of the services delivered by TAM and the
impact on the enterprise. These ratings relate to marketing strategy, MIS and controls, production environment, business plan, new foreign contacts, financial management, other inputs, finance acquired, whether cash flow is positive at project completion, and the CEO’s commitment to the TAM project. Based on these ratings, the SIA assigns an overall project impact rating, on a scale of 1 to 4.
3. The TTCC assigns ratings and comments on the overall quality of the project
delivered by TAM, any delays in project delivery, commitment of enterprise management, absorption of the advice by enterprise management, any changes in marketing strategy, improvements in financial and management information and controls, any changes in product ranges and production processes, whether viable strategic and business plans are in place and active, and environmental, transition, and accession issues. Again, the TTCC assigns an overall project rating for the general success or not of the TAM Project.
4. The Senior Evaluation Advisor assigns an overall project impact rating. TMG has not
made explicit the criteria for this rating. In practice, the rating reflects judgments on (a) the quality of the services provided by the TAM advisors and (b) the achievement of TAM’s overall objectives and the objectives for the individual assignment. The rating system blurs the distinction between what TMG does and what the results are.
5. The TMG Executive Director, Operations, clears the Final Evaluation Form reflecting
these judgments. Although the overall ratings are undoubtedly intended to be based on the detailed ratings, no criteria are specified for the individual ratings or how they are to be synthesized for the overall ratings. Moreover, except for the CEOs’ ratings, the system uses what appears to be four-point scale in assigning overall ratings: 1 for projects that have been terminated prematurely, 2 for unsatisfactory projects, 3 for satisfactory projects, and 4 for highly satisfactory projects. For projects completed normally, however, the scale is limited to three options.
1

2
As in any scale with an odd number of rankings, the persons assigning ratings tend to opt for the middle option.1
1 TMG changed its earlier 5-point scale to this 4-point scale in 2001 “to conform to the Bank’s PED rating system.” (Minutes of March 2001 Supervisory Board Review Meeting.) This change may have brought TMG into line with the form of PED’s system but not the substance.
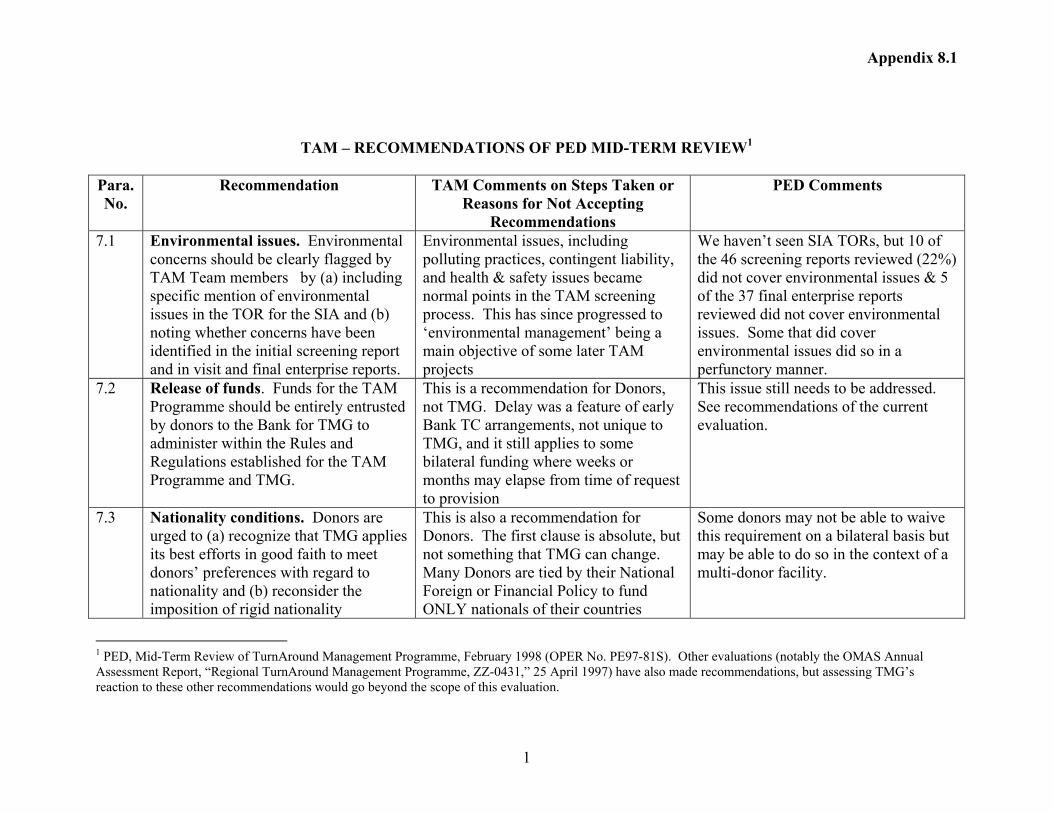
Appendix 8.1
TAM – RECOMMENDATIONS OF PED MID-TERM REVIEW1
Para. No.
Recommendation TAM Comments on Steps Taken or Reasons for Not Accepting
Recommendations
PED Comments
7.1 Environmental issues. Environmental concerns should be clearly flagged by TAM Team members by (a) including specific mention of environmental issues in the TOR for the SIA and (b) noting whether concerns have been identified in the initial screening report and in visit and final enterprise reports.
Environmental issues, including polluting practices, contingent liability, and health & safety issues became normal points in the TAM screening process. This has since progressed to ‘environmental management’ being a main objective of some later TAM projects
We haven’t seen SIA TORs, but 10 of the 46 screening reports reviewed (22%) did not cover environmental issues & 5 of the 37 final enterprise reports reviewed did not cover environmental issues. Some that did cover environmental issues did so in a perfunctory manner.
7.2 Release of funds. Funds for the TAM Programme should be entirely entrusted by donors to the Bank for TMG to administer within the Rules and Regulations established for the TAM Programme and TMG.
This is a recommendation for Donors, not TMG. Delay was a feature of early Bank TC arrangements, not unique to TMG, and it still applies to some bilateral funding where weeks or months may elapse from time of request to provision
This issue still needs to be addressed. See recommendations of the current evaluation.
7.3 Nationality conditions. Donors are urged to (a) recognize that TMG applies its best efforts in good faith to meet donors’ preferences with regard to nationality and (b) reconsider the imposition of rigid nationality
This is also a recommendation for Donors. The first clause is absolute, but not something that TMG can change. Many Donors are tied by their National Foreign or Financial Policy to fund ONLY nationals of their countries
Some donors may not be able to waive this requirement on a bilateral basis but may be able to do so in the context of a multi-donor facility.
1 PED, Mid-Term Review of TurnAround Management Programme, February 1998 (OPER No. PE97-81S). Other evaluations (notably the OMAS Annual Assessment Report, “Regional TurnAround Management Programme, ZZ-0431,” 25 April 1997) have also made recommendations, but assessing TMG’s reaction to these other recommendations would go beyond the scope of this evaluation.
1
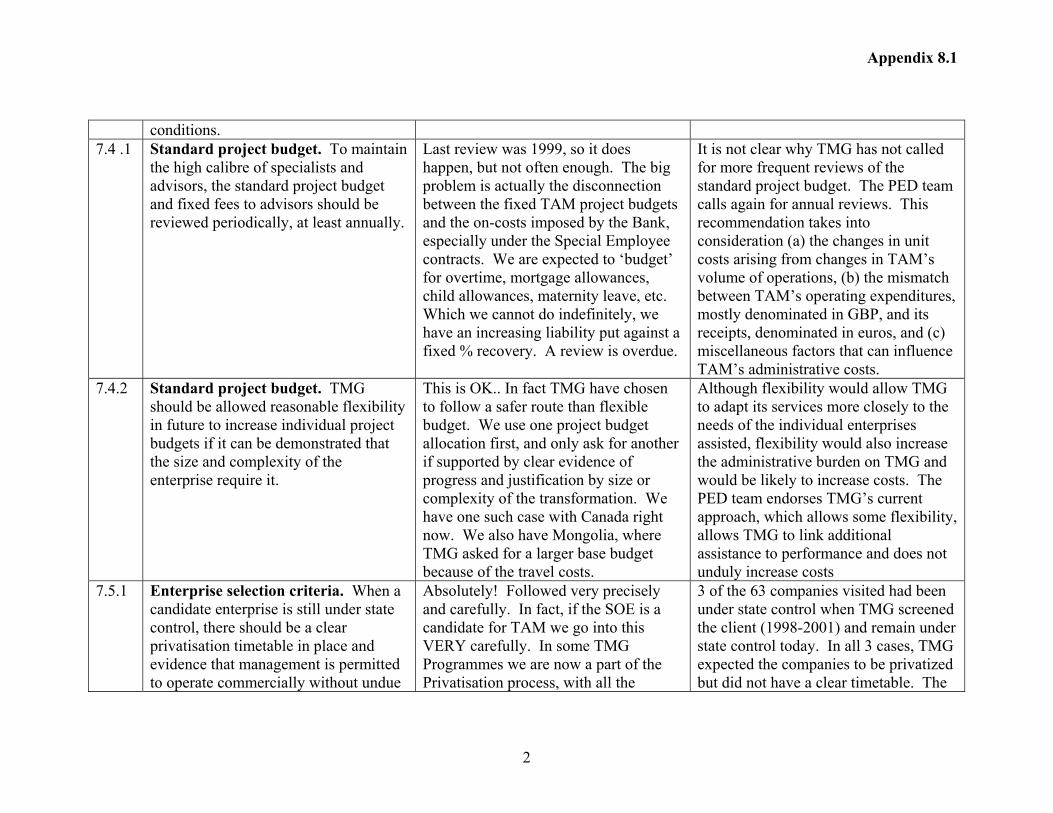
Appendix 8.1
conditions. 7.4 .1 Standard project budget. To maintain
the high calibre of specialists and advisors, the standard project budget and fixed fees to advisors should be reviewed periodically, at least annually.
Last review was 1999, so it does happen, but not often enough. The big problem is actually the disconnection between the fixed TAM project budgets and the on-costs imposed by the Bank, especially under the Special Employee contracts. We are expected to ‘budget’ for overtime, mortgage allowances, child allowances, maternity leave, etc. Which we cannot do indefinitely, we have an increasing liability put against a fixed % recovery. A review is overdue.
It is not clear why TMG has not called for more frequent reviews of the standard project budget. The PED team calls again for annual reviews. This recommendation takes into consideration (a) the changes in unit costs arising from changes in TAM’s volume of operations, (b) the mismatch between TAM’s operating expenditures, mostly denominated in GBP, and its receipts, denominated in euros, and (c) miscellaneous factors that can influence TAM’s administrative costs.
7.4.2 Standard project budget. TMG should be allowed reasonable flexibility in future to increase individual project budgets if it can be demonstrated that the size and complexity of the enterprise require it.
This is OK.. In fact TMG have chosen to follow a safer route than flexible budget. We use one project budget allocation first, and only ask for another if supported by clear evidence of progress and justification by size or complexity of the transformation. We have one such case with Canada right now. We also have Mongolia, where TMG asked for a larger base budget because of the travel costs.
Although flexibility would allow TMG to adapt its services more closely to the needs of the individual enterprises assisted, flexibility would also increase the administrative burden on TMG and would be likely to increase costs. The PED team endorses TMG’s current approach, which allows some flexibility, allows TMG to link additional assistance to performance and does not unduly increase costs
7.5.1 Enterprise selection criteria. When a candidate enterprise is still under state control, there should be a clear privatisation timetable in place and evidence that management is permitted to operate commercially without undue
Absolutely! Followed very precisely and carefully. In fact, if the SOE is a candidate for TAM we go into this VERY carefully. In some TMG Programmes we are now a part of the Privatisation process, with all the
3 of the 63 companies visited had been under state control when TMG screened the client (1998-2001) and remain under state control today. In all 3 cases, TMG expected the companies to be privatized but did not have a clear timetable. The
2
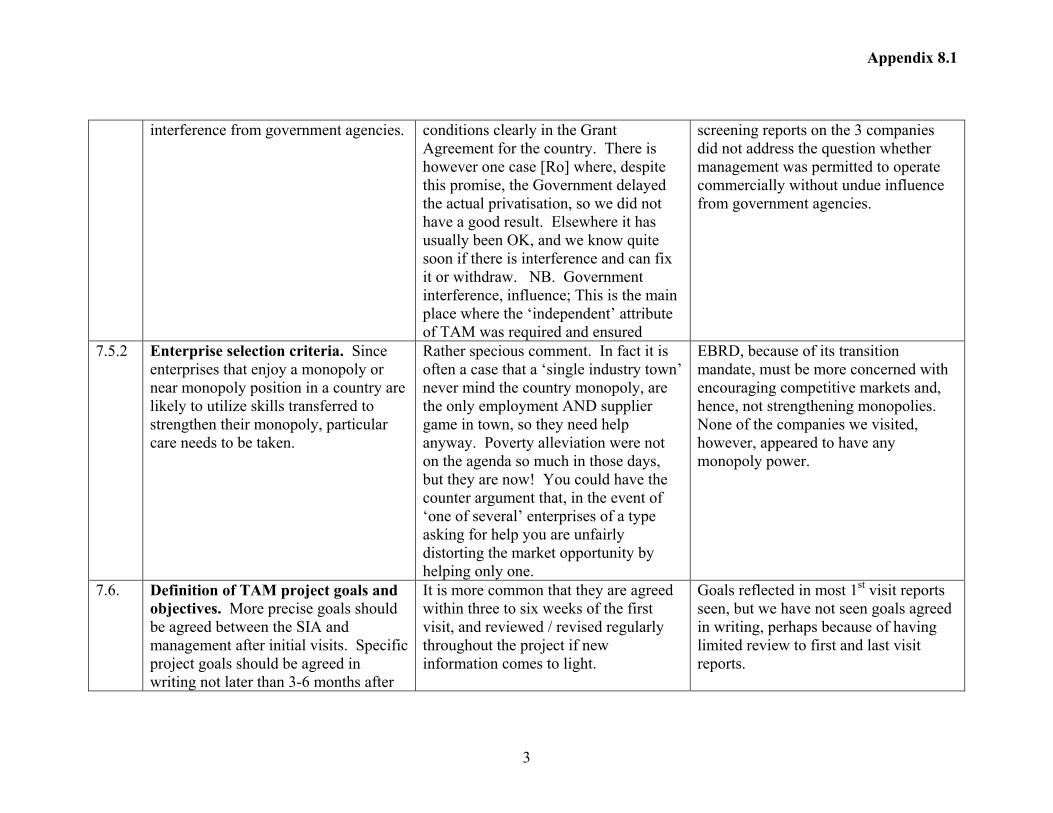
Appendix 8.1
interference from government agencies. conditions clearly in the Grant Agreement for the country. There is however one case [Ro] where, despite this promise, the Government delayed the actual privatisation, so we did not have a good result. Elsewhere it has usually been OK, and we know quite soon if there is interference and can fix it or withdraw. NB. Government interference, influence; This is the main place where the ‘independent’ attribute of TAM was required and ensured
screening reports on the 3 companies did not address the question whether management was permitted to operate commercially without undue influence from government agencies.
7.5.2 Enterprise selection criteria. Since enterprises that enjoy a monopoly or near monopoly position in a country are likely to utilize skills transferred to strengthen their monopoly, particular care needs to be taken.
Rather specious comment. In fact it is often a case that a ‘single industry town’ never mind the country monopoly, are the only employment AND supplier game in town, so they need help anyway. Poverty alleviation were not on the agenda so much in those days, but they are now! You could have the counter argument that, in the event of ‘one of several’ enterprises of a type asking for help you are unfairly distorting the market opportunity by helping only one.
EBRD, because of its transition mandate, must be more concerned with encouraging competitive markets and, hence, not strengthening monopolies. None of the companies we visited, however, appeared to have any monopoly power.
7.6. Definition of TAM project goals and objectives. More precise goals should be agreed between the SIA and management after initial visits. Specific project goals should be agreed in writing not later than 3-6 months after
It is more common that they are agreed within three to six weeks of the first visit, and reviewed / revised regularly throughout the project if new information comes to light.
Goals reflected in most 1st visit reports seen, but we have not seen goals agreed in writing, perhaps because of having limited review to first and last visit reports.
3
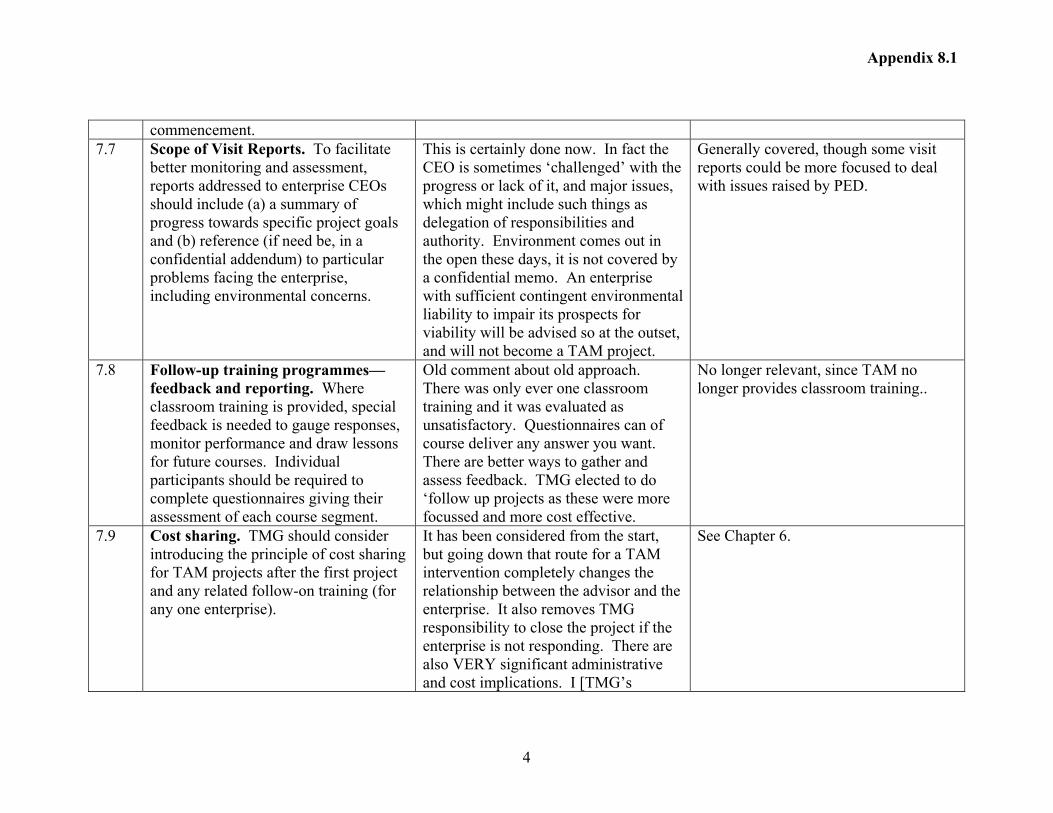
Appendix 8.1
commencement. 7.7 Scope of Visit Reports. To facilitate
better monitoring and assessment, reports addressed to enterprise CEOs should include (a) a summary of progress towards specific project goals and (b) reference (if need be, in a confidential addendum) to particular problems facing the enterprise, including environmental concerns.
This is certainly done now. In fact the CEO is sometimes ‘challenged’ with the progress or lack of it, and major issues, which might include such things as delegation of responsibilities and authority. Environment comes out in the open these days, it is not covered by a confidential memo. An enterprise with sufficient contingent environmental liability to impair its prospects for viability will be advised so at the outset, and will not become a TAM project.
Generally covered, though some visit reports could be more focused to deal with issues raised by PED.
7.8 Follow-up training programmes—feedback and reporting. Where classroom training is provided, special feedback is needed to gauge responses, monitor performance and draw lessons for future courses. Individual participants should be required to complete questionnaires giving their assessment of each course segment.
Old comment about old approach. There was only ever one classroom training and it was evaluated as unsatisfactory. Questionnaires can of course deliver any answer you want. There are better ways to gather and assess feedback. TMG elected to do ‘follow up projects as these were more focussed and more cost effective.
No longer relevant, since TAM no longer provides classroom training..
7.9 Cost sharing. TMG should consider introducing the principle of cost sharing for TAM projects after the first project and any related follow-on training (for any one enterprise).
It has been considered from the start, but going down that route for a TAM intervention completely changes the relationship between the advisor and the enterprise. It also removes TMG responsibility to close the project if the enterprise is not responding. There are also VERY significant administrative and cost implications. I [TMG’s
See Chapter 6.
4
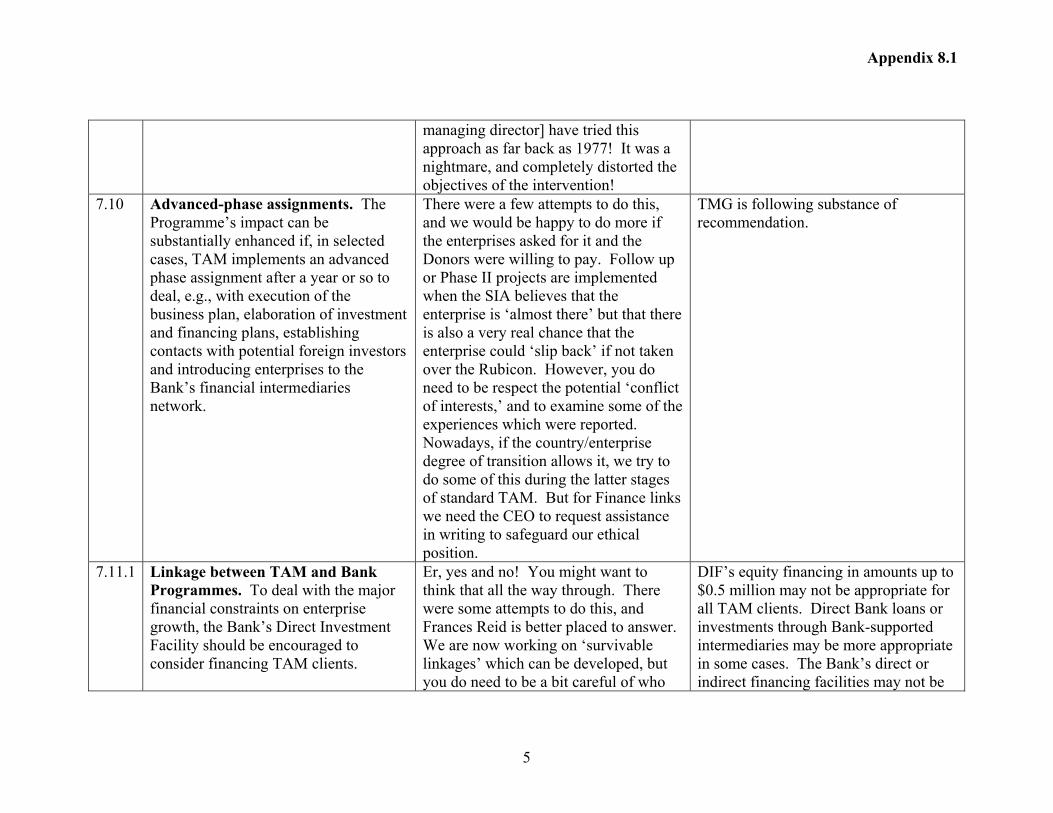
Appendix 8.1
managing director] have tried this approach as far back as 1977! It was a nightmare, and completely distorted the objectives of the intervention!
7.10 Advanced-phase assignments. The Programme’s impact can be substantially enhanced if, in selected cases, TAM implements an advanced phase assignment after a year or so to deal, e.g., with execution of the business plan, elaboration of investment and financing plans, establishing contacts with potential foreign investors and introducing enterprises to the Bank’s financial intermediaries network.
There were a few attempts to do this, and we would be happy to do more if the enterprises asked for it and the Donors were willing to pay. Follow up or Phase II projects are implemented when the SIA believes that the enterprise is ‘almost there’ but that there is also a very real chance that the enterprise could ‘slip back’ if not taken over the Rubicon. However, you do need to be respect the potential ‘conflict of interests,’ and to examine some of the experiences which were reported. Nowadays, if the country/enterprise degree of transition allows it, we try to do some of this during the latter stages of standard TAM. But for Finance links we need the CEO to request assistance in writing to safeguard our ethical position.
TMG is following substance of recommendation.
7.11.1 Linkage between TAM and Bank Programmes. To deal with the major financial constraints on enterprise growth, the Bank’s Direct Investment Facility should be encouraged to consider financing TAM clients.
Er, yes and no! You might want to think that all the way through. There were some attempts to do this, and Frances Reid is better placed to answer. We are now working on ‘survivable linkages’ which can be developed, but you do need to be a bit careful of who
DIF’s equity financing in amounts up to $0.5 million may not be appropriate for all TAM clients. Direct Bank loans or investments through Bank-supported intermediaries may be more appropriate in some cases. The Bank’s direct or indirect financing facilities may not be
5
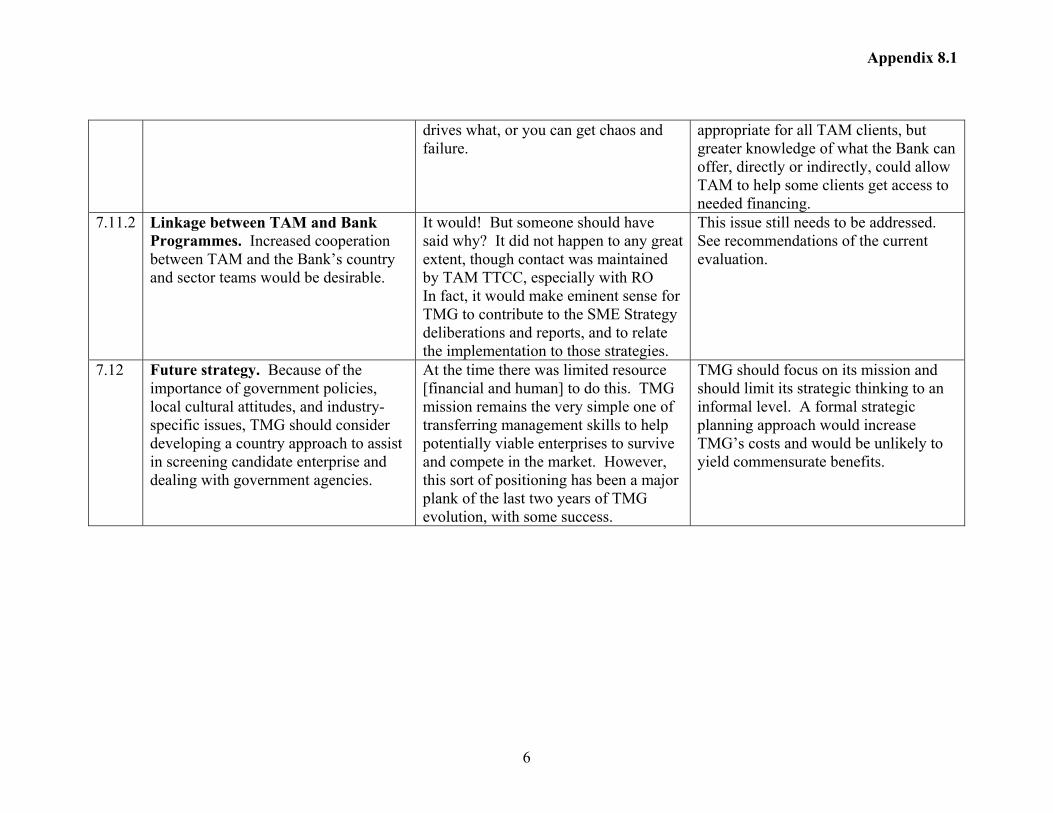
Appendix 8.1
6
drives what, or you can get chaos and failure.
appropriate for all TAM clients, but greater knowledge of what the Bank can offer, directly or indirectly, could allow TAM to help some clients get access to needed financing.
7.11.2 Linkage between TAM and Bank Programmes. Increased cooperation between TAM and the Bank’s country and sector teams would be desirable.
It would! But someone should have said why? It did not happen to any great extent, though contact was maintained by TAM TTCC, especially with RO In fact, it would make eminent sense for TMG to contribute to the SME Strategy deliberations and reports, and to relate the implementation to those strategies.
This issue still needs to be addressed. See recommendations of the current evaluation.
7.12 Future strategy. Because of the importance of government policies, local cultural attitudes, and industry-specific issues, TMG should consider developing a country approach to assist in screening candidate enterprise and dealing with government agencies.
At the time there was limited resource [financial and human] to do this. TMG mission remains the very simple one of transferring management skills to help potentially viable enterprises to survive and compete in the market. However, this sort of positioning has been a major plank of the last two years of TMG evolution, with some success.
TMG should focus on its mission and should limit its strategic thinking to an informal level. A formal strategic planning approach would increase TMG’s costs and would be unlikely to yield commensurate benefits.


![A Framework to Prolong Interval of Turnaround Maintenance ...ieomsociety.org/pilsen2019/papers/180.pdf · Duffua and Daya [4] reported that TAM is a periodic maintenance during a](https://img.pdfslide.us/doc/110x75/5e9c0f66ce0fcc198267de2b/a-framework-to-prolong-interval-of-turnaround-maintenance-duffua-and-daya-4.jpg)