Embed Size (px)
Citation preview
Special Risks in ETFs
Addressing Myths and Uncovering Real Concerns
Sponsored by:
Speakers:
Dave Nadig Director of Research IndexUniverse
Joel Dickson Senior Investment Analyst & Principal Vanguard
Matt Hougan President, ETF Analytics Global Head of Editorial IndexUniverse
Paul Britt ETF Analyst IndexUniverse
Special Risks?
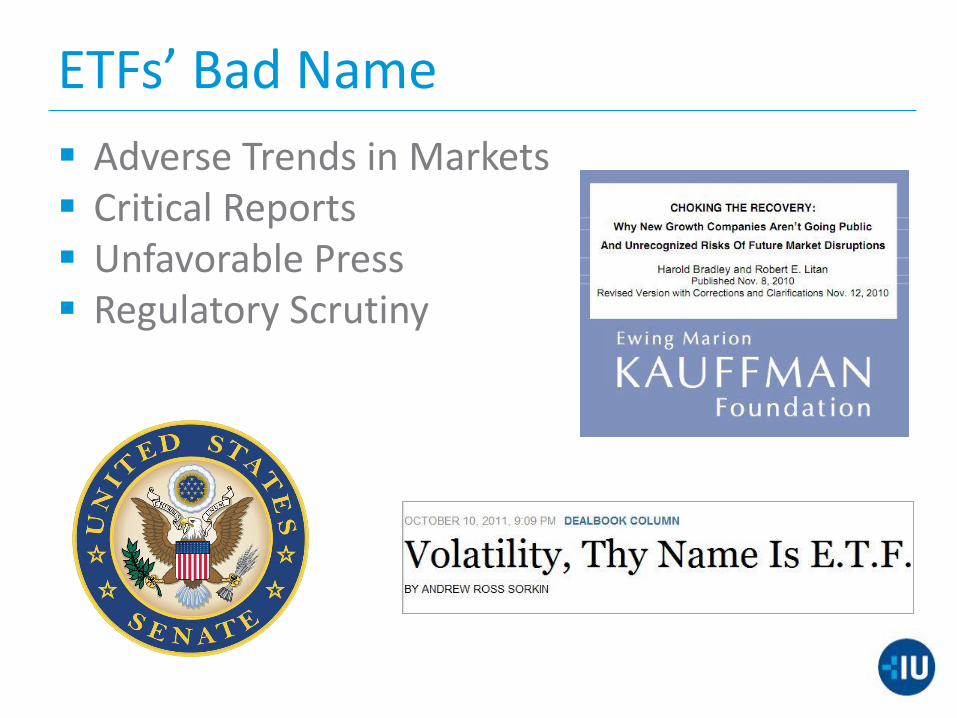
ETFs’ Bad Name
Adverse Trends in Markets Critical Reports Unfavorable Press Regulatory Scrutiny
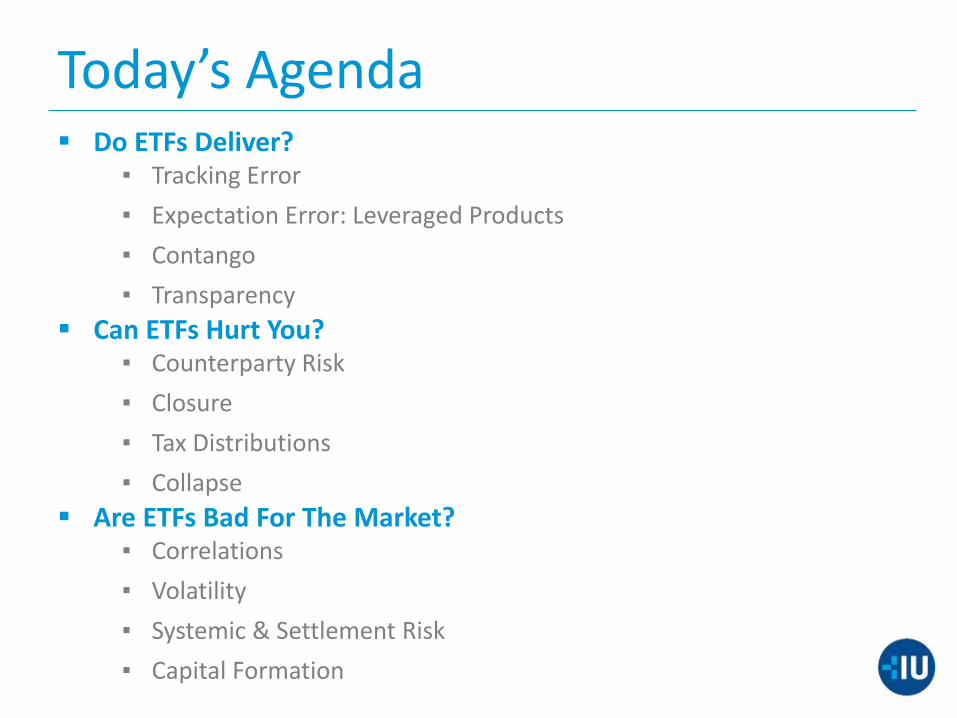
Today’s Agenda Do ETFs Deliver?
▪ Tracking Error
▪ Expectation Error: Leveraged Products
▪ Contango
▪ Transparency
Can ETFs Hurt You? ▪ Counterparty Risk
▪ Closure
▪ Tax Distributions
▪ Collapse
Are ETFs Bad For The Market? ▪ Correlations
▪ Volatility
▪ Systemic & Settlement Risk
▪ Capital Formation
Do ETFs Deliver?
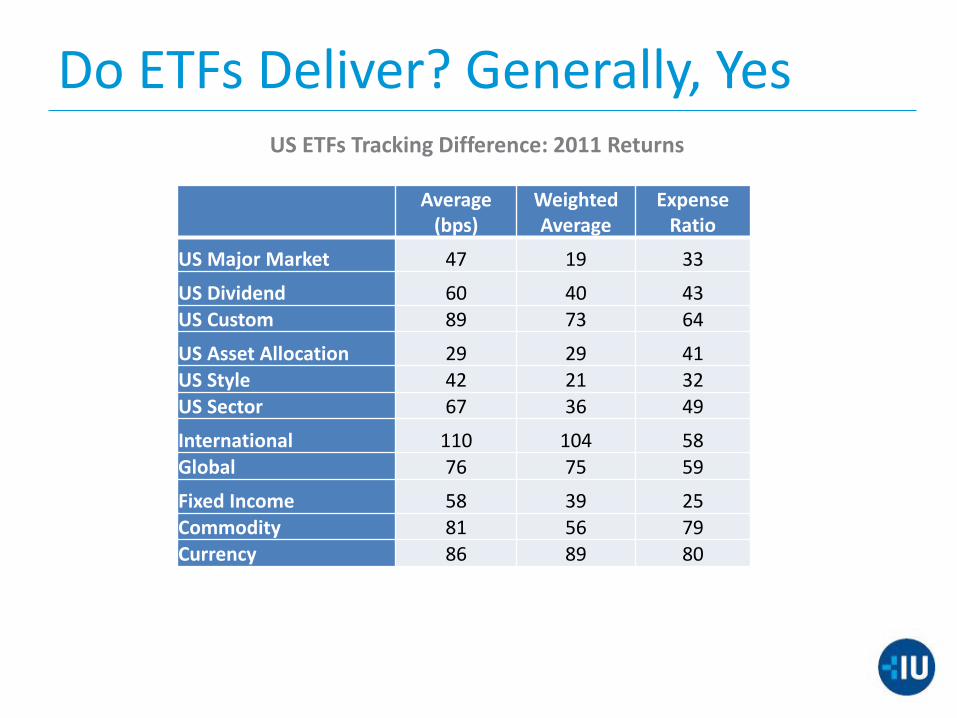
Do ETFs Deliver? Generally, Yes US ETFs Tracking Difference: 2011 Returns
Average
(bps) Weighted Average
Expense Ratio
US Major Market 47 19 33
US Dividend 60 40 43 US Custom 89 73 64
US Asset Allocation 29 29 41 US Style 42 21 32
US Sector 67 36 49
International 110 104 58
Global 76 75 59
Fixed Income 58 39 25
Commodity 81 56 79 Currency 86 89 80
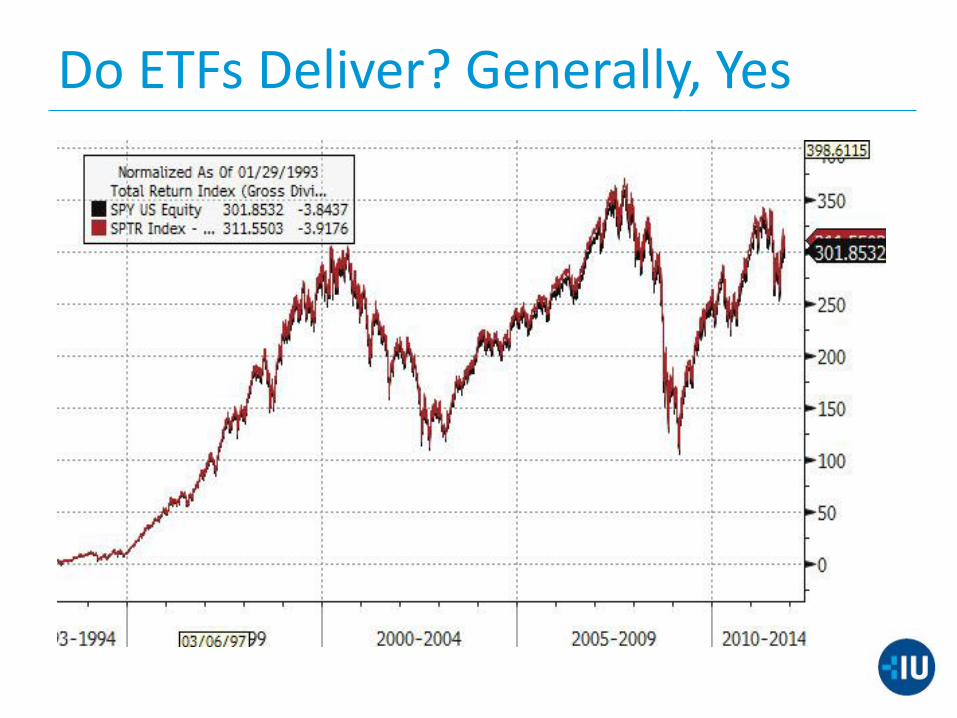
Do ETFs Deliver? Generally, Yes
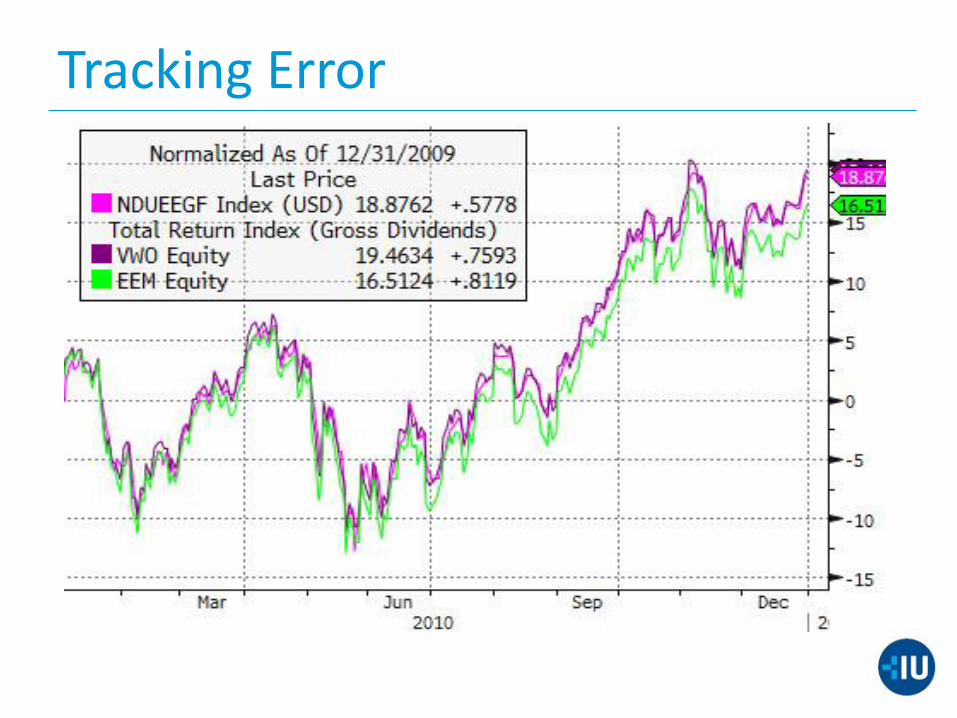
Tracking Error
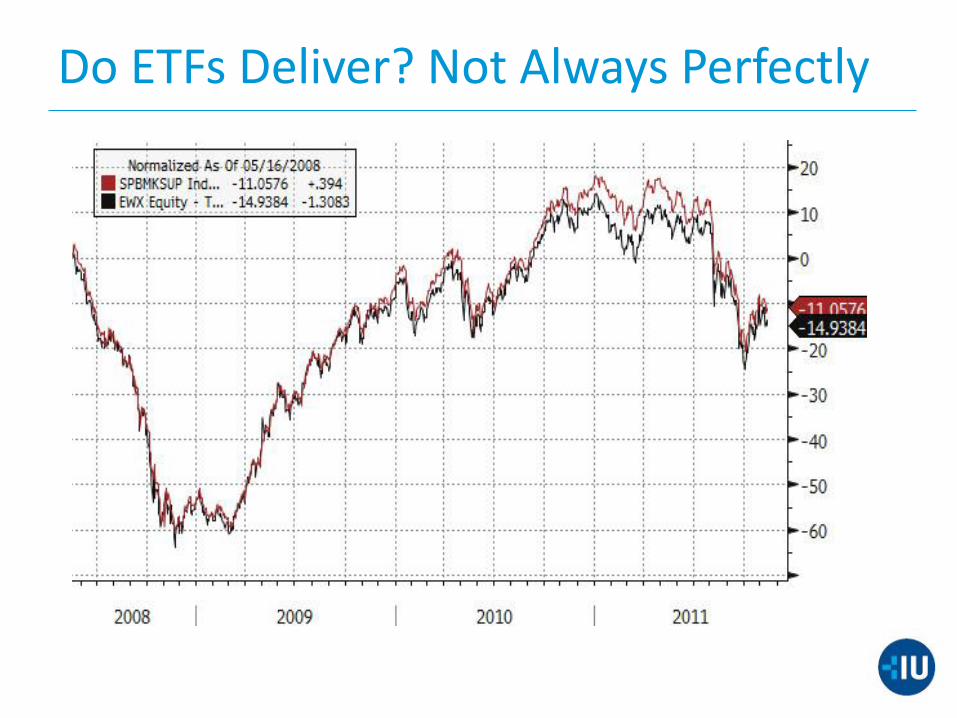
Do ETFs Deliver? Not Always Perfectly
Expectations Error
Daily Resetting: Leverage & Inverse
A Simple Promise: 1 Day’s Return
▪ Daily rebalance can ruin long term returns
▪ Is full disclosure adequate protection for retail investors?
▪ Minimal systemic risk impact
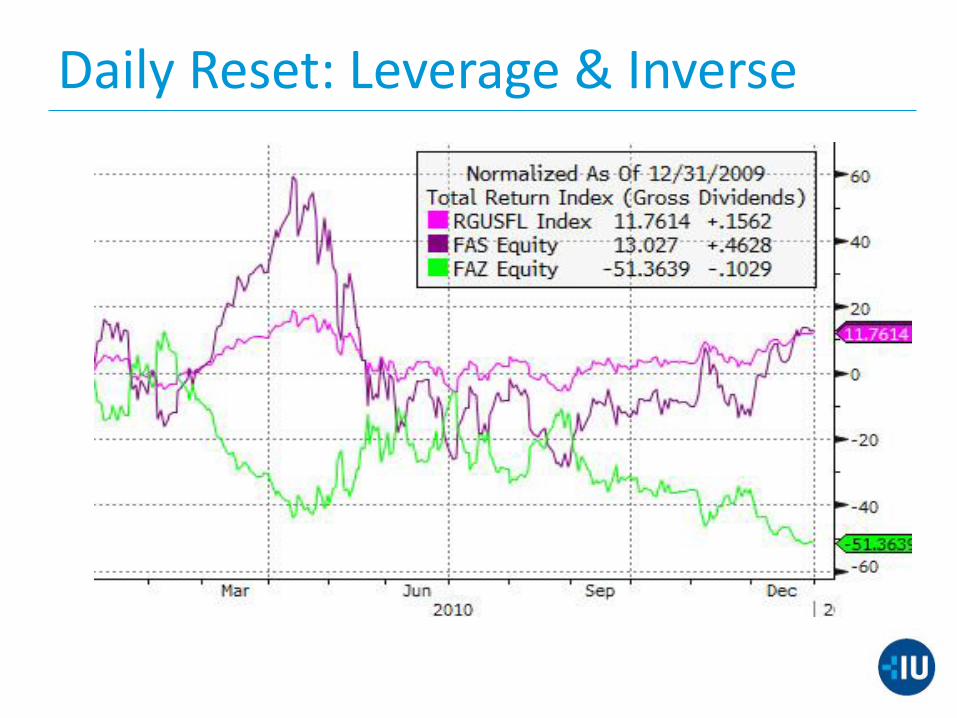
Daily Reset: Leverage & Inverse
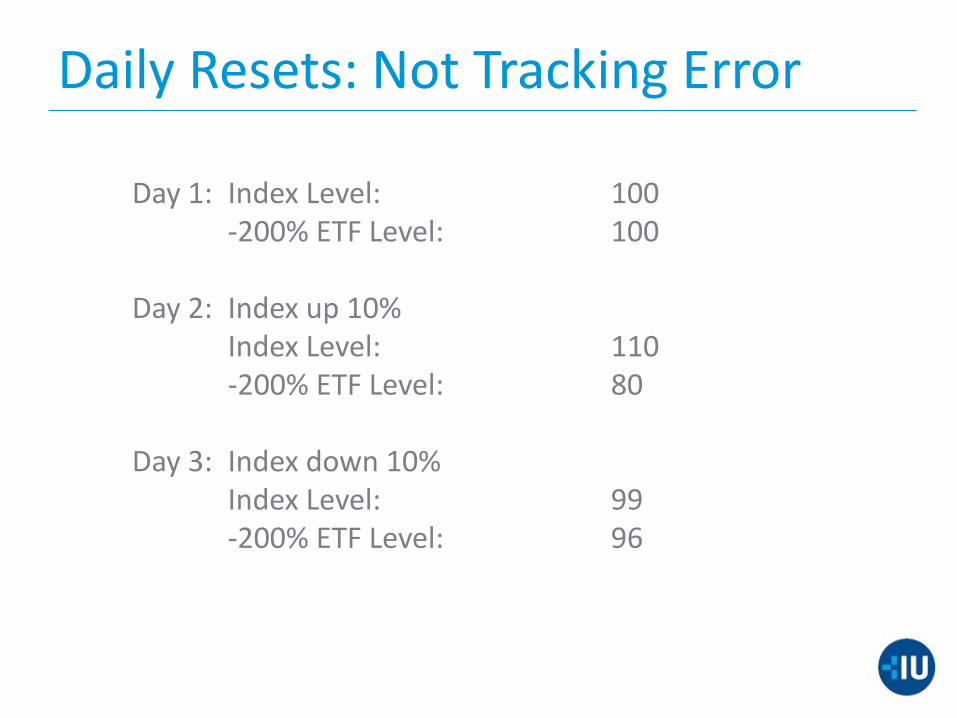
Daily Resets: Not Tracking Error
Day 1: Index Level: 100 -200% ETF Level: 100 Day 2: Index up 10% Index Level: 110 -200% ETF Level: 80 Day 3: Index down 10% Index Level: 99 -200% ETF Level: 96
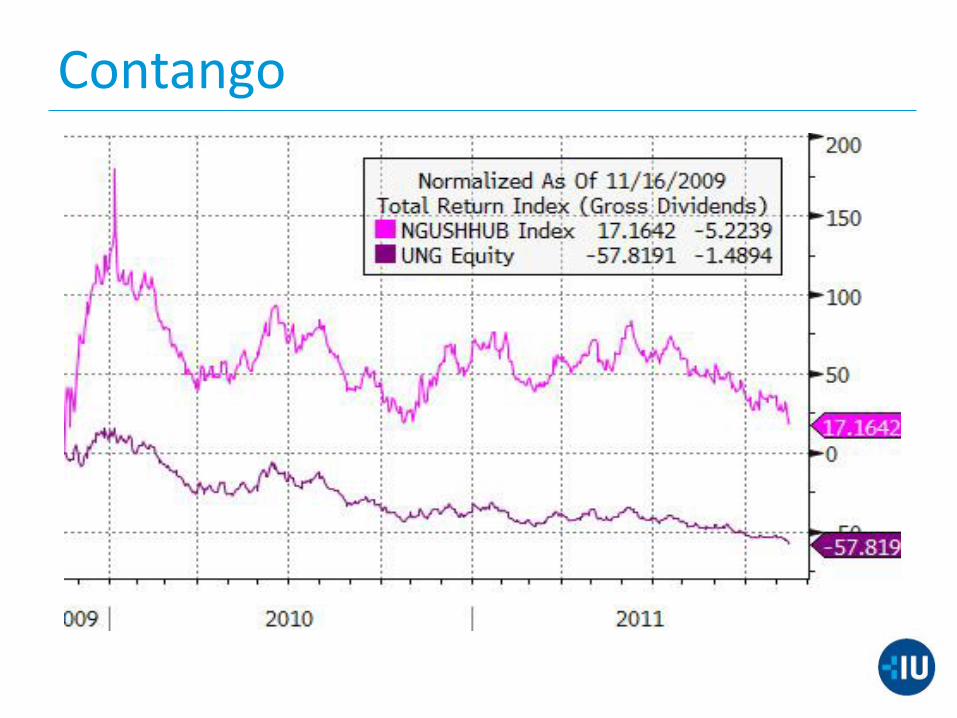
Contango
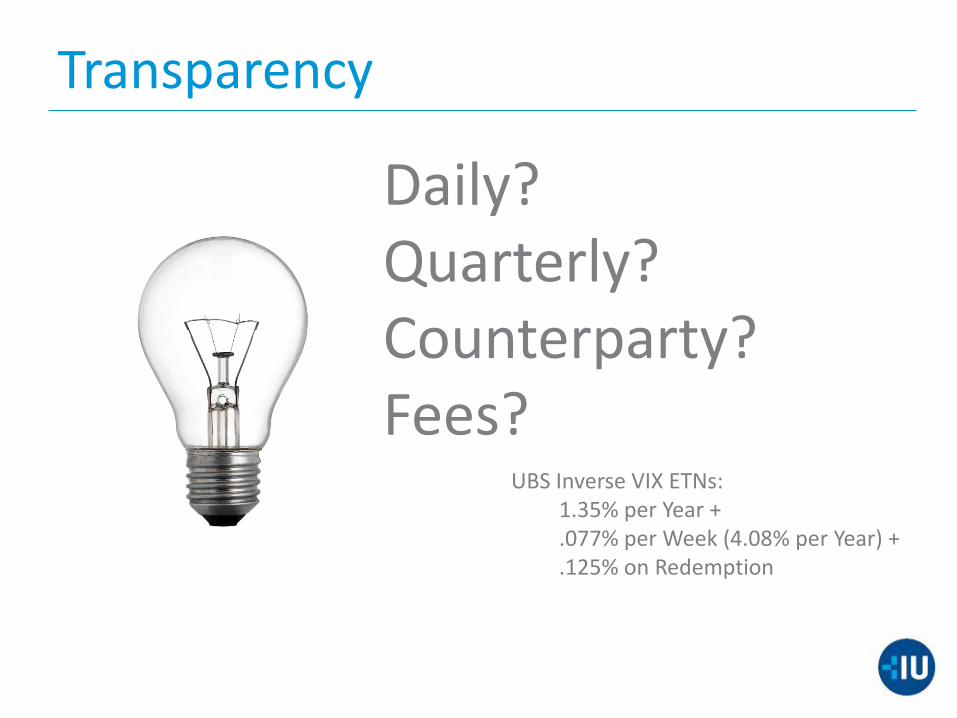
Transparency
Daily? Quarterly? Counterparty? Fees?
UBS Inverse VIX ETNs: 1.35% per Year + .077% per Week (4.08% per Year) + .125% on Redemption
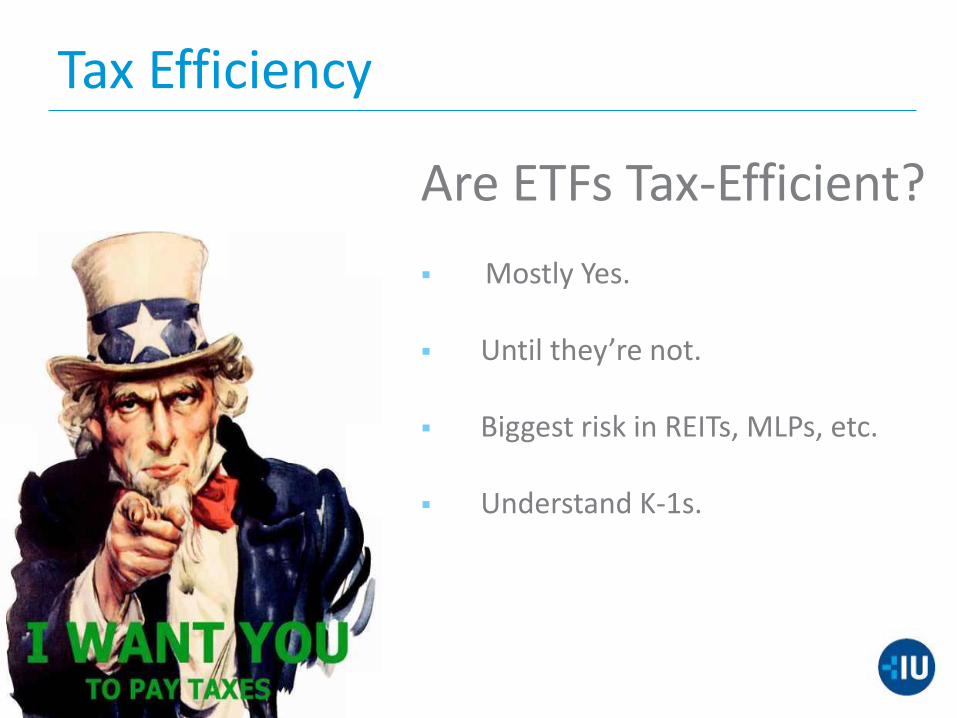
Tax Efficiency
Are ETFs Tax-Efficient? Mostly Yes.
Until they’re not.
Biggest risk in REITs, MLPs, etc.
Understand K-1s.
Can ETFs Hurt You?
Counterparty Risk Counterparty Risk is Real, but threatens
Individuals more than Markets
▪ ETN
▪ Over the Counter Derivatives
▪ Listed Derivatives*
▪ Securities Lending
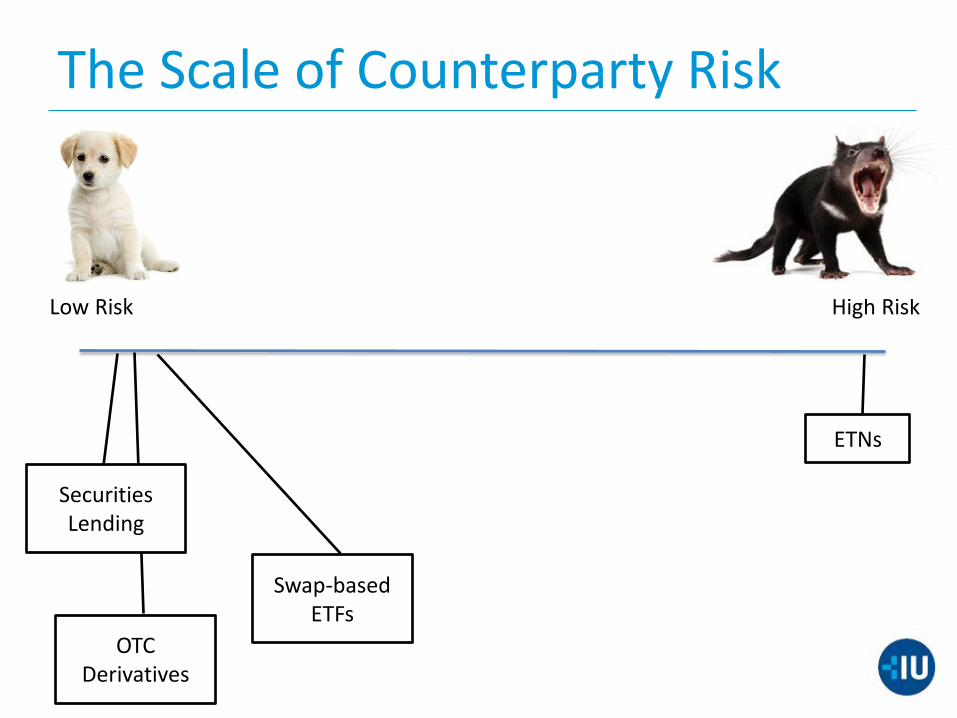
The Scale of Counterparty Risk
High Risk Low Risk
ETNs
Swap-based ETFs
OTC Derivatives
Securities Lending
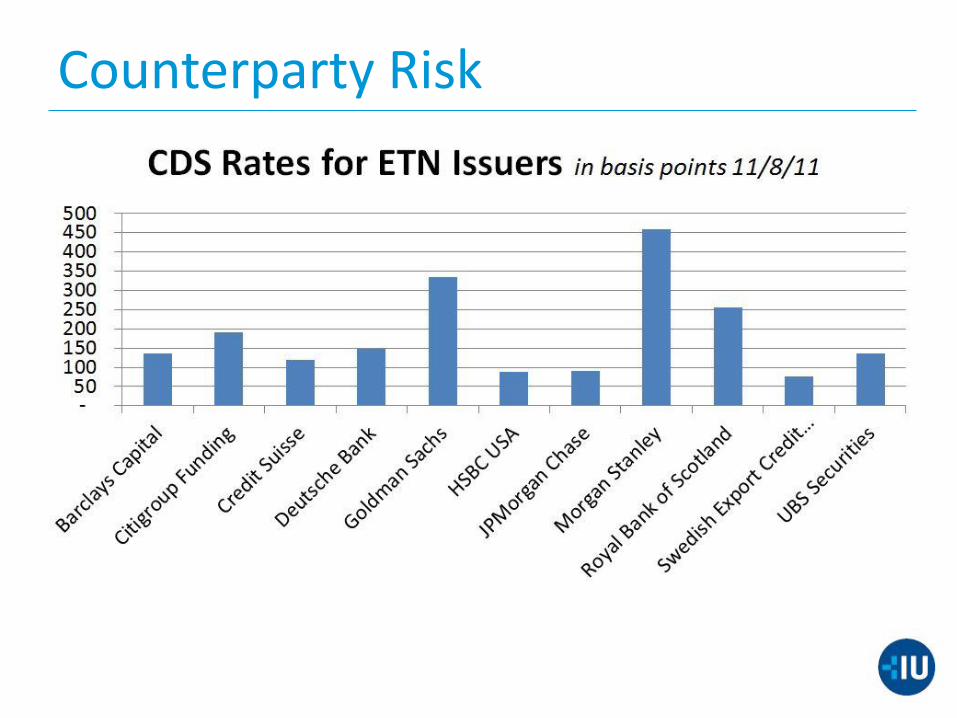
Counterparty Risk
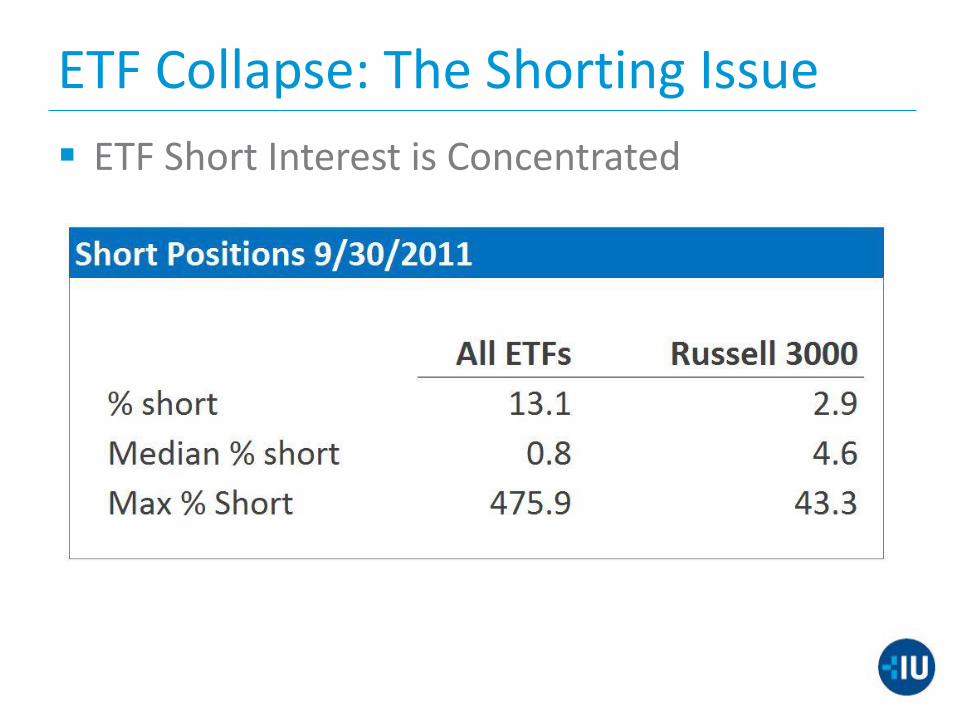
ETF Collapse: The Shorting Issue
ETF Short Interest is Concentrated
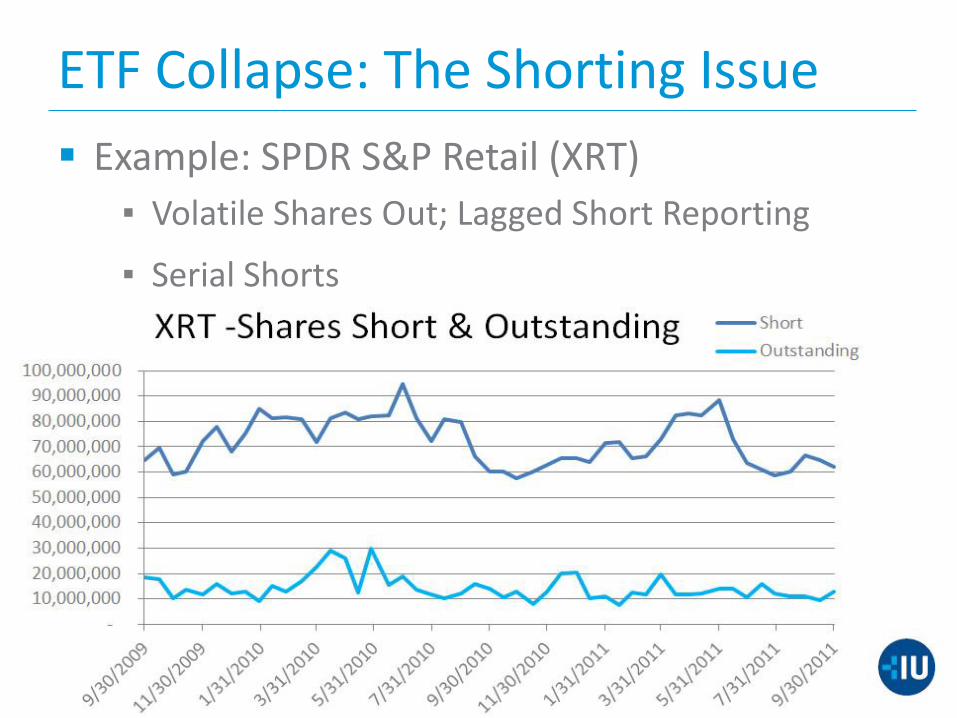
ETF Collapse: The Shorting Issue
Example: SPDR S&P Retail (XRT)
▪ Volatile Shares Out; Lagged Short Reporting
▪ Serial Shorts
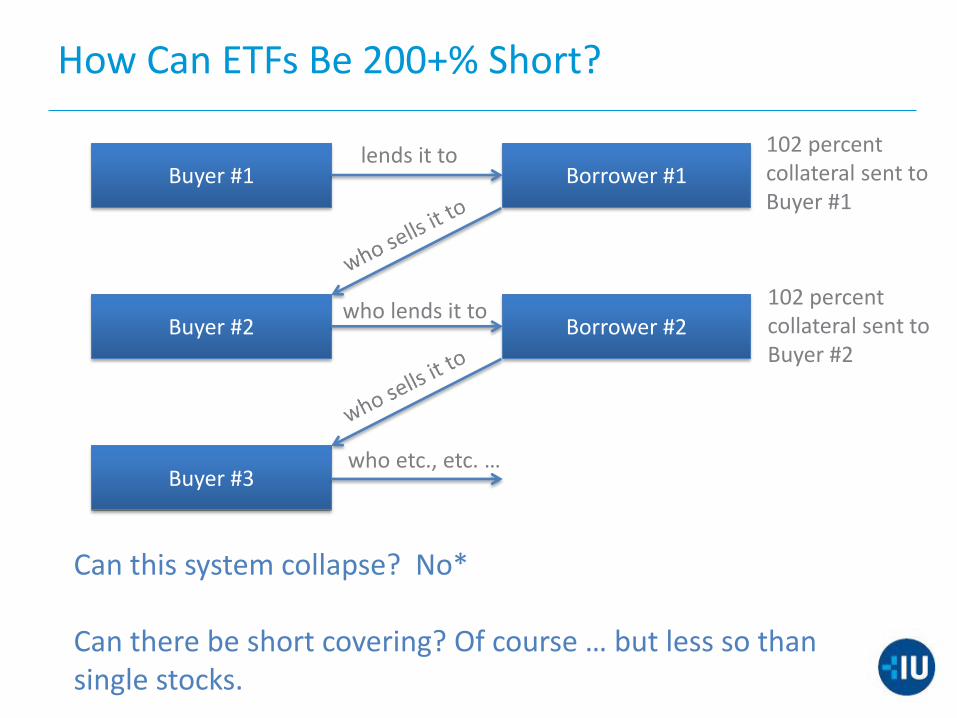
who lends it to
How Can ETFs Be 200+% Short?
Buyer #1 Borrower #1
Buyer #2
Buyer #3
lends it to 102 percent collateral sent to Buyer #1
102 percent collateral sent to Buyer #2
Can this system collapse? No* Can there be short covering? Of course … but less so than single stocks.
Borrower #2
who etc., etc. …
Are ETFs Bad for the Market?
Do ETFs break capital markets?
Are ETFs the tail that wags the dog?
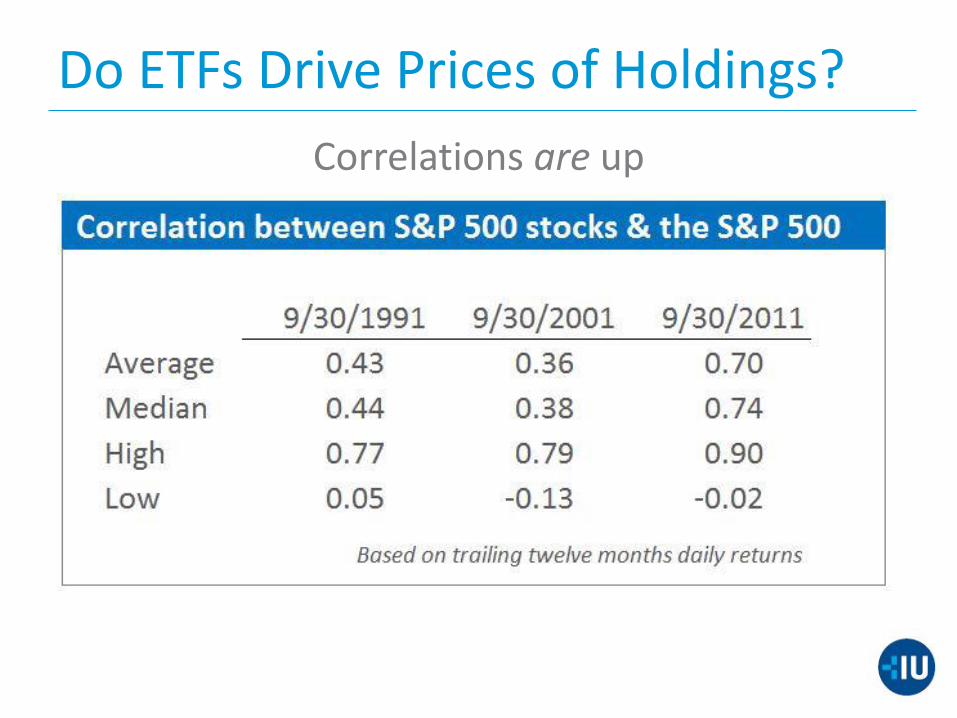
Do ETFs Drive Prices of Holdings?
Correlations are up
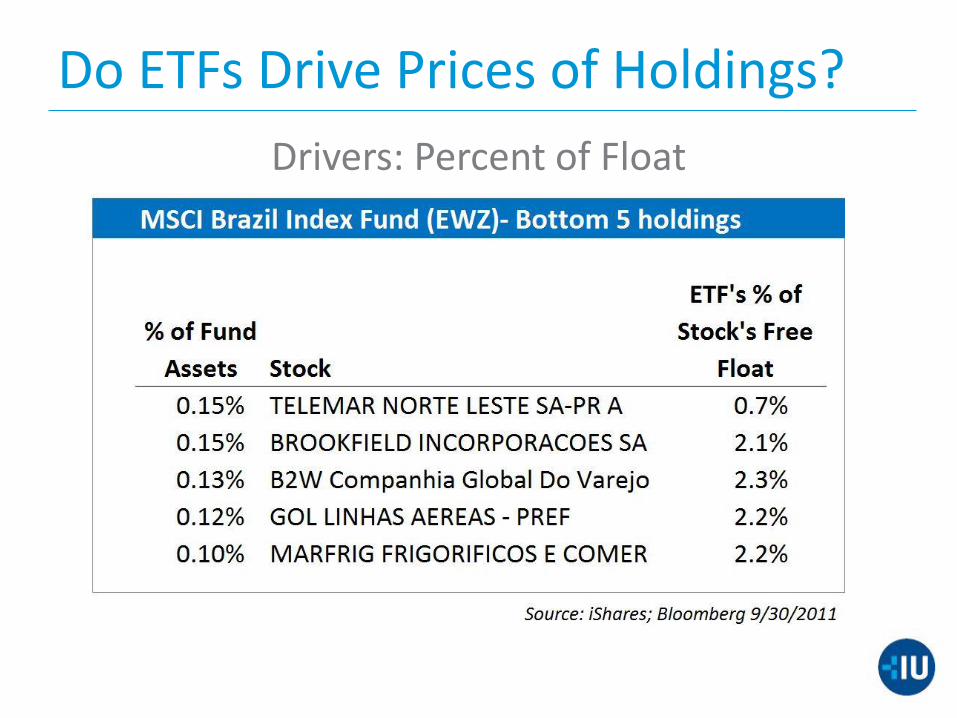
Do ETFs Drive Prices of Holdings?
Drivers: Percent of Float
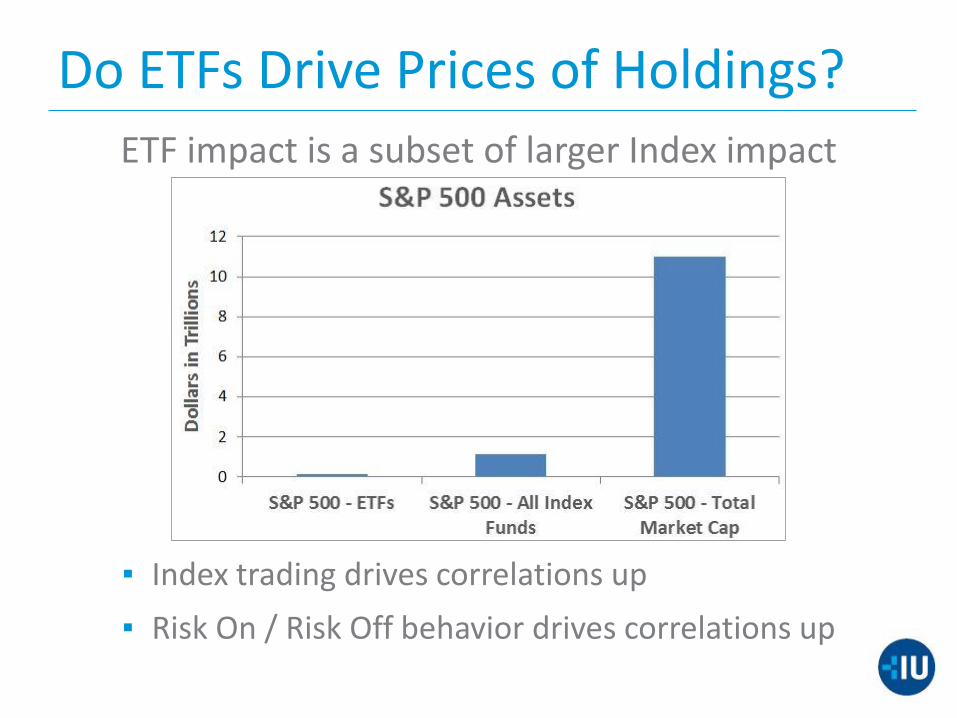
Do ETFs Drive Prices of Holdings?
ETF impact is a subset of larger Index impact
▪ Index trading drives correlations up
▪ Risk On / Risk Off behavior drives correlations up
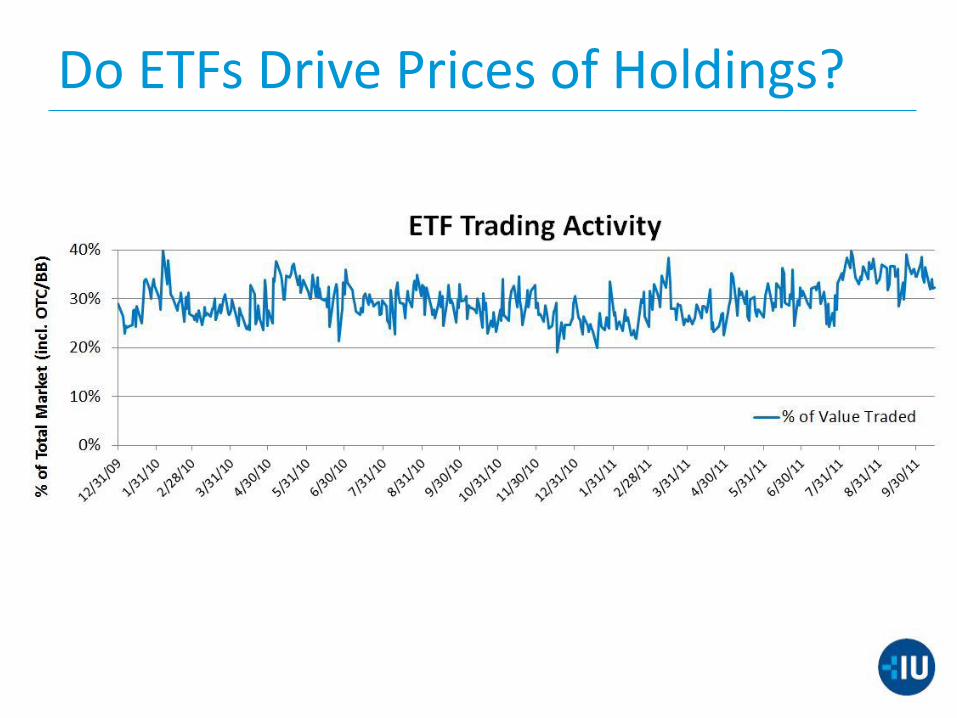
Do ETFs Drive Prices of Holdings?
Do ETFs Drive Prices of Holdings?
High Frequency Trading Increases Correlations
▪ Index Arbitrage
▪ Best Execution
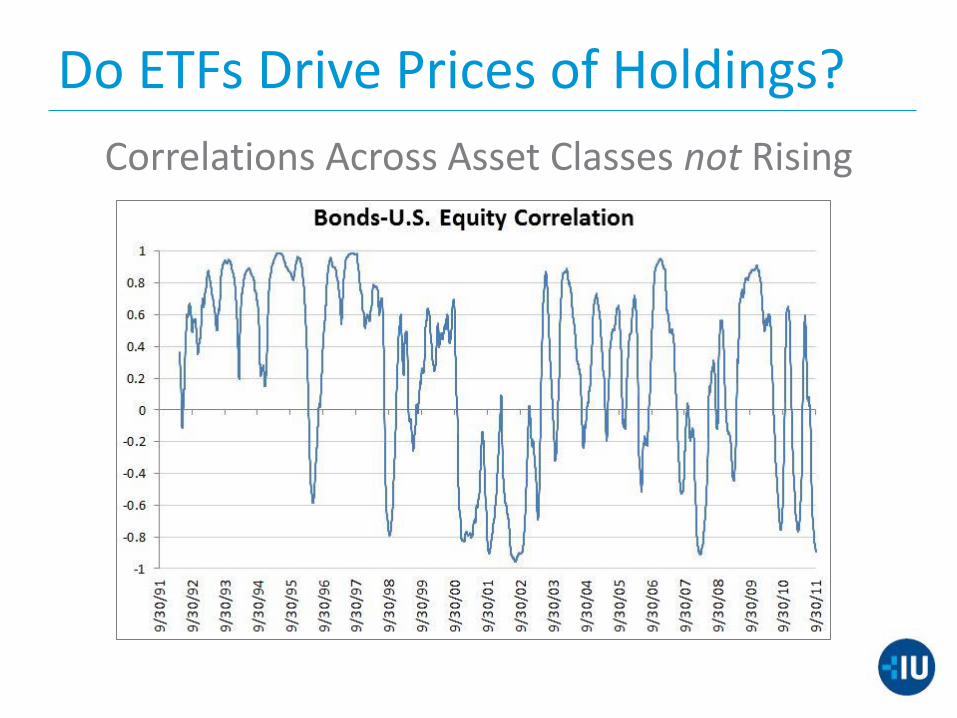
Do ETFs Drive Prices of Holdings?
Correlations Across Asset Classes not Rising
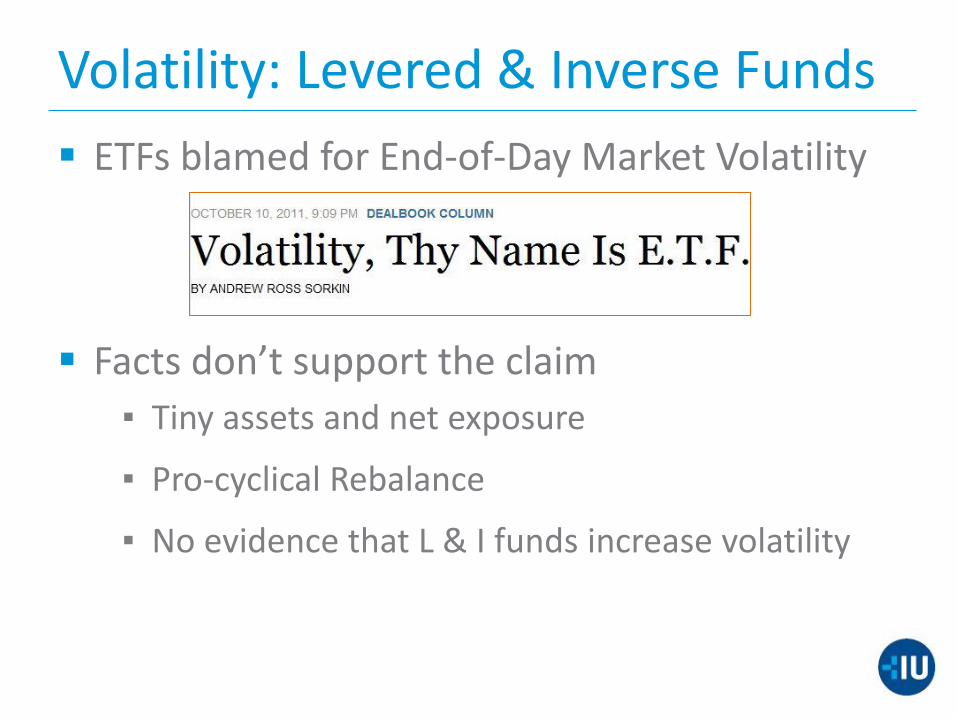
Volatility: Levered & Inverse Funds
ETFs blamed for End-of-Day Market Volatility
Facts don’t support the claim
▪ Tiny assets and net exposure
▪ Pro-cyclical Rebalance
▪ No evidence that L & I funds increase volatility
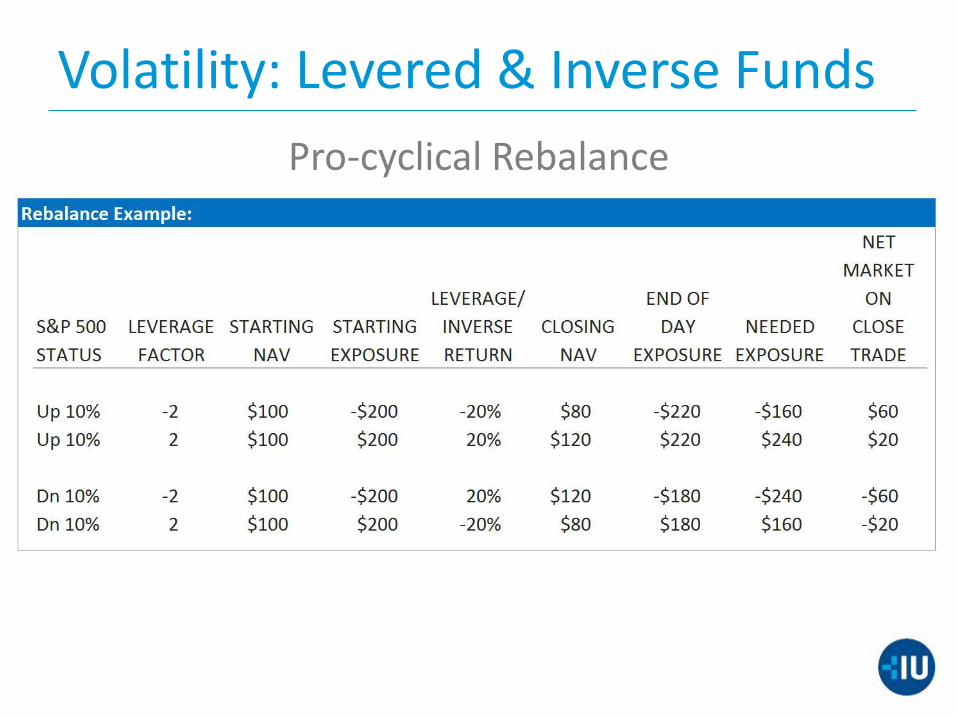
Volatility: Levered & Inverse Funds
Pro-cyclical Rebalance
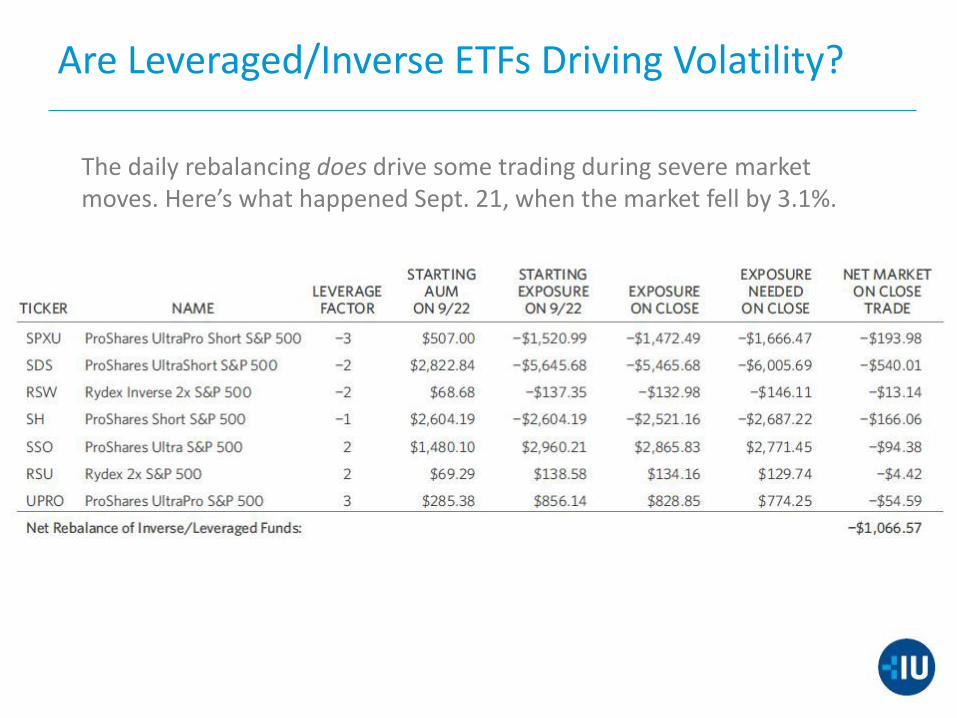
Are Leveraged/Inverse ETFs Driving Volatility?
The daily rebalancing does drive some trading during severe market moves. Here’s what happened Sept. 21, when the market fell by 3.1%.
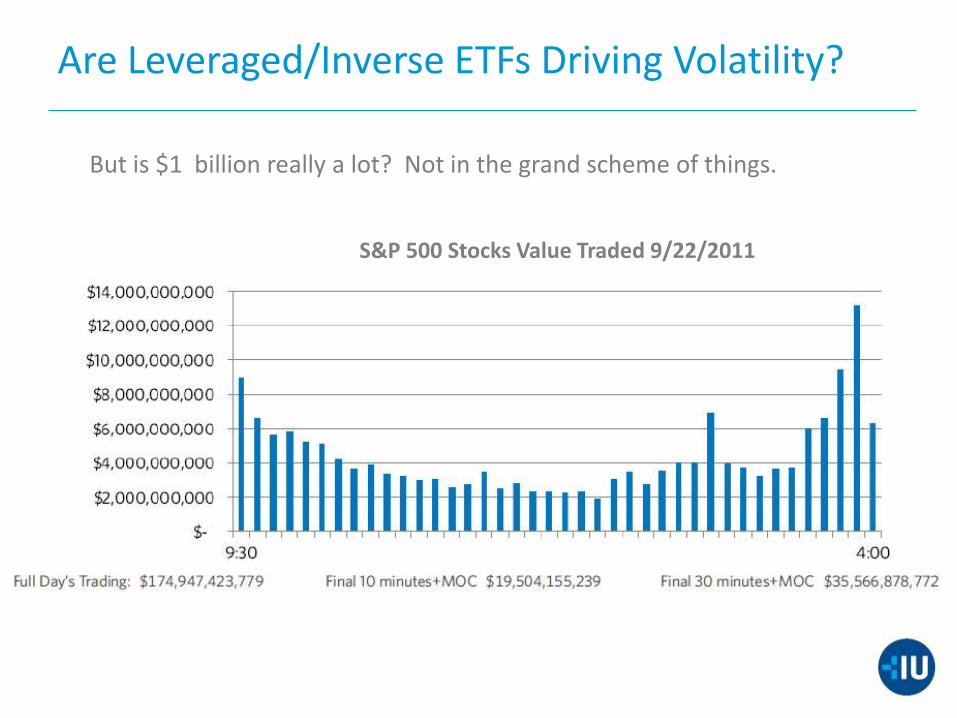
Are Leveraged/Inverse ETFs Driving Volatility?
But is $1 billion really a lot? Not in the grand scheme of things.
S&P 500 Stocks Value Traded 9/22/2011
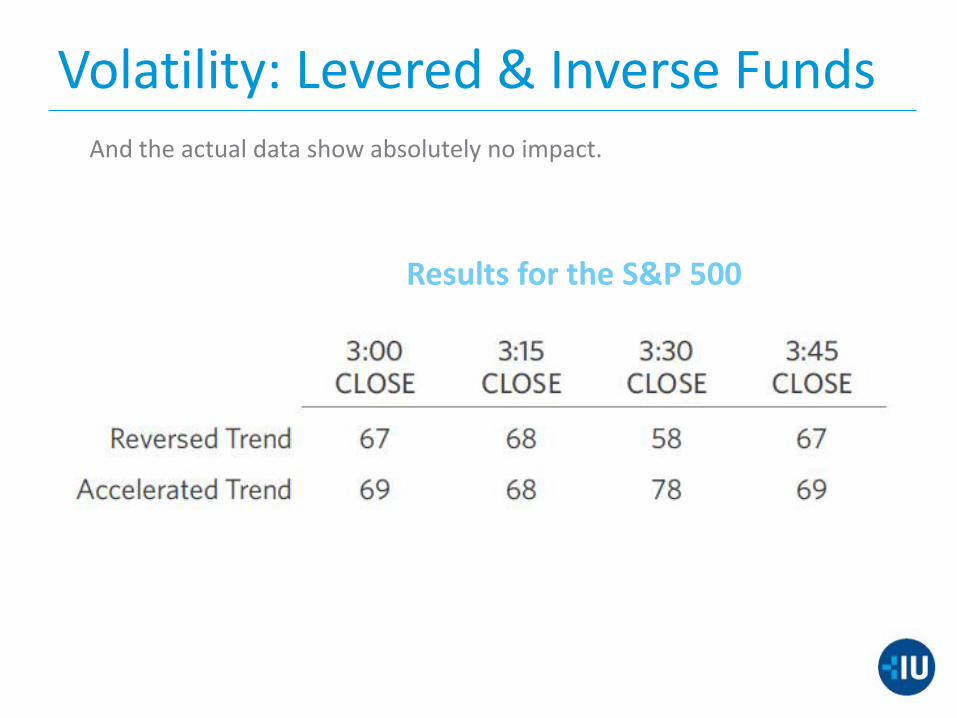
Volatility: Levered & Inverse Funds
Results for the S&P 500
And the actual data show absolutely no impact.
Broken Trades
Fact #1: Nearly Every security on the SHO list is an ETF.
Fact #2: Virtually no ETF trades “fail.”
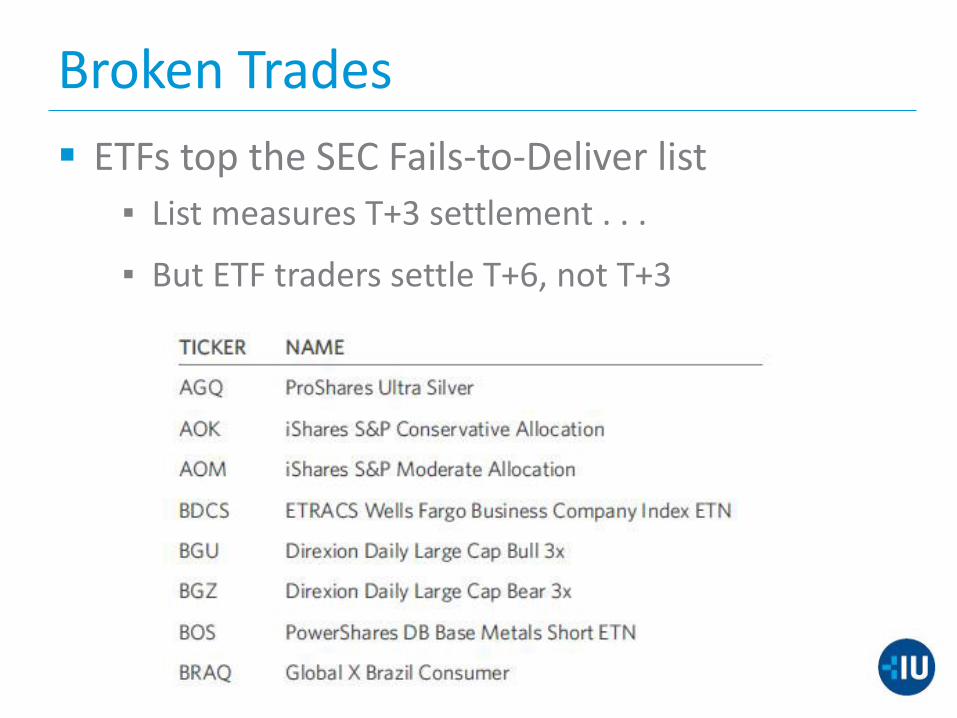
Broken Trades
ETFs top the SEC Fails-to-Deliver list
▪ List measures T+3 settlement . . .
▪ But ETF traders settle T+6, not T+3
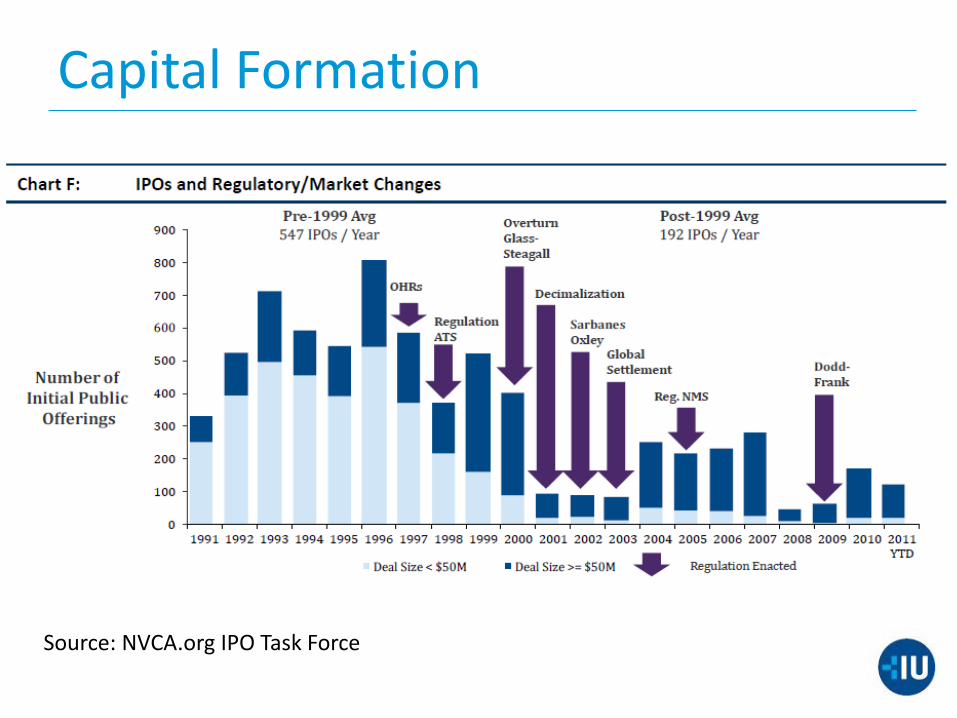
Capital Formation
Source: NVCA.org IPO Task Force
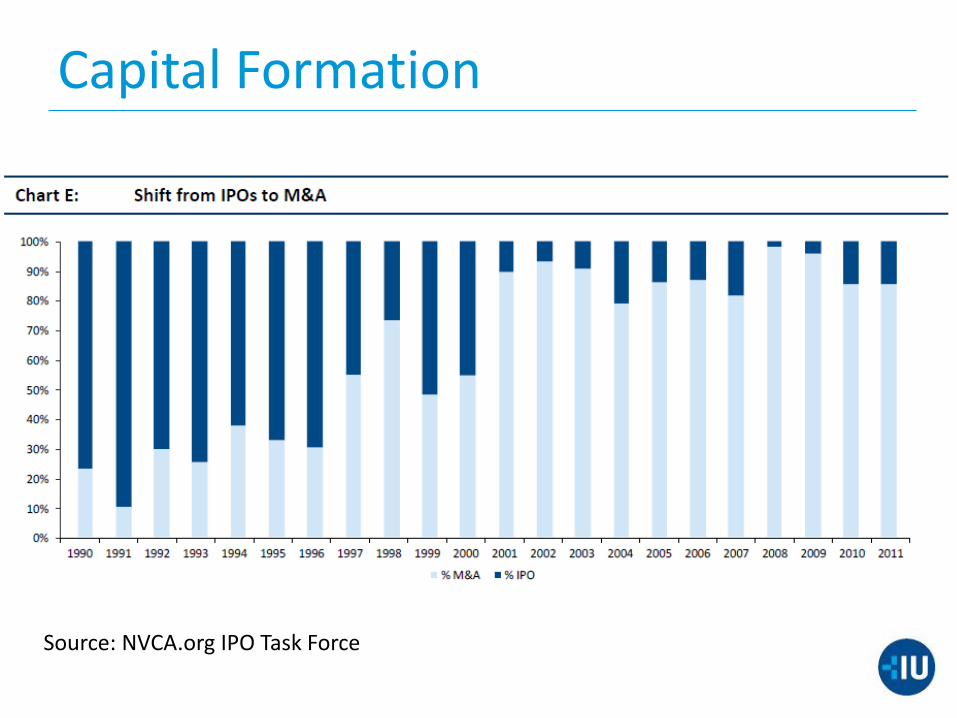
Capital Formation
Source: NVCA.org IPO Task Force
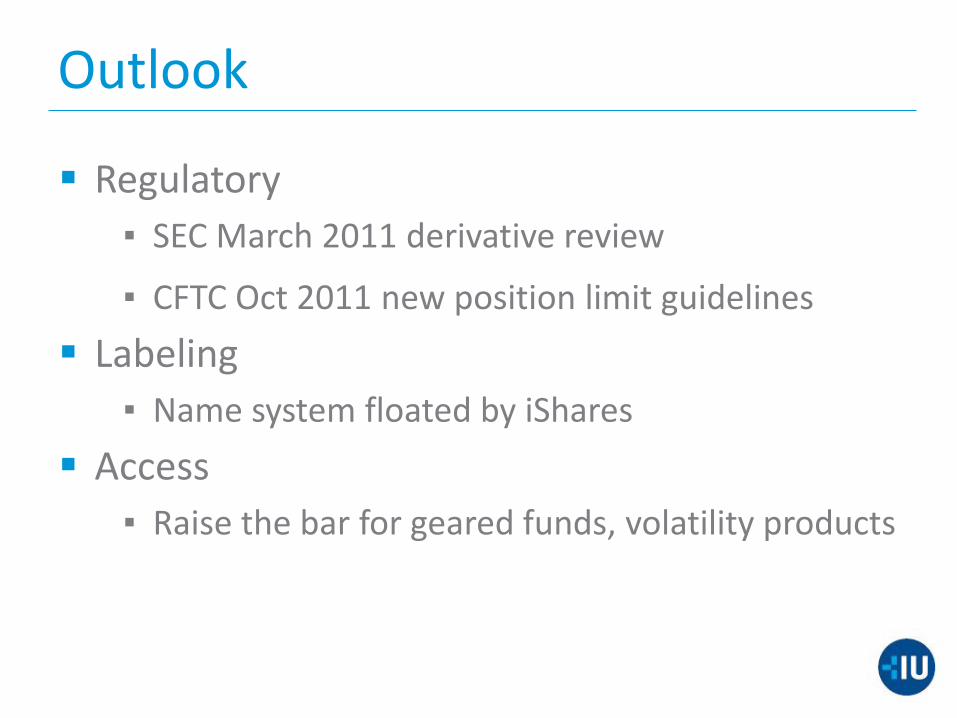
Outlook
Regulatory
▪ SEC March 2011 derivative review
▪ CFTC Oct 2011 new position limit guidelines
Labeling
▪ Name system floated by iShares
Access
▪ Raise the bar for geared funds, volatility products

Speakers:
Dave Nadig Director of Research IndexUniverse
Joel Dickson Senior Investment Analyst & Principal Vanguard
Matt Hougan President, ETF Analytics Global Head of Editorial IndexUniverse
Paul Britt ETF Analyst IndexUniverse
Thank you
For More Information: Indexuniverse.com
Vanguard.com