Embed Size (px)
Citation preview


SPECIAL REVENUE FUNDS DESCRIPTION OF FUNDS
Special Revenue Funds
Special Revenue Funds are used to account for revenues derived from specific sources that are usually required by law or regulation to be accounted for in separate funds.
The City budgets for the following Special Revenue Funds:
Road Use Tax Fund
This fund accounts for all revenues received from the State of Iowa from gasoline taxes, license fees and weight taxes. These funds are returned to the City as Road Use Taxes (RUT) as they are distributed to the cities on a per capita formula basis.
Rehabilitation/Economic Development Funds
These funds account for revenue from the Iowa Department of Economic Development and U.S. Department of Housing and Urban Development.
Employee Benefits Fund
This fund accounts for the employee benefits related to City employees who are compensated through government fund types, which are funded by a property tax levy.
Tax Increment Financing Funds
These funds account for revenues generated by the City’s TIF districts, which are used for urban renewal and development. Tax increment financing is a means of financing public improvement projects or economic development incentives for cities, counties and community colleges. Cities may utilize TIF for commercial, industrial, and residential development. Local government invest-ment in TIF areas enhances development, and ultimately reaps additional property tax revenue for all local taxing jurisdictions. How does TIF work? A base year for the purposes of assessing taxable valuation is established in the year prior to issuing bonds for debt associated with the district. Any taxes imposed on this base valuation are still directed to the local taxing jurisdictions. In other words if the property in pre development is assessed at $10,000, the local jurisdictions may con-tinue to collect taxes based on the $10,000 assessment. If improvements to the development add an additional $10,000 in value, taxes are still collected on the added value but the taxes are directed towards the project rather than going to jurisdictions.
Police and Fire Retirement Funds
These funds account for the pension of disabled and retired Firefighter and Police officers, as pro-vided by Code of Iowa, Chapter 410 and for the City’s contribution into the statewide retirement system for sworn police officers and fire personnel.
Park Funds
These funds account for revenues received from mandatory park dedication fees, cemetery plot sales, park donations, community center trust donations, and softball trust donations.
Library Funds
These funds account for gift trust donations and fund raising efforts by The Friends of the West Des Moines Public Library Foundation.
BUDGET SUMMARY | FY 2010-2011 112

SPECIAL REVENUE FUNDS DESCRIPTION OF FUNDS
Police Funds
These funds account for the Police Department’s share of federal and state forfeited/seized assets; and donations to the Police Department.
E911 Funds
These funds account for 911 surcharge revenues generated from a monthly surcharge on each telephone access line terminating within Polk and Dallas counties. These funds are used to advance the ability of public safety agencies to achieve inter operability among Police, Fire and EMS providers and improve the effectiveness and efficiency of public safety.
Human Service Funds
These funds account for donations and grants for the West Des Moines Human Services Depart-ment.
EMS Funds
These funds account for donations for the purchase of public access defibrillators.
BUDGET SUMMARY | FY 2010-2011 113
SPECIAL REVENUE FUNDS FY 2010-11 BUDGET
INCDEC)
Operat
Propert 4.75%
TIF Rev (16.73%)
Other C (5.19%)
License
Use of M 00.00%)
Intergo (5.62%)
Charges
Special
Miscella (29.90%)
Sub-to 0.13%)
Other F
Proceed
Transfer (85.05%)
Sub-to 5.05%)
TOTAL 4.16%)
Operat
Persona 7.48%
Supplie (30.33%)
Univers
Non-Re (41.39%)
Capital (6.79%)
Sub-to 2.75%)
Debt S 1.26%)
Capita
Total E 0.67%)
Transfe 2.88%)
TOTAL 0.67%)
EXCESOVER E 18.17%
BEGIN n/a
ENDIN n/a
FUND B
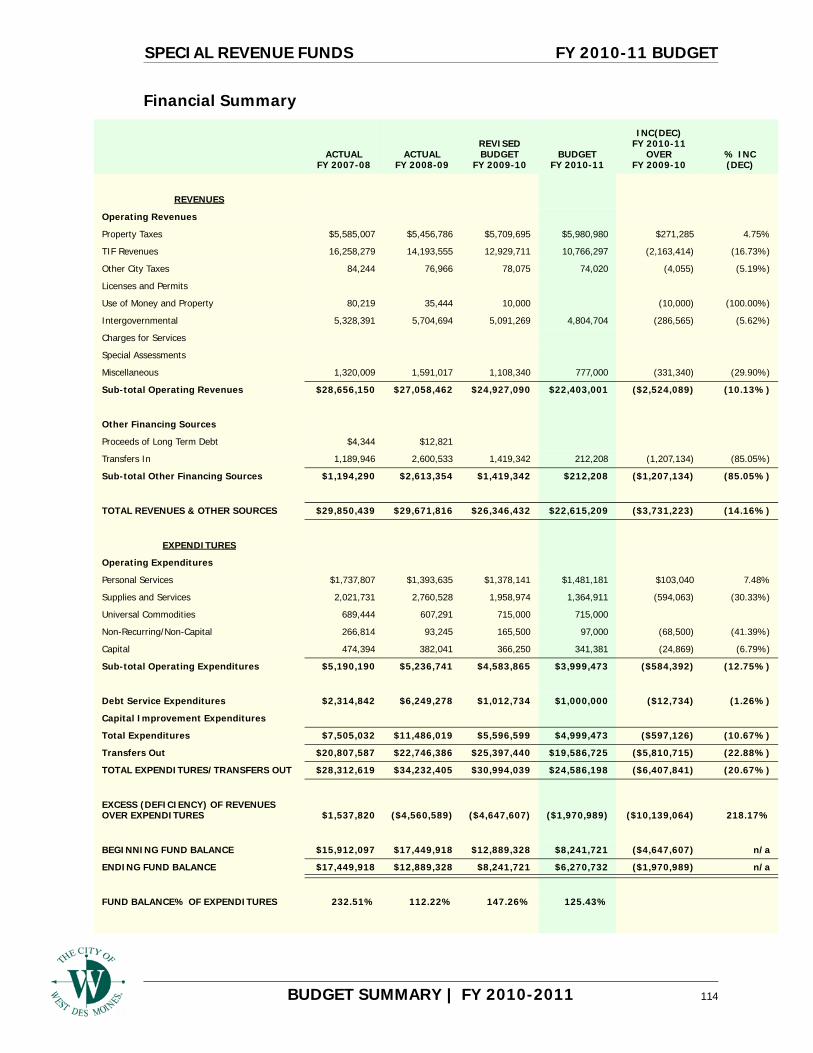
Financial Summary
ACTUAL FY 2007-08
ACTUALFY 2008-09
REVISED BUDGET
FY 2009-10BUDGET
FY 2010-11
INC(DEC) FY 2010-11
OVERFY 2009-10
%(
REVENUES
ing Revenues
y Taxes $5,585,007 $5,456,786 $5,709,695 $5,980,980 $271,285
enues 16,258,279 14,193,555 12,929,711 10,766,297 (2,163,414)
ity Taxes 84,244 76,966 78,075 74,020 (4,055)
s and Permits
oney and Property 80,219 35,444 10,000 (10,000) (1
vernmental 5,328,391 5,704,694 5,091,269 4,804,704 (286,565)
for Services
Assessments
neous 1,320,009 1,591,017 1,108,340 777,000 (331,340)
tal Operating Revenues $28,656,150 $27,058,462 $24,927,090 $22,403,001 ($2,524,089) (1
inancing Sources
s of Long Term Debt $4,344 $12,821
s In 1,189,946 2,600,533 1,419,342 212,208 (1,207,134)
tal Other Financing Sources $1,194,290 $2,613,354 $1,419,342 $212,208 ($1,207,134) (8
REVENUES & OTHER SOURCES $29,850,439 $29,671,816 $26,346,432 $22,615,209 ($3,731,223) (1
EXPENDITURES
ing Expenditures
l Services $1,737,807 $1,393,635 $1,378,141 $1,481,181 $103,040
s and Services 2,021,731 2,760,528 1,958,974 1,364,911 (594,063)
al Commodities 689,444 607,291 715,000 715,000
curring/Non-Capital 266,814 93,245 165,500 97,000 (68,500)
474,394 382,041 366,250 341,381 (24,869)
tal Operating Expenditures $5,190,190 $5,236,741 $4,583,865 $3,999,473 ($584,392) (1
ervice Expenditures $2,314,842 $6,249,278 $1,012,734 $1,000,000 ($12,734) (
l Improvement Expenditures
xpenditures $7,505,032 $11,486,019 $5,596,599 $4,999,473 ($597,126) (1
rs Out $20,807,587 $22,746,386 $25,397,440 $19,586,725 ($5,810,715) (2
EXPENDITURES/TRANSFERS OUT $28,312,619 $34,232,405 $30,994,039 $24,586,198 ($6,407,841) (2
S (DEFICIENCY) OF REVENUES XPENDITURES $1,537,820 ($4,560,589) ($4,647,607) ($1,970,989) ($10,139,064) 2
NING FUND BALANCE $15,912,097 $17,449,918 $12,889,328 $8,241,721 ($4,647,607)
G FUND BALANCE $17,449,918 $12,889,328 $8,241,721 $6,270,732 ($1,970,989)
ALANCE% OF EXPENDITURES 232.51% 112.22% 147.26% 125.43%
BUDGET SUMMARY | FY 2010-2011 114

SPECIAL REVENUE FUNDS FY 2010-11 BUDGET BY FUND
Funds
Operat
Propert
TIF Rev
Other C
License
Use of M
Intergo
Charges
Special
Miscella 37,000
Sub-to $37,000
Other F
Proceed
Transfe
Sub-to
TOTAL $37,000
Operat
Persona
Supplie
Univers
Non-Re 2,000
Capital 33,000
Sub-to $35,000
Debt S
Capita
Total E $35,000
Transf
TOTAL $35,000
EXCESOVER E $2,000
BEGIN 169,520
ENDIN 171,520
FUND B 90.06%
Road Use Tax Fund
Rehabilitation/Economic
Development Funds
Employee Benefits
Fund
Tax Increment Financing
Funds
Police & Fire Retirement
Funds Park
REVENUES
ing Revenues
y Taxes $4,331,395 $1,649,585
enues 10,766,297
ity Taxes 53,605 20,415
s and Permits
oney and Property
vernmental 4,429,287 375,417
for Services
Assessments
neous 50,000
tal Operating Revenues $4,429,287 $425,417 $4,385,000 $10,766,297 $1,670,000
inancing Sources
s of Long Term Debt
rs In 212,208
tal Other Financing Sources $212,208
REVENUES & OTHER SOURCES $4,429,287 $637,625 $4,385,000 $10,766,297 $1,670,000
EXPENDITURES
ing Expenditures
l Services $113,431 $1,367,750
s and Services 1,174,911 100,000
al Commodities 715,000
curring/Non-Capital
tal Operating Expenditures $715,000 $1,288,342 $100,000 $1,367,750
ervice Expenditures $1,000,000
l Improvement Expenditures
xpenditures $1,715,000 $1,288,342 $100,000 $1,367,750
ers Out $3,849,283 $4,385,000 $11,092,898
EXPENDITURES/TRANSFERS OUT $5,564,283 $1,288,342 $4,385,000 $11,192,898 $1,367,750
S (DEFICIENCY) OF REVENUES XPENDITURES ($1,134,996) ($650,717) ($426,601) $302,250
NING FUND BALANCE $9,550,897 ($1,091,755) ($3,480,445) $2,051,081 $
G FUND BALANCE $8,415,901 ($1,742,472) ($3,907,047) $2,353,331 $
ALANCE% OF EXPENDITURES 490.72% (135.25%) n/a (3,907.05%) 172.06% 4
BUDGET SUMMARY | FY 2010-2011 115

SPECIAL REVENUE FUNDS FY 2010-11 BUDGET BY FUND
GET 10-11
Opera
Proper 980,980
TIF Re ,766,297
Other 74,020
License
Use of
Intergo ,804,704
Charge
Specia
Miscell 777,000
Sub-t 03,001
Other
Procee
Transfe 212,208
Sub-t 12,208
TOTAL 15,209
Opera
Person 481,181
Supplie 364,911
Univer 715,000
Non-Re 97,000
Capita 341,381
Sub-t 99,473
Debt S 00,000
Capita
Total 99,473
Trans 86,725
TOTAL 86,198
EXCESOVER 0,989)
BEGIN 41,721
ENDIN 70,732
FUND 5.43%
Library Funds Police Funds E911 Funds
Human Services Funds EMS Funds
BUDFY 20
REVENUES
ting Revenues
ty Taxes $5,
venues 10
City Taxes
s and Permits
Money and Property
vernmental 4
s for Services
l Assessments
aneous 95,000 35,000 500,000 60,000
otal Operating Revenues $95,000 $35,000 $500,000 $60,000 $22,4
Financing Sources
ds of Long Term Debt
rs In
otal Other Financing Sources $2
REVENUES & OTHER SOURCES $95,000 $35,000 $500,000 $60,000 $22,6
EXPENDITURES
ting Expenditures
al Services $1,
s and Services 30,000 60,000 1,
sal Commodities
curring/Non-Capital 95,000
l 5,000 303,381
otal Operating Expenditures $95,000 $35,000 $303,381 $60,000 $3,9
ervice Expenditures $1,0
l Improvement Expenditures
Expenditures $95,000 $35,000 $303,381 $60,000 $4,9
fers Out $196,619 $62,925 $19,5
EXPENDITURES/TRANSFERS OUT $95,000 $35,000 $500,000 $122,925 $24,5
S (DEFICIENCY) OF REVENUES EXPENDITURES ($62,925) ($1,97
NING FUND BALANCE $230,362 $692,759 ($40,448) $152,590 $7,159 $8,2
G FUND BALANCE $230,362 $692,759 ($40,448) 89,665 $7,159 $6,2
BALANCE% OF EXPENDITURES 242.49% 1,979.31% (13.33%) 149.44% n/a 12
BUDGET SUMMARY | FY 2010-2011 116

SPECIAL REVENUE FUNDS ROAD USE TAX FUND
Description of the Road Use Tax Fund
This fund accounts for all revenues received from the State of Iowa from gasoline taxes, license fees and weight taxes. These funds are returned to the City as Road Use Taxes (RUT) as they are distributed to the cities on a per capita formula basis. Road use funds are available to finance City operations dealing with street maintenance, construction, as well as providing funding for capital improvements dealing with streets.
Major Revenue Sources
The City estimates it will receive $4,429,287 in Road Use Taxes in FY 10-11. This estimate is based on the City’s estimated population of 51,744, and a per capita estimate of $85.60. Current estimates from the Iowa Department of Transportation (IDOT) project the per capita rate increasing to approximately $97.50 in FY 2013-14. The increasing RUT receipts are generally a result of higher vehicle registration fees the state legislature passed into law during 2008 and the addition of TIME-21 funding. IDOT has indicated that the estimates will be lowered significantly based upon actual collections.
Expenditures
Approximately $3.7 million in Road Use Tax funds are being utilized for street related expenditures (CIP and operating). The remaining $715,000 will be used for street lighting. This will effectively use all of the current year Road Use Tax funds received from the State of Iowa
Estimated Ending Fund Balance
The City estimates the ending fund balance of the Road Use Tax Fund to be roughly $8.4 million dollars. Most of this balance is obligated for ongoing capital projects initiated in fiscal years prior to FY 10-11. A small portion of this balance, approximately 10% is set aside for contingency road repairs and projects.
Fiscal Year
Actual/Current IDOT
per capita estimates
2004-05 $84.00
2005-06 $83.30
2006-07 $82.20
2007-08 $84.30
2008-09 $86.00
2009-10 $89.50
2010-11 $92.50
2011-12 $95.50
2012-13 $97.50
2013-14 $97.50
BUDGET SUMMARY | FY 2010-2011 117

SPECIAL REVENUE FUNDS ROAD USE TAX FUND
INCEC)
Operat
Propert
TIF Rev
Other C
License
Use of
Intergo (4.36%)
Charge
Special
Miscella
Sub-to 4.36%)
Other
Proceed
Transfe
Sub-to
TOTAL 4.36%)
Operat
Persona
Supplie
Univers
Non-Re
Capital
Sub-to
Debt S
Capita
Total E
Transf 52.47%
TOTAL 31.24%
EXCESOVER E 9.95%)
BEGIN n/a
ENDIN n/a
FUND
ACTUAL FY 2007-08
ACTUALFY 2008-09
REVISED BUDGET
FY 2009-10BUDGET
FY 2010-11
INC(DEC) FY 2010-11
OVERFY 2009-10
%(D
REVENUES
ing Revenues
y Taxes
enues
ity Taxes
s and Permits
Money and Property
vernmental 4,438,102 4,298,083 4,631,088 4,429,287 (201,801)
s for Services
Assessments
neous
tal Operating Revenues $4,438,102 $4,298,083 $4,631,088 $4,429,287 ($201,801) (
Financing Sources
s of Long Term Debt
rs In 10,989
tal Other Financing Sources $10,989
REVENUES & OTHER SOURCES $4,438,102 $4,309,072 $4,631,088 $4,429,287 ($201,801) (
EXPENDITURES
ing Expenditures
l Services
s and Services
al Commodities 689,444 607,291 715,000 715,000
curring/Non-Capital
tal Operating Expenditures $689,444 $607,291 $715,000 $715,000
ervice Expenditures $1,000,000 $1,000,000
l Improvement Expenditures
xpenditures $689,444 $607,291 $1,715,000 $1,715,000
ers Out $3,161,197 $546,217 $2,524,638 $3,849,283 $1,324,645
EXPENDITURES/TRANSFERS OUT $3,850,640 $1,153,508 $4,239,638 $5,564,283 $1,324,645
S (DEFICIENCY) OF REVENUES XPENDITURES $587,462 $3,155,564 $391,450 ($1,134,996) ($1,526,446) (38
NING FUND BALANCE $5,416,421 $6,003,883 $9,159,447 $9,550,897 $391,450
G FUND BALANCE $6,003,883 $9,159,447 $9,550,897 $8,415,901 ($1,134,996)
BALANCE% OF EXPENDITURES 870.83% 1,508.25% 556.90% 490.72%
BUDGET SUMMARY | FY 2010-2011 118

SPECIAL REVENUE FUNDS REHAB/ECONOMIC DEVELOPMENT FUNDS
Description of Rehabilitation/Economic Development Funds
These funds account for revenues received from the Iowa Department of Economic Developmentand, the U.S. Department of Housing and Urban Development.
CDBG Entitlement Grant
In October 2004, the United States Department of Housing and Urban Development (HUD) identified the City of West Des Moines as a grantee for the Entitlement Community Development Block Grant (CDBG) Program. As an entitlement community, West Des Moines is eligible for HUD funds to address defined needs within the community. The program provides annual grants on a formula basis to entitled cities and counties (those over 50,000 in population) to develop viable urban communities by providing decent housing and a suitable living environment, and by expanding economic opportunities, principally for low- and moderate-income persons.
Transitional Housing
The transitional housing program is designed to help low income families with housing andadditional support. The program’s ultimate goal is to help families become financially self-sufficient and able to procure permanent housing. The grant will provide $198,000 over the next three years.
CEBA
The City has participated in the State of Iowa’s CEBA (Community Economic Betterment Account)Program since 1999. Providing match contributions in the form of forgivable or low interest loans totaling $1,019,000 and involving 13 area businesses. The CEBA program provides financial assistance to companies that create new employment opportunities and/or retain existing jobs, and make new capital investment in Iowa. The amount of funding is based, in part, on the number of jobs to be created/retained. Funds are provided in the form of loans and forgivable loans. Projects eligible for CEBA funding include, but are not limited to, the following:
• Building construction or reconstruction• Land or building acquisition• Equipment purchases• Operating and maintenance expenses• Site development - clearance, demolition and building removal• Working capital
CEBA investments should not be considered a sole funding source. The program leverages other financial support such as bank financing and private investment
BUDGET SUMMARY | FY 2010-2011 119

SPECIAL REVENUE FUNDS REHAB/ECONOMIC DEVELOPMENT FUNDS
INCEC)
Opera
Proper
TIF Re
Other
License
Use of
Intergo 18.42%)
Charge
Specia
Miscell 66.39%
Sub-to .22%)
Other
Procee
Transfe (3.25%)
Sub-to 3.25%)
TOTAL .14%)
Opera
Person 10.85%)
Supplie 24.43%)
Univer
Non-Re
Capita 00.00%)
Sub-to .42%)
Debt S
Capita
Total .42%)
Trans
TOTAL .42%)
EXCESOVER 3.11%
BEGIN n/a
ENDIN n/a
FUND
ACTUAL FY 2007-08
ACTUAL FY 2008-09
REVISED BUDGET
FY 2009-10BUDGET
FY 2010-11
INC(DEC) FY 2010-11
OVERFY 2009-10
%(D
REVENUES
ting Revenues
ty Taxes
venues
City Taxes
s and Permits
Money and Property
vernmental 850,523 1,351,877 460,181 375,417 (84,764) (
s for Services
l Assessments
aneous 96,611 50,590 30,050 50,000 19,950
tal Operating Revenues $947,135 $1,402,467 $490,231 $425,417 ($64,814) (13
Financing Sources
ds of Long Term Debt
rs In 1,189,946 1,020,530 219,342 212,208 (7,134)
tal Other Financing Sources $1,189,946 $1,020,530 $219,342 $212,208 ($7,134) (
REVENUES & OTHER SOURCES $2,137,080 $2,422,997 $709,573 $637,625 ($71,948) (10
EXPENDITURES
ting Expenditures
al Services $106,703 $102,321 $127,241 $113,431 ($13,810) (
s and Services 1,738,612 2,422,336 1,554,652 1,174,911 ($379,741) (
sal Commodities
curring/Non-Capital 8,092 11,325
l 710 60,653 450 (450) (1
tal Operating Expenditures $1,854,117 $2,596,634 $1,682,343 $1,288,342 ($394,001) (23
ervice Expenditures
l Improvement Expenditures
Expenditures $1,854,117 $2,596,634 $1,682,343 $1,288,342 ($394,001) (23
fers Out $261,818
EXPENDITURES/TRANSFERS OUT $2,115,935 $2,596,634 $1,682,343 $1,288,342 ($394,001) (23
S (DEFICIENCY) OF REVENUES EXPENDITURES $21,145 ($173,637) ($972,770) ($650,717) $322,053 3
NING FUND BALANCE $33,507 $54,652 ($118,985) ($1,091,755) ($972,770)
G FUND BALANCE $54,652 ($118,985) ($1,091,755) ($1,742,472) ($650,717)
BALANCE% OF EXPENDITURES 2.95% (4.58%) (64.89%) (135.25%)
BUDGET SUMMARY | FY 2010-2011 120

SPECIAL REVENUE FUNDS EMPLOYEE BENEFITS FUND
Description of the Employee Benefits Fund
This fund accounts for the employee benefits of those City employees who are compensatedthrough government fund types.
Financial Summary
Cities are allowed to levy in a Special Revenue Fund, for contributions under the Federal InsuranceContributions Act (FICA), the Iowa Public Employees Retirement System (IPERS), the Municipal Fire and Police Retirement System of Iowa (MFPRSI) and certain other employee benefits. In FY 10-11 the levy for employee benefits will be approximately $4,385,000. This amount will then be transferred to the General Fund where the employee benefits are actually paid.
BUDGET SUMMARY | FY 2010-2011 121

SPECIAL REVENUE FUNDS EMPLOYEE BENEFITS FUND
INCEC)
Oper
Prope 3.63%
TIF R
Other 6.21%)
Licens
Use o
Interg
Charg
Speci
Misce
Sub- .50%
Othe
Proce
Trans
Sub-
TOTA .50%
Oper
Perso
Suppl
Unive
Non-R
Capita
Sub-
Debt
Capit
Total
Trans .50%
TOTA .50%
EXCEOVER
BEGI
ENDI
FUND
ACTUAL FY 2007-08
ACTUAL FY 2008-09
REVISED BUDGET
FY 2009-10BUDGET
FY 2010-11
INC(DEC) FY 2010-11
OVERFY 2009-10
% (D
REVENUES
ating Revenues
rty Taxes $3,680,423 $4,092,590 $4,179,716 $4,331,395 $151,679
evenues
City Taxes 55,517 57,725 57,154 53,605 (3,549) (
es and Permits
f Money and Property
overnmental
es for Services
al Assessments
llaneous
total Operating Revenues $3,735,940 $4,150,314 $4,236,870 $4,385,000 $148,130 3
r Financing Sources
eds of Long Term Debt
fers In
total Other Financing Sources
L REVENUES & OTHER SOURCES $3,735,940 $4,150,314 $4,236,870 $4,385,000 $148,130 3
EXPENDITURES
ating Expenditures
nal Services
ies and Services
rsal Commodities
ecurring/Non-Capital
l
total Operating Expenditures
Service Expenditures
al Improvement Expenditures
Expenditures
fers Out $3,735,940 $4,150,314 $4,236,870 $4,385,000 $148,130 3
L EXPENDITURES/TRANSFERS OUT $3,735,940 $4,150,314 $4,236,870 $4,385,000 $148,130 3
SS (DEFICIENCY) OF REVENUES EXPENDITURES
NNING FUND BALANCE
NG FUND BALANCE
BALANCE% OF EXPENDITURES n/a n/a n/a n/a
BUDGET SUMMARY | FY 2010-2011 122

SPECIAL REVENUE FUNDS TIF FUNDS
Description of the Tax Increment Financing Funds
These funds have been established for the receipt of tax revenues from the City’s TIF districts.A brief description of each of the districts is as follows:
Valley Junction/R.R. TIF District
This district was created in 1995 and expired in fiscal year 2009-10. The purpose of the district was to defray costs of various capital improvements within the Valley Junction Urban Renewal District.
Mills Parkway TIF District
This district was created in 1999 and is set to expire in fiscal year 2025-26. The purpose of the district is to help defray costs associated with the construction of a new municipal fire station, and an interstate interchange at the intersection of Mills Civic Parkway and Interstate Highway 35. The first amendment facilitated construction of the infrastructure (street, sanitary sewer and water lines) necessary for the Wells Fargo Mortgage Company complex with the second amendment allowing financing for construction of infrastructure to serve the Aviva campus. TIF receipts are projected to be $6,479,134 for FY 10-11.
Jordan Creek TIF District
This district was created in 2000 and is set to expire in fiscal year 2018-19. The purpose of this district is to help defray the costs associated with the construction of a new municipal fire station, and numerous infrastructure improvements in the area. TIF receipts for FY 10-11 are projected to be $4,287,163.
BUDGET SUMMARY | FY 2010-2011 123

SPECIAL REVENUE FUNDS TIF FUNDS
INCEC)
Opera
Proper
TIF Re 6.73%)
Other
Licens
Use of
Interg
Charg
Specia
Miscel
Sub-t .73%)
Other
Procee
Transf
Sub-t
TOTA .73%)
Opera
Person
Suppli
Univer
Non-R
Capita
Sub-t
Debt
Capit
Total
Trans .65%)
TOTA .43%)
EXCEOVER .31%)
BEGIN n/a
ENDI n/a
FUND
ACTUAL FY 2007-08
ACTUAL FY 2008-09
REVISED BUDGET
FY 2009-10BUDGET
FY 2010-11
INC(DEC) FY 2010-11
OVERFY 2009-10
%(D
REVENUES
ting Revenues
ty Taxes
venues $16,258,279 $14,193,555 $12,929,711 $10,766,297 ($2,163,414) (1
City Taxes
es and Permits
Money and Property 67,585 23,904
overnmental
es for Services
l Assessments
laneous
otal Operating Revenues $16,325,865 $14,217,459 $12,929,711 $10,766,297 ($2,163,414) (16
Financing Sources
ds of Long Term Debt
ers In 1,520,000
otal Other Financing Sources
L REVENUES & OTHER SOURCES $16,325,865 $15,737,459 $12,929,711 $10,766,297 ($2,163,414) (16
EXPENDITURES
ting Expenditures
al Services
es and Services 100,000 100,000
sal Commodities
ecurring/Non-Capital
l
otal Operating Expenditures $100,000 $100,000
Service Expenditures $2,132,130 $6,136,348
al Improvement Expenditures
Expenditures $2,132,130 $6,136,348 $100,000 $100,000
fers Out $13,447,796 $17,858,519 $18,380,138 $11,092,898 ($7,287,240) (39
L EXPENDITURES/TRANSFERS OUT $15,579,926 $23,994,866 $18,480,138 $11,192,898 ($7,287,240) (39
SS (DEFICIENCY) OF REVENUES EXPENDITURES $745,939 ($8,257,407) ($5,550,427) ($426,601) $5,123,826 (92
NING FUND BALANCE $9,581,450 $10,327,389 $2,069,982 ($3,480,445) ($5,550,427)
NG FUND BALANCE $10,327,389 $2,069,982 ($3,480,445) ($3,907,047) ($426,601)
BALANCE% OF EXPENDITURES 484.37% 33.73% (3,480.45%) (3,907.05%)
BUDGET SUMMARY | FY 2010-2011 124

SPECIAL REVENUE FUNDS POLICE & FIRE RETIREMENT FUNDS
Description of the Police and Fire Retirement Funds
These funds account for the pension of disabled and retired Firefighters and Police officers, as provided by Code of Iowa Chapter 410, and for the City’s contribution into the statewide retirement system for sworn police officers and fire personnel.
BUDGET SUMMARY | FY 2010-2011 125

SPECIAL REVENUE FUNDS POLICE & FIRE RETIREMENT FUNDS
INCEC)
Oper
Prope 7.82%
TIF R
Other 2.42%)
Licens
Use o
Interg
Charg
Speci
Misce
Sub- .68%
Othe
Proce
Trans 0.00%)
Sub- .00%)
TOTA .29%)
Oper
Perso 9.34%
Suppl
Unive
Non-R
Capita
Sub- .34%
Debt
Capit
Total .34%
Trans
TOTA .34%
EXCEOVER .85%)
BEGI n/a
ENDI n/a
FUND
ACTUAL FY 2007-08
ACTUAL FY 2008-09
REVISED BUDGET
FY 2009-10BUDGET
FY 2010-11
INC(DEC) FY 2010-11
OVERFY 2009-10
% (D
REVENUES
ating Revenues
rty Taxes $1,904,584 $1,364,197 $1,529,979 $1,649,585 $119,606
evenues
City Taxes 28,727 19,242 20,921 20,415 (506) (
es and Permits
f Money and Property
overnmental
es for Services
al Assessments
llaneous
total Operating Revenues $1,933,311 $1,383,438 $1,550,900 $1,670,000 $119,100 7
r Financing Sources
eds of Long Term Debt
fers In 1,200,000 (1,200,000) (10
total Other Financing Sources $1,200,000 ($1,200,000) (100
L REVENUES & OTHER SOURCES $1,933,311 $1,383,438 $2,750,900 $1,670,000 ($1,080,900) (39
EXPENDITURES
ating Expenditures
nal Services $1,631,104 $1,291,314 $1,250,900 $1,367,750 $116,850
ies and Services
rsal Commodities
ecurring/Non-Capital
l
total Operating Expenditures $1,631,104 $1,291,314 $1,250,900 $1,367,750 $116,850 9
Service Expenditures
al Improvement Expenditures
Expenditures $1,631,104 $1,291,314 $1,250,900 $1,367,750 $116,850 9
fers Out
L EXPENDITURES/TRANSFERS OUT $1,631,104 $1,291,314 $1,250,900 $1,367,750 $116,850 9
SS (DEFICIENCY) OF REVENUES EXPENDITURES $302,207 $92,124 $1,500,000 $302,250 ($1,197,750) (79
NNING FUND BALANCE $156,750 $458,957 $551,081 $2,051,081 $1,500,000
NG FUND BALANCE $458,957 $551,081 $2,051,081 $2,353,331 $302,250
BALANCE% OF EXPENDITURES 28.14% 42.68% 163.97% 172.06%
BUDGET SUMMARY | FY 2010-2011 126

SPECIAL REVENUE FUNDS PARK FUNDS
Description of the Park Funds
These funds account for revenues received from mandatory park dedication fees, cemetery plotsales, park donations, community center trust donations, and softball trust donations.
Estimated Ending Fund Balance
The projected remaining fund balance of $171,521 is obligated for future park developments, and to support operations at the Community Center, Raccoon River Softball Complex, and park operations.
BUDGET SUMMARY | FY 2010-2011 127

SPECIAL REVENUE FUNDS PARK FUNDS
INCEC)
Oper
Prope
TIF R
Other
Licens
Use o
Interg
Charg
Speci
Misce 0.67%)
Sub- .67%)
Othe
Proce
Trans
Sub-
TOTA .67%)
Oper
Perso
Suppl
Unive
Non-R
Capita 0.60%)
Sub- .13%)
Debt
Capit
Total .13%)
Trans
TOTA .13%)
EXCEOVER .74%)
BEGI n/a
ENDI n/a
FUND
ACTUAL FY 2007-08
ACTUAL FY 2008-09
REVISED BUDGET
FY 2009-10BUDGET
FY 2010-11
INC(DEC) FY 2010-11
OVERFY 2009-10
% (D
REVENUES
ating Revenues
rty Taxes
evenues
City Taxes
es and Permits
f Money and Property 826 279
overnmental
es for Services
al Assessments
llaneous 73,418 34,137 75,000 37,000 (38,000) (5
total Operating Revenues $74,244 $34,415 $75,000 $37,000 ($38,000) (50
r Financing Sources
eds of Long Term Debt
fers In 49,014
total Other Financing Sources $49,014
L REVENUES & OTHER SOURCES $74,244 $83,429 $75,000 $37,000 ($38,000) (50
EXPENDITURES
ating Expenditures
nal Services
ies and Services
rsal Commodities
ecurring/Non-Capital 5,667 3,144 2,000 2,000
l 90,827 7,624 66,800 33,000 (33,800) (5
total Operating Expenditures $96,493 $10,768 $68,800 $35,000 ($33,800) (49
Service Expenditures
al Improvement Expenditures
Expenditures $96,493 $10,768 $68,800 $35,000 ($33,800) (49
fers Out $19,260
L EXPENDITURES/TRANSFERS OUT $115,753 $10,768 $68,800 $35,000 ($33,800) (49
SS (DEFICIENCY) OF REVENUES EXPENDITURES ($41,509) $72,661 $6,200 $2,000 ($4,200) (67
NNING FUND BALANCE $132,169 $90,660 $163,320 $169,520 $6,200
NG FUND BALANCE $90,660 $163,320 $169,520 $171,520 $2,000
BALANCE% OF EXPENDITURES 93.96% 1,516.72% 246.40% 490.06%
BUDGET SUMMARY | FY 2010-2011 128

SPECIAL REVENUE FUNDS LIBRARY FUNDS
Description of the Library Trust Funds
These funds account for miscellaneous donations and fund raising efforts by The Friends of theWest Des Moines Public Library Foundation.
Financial Summary
The Library expects to receive approximately $95,000 in donations in FY 10-11, which are intended to augment and enhance the Library’s services and collection materials.
A suggested expenditure budget for the Library Trust Fund is listed below:
Library Materials $50,000Contingency & Miscellaneous $45,000
Total $95,000
Estimated Ending Fund Balance
The projected remaining fund balance of approximately $230,362 is reserved exclusively for thefuture support of Library operations.
BUDGET SUMMARY | FY 2010-2011 129

SPECIAL REVENUE FUNDS LIBRARY FUNDS
INCEC)
Oper
Prope
TIF R
Other
Licens
Use o 0.00%)
Interg
Charg
Speci
Misce 5.56%
Sub- .04%)
Othe
Proce
Trans
Sub-
TOTA .04%)
Oper
Perso
Suppl
Unive
Non-R 5.56%
Capita
Sub- .56%
Debt
Capit
Total .56%
Trans
TOTA .56%
EXCEOVER .00%)
BEGI n/a
ENDI n/a
FUND
ACTUAL FY 2007-08
ACTUAL FY 2008-09
REVISED BUDGET
FY 2009-10BUDGET
FY 2010-11
INC(DEC) FY 2010-11
OVERFY 2009-10
% (D
REVENUES
ating Revenues
rty Taxes
evenues
City Taxes
es and Permits
f Money and Property 6,647 8,392 6,000 (6,000) (10
overnmental
es for Services
al Assessments
llaneous 98,601 73,919 90,000 95,000 5,000
total Operating Revenues $105,248 $82,311 $96,000 $95,000 ($1,000) (1
r Financing Sources
eds of Long Term Debt
fers In
total Other Financing Sources
L REVENUES & OTHER SOURCES $105,248 $82,311 $96,000 $95,000 ($1,000) (1
EXPENDITURES
ating Expenditures
nal Services
ies and Services
rsal Commodities
ecurring/Non-Capital 85,461 55,327 90,000 95,000 5,000
l
total Operating Expenditures $85,461 $55,327 $90,000 $95,000 $5,000 5
Service Expenditures
al Improvement Expenditures
Expenditures $85,461 $55,327 $90,000 $95,000 $5,000 5
fers Out
L EXPENDITURES/TRANSFERS OUT $85,461 $55,327 $90,000 $95,000 $5,000 5
SS (DEFICIENCY) OF REVENUES EXPENDITURES $19,787 $26,984 $6,000 ($6,000) (100
NNING FUND BALANCE $177,591 $197,378 $224,362 $230,362 $6,000
NG FUND BALANCE $197,378 $224,362 $230,362 $230,362
BALANCE% OF EXPENDITURES 230.96% 405.52% 255.96% 242.49%
BUDGET SUMMARY | FY 2010-2011 130

SPECIAL REVENUE FUNDS POLICE FUNDS
Description of Police Funds
These funds account for the Police Department’s federal and state forfeiture program, and miscellaneous donations to the Police Department. The primary purpose of the federal and state forfeiture program is to deter crime by depriving criminals of the profits and proceeds of their illegal activities and to weaken criminal enterprises by removing the mechanisms of crime. An ancillary purpose is to enhance cooperation among federal, state, and local law enforcement agencies through the equitable sharing of forfeiture proceeds.
Financial Summary
Due to the unpredictable nature of the forfeiture program, revenues are conservatively estimated. In FY 10-11, the City projects revenues from the forfeiture program to be in the range of $35,000. These funds will be used to augment police services, particularly in the areas of computer hardware, ammunition, and tactical team operations.
Estimated Ending Fund Balance
The projected ending fund balance of $692,759 is reserved exclusively for future police operations.
BUDGET SUMMARY | FY 2010-2011 131

SPECIAL REVENUE FUNDS POLICE FUNDS
INCEC)
Oper
Prope
TIF R
Other
Licens
Use o 0.00%)
Interg
Charg
Speci
Misce 3.33%
Sub- .26%
Othe
Proce
Trans
Sub-
TOTA .26%
Oper
Perso
Suppl 0.00%
Unive
Non-R 0.00%)
Capita
Sub- .33%
Debt
Capit
Total .33%
Trans
TOTA .33%
EXCEOVER .00%)
BEGI n/a
ENDI n/a
FUND
ACTUAL FY 2007-08
ACTUAL FY 2008-09
REVISED BUDGET
FY 2009-10BUDGET
FY 2010-11
INC(DEC) FY 2010-11
OVERFY 2009-10
% (D
REVENUES
ating Revenues
rty Taxes
evenues
City Taxes
es and Permits
f Money and Property 3,126 2,236 3,000 (3,000) (10
overnmental
es for Services
al Assessments
llaneous 121,968 406,899 10,500 35,000 24,500 23
total Operating Revenues $125,094 $409,135 $13,500 $35,000 $21,500 159
r Financing Sources
eds of Long Term Debt 4,344 12,821
fers In
total Other Financing Sources $4,344 $12,821
L REVENUES & OTHER SOURCES $129,438 $421,956 $13,500 $35,000 $21,500 159
EXPENDITURES
ating Expenditures
nal Services
ies and Services 13,393 3,947 10,000 30,000 20,000 20
rsal Commodities
ecurring/Non-Capital 500 (500) (10
l 46,499 58,061 5,000 5,000
total Operating Expenditures $59,892 $62,008 $10,500 $35,000 $24,500 233
Service Expenditures
al Improvement Expenditures
Expenditures $59,892 $62,008 $10,500 $35,000 $24,500 233
fers Out $4,450
L EXPENDITURES/TRANSFERS OUT $64,342 $62,008 $10,500 $35,000 $24,500 233
SS (DEFICIENCY) OF REVENUES EXPENDITURES $65,096 $359,948 $3,000 ($3,000) (100
NNING FUND BALANCE $264,716 $329,811 $689,759 $692,759 $3,000
NG FUND BALANCE $329,811 $689,759 $692,759 $692,759
BALANCE% OF EXPENDITURES 550.68% 1,112.37% 6,597.70% 1,979.31%
BUDGET SUMMARY | FY 2010-2011 132

SPECIAL REVENUE FUNDS E911 FUNDS
Description of E911 Funds
These funds account for 911 surcharge revenues generated from a monthly surcharge on each telephone access line terminating within Polk and Dallas counties. These funds are used to advance the ability of public safety agencies to achieve inter operability among Police, Fire and EMS providers and improve the effectiveness and efficiency of public safety.
BUDGET SUMMARY | FY 2010-2011 133

SPECIAL REVENUE FUNDS E911 FUNDS
INCEC)
Oper
Prope
TIF R
Other
Licens
Use o
Interg
Charg
Speci
Misce 6.13%)
Sub- .13%)
Othe
Proce
Trans
Sub-
TOTA .13%)
Oper
Perso
Suppl 0.00%)
Unive
Non-R 0.00%)
Capita 1.47%
Sub- .29%)
Debt .00%)
Capit
Total .35%)
Trans .01%
TOTA .09%)
EXCEOVER .00%)
BEGI n/a
ENDI n/a
FUND
ACTUAL FY 2007-08
ACTUAL FY 2008-09
REVISED BUDGET
FY 2009-10BUDGET
FY 2010-11
INC(DEC) FY 2010-11
OVERFY 2009-10
% (D
REVENUES
ating Revenues
rty Taxes
evenues
City Taxes
es and Permits
f Money and Property
overnmental
es for Services
al Assessments
llaneous 868,130 946,618 782,790 500,000 (282,790) (3
total Operating Revenues $868,130 $946,618 $782,790 $500,000 ($282,790) (36
r Financing Sources
eds of Long Term Debt
fers In
total Other Financing Sources
L REVENUES & OTHER SOURCES $868,130 $946,618 $782,790 $500,000 ($282,790) (36
EXPENDITURES
ating Expenditures
nal Services
ies and Services 192,363 251,956 234,322 (234,322) (10
rsal Commodities
ecurring/Non-Capital 159,008 19,269 65,000 (65,000) (10
l 336,359 255,704 299,000 303,381 4,381
total Operating Expenditures $687,730 $526,928 $598,322 $303,381 ($294,941) (49
Service Expenditures $182,712 $112,931 $12,734 ($12,734) (100
al Improvement Expenditures
Expenditures $870,442 $639,859 $611,056 $303,381 ($307,675) (50
fers Out $160,500 $171,735 $183,735 $196,619 $12,884 7
L EXPENDITURES/TRANSFERS OUT $1,030,942 $811,594 $794,791 $500,000 ($294,791) (37
SS (DEFICIENCY) OF REVENUES EXPENDITURES ($162,812) $135,024 ($12,001) $12,001 (100
NNING FUND BALANCE ($659) ($163,471) ($28,447) ($40,448) ($12,001)
NG FUND BALANCE ($163,471) ($28,447) ($40,448) ($40,448)
BALANCE% OF EXPENDITURES (18.78%) (4.45%) (6.62%) (13.33%)
BUDGET SUMMARY | FY 2010-2011 134

SPECIAL REVENUE FUNDS HUMAN SERVICES FUNDS
Description of the Human Services Funds
This fund accounts for donations for various Human Services programs that target the elderly,disabled, and low-income families of West Des Moines. These programs include rental assistance, holiday programs, personal pantry programs, utility programs, and other client based programs.
Major Revenues Sources and Planned Expenditure Uses
Human Services expects to receive and expend approximately $60,000 in donations for FY 10-11.These donations are above and beyond City allocations to the Human Services Department, which are accounted for in the General Fund.
Estimated Ending Fund Balance
The projected ending fund balance of $89,665 is reserved exclusively for Human Services’outreach programs.
BUDGET SUMMARY | FY 2010-2011 135

SPECIAL REVENUE FUNDS HUMAN SERVICES FUNDS
INCEC)
Oper
Prope
TIF R
Other
Licens
Use o 0.00%)
Interg
Charg
Speci
Misce 6.43%)
Sub- .90%)
Othe
Proce
Trans
Sub-
TOTA .90%)
Oper
Perso
Suppl
Unive
Non-R
Capita
Sub-
Debt
Capit
Total
Trans .68%)
TOTA .92%)
EXCEOVER .16%
BEGI n/a
ENDI n/a
FUND
ACTUAL FY 2007-08
ACTUAL FY 2008-09
REVISED BUDGET
FY 2009-10BUDGET
FY 2010-11
INC(DEC) FY 2010-11
OVERFY 2009-10
% (D
REVENUES
ating Revenues
rty Taxes
evenues
City Taxes
es and Permits
f Money and Property 2,034 633 1,000 (1,000) (10
overnmental 39,766 54,734
es for Services
al Assessments
llaneous 45,770 78,854 112,000 60,000 (52,000) (4
total Operating Revenues $87,570 $134,221 $113,000 $60,000 ($53,000) (46
r Financing Sources
eds of Long Term Debt
fers In
total Other Financing Sources
L REVENUES & OTHER SOURCES $87,570 $134,221 $113,000 $60,000 ($53,000) (46
EXPENDITURES
ating Expenditures
nal Services
ies and Services 77,363 82,290 60,000 60,000
rsal Commodities
ecurring/Non-Capital
l
total Operating Expenditures $77,363 $82,290 $60,000 $60,000
Service Expenditures
al Improvement Expenditures
Expenditures $77,363 $82,290 $60,000 $60,000
fers Out $16,626 $19,602 $72,059 $62,925 ($9,134) (12
L EXPENDITURES/TRANSFERS OUT $93,988 $101,892 $132,059 $122,925 ($9,134) (6
SS (DEFICIENCY) OF REVENUES EXPENDITURES ($6,418) $32,329 ($19,059) ($62,925) ($43,866) 230
NNING FUND BALANCE $145,738 $139,320 $171,649 $152,590 ($19,059)
NG FUND BALANCE $139,320 $171,649 $152,590 $89,665 ($62,925)
BALANCE% OF EXPENDITURES 180.09% 208.59% 254.32% 149.44%
BUDGET SUMMARY | FY 2010-2011 136

SPECIAL REVENUE FUNDS EMS FUNDS
Description of the EMS Trust Funds
This fund accounts for donations to the Public Access Defibrillation Program, sponsored by theEMS Department. The Public Access Defibrillation Program is a joint venture between the City of West Des Moines Emergency Medical Services and various businesses within our community. The goal of the program is to have defibrillators available to cardiac arrest patients as quickly as possible following their collapse. Due to the size of our City, West Des Moines offers some unique challenges for EMS crews responding to cardiac arrest patients. Key locations were chosen for the placement of the defibrillators such as businesses with large numbers of employees, golf courses, and city owned facilities.
This fund was established to account for public and business donations for the purchase of thedefibrillators and associated supplies. Each unit costs approximately $3,000.
BUDGET SUMMARY | FY 2010-2011 137

SPECIAL REVENUE FUNDS EMS FUNDS
INCEC)
Oper
Prope
TIF R
Other
Licens
Use o
Interg
Charg
Speci
Misce 0.00%)
Sub- .00%)
Othe
Proce
Trans
Sub-
TOTA .00%)
Oper
Perso
Suppl
Unive
Non-R 0.00%)
Capita
Sub- .00%)
Debt
Capit
Total .00%)
Trans
TOTA .00%)
EXCEOVER
BEGI n/a
ENDI n/a
FUND
ACTUAL FY 2007-08
ACTUAL FY 2008-09
REVISED BUDGET
FY 2009-10BUDGET
FY 2010-11
INC(DEC) FY 2010-11
OVERFY 2009-10
% (D
REVENUES
ating Revenues
rty Taxes
evenues
City Taxes
es and Permits
f Money and Property
overnmental
es for Services
al Assessments
llaneous 15,512 8,000 (8,000) (10
total Operating Revenues $15,512 $8,000 ($8,000) (100
r Financing Sources
eds of Long Term Debt
fers In
total Other Financing Sources
L REVENUES & OTHER SOURCES $15,512 $8,000 ($8,000) (100
EXPENDITURES
ating Expenditures
nal Services
ies and Services
rsal Commodities
ecurring/Non-Capital 8,586 4,181 8,000 (8,000) (10
l
total Operating Expenditures $8,586 $4,181 $8,000 ($8,000) (100
Service Expenditures
al Improvement Expenditures
Expenditures $8,586 $4,181 $8,000 ($8,000) (100
fers Out
L EXPENDITURES/TRANSFERS OUT $8,586 $4,181 $8,000 ($8,000) (100
SS (DEFICIENCY) OF REVENUES EXPENDITURES $6,926 ($4,181)
NNING FUND BALANCE $4,414 $11,340 $7,159 $7,159
NG FUND BALANCE $11,340 $7,159 $7,159 $7,159
BALANCE% OF EXPENDITURES 132.08% 171.23% 89.49% n/a
BUDGET SUMMARY | FY 2010-2011 138