Embed Size (px)
Citation preview

The Implications of IMO Spec Change on Bunker & Storage Companies
Platts Bunkering & Storage Asia Conference
Richard Gorry
28 June 2017
Special Presentation
Disclaimer
All statements other than statements of historical fact are, or may be deemed to be, forward-looking statements. Forward-looking statements (including those depicted in graphical form) are statements of future expectations that are based on JBC Energy’s current expectations and assumptions and involve known and unknown risks and uncertainties that could cause actual results, performance or events to differ materially from those expressed or implied in these statements. Forward-looking statements include, among other things statements expressing JBC Energy’s expectations, beliefs, estimates, forecasts, projections and assumptions. These forward-looking statements are identified by their use of terms and phrases such as ‘‘anticipate’’, ‘‘believe’’, ‘‘could’’, ‘‘estimate’’, ‘‘expect’’, ‘‘intend’’, ‘‘may’’, ‘‘plan’’, ‘‘objectives’’, ‘‘outlook’’, ‘‘probably’’, ‘‘project’’, ‘‘will’’, “forecast”, “predict”, “think”, ‘‘seek’’, ‘‘target’’, ‘‘risks’’, ‘‘goals’’, ‘‘should’’ and similar terms and phrases. All forward-looking statements contained in this speech/presentation are expressly qualified in their entirety by the cautionary statements contained or referred to in this section. Readers/audience should not place undue reliance on forward-looking statements. Each forward-looking statement speaks only as of the date of this presentation. Neither JBC Energy nor any of its subsidiaries undertake any obligation to publicly update or revise any forward-looking statement as a result of new information, future events or other information. In light of these risks, results could differ materially from those stated, implied or inferred from the forward-looking statements contained in this speech/presentation. Any persons acting on information contained in this presentation does so solely at their own risk. JBC Energy is not responsible for the accuracy of data collected from external sources and will not be held liable for any errors or omissions in facts or analysis contained in this presentation. JBC’s third party sources provide data to JBC on an “as-is” basis and accept no responsibility and disclaim any liability relating to reliance on or use of their data by any party. Data sourced as SuDeP (JBC’s in-house Supply-Demand-Price forecasting model) or JBC Derived Data may be partly based on EIA and various national statistical entities; JODI; the MODS, ADS or MGDS (http://data.iea.org) services developed by the IEA, © OECD/IEA 2017; OPEC; and other industry sources, but the resulting work has been prepared by JBC Energy and does not necessarily reflect the views of the original data providers. To the extent that JBC Energy comments or opines on data obtained from third party sources, these comments or opinions shall be understood as JBC Energy’s own comments or opinions unless a third party is quoted as their source.
Wednesday, 28 June 2017 www.jbcenergy.com Slide 2
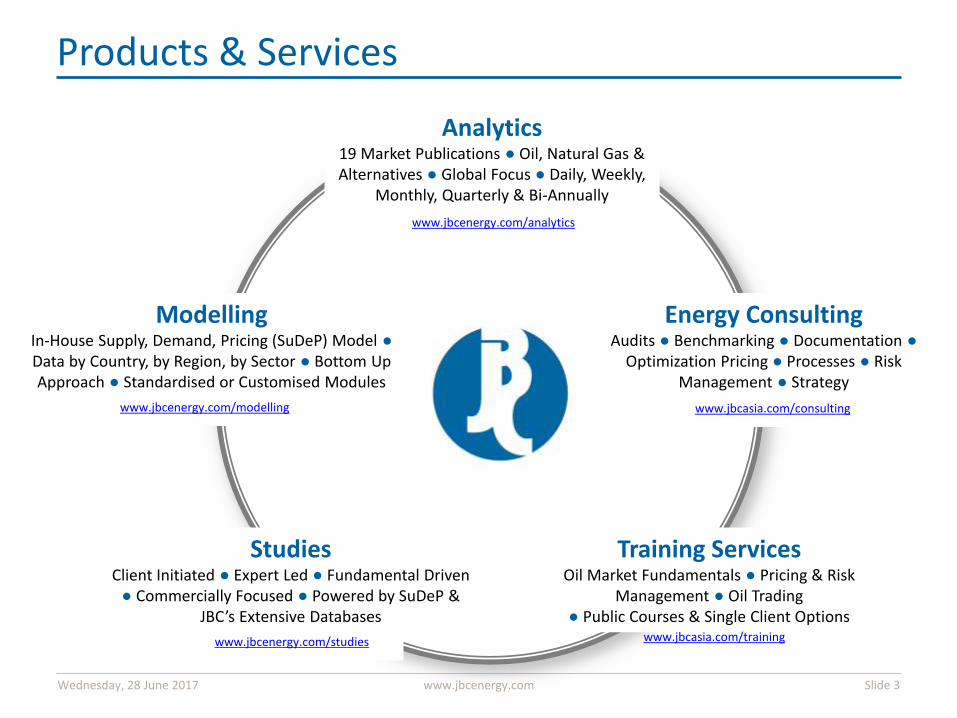
Studies Client Initiated ● Expert Led ● Fundamental Driven
● Commercially Focused ● Powered by SuDeP & JBC’s Extensive Databases
Training Services Oil Market Fundamentals ● Pricing & Risk
Management ● Oil Trading ● Public Courses & Single Client Options
www.jbcenergy.com/studies
www.jbcasia.com/consulting
www.jbcasia.com/training
Energy Consulting Audits ● Benchmarking ● Documentation ●
Optimization Pricing ● Processes ● Risk Management ● Strategy
Analytics 19 Market Publications ● Oil, Natural Gas & Alternatives ● Global Focus ● Daily, Weekly,
Monthly, Quarterly & Bi-Annually
www.jbcenergy.com/analytics
Modelling In-House Supply, Demand, Pricing (SuDeP) Model ● Data by Country, by Region, by Sector ● Bottom Up Approach ● Standardised or Customised Modules
www.jbcenergy.com/modelling
Products & Services
Wednesday, 28 June 2017 www.jbcenergy.com Slide 3
Introduction
• Agenda
– Main Considerations of IMO Spec Shift
– IMO challenge to be handled with existing system
– Why Compliant Gasoil Isn’t the Answer
– Key Findings of JBC’s Bunker Study
– Storage Plays Remain Part of Balancing Process
– Conclusion
Wednesday, 28 June 2017 www.jbcenergy.com Slide 4
Main Considerations of IMO Spec Shift
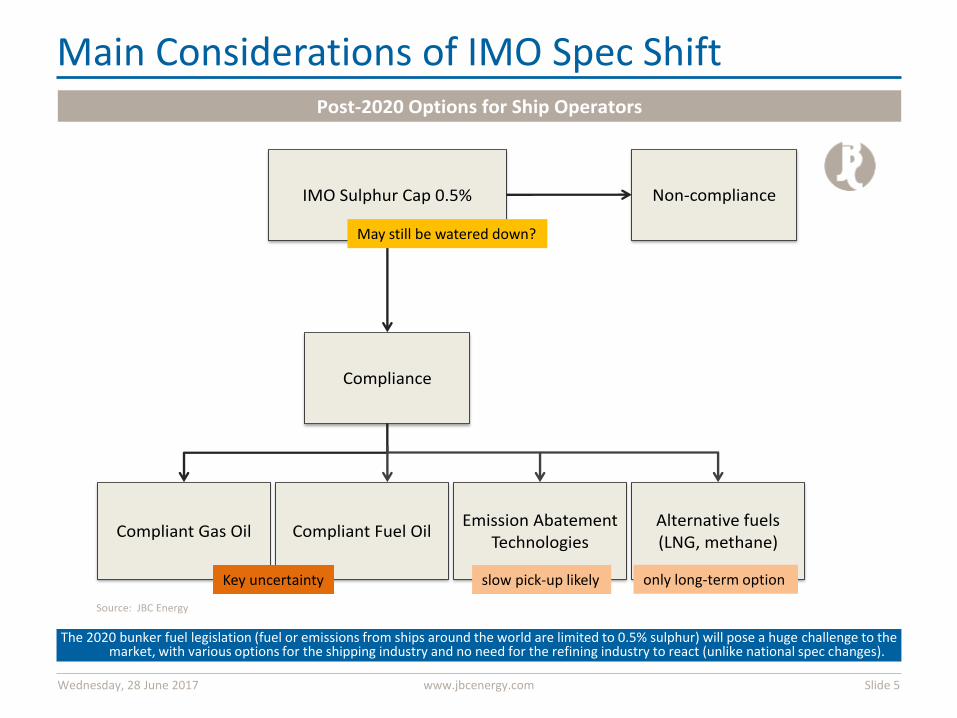
The 2020 bunker fuel legislation (fuel or emissions from ships around the world are limited to 0.5% sulphur) will pose a huge challenge to the market, with various options for the shipping industry and no need for the refining industry to react (unlike national spec changes).
Wednesday, 28 June 2017 www.jbcenergy.com Slide 5
Post-2020 Options for Ship Operators
IMO Sulphur Cap 0.5%
Compliance
Non-compliance
Compliant Gas Oil Compliant Fuel OilEmission Abatement
TechnologiesAlternative fuels (LNG, methane)
Source: JBC Energy
May still be watered down?
only long-term option slow pick-up likely Key uncertainty
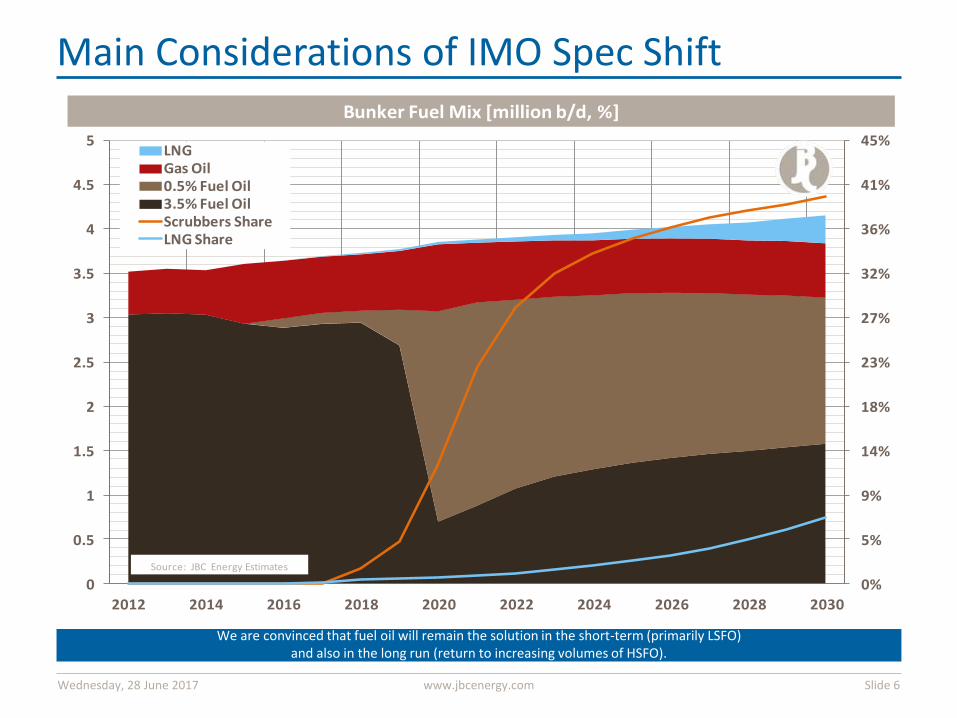
Main Considerations of IMO Spec Shift
We are convinced that fuel oil will remain the solution in the short-term (primarily LSFO) and also in the long run (return to increasing volumes of HSFO).
Wednesday, 28 June 2017 www.jbcenergy.com Slide 6
0%
5%
9%
14%
18%
23%
27%
32%
36%
41%
45%
0
0.5
1
1.5
2
2.5
3
3.5
4
4.5
5
2012 2014 2016 2018 2020 2022 2024 2026 2028 2030
LNGGas Oil0.5% Fuel Oil3.5% Fuel OilScrubbers ShareLNG Share
Bunker Fuel Mix [million b/d, %]
Source: JBC Energy Estimates
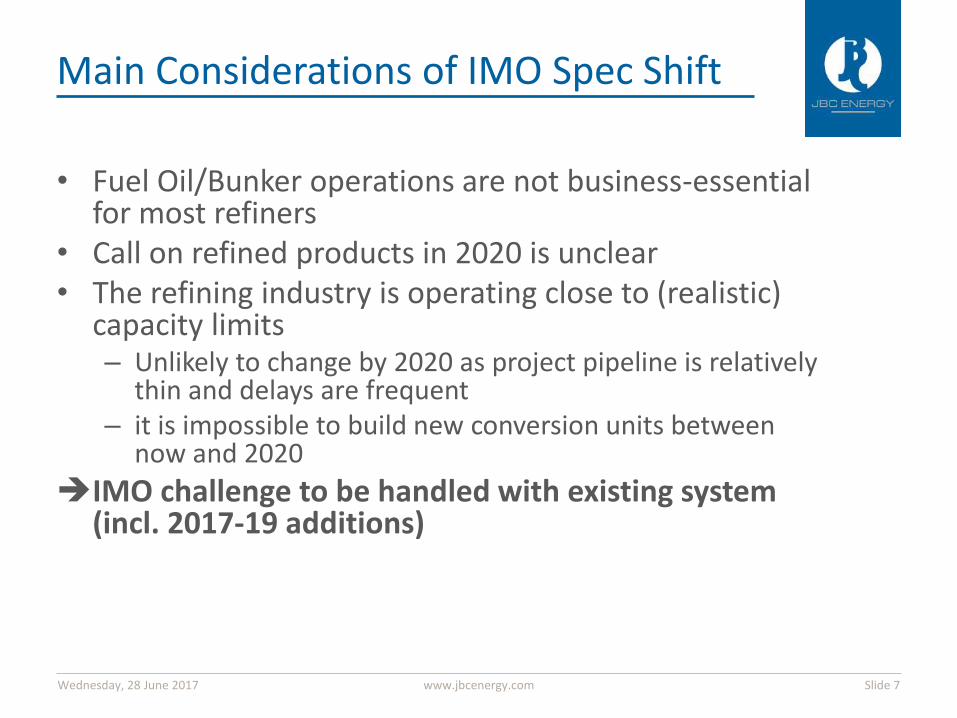
Main Considerations of IMO Spec Shift
• Fuel Oil/Bunker operations are not business-essential for most refiners
• Call on refined products in 2020 is unclear • The refining industry is operating close to (realistic)
capacity limits – Unlikely to change by 2020 as project pipeline is relatively
thin and delays are frequent – it is impossible to build new conversion units between
now and 2020
IMO challenge to be handled with existing system (incl. 2017-19 additions)
d
Wednesday, 28 June 2017 www.jbcenergy.com Slide 7
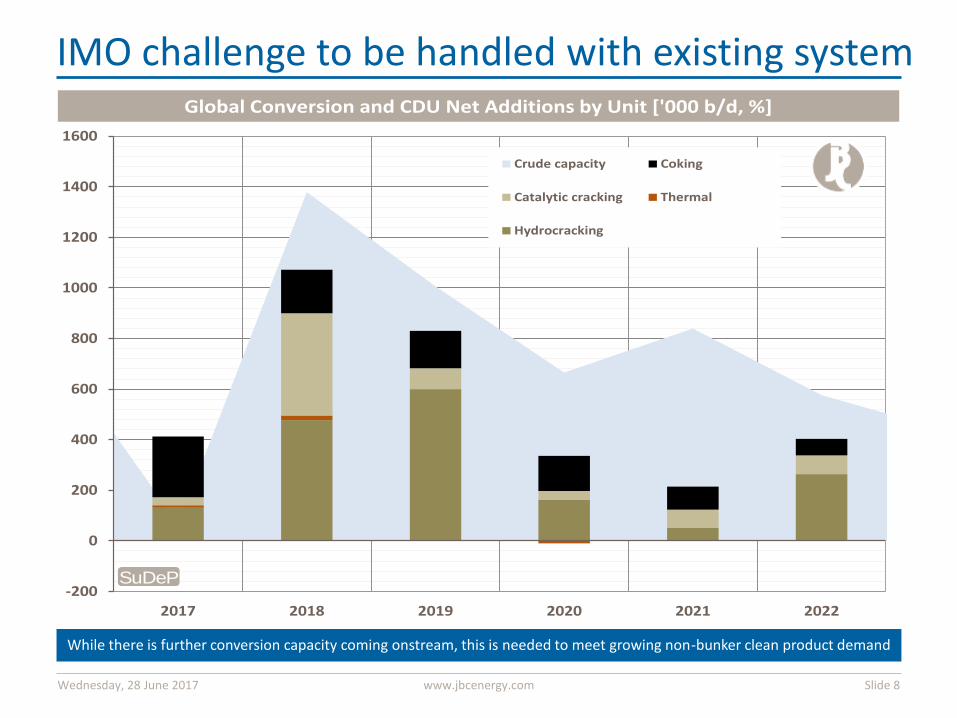
IMO challenge to be handled with existing system
While there is further conversion capacity coming onstream, this is needed to meet growing non-bunker clean product demand
Wednesday, 28 June 2017 www.jbcenergy.com Slide 8
-200
0
200
400
600
800
1000
1200
1400
1600
2017 2018 2019 2020 2021 2022
Crude capacity Coking
Catalytic cracking Thermal
Hydrocracking
Global Conversion and CDU Net Additions by Unit ['000 b/d, %]
SuDeP
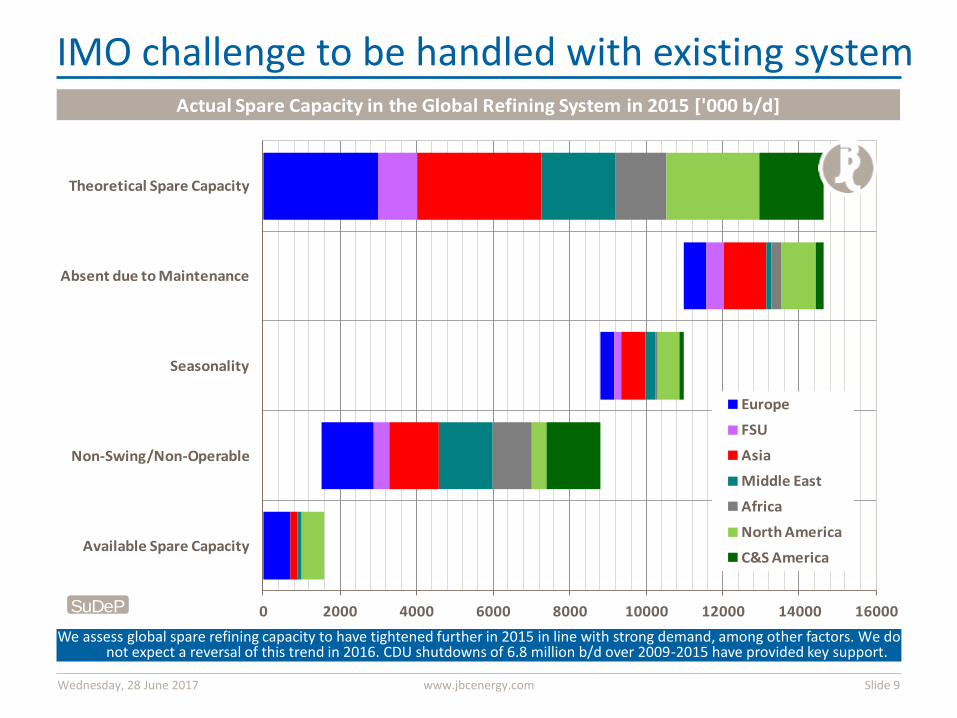
IMO challenge to be handled with existing system
We assess global spare refining capacity to have tightened further in 2015 in line with strong demand, among other factors. We do not expect a reversal of this trend in 2016. CDU shutdowns of 6.8 million b/d over 2009-2015 have provided key support.
Wednesday, 28 June 2017 www.jbcenergy.com Slide 9
0 2000 4000 6000 8000 10000 12000 14000 16000
Theoretical Spare Capacity
Absent due to Maintenance
Seasonality
Non-Swing/Non-Operable
Available Spare Capacity
Europe
FSU
Asia
Middle East
Africa
North America
C&S America
Actual Spare Capacity in the Global Refining System in 2015 ['000 b/d]
SuDeP
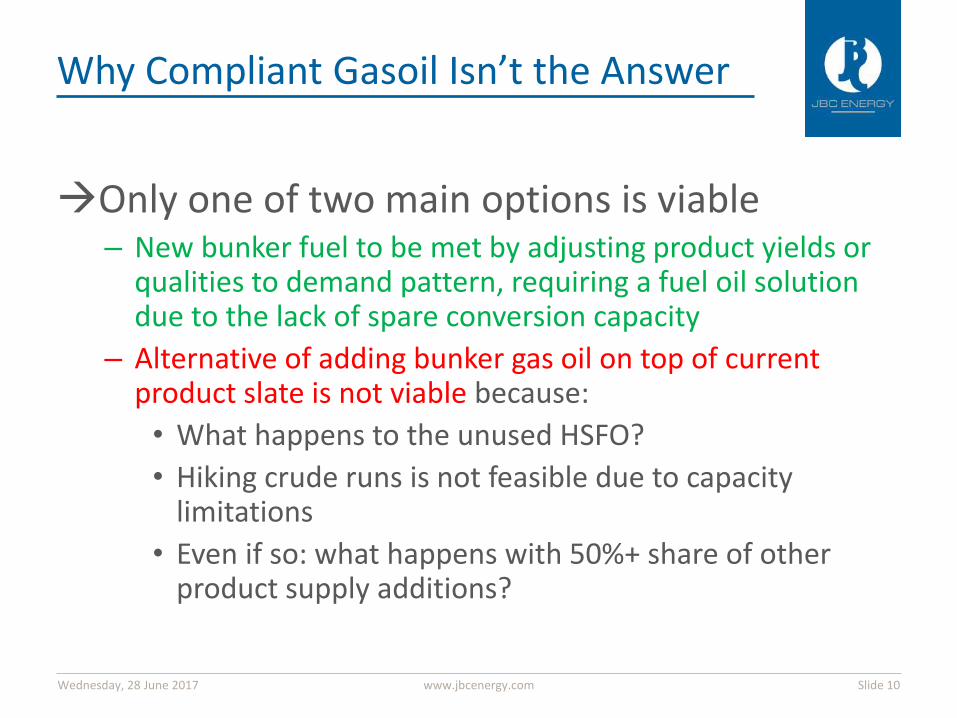
Why Compliant Gasoil Isn’t the Answer
Only one of two main options is viable – New bunker fuel to be met by adjusting product yields or
qualities to demand pattern, requiring a fuel oil solution due to the lack of spare conversion capacity
– Alternative of adding bunker gas oil on top of current product slate is not viable because:
• What happens to the unused HSFO?
• Hiking crude runs is not feasible due to capacity limitations
• Even if so: what happens with 50%+ share of other product supply additions?
Wednesday, 28 June 2017 www.jbcenergy.com Slide 10
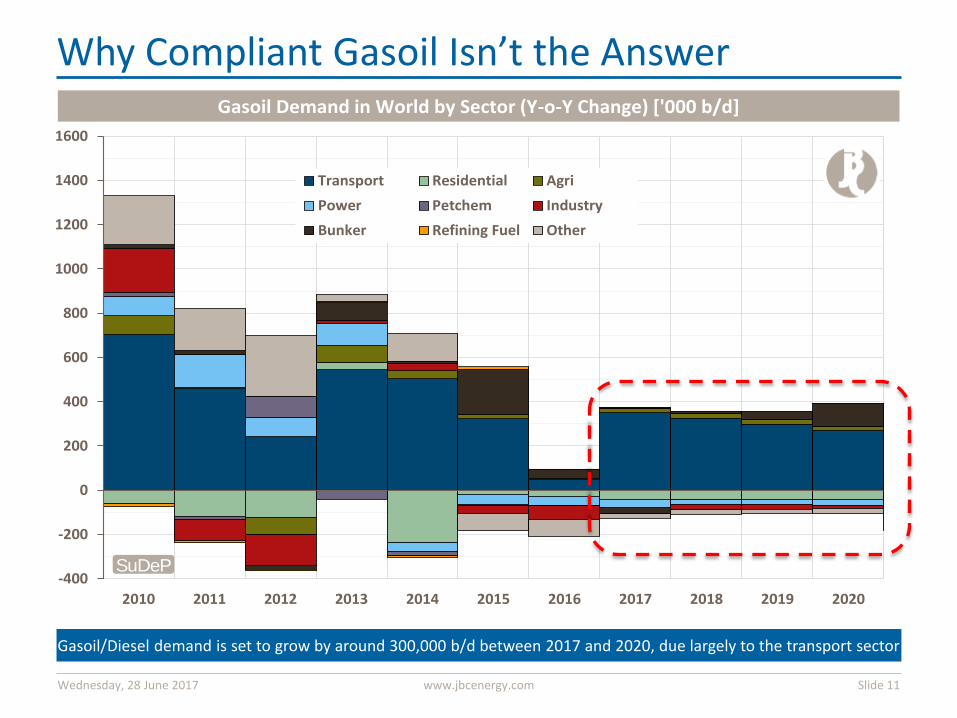
Why Compliant Gasoil Isn’t the Answer
Gasoil/Diesel demand is set to grow by around 300,000 b/d between 2017 and 2020, due largely to the transport sector
Wednesday, 28 June 2017 www.jbcenergy.com Slide 11
-400
-200
0
200
400
600
800
1000
1200
1400
1600
2010 2011 2012 2013 2014 2015 2016 2017 2018 2019 2020
Transport Residential Agri
Power Petchem Industry
Bunker Refining Fuel Other
Gasoil Demand in World by Sector (Y-o-Y Change) ['000 b/d]
SuDeP
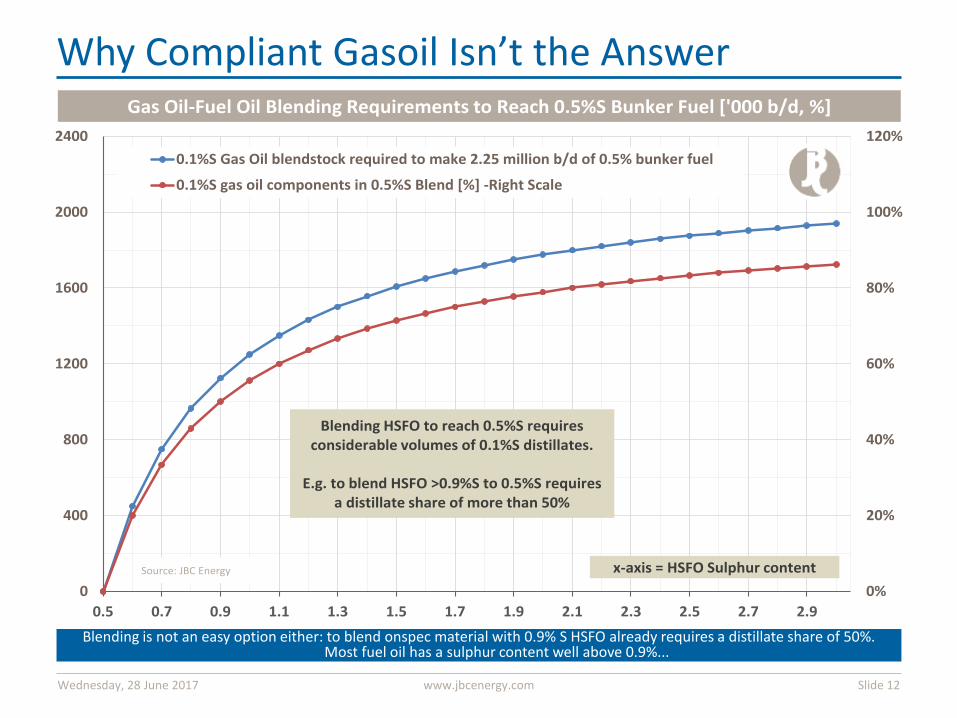
Why Compliant Gasoil Isn’t the Answer
Blending is not an easy option either: to blend onspec material with 0.9% S HSFO already requires a distillate share of 50%. Most fuel oil has a sulphur content well above 0.9%...
Wednesday, 28 June 2017 www.jbcenergy.com Slide 12
0%
20%
40%
60%
80%
100%
120%
0
400
800
1200
1600
2000
2400
0.5 0.7 0.9 1.1 1.3 1.5 1.7 1.9 2.1 2.3 2.5 2.7 2.9
0.1%S Gas Oil blendstock required to make 2.25 million b/d of 0.5% bunker fuel
0.1%S gas oil components in 0.5%S Blend [%] -Right Scale
Gas Oil-Fuel Oil Blending Requirements to Reach 0.5%S Bunker Fuel ['000 b/d, %]
x-axis = HSFO Sulphur contentSource: JBC Energy
Blending HSFO to reach 0.5%S requires considerable volumes of 0.1%S distillates.
E.g. to blend HSFO >0.9%S to 0.5%S requires a distillate share of more than 50%
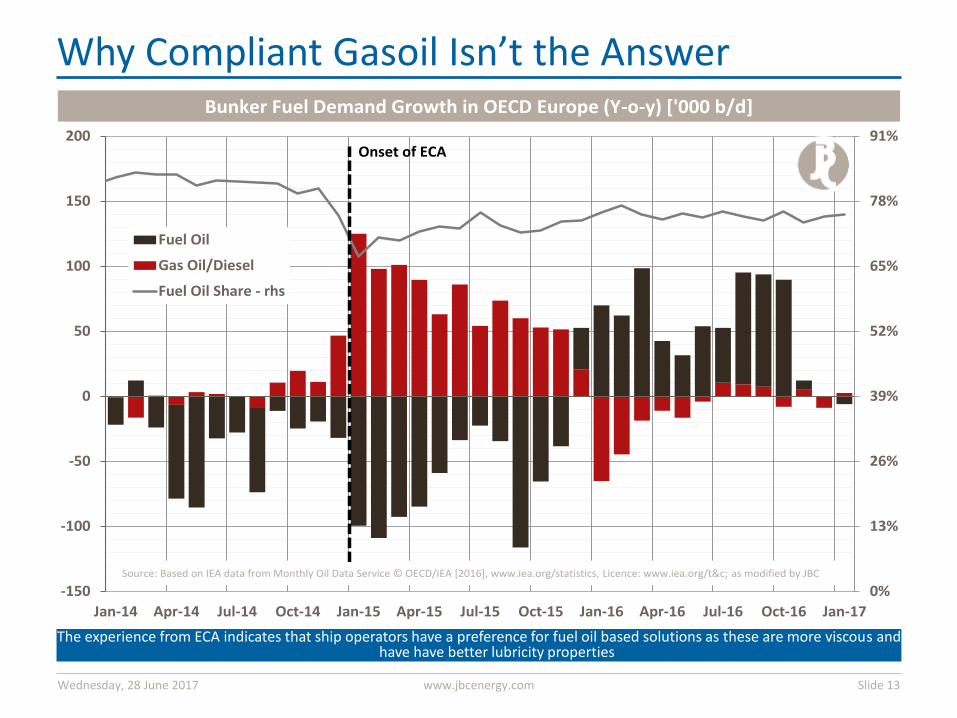
Why Compliant Gasoil Isn’t the Answer
The experience from ECA indicates that ship operators have a preference for fuel oil based solutions as these are more viscous and have have better lubricity properties
Wednesday, 28 June 2017 www.jbcenergy.com Slide 13
0%
13%
26%
39%
52%
65%
78%
91%
-150
-100
-50
0
50
100
150
200
Jan-14 Apr-14 Jul-14 Oct-14 Jan-15 Apr-15 Jul-15 Oct-15 Jan-16 Apr-16 Jul-16 Oct-16 Jan-17
Fuel Oil
Gas Oil/Diesel
Fuel Oil Share - rhs
Bunker Fuel Demand Growth in OECD Europe (Y-o-y) ['000 b/d]
Source: Based on IEA data from Monthly Oil Data Service © OECD/IEA [2016], www.iea.org/statistics, Licence: www.iea.org/t&c; as modified by JBC
Onset of ECA
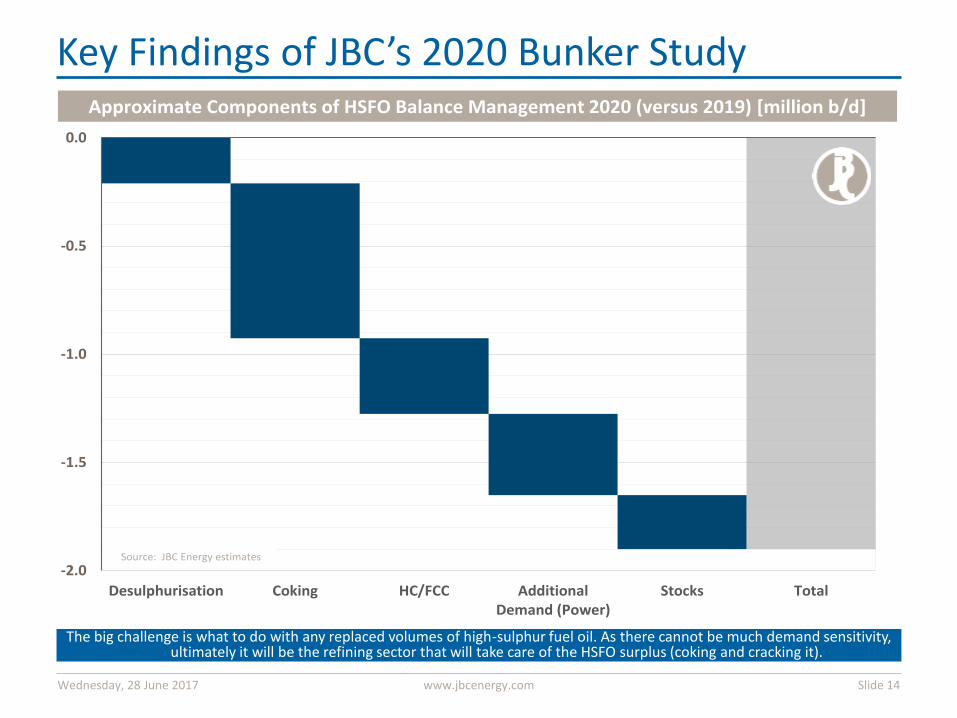
Key Findings of JBC’s 2020 Bunker Study
The big challenge is what to do with any replaced volumes of high-sulphur fuel oil. As there cannot be much demand sensitivity, ultimately it will be the refining sector that will take care of the HSFO surplus (coking and cracking it).
Wednesday, 28 June 2017 www.jbcenergy.com Slide 14
-2.0
-1.5
-1.0
-0.5
0.0
Desulphurisation Coking HC/FCC AdditionalDemand (Power)
Stocks Total
Approximate Components of HSFO Balance Management 2020 (versus 2019) [million b/d]
Source: JBC Energy estimates
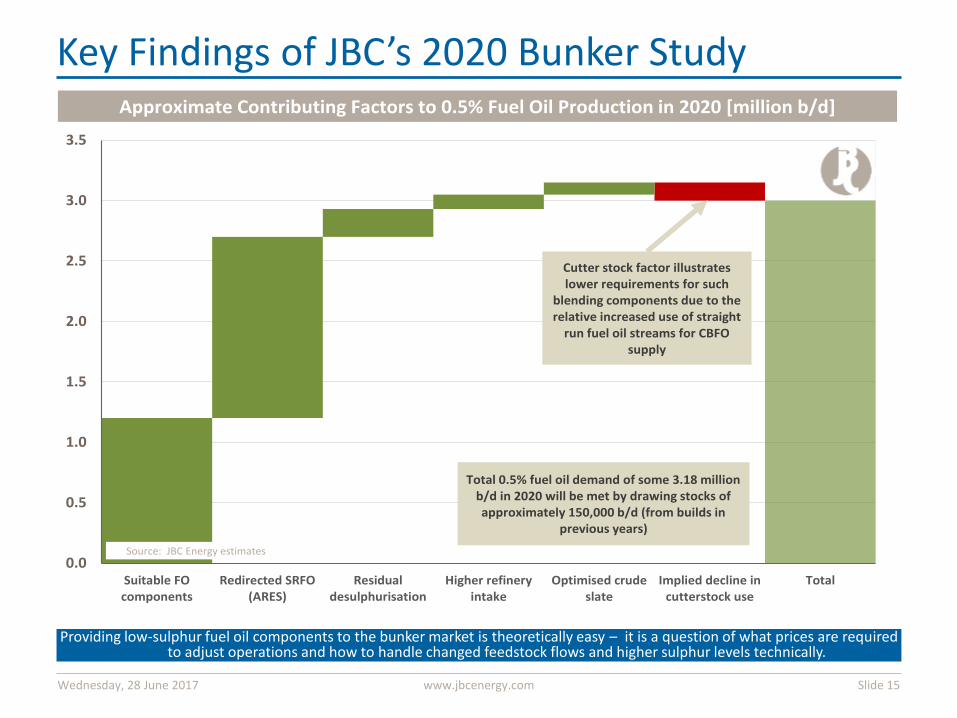
Key Findings of JBC’s 2020 Bunker Study
Providing low-sulphur fuel oil components to the bunker market is theoretically easy – it is a question of what prices are required to adjust operations and how to handle changed feedstock flows and higher sulphur levels technically.
Wednesday, 28 June 2017 www.jbcenergy.com Slide 15
0.0
0.5
1.0
1.5
2.0
2.5
3.0
3.5
Suitable FOcomponents
Redirected SRFO(ARES)
Residualdesulphurisation
Higher refineryintake
Optimised crudeslate
Implied decline incutterstock use
Total
Approximate Contributing Factors to 0.5% Fuel Oil Production in 2020 [million b/d]
Cutter stock factor illustrates lower requirements for such
blending components due to the relative increased use of straight
run fuel oil streams for CBFO supply
Source: JBC Energy estimates
Total 0.5% fuel oil demand of some 3.18 million b/d in 2020 will be met by drawing stocks of approximately 150,000 b/d (from builds in
previous years)
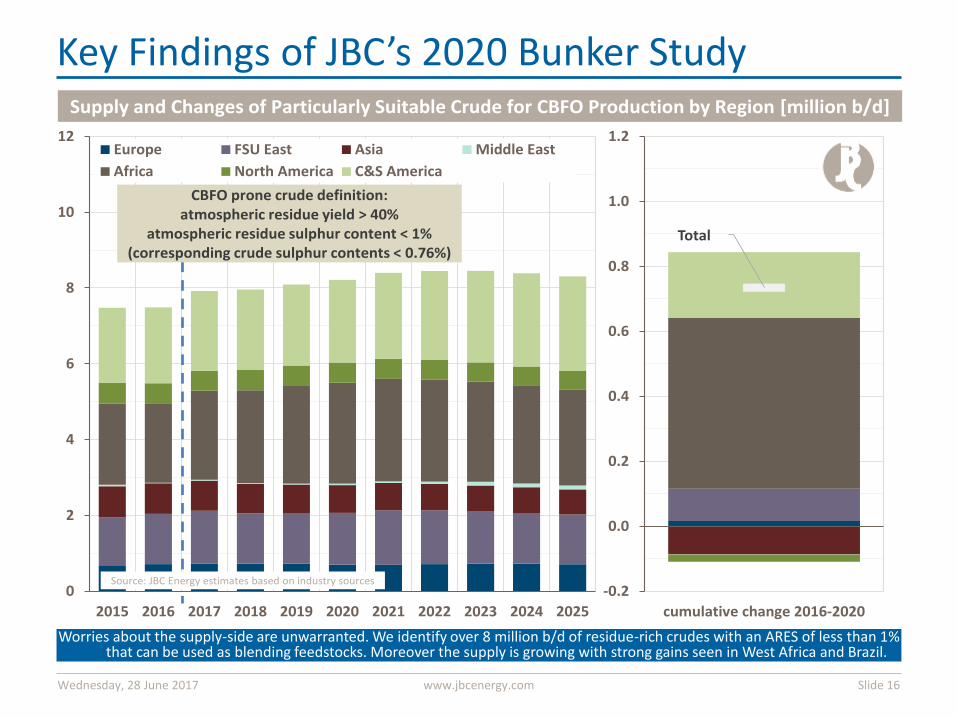
Key Findings of JBC’s 2020 Bunker Study
Worries about the supply-side are unwarranted. We identify over 8 million b/d of residue-rich crudes with an ARES of less than 1% that can be used as blending feedstocks. Moreover the supply is growing with strong gains seen in West Africa and Brazil.
Wednesday, 28 June 2017 www.jbcenergy.com Slide 16
0
2
4
6
8
10
12
2015 2016 2017 2018 2019 2020 2021 2022 2023 2024 2025
Europe FSU East Asia Middle East
Africa North America C&S America
Total
-0.2
0.0
0.2
0.4
0.6
0.8
1.0
1.2
cumulative change 2016-2020
Supply and Changes of Particularly Suitable Crude for CBFO Production by Region [million b/d]
Source: JBC Energy estimates based on industry sources
CBFO prone crude definition:atmospheric residue yield > 40%
atmospheric residue sulphur content < 1%(corresponding crude sulphur contents < 0.76%)
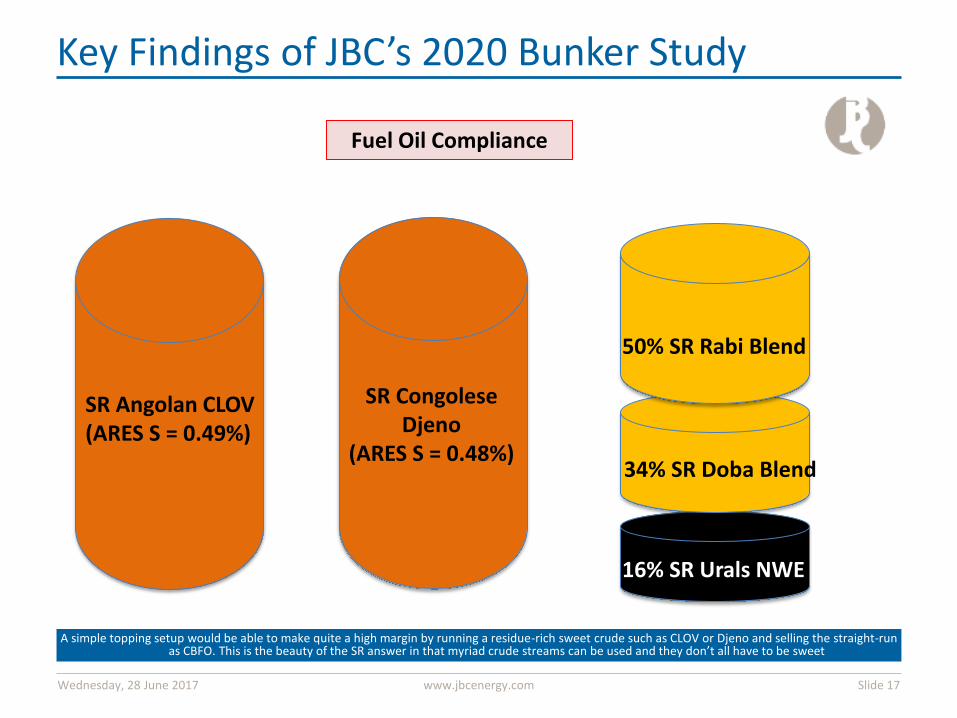
Key Findings of JBC’s 2020 Bunker Study
A simple topping setup would be able to make quite a high margin by running a residue-rich sweet crude such as CLOV or Djeno and selling the straight-run as CBFO. This is the beauty of the SR answer in that myriad crude streams can be used and they don’t all have to be sweet
Wednesday, 28 June 2017 www.jbcenergy.com Slide 17
0.0
0.5
1.0
1.5
2.0
2.5
3.0
3.5
Suitable FOcomponents
Redirected SRFO(ARES)
Residualdesulphurisation
Higher refineryintake
Optimised crudeslate
Implied decline incutterstock use
Total
Approximate Contributing Factors to 0.5% Fuel Oil Production in 2020 [million b/d]
Cutter stock factor illustrates lower requirements for such
blending components due to the relative increased use of straight
run fuel oil streams for CBFO supply
Source: JBC Energy estimates
Total 0.5% fuel oil demand of some 3.18 million b/d in 2020 will be met by drawing stocks of approximately 150,000 b/d (from builds in
previous years)
Fuel Oil Compliance
34% SR Doba Blend
SR Angolan CLOV (ARES S = 0.49%)
16% SR Urals NWE
50% SR Rabi Blend
SR Congolese Djeno
(ARES S = 0.48%)
Key Findings of JBC’s 2020 Bunker Study
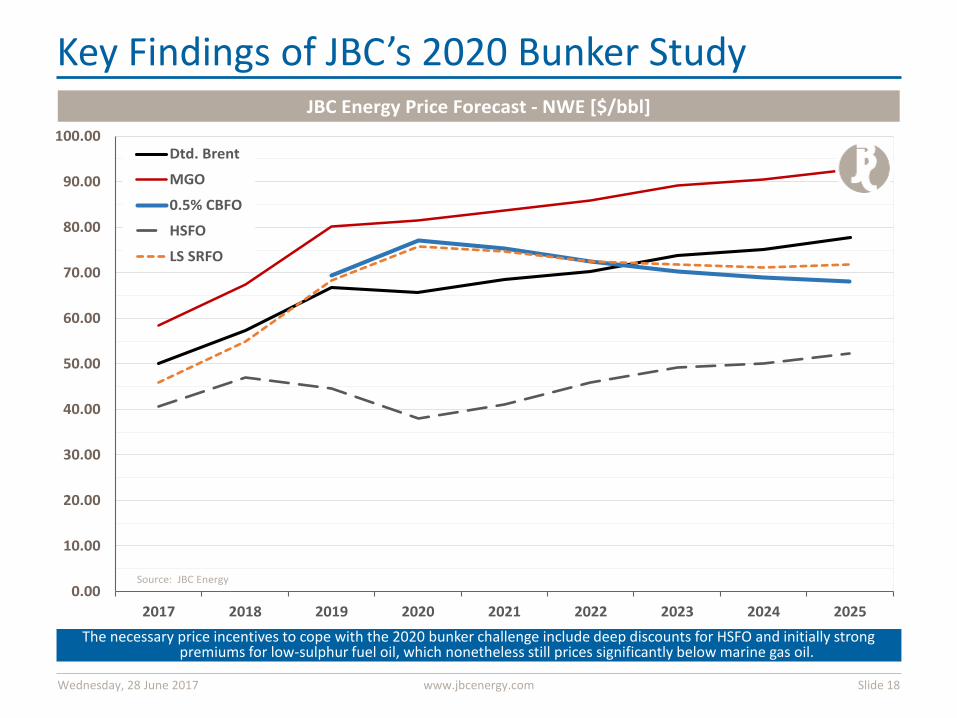
The necessary price incentives to cope with the 2020 bunker challenge include deep discounts for HSFO and initially strong premiums for low-sulphur fuel oil, which nonetheless still prices significantly below marine gas oil.
Wednesday, 28 June 2017 www.jbcenergy.com Slide 18
0.00
10.00
20.00
30.00
40.00
50.00
60.00
70.00
80.00
90.00
100.00
2017 2018 2019 2020 2021 2022 2023 2024 2025
Dtd. Brent
MGO
0.5% CBFO
HSFO
LS SRFO
JBC Energy Price Forecast - NWE [$/bbl]
Source: JBC Energy
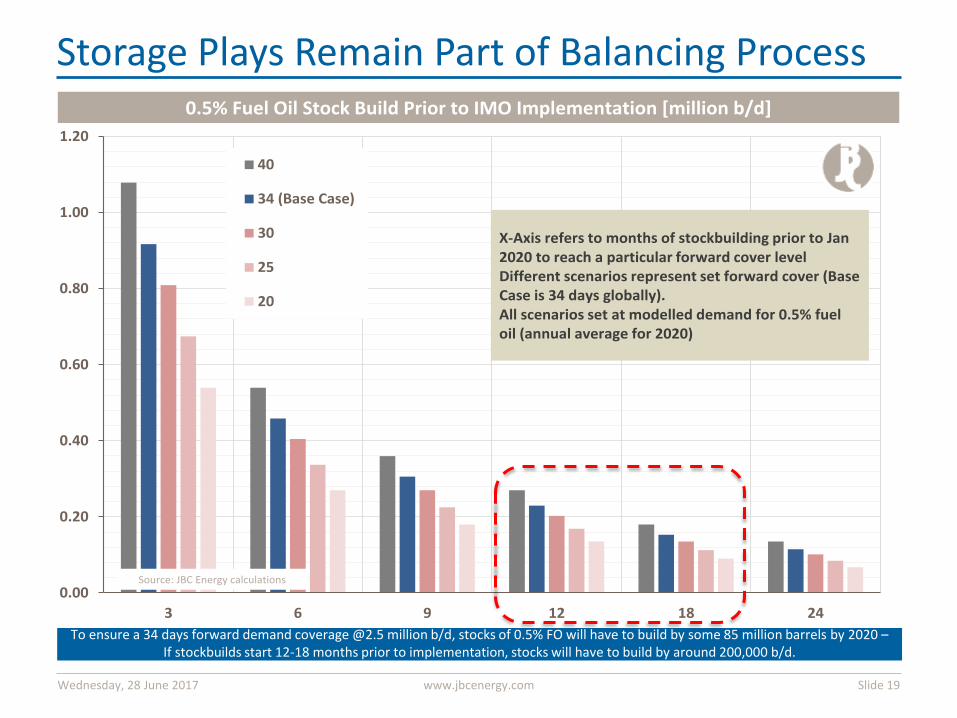
To ensure a 34 days forward demand coverage @2.5 million b/d, stocks of 0.5% FO will have to build by some 85 million barrels by 2020 – If stockbuilds start 12-18 months prior to implementation, stocks will have to build by around 200,000 b/d.
Wednesday, 28 June 2017 www.jbcenergy.com Slide 19
Storage Plays Remain Part of Balancing Process
0.00
0.20
0.40
0.60
0.80
1.00
1.20
3 6 9 12 18 24
40
34 (Base Case)
30
25
20
0.5% Fuel Oil Stock Build Prior to IMO Implementation [million b/d]
X-Axis refers to months of stockbuilding prior to Jan 2020 to reach a particular forward cover levelDifferent scenarios represent set forward cover (Base Case is 34 days globally).All scenarios set at modelled demand for 0.5% fuel oil (annual average for 2020)
Source: JBC Energy calculations
Storage Plays Remain Part of Balancing Process
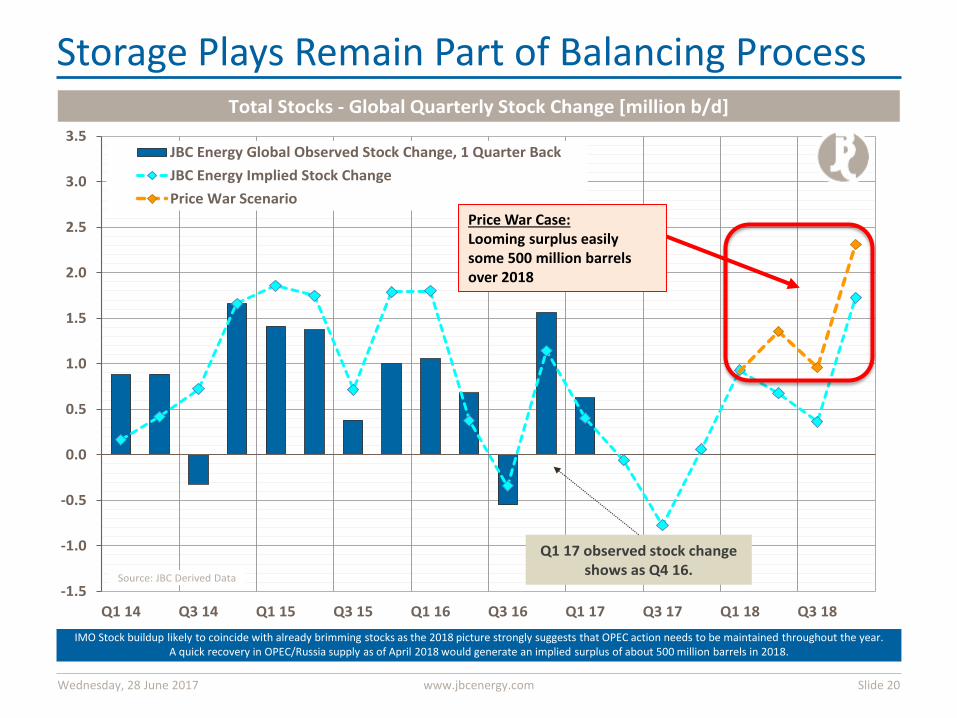
IMO Stock buildup likely to coincide with already brimming stocks as the 2018 picture strongly suggests that OPEC action needs to be maintained throughout the year. A quick recovery in OPEC/Russia supply as of April 2018 would generate an implied surplus of about 500 million barrels in 2018.
Wednesday, 28 June 2017 www.jbcenergy.com Slide 20
-1.5
-1.0
-0.5
0.0
0.5
1.0
1.5
2.0
2.5
3.0
3.5
Q1 14 Q3 14 Q1 15 Q3 15 Q1 16 Q3 16 Q1 17 Q3 17 Q1 18 Q3 18
JBC Energy Global Observed Stock Change, 1 Quarter Back
JBC Energy Implied Stock Change
Price War Scenario
Total Stocks - Global Quarterly Stock Change [million b/d]
Source: JBC Derived Data
Q1 17 observed stock change shows as Q4 16.
Price War Case: Looming surplus easily some 500 million barrels over 2018
Storage Plays Remain Part of Balancing Process
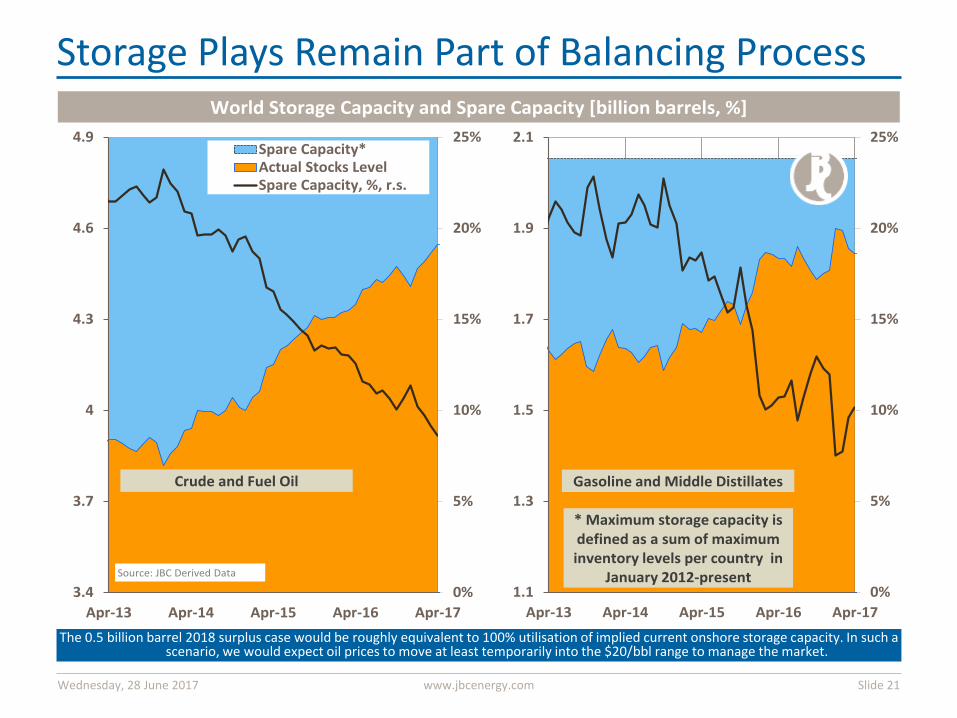
The 0.5 billion barrel 2018 surplus case would be roughly equivalent to 100% utilisation of implied current onshore storage capacity. In such a scenario, we would expect oil prices to move at least temporarily into the $20/bbl range to manage the market.
Wednesday, 28 June 2017 www.jbcenergy.com Slide 21
0%
5%
10%
15%
20%
25%
3.4
3.7
4
4.3
4.6
4.9
Apr-13 Apr-14 Apr-15 Apr-16 Apr-17
Spare Capacity*Actual Stocks LevelSpare Capacity, %, r.s.
World Storage Capacity and Spare Capacity [billion barrels, %]
0%
5%
10%
15%
20%
25%
1.1
1.3
1.5
1.7
1.9
2.1
Apr-13 Apr-14 Apr-15 Apr-16 Apr-17
* Maximum storage capacity is defined as a sum of maximum inventory levels per country in
January 2012-present
Crude and Fuel Oil Gasoline and Middle Distillates
Source: JBC Derived Data
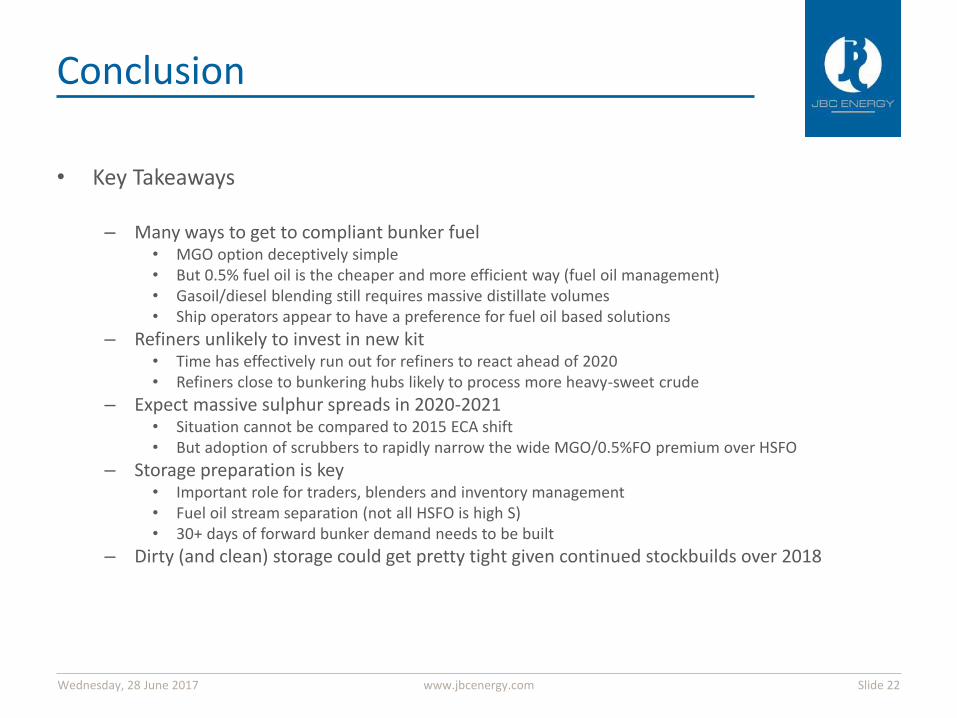
Conclusion
• Key Takeaways – Many ways to get to compliant bunker fuel
• MGO option deceptively simple • But 0.5% fuel oil is the cheaper and more efficient way (fuel oil management) • Gasoil/diesel blending still requires massive distillate volumes • Ship operators appear to have a preference for fuel oil based solutions
– Refiners unlikely to invest in new kit • Time has effectively run out for refiners to react ahead of 2020 • Refiners close to bunkering hubs likely to process more heavy-sweet crude
– Expect massive sulphur spreads in 2020-2021 • Situation cannot be compared to 2015 ECA shift • But adoption of scrubbers to rapidly narrow the wide MGO/0.5%FO premium over HSFO
– Storage preparation is key • Important role for traders, blenders and inventory management • Fuel oil stream separation (not all HSFO is high S) • 30+ days of forward bunker demand needs to be built
– Dirty (and clean) storage could get pretty tight given continued stockbuilds over 2018
Wednesday, 28 June 2017 www.jbcenergy.com Slide 22
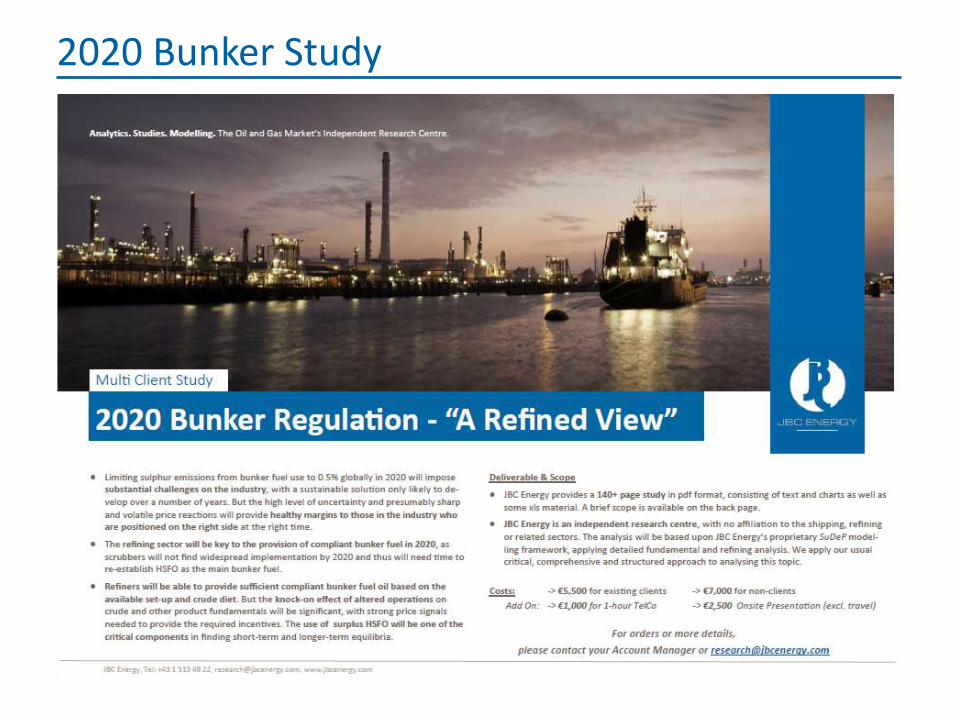
2020 Bunker Study
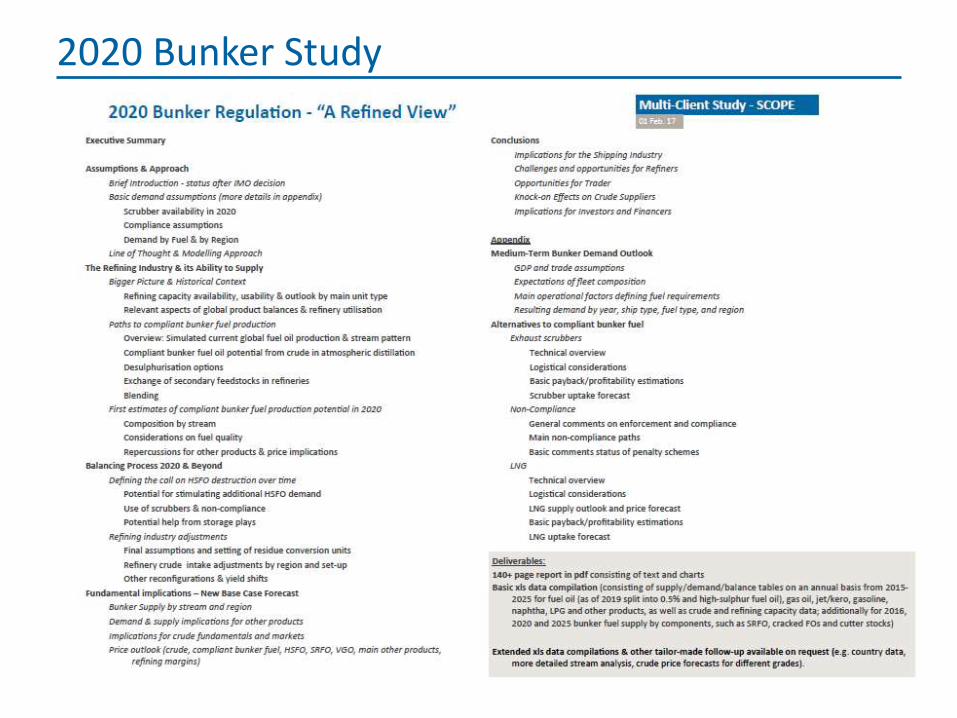
2020 Bunker Study
Thank you!