Embed Size (px)
Citation preview
U N I T E D N AT I O N S C O N F E R E N C E O N T R A D E A N D D E V E L O P M E N T
N°5
Special issue on rare earthsCOMMODITIES AT A GLANCE
Printed at United Nations, Geneva – GE.14-50515 – May 2014 – 984 – UNCTAD/SUC/2014/1
New York and Geneva, 2014
COMMODITIES AT A GLANCE Special issue on rare earths
N°5
U N I T E D N A T I O N S C O N F E R E N C E O N T R A D E A N D D E V E L O P M E N T
ii COMMODITIES AT A GLANCE
NOTES
The Commodities at a glance aims to collect, present and disseminate accurate and relevant statistical information linked to international primary commodity markets in a clear, concise and friendly format.
This edition of the Commodities at a Glance has been prepared by Alexandra Laurent, Statistical assistant for the Special Unit on Commodities (SUC) of UNCTAD, under the overall guidance of Samuel Gayi, Head of SUC, and the direct supervision of Janvier Nkurunziza, Chief of the Commodity Research and Analysis Section of SUC.
The report has benefitted from background information provided by Yan Zhang and Komi Tsowou.
The cover of this publication was created by: Nadège Hadjemian, UNCTAD.
Desktop publishing and graphics were performed by the Prepress subunit with the invaluable collaboration of Nathalie Loriot of the UNOG Printing Section.
For further information about this publication, please contact the Special Unit on Commodities (SUC), UNCTAD, Palais des Nations, CH-1211 Geneva 10, Switzerland, tel. +41 22 917 5676, e-mail: [email protected].
DISCLAIMER
The opinions expressed in this publications are those of the author and are not to be taken as the official views of the UNCTAD secretariat or its member States.
The designations employed and the presentation of the material do not imply the expression of any opinion on the part of the United Nations concerning the legal status of any country, territory, city or area, or of authorities or concerning the delimitation of its frontiers or boundaries.
Material in this publication may be freely quoted or reprinted, but acknowledgement is requested, together with a copy of the publication containing the quotation or reprint to be sent to the UNCTAD secretariat.
This publication has not been formally edited.
COPYRIGHT
The current report is intended to be published on a six-monthly basis. If you are interested in receiving the electronic version of the issues to come, please send an e-mail to: [email protected].
UNCTAD/SUC/2014/1
iiiNOTES
STATISTICAL DATA SOURCES
Data on Rare Earths are sparse and there is no dedicated international public institution that monitors the rare earth market to provide authoritative and objective statistics on the sector. As a result, this report has attempted to combine several sources of information in order to present the most possible accurate picture on the rare earths market. All data sources are indicated under each graph and table and a list of references is provided at the end of the document.
When there are large differences among sources of information (as in the case of reserves, for instance), all sources of information are presented individually.
As usual in this report series, only data that are accessible free of charge are used in order to allow the reader to follow-up easily on the information provided. Note that given the rapid changes in market information, new developments may have occurred since the drafting of the document.
ABBREVIATIONS IN THIS PUBLICATION
REE Rare Earth Elements
LREE Light Rare Earth Elements
HREE Heavy Rare Earth Elements
USGS United States Geological Survey
ROW Rest of the world
REO Rare Earth Oxides
BRICS Brazil, Russian Federation, India, China, South Africa
BRIC Brazil, Russian Federation, India, China
DSB Dispute Settlement Body
US$ United States Dollar
MW Megawatt

vCONTENTS
CONTENTS
CHAPTER 1 INTRODUCTION ......................................................................... 1
CHAPTER 2 RARE EARTH PRODUCTION ......................................................... 7
1. Rare Earth Production Cycle .................................................................................................................... 9
2. Historical World production .................................................................................................................... 10
3. Rare Earth production in China ................................................................................................................ 13
CHAPTER 3 RARE EARTH DEMAND ............................................................... 15
1. Rare earth uses....................................................................................................................................... 18
2. Countries likely to support Rare Earth demand ........................................................................................ 19
3. Sectors likely to affect Rare Earth demand .............................................................................................. 21
CHAPTER 4 RARE EARTH PRICES ................................................................. 25
1. TheinfluenceofChinainRareEarthPriceFormation .............................................................................. 28
2. Steps taken by consuming countries, outside China, to adapt to high prices ............................................ 31
CONCLUSION ............................................................................................... 39
BIBLIOGRAPHY .............................................................................................. 41
vi COMMODITIES AT A GLANCE
LIST OF FIGURES
CHAPTER 1 INTRODUCTION ......................................................................... 1
Figure 1. Distributionofworldrareearthreserves,2012(percent):differentestimates ................................. 6
CHAPTER 2 RARE EARTH PRODUCTION ......................................................... 7
Figure 2. RareEarthproductionprocess ........................................................................................................ 9
Figure 3. Longtermevolutionofworldrareearthproduction,1900-2012(tons) ............................................ 11
Figure 4. Distributionofproducingcountries,1995,2005,2012(percent) .................................................... 11
Figure 5. ChineseleadingREEcompanyandthetenworldleadingrareearthminingcompaniesby marketcapitalization(excludingChina),2December2013(millionUS$) ......................................... 12
CHAPTER 3 RARE EARTH DEMAND ............................................................... 15
Figure 6. Finalsectorsusingrareearthmaterialsasaninput ........................................................................ 17
Figure 7. Mainsemi-finalindustriesusingLightRareEarthElements(LREEs)asinputs ................................. 18
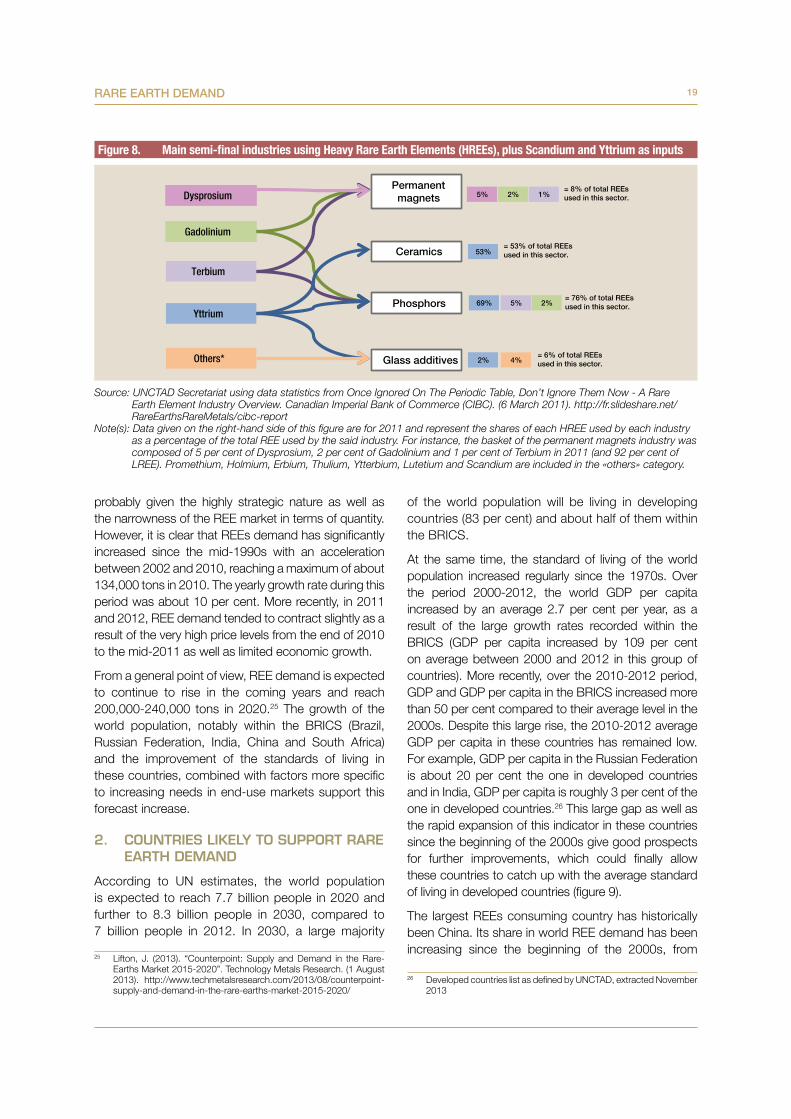
Figure 8. Mainsemi-finalindustriesusingHeavyRareEarthElements(HREEs),plusScandiumandYttrium as inputs .................................................................................................................................. 19
Figure 9. EvolutionoftheGDPpercapitaintheBRICSandthedevelopedcountries,1970-2012 (US$percapita) .............................................................................................................................. 20
Figure 10. ChineseREEsdemandasapercentageof:(1)worldREEsdemandand(2)ChineseREEs production,2000,2005,2012(percent) ......................................................................................... 20
Figure 11. Worldrareearthsdemandbyend-use,2012eand2015f(percent) ................................................ 22
Figure 12. PersonalTechnologyDemandOutlook,2010-2015(millionunits).................................................... 22
Figure 13. Worldcumulativewindpowercapacity,1996-2030(megawatt) ..................................................... 23
CHAPTER 4 RARE EARTH PRICES ................................................................. 25
Figure 14. ChineseREEproductionandChineseexportquotas,2000-2013(REOtons) .................................... 28
Figure 15. Exampleofpricesofrareearthandvalueadditionalongthemarketingchain(US$perkilo) ........... 30
Figure 16. UnitvalueofrareearthimportsinJapan,EU-27andtheUnitedStates,2000-2012(US$perkilo) ...... 32
Figure 17. Rareearthcriticalitymatrix,short-term(to2015) ............................................................................ 35
Figure 18. Rareearthcriticalitymatrix,medium-term(2015-2025) ................................................................. 35
Figure 19. Percentagechangeofselectedrareearthoxideprices,2012-2014(percent) ................................ 37
Figure 20. PercentageofindividualrareearthelementextractedfromthemainREEproducingareas,2013 (percent) ........................................................................................................................................ 37
Figure 21. Forecastsofproductionsurplusanddeficitsituationforselectedrareearthelements,2015(tons) ..... 38
viiCONTENTS
LIST OF TABLES
CHAPTER 1 INTRODUCTION ......................................................................... 1
Table 1. “Light”and“Heavy”rareearthelements ........................................................................................ 3
Table 2. Comparativetable ontheconcentrationofREEsandselectedindustrialandpreciousmetalsin earthcrust(partspermillion(ppm) ............................................................................................... 4
CHAPTER 2 RARE EARTH PRODUCTION ......................................................... 7
Table 3. DistributionofproductionquotaswithinthevariousprovincesofChina,2007-2011(percent)....... 13
CHAPTER 3 RARE EARTH DEMAND ............................................................... 15
Table 4.Globalwindpowercapacityinstalledbycountries/areas,2011,2020megawattandpercentage) .............. 24
CHAPTER 4 RARE EARTH PRICES ................................................................. 25
Table 5. AllocationsofREEexportquotasinChina,2013(tons) .................................................................... 29
Table 6. China’srareearthexporttaxes,2007-2011(percent) .................................................................... 31
Table 7. Stateofrareearthminesandprojectsaroundtheworld ................................................................. 33

CHAPTER 1INTRODUCTION

3INTRODUCTION
The first question to consider when beginning this report is to know why rare earths are considered by UNCTAD as commodities as some analysts do not think that they are.
As defined by the General Agreement on Tariffs and Trade, a « primary product is understood to be any product of farm, forest or fishery, or any mineral, in its natural form or which has undergone such processing as is customarily required to prepare it for marketing in substantial volume in international trade ».1 The notion of “fungibility” is also regularly associated with this definition. This means that a good may be substituted by any other of the same type when there is a slight differentiation between them. Rare earths clearly meet these definitions as they are defined according to some agreed standards such as their purity, which also determine their price. Moreover, traded quantities even though they appear to be small compared to other minerals, ores and metals markets, are increasing very rapidly. However, a difference between Rare earth market and some other major commodity markets that could be considered as “more homogeneous” is that Rare earths are not defined by international standards and/or are not traded on international commodity
1 The General Agreement on Tariffs and Trade, article XVI, Section b, point 2 http://www.wto.org/english/docs_e/legal_e/gatt47_e.pdf
exchanges, as is the case for other commodities such as cereals, coffee, cocoa or some other minerals, ores and metals.
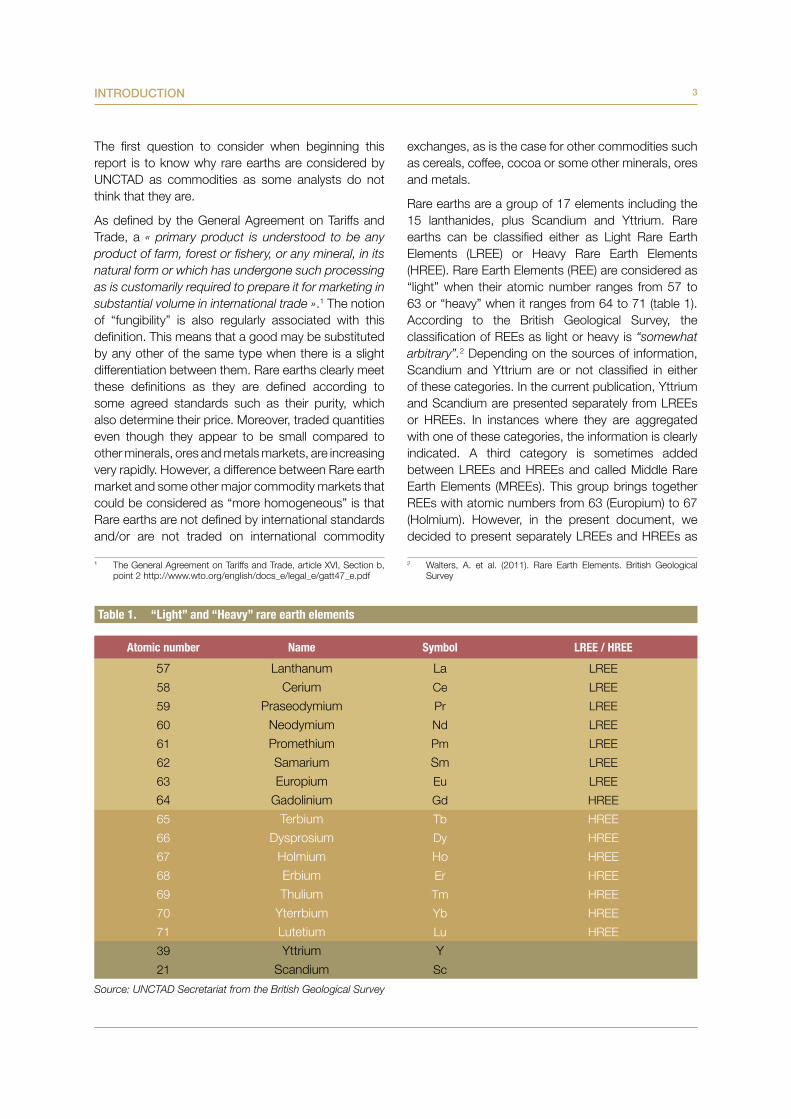
Rare earths are a group of 17 elements including the 15 lanthanides, plus Scandium and Yttrium. Rare earths can be classified either as Light Rare Earth Elements (LREE) or Heavy Rare Earth Elements (HREE). Rare Earth Elements (REE) are considered as “light” when their atomic number ranges from 57 to 63 or “heavy” when it ranges from 64 to 71 (table 1). According to the British Geological Survey, the classification of REEs as light or heavy is “somewhat arbitrary”.2 Depending on the sources of information, Scandium and Yttrium are or not classified in either of these categories. In the current publication, Yttrium and Scandium are presented separately from LREEs or HREEs. In instances where they are aggregated with one of these categories, the information is clearly indicated. A third category is sometimes added between LREEs and HREEs and called Middle Rare Earth Elements (MREEs). This group brings together REEs with atomic numbers from 63 (Europium) to 67 (Holmium). However, in the present document, we decided to present separately LREEs and HREEs as
2 Walters, A. et al. (2011). Rare Earth Elements. British Geological Survey
Table 1. “Light”and“Heavy”rareearthelements
Atomicnumber Name Symbol LREE/HREE
57 Lanthanum La LREE
58 Cerium Ce LREE
59 Praseodymium Pr LREE
60 Neodymium Nd LREE
61 Promethium Pm LREE
62 Samarium Sm LREE
63 Europium Eu LREE
64 Gadolinium Gd HREE
65 Terbium Tb HREE
66 Dysprosium Dy HREE
67 Holmium Ho HREE
68 Erbium Er HREE
69 Thulium Tm HREE
70 Yterrbium Yb HREE
71 Lutetium Lu HREE
39 Yttrium Y
21 Scandium Sc
Source: UNCTAD Secretariat from the British Geological Survey
4 COMMODITIES AT A GLANCE
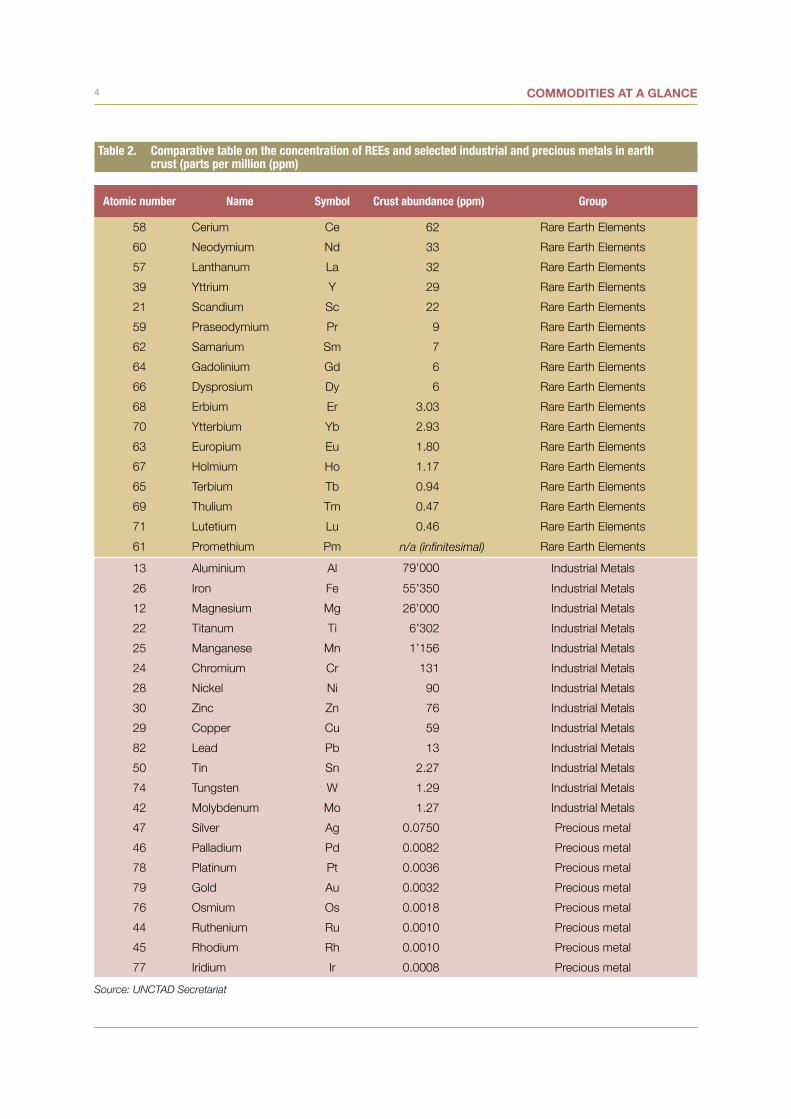
Table 2. Comparativetable ontheconcentrationofREEsandselectedindustrialandpreciousmetalsinearth crust(partspermillion(ppm)
Atomicnumber Name Symbol Crustabundance(ppm) Group
58 Cerium Ce 62 Rare Earth Elements
60 Neodymium Nd 33 Rare Earth Elements
57 Lanthanum La 32 Rare Earth Elements
39 Yttrium Y 29 Rare Earth Elements
21 Scandium Sc 22 Rare Earth Elements
59 Praseodymium Pr 9 Rare Earth Elements
62 Samarium Sm 7 Rare Earth Elements
64 Gadolinium Gd 6 Rare Earth Elements
66 Dysprosium Dy 6 Rare Earth Elements
68 Erbium Er 3.03 Rare Earth Elements
70 Ytterbium Yb 2.93 Rare Earth Elements
63 Europium Eu 1.80 Rare Earth Elements
67 Holmium Ho 1.17 Rare Earth Elements
65 Terbium Tb 0.94 Rare Earth Elements
69 Thulium Tm 0.47 Rare Earth Elements
71 Lutetium Lu 0.46 Rare Earth Elements
61 Promethium Pm n/a (infinitesimal) Rare Earth Elements
13 Aluminium Al 79’000 Industrial Metals
26 Iron Fe 55’350 Industrial Metals
12 Magnesium Mg 26’000 Industrial Metals
22 Titanum Ti 6’302 Industrial Metals
25 Manganese Mn 1’156 Industrial Metals
24 Chromium Cr 131 Industrial Metals
28 Nickel Ni 90 Industrial Metals
30 Zinc Zn 76 Industrial Metals
29 Copper Cu 59 Industrial Metals
82 Lead Pb 13 Industrial Metals
50 Tin Sn 2.27 Industrial Metals
74 Tungsten W 1.29 Industrial Metals
42 Molybdenum Mo 1.27 Industrial Metals
47 Silver Ag 0.0750 Precious metal
46 Palladium Pd 0.0082 Precious metal
78 Platinum Pt 0.0036 Precious metal
79 Gold Au 0.0032 Precious metal
76 Osmium Os 0.0018 Precious metal
44 Ruthenium Ru 0.0010 Precious metal
45 Rhodium Rh 0.0010 Precious metal
77 Iridium Ir 0.0008 Precious metal
Source: UNCTAD Secretariat
5INTRODUCTION
well as scandium and Yttrium, but not to consider the MREEs as a separate category.
REEs are qualified as “rare” given that they are generally not concentrated in commercially viable quantities, as well as due to the complexity of their separation process - which make them difficult to extract and recover cost effectively. Furthermore, some ores may be associated with radioactive elements (e.g. uranium), making them difficult and expensive to handle safely. However, even if named “rare”, REEs should not be considered as the rarest elements in earth crust as all of them but Promethium are more common than precious metals. Some REEs are also sometimes more common than some major industrial metals. For example, with 62 parts per million (ppm), Cerium is more common than Copper in earth crust and 11 out of the 17 REEs are more largely present than Tin (table 2). In nature, LREEs are more widely available than HREEs, except for Promethium which is found in infinitesimal quantities.
REEs are essential in the day to day life of people inhabiting developed and developing countries alike, given their large range of uses (e.g. oil refining uses rare earth catalysts, and red and green colours in TV and monitors are made possible by the use of REEs). REEs are also considered as “critical raw materials” by some countries and companies given their vital importance in the manufacturing of high-tech devices, military and defence applications as well as in green energy technologies. The European Union defines REEs – as well as 13 other materials - as “critical raw materials” as they “display a particularly high risk of supply shortage in the next 10 years and… are particularly important for the value chain”.3 The strategic importance of REEs stems from three main factors: first, their weak substitutability, second, their low recycling rate, and third, the concentration of the market within a limited number of actors. As an example, China was the main REE market player in 2012, dominating production (91 per cent of world production), demand (64 per cent of world demand) and exports (66 per cent of world exports).
The large gap existing between the various estimates of world rare earth reserves given by the various sources of information shows not only the difficulty existing in estimating minerals’ reserves worldwide, but also the high degree of political and economic sensitivity of the
3 Communication from the Commission to the European Parliament, the Council, the European Economic and Social Committee and the Committee of the Regions: Tackling the challenges in commodity markets and on raw materials. European Commission. (2 February 2011)
INTRODUCTION
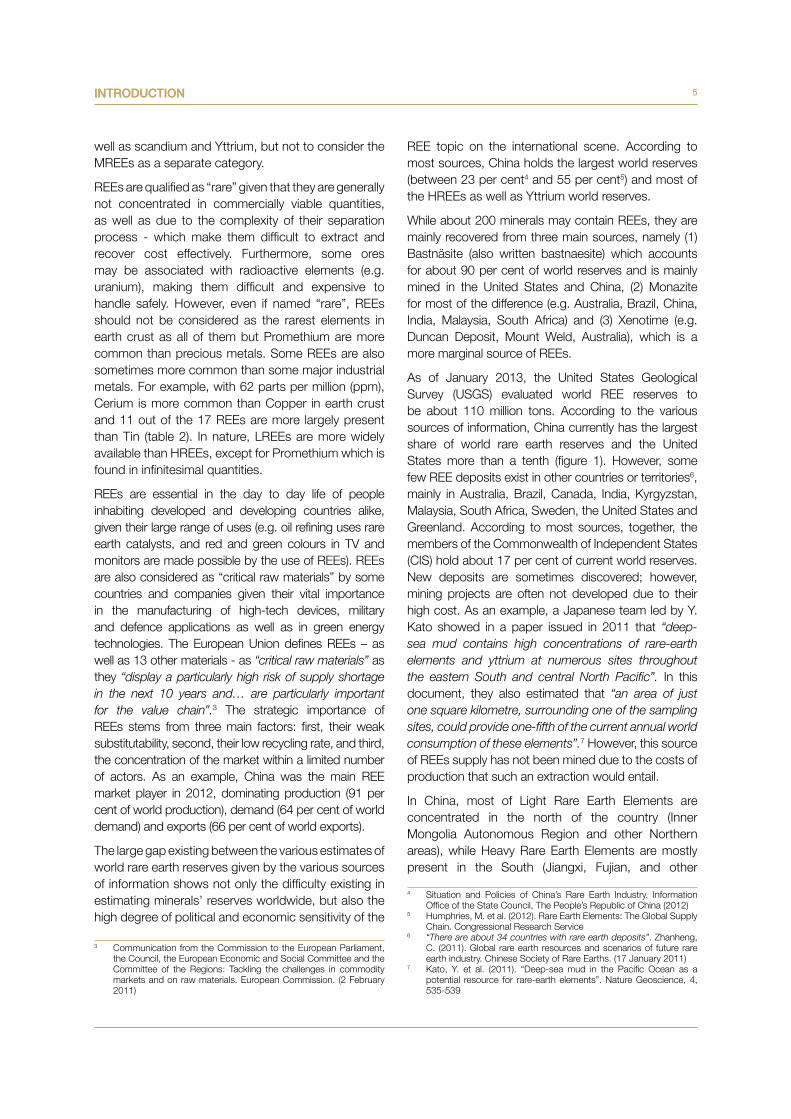
REE topic on the international scene. According to most sources, China holds the largest world reserves (between 23 per cent4 and 55 per cent5) and most of the HREEs as well as Yttrium world reserves.
While about 200 minerals may contain REEs, they are mainly recovered from three main sources, namely (1) Bastnäsite (also written bastnaesite) which accounts for about 90 per cent of world reserves and is mainly mined in the United States and China, (2) Monazite for most of the difference (e.g. Australia, Brazil, China, India, Malaysia, South Africa) and (3) Xenotime (e.g. Duncan Deposit, Mount Weld, Australia), which is a more marginal source of REEs.
As of January 2013, the United States Geological Survey (USGS) evaluated world REE reserves to be about 110 million tons. According to the various sources of information, China currently has the largest share of world rare earth reserves and the United States more than a tenth (figure 1). However, some few REE deposits exist in other countries or territories6, mainly in Australia, Brazil, Canada, India, Kyrgyzstan, Malaysia, South Africa, Sweden, the United States and Greenland. According to most sources, together, the members of the Commonwealth of Independent States (CIS) hold about 17 per cent of current world reserves. New deposits are sometimes discovered; however, mining projects are often not developed due to their high cost. As an example, a Japanese team led by Y. Kato showed in a paper issued in 2011 that “deep-sea mud contains high concentrations of rare-earth elements and yttrium at numerous sites throughout the eastern South and central North Pacific”. In this document, they also estimated that “an area of just one square kilometre, surrounding one of the sampling sites, could provide one-fifth of the current annual world consumption of these elements”.7 However, this source of REEs supply has not been mined due to the costs of production that such an extraction would entail.
In China, most of Light Rare Earth Elements are concentrated in the north of the country (Inner Mongolia Autonomous Region and other Northern areas), while Heavy Rare Earth Elements are mostly present in the South (Jiangxi, Fujian, and other
4 Situation and Policies of China’s Rare Earth Industry. Information Office of the State Council, The People’s Republic of China (2012)
5 Humphries, M. et al. (2012). Rare Earth Elements: The Global Supply Chain. Congressional Research Service
6 “There are about 34 countries with rare earth deposits”. Zhanheng, C. (2011). Global rare earth resources and scenarios of future rare earth industry. Chinese Society of Rare Earths. (17 January 2011)
7 Kato, Y. et al. (2011). “Deep-sea mud in the Pacific Ocean as a potential resource for rare-earth elements”. Nature Geoscience, 4, 535-539
6 COMMODITIES AT A GLANCE
Southern areas). In its report, the Information Office of the State Council of the People’s Republic of China 8 indicates that Chinese REE reserves account for 23 per cent of world total reserves. The share of
8 US Geological Survey defines reserves as “that part of the reserve base which could be economically extracted or produced at the time of determination. The term reserves need not signify that extraction facilities are in place and operative. Reserves include only recoverable materials; thus, terms such as “extractable reserves” and “recoverable reserves” are redundant and are not a part of this classification system.” to calculate net import reliance. Appendix C. Gambogi, J. (2013). Mineral Commodity Summaries. US Geological Survey
23
36
0.03
0.03
1.4
3
11
48
32(a)
13
55
38 (b)
0.3
0.4
1.5
3
12
50
0 10 20 30 40 50 60
Rest of the world(ROW)
Malaysia
Brazil
Australia
India
United States
China
Rare Earth Metals & ChinaRare Earth Elements: The Global Supply ChainUSGSInformation Office of the State Council, The People’s Republic of China
(a) Includes reserves for South Africa, Canada, Australia, Brazil, India, Russian Federation, Malaysia and Malawi. (b) Includes 17 per cent for Commonwealth Independent States.
Figure 1. Distributionofworldrareearthreserves,2012(percent):differentestimates
Source: UNCTAD Secretariat from Blakely et al., Humphries et al. (2012), USGS (2013) and the Information Office of the State Council, People’s Republic of China (2012)
China in world reserves has tended to decline due to intensive and sometimes uncontrolled production and processing of REEs in China in the past, as well as the discovery of new reserves elsewhere.
CHAPTER 2RARE EARTH PRODUCTION

9RARE EARTH PRODUCTION
1. RARE EARTH PRODUCTION CYCLE
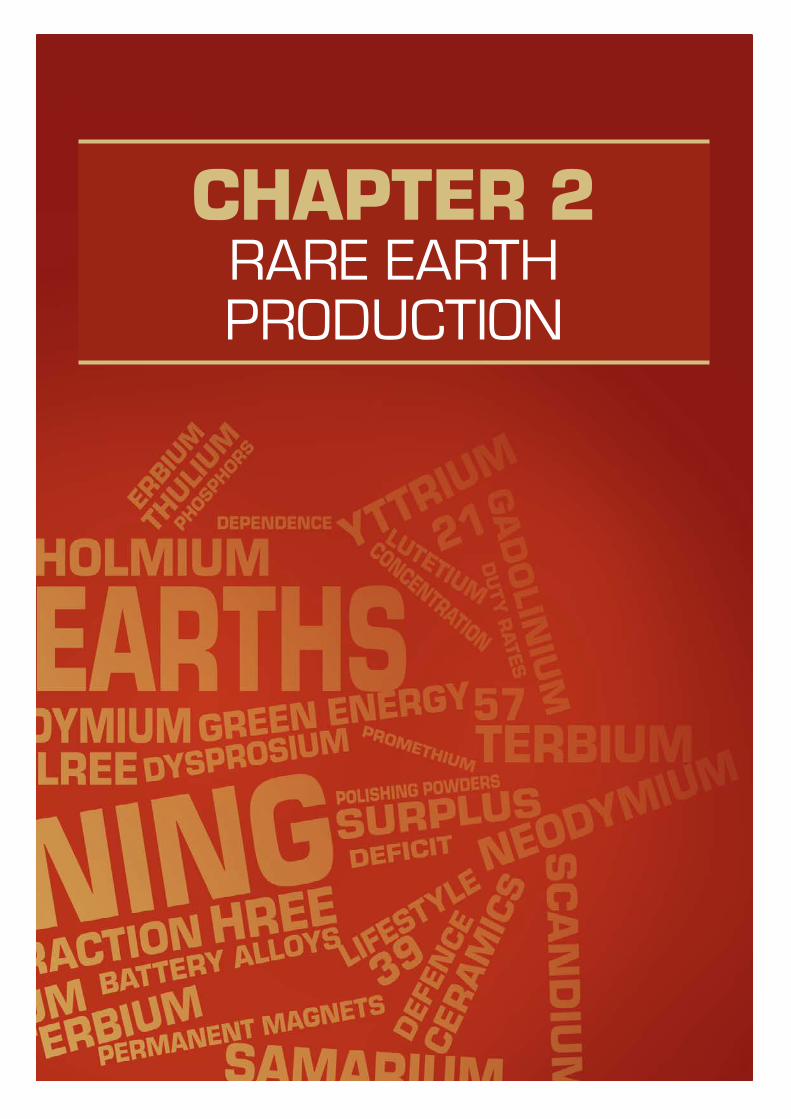
Usually, Rare Earth Elements do not exist individually in deposits but are generally associated with other metals in varying concentrations. The production chain to Rare Earth Metals (REMs) is long, complex and has to be adjusted to the specificities of production sites. The description below gives an example of the main production steps from the exploration of REEs to the production of REMs (figure 2).
The first step of any REEs production chain is the exploration or the identification of a deposit (e.g. location, size). This operation helps to determine whether, first, the deposit would be profitable,9 and second, assesses the concentration in LREEs and HREEs as well as individual REE types it contains. In fact, REEs are often mixed together in deposits,
9 “By convention, that portion of resources that is economic to mine is classified as a “reserve.” Long, K. et al. (2010). The Principal Rare Earth Elements Deposits of the United States - A Summary of Domestic Deposits and a Global Perspective. US Geological Survey
while their concentration may largely vary from one to another. For instance, Bastnäsite and Monazite mainly contain LREEs, with a higher concentration of HREEs in Monazite than in Bastnäsite. Xenotime is the largest source of HREEs worldwide (e.g. Dysprosium, Erbium, Holmium, Yterrbium, and Yttrium).
Two main types of exploration exist, depending on whether the deposit is sought in a previously mined area or not. In the first case, the exploration is known as brownfield, while the second case is called greenfield exploration. Mining exploration is largely affected by price cycles but more so for REEs. While exploration and even mining activities were almost totally suspended in the world except in China – which supplied cheap REE exports to the world - during the period of low REE prices, large investments in exploration of new mines or the reopening of former ones have been made as a result of the price boom of the 2010-2011 period.
Figure 2. RareEarthproductionprocess
Source: UNCTAD Secretariat
10 COMMODITIES AT A GLANCE
The processing of REEs can be divided in 3 successive stages:
First, the beneficiation step aims to produce concentrates and consists in the separation of the crushed ore from its gangue. There are three main separation techniques. The first two, namely magnetic and by gravity are equally used for Monazite
or Xenotime separation, while the third, the separation by flotation, is mostly used to process Bastnäsite ores. This operation does not change the chemical structure of the ore. However, as concentration generates a large quantity of waste (also named tailings), this activity is generally concentrated in areas surrounding old mines in order to reduce transportation costs.
Second, Rare Earth Oxides (REO) of individual elements are extracted from concentrates. This operation known as extraction is undertaken by hydrometallurgy (e.g. ion exchange, solvent extraction, fractional crystallization), electrometallurgy or
pyrometallurgy. The first one is the most widely used by the industry. While the recovered oxides are usable and marketable as such, they are generally further refined in order to produce pure Rare Earth Metals.
Third and final step: Rare Earth Oxides are refined into individual REMs using electrolysis, gaseous or metallothermic reduction techniques.
Oxides Metals
Concentrates Oxides
Ores Concentrates
2. HISTORICAL WORLD PRODUCTION
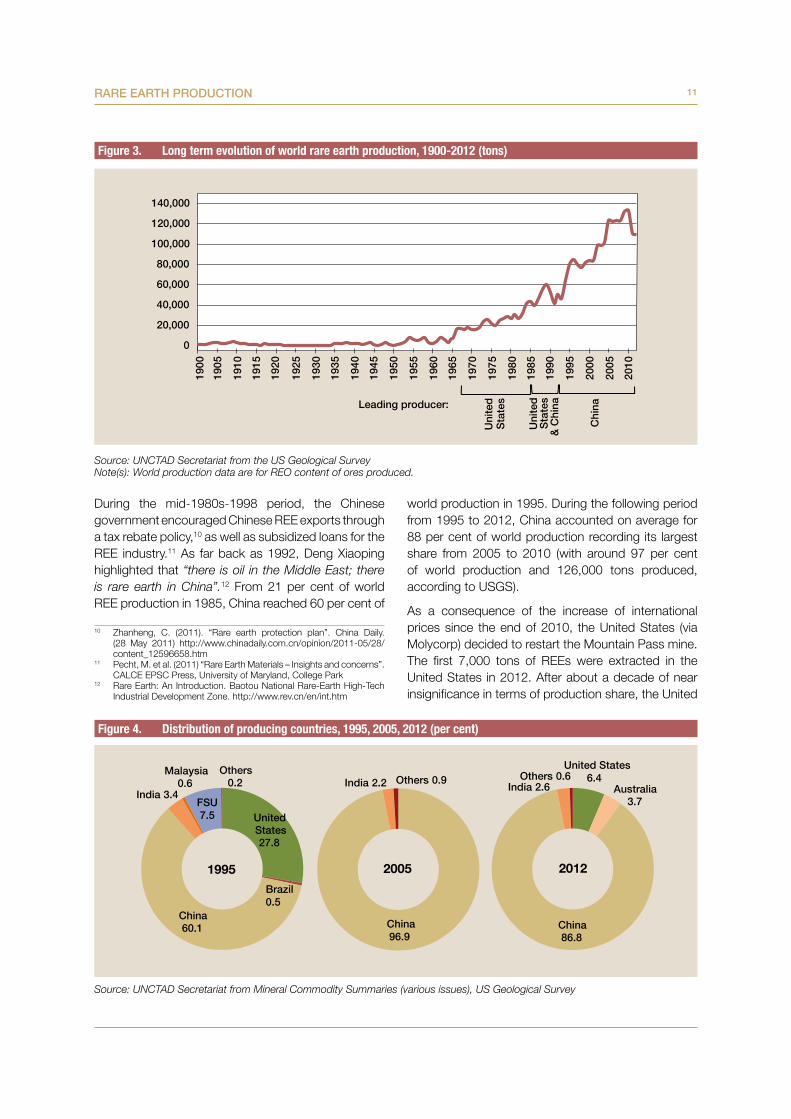
Prior to 1960, the average rare earth production was less than 2,000 tons a year. World rare earth production increased about 2-fold between 1990 and 2000, reaching 90,000 metric tons in 2000 from about 53,000 metric tons in 1990. During the following decade (2000 to 2012), rare earth production reached a peak at 133,300 tons in 2010 before falling to 110,000 tons in 2012 (figure 3). LREEs are historically more widely produced than HREEs in quantity terms and their reserves are also larger and more widely distributed worldwide. LREEs will continue to account for an overwhelming share of the total anticipated supply by 2015 (with about 97 per cent). The smallness of HREEs plus Yttrium production and reserves compared to LREEs partly explain the price difference between both these categories, the premium price received by HREEs and Yttrium on the market as well as their higher price volatility.
Despite the large increase of the global rare earth production between 1990 and 2012, REE production remains marginal compared to some other minerals, ores or metals. For instance, the REE production was respectively 48, 124 and 152 times lower than for lead, zinc or copper in 2012.
Over the period 1966-1984, the United States was the leading REE producing country with about 64 per cent
of world production (according to USGS statistics). In this period, most of the REE production was extracted from the Mountain Pass mine in California (which started in 1954). The United States recorded a maximum production of 19,900 tons in 1974, which was about 78 per cent of global REE production. However, since 1985, the share of the US production in world production has gradually dropped to an average of about a third of world production between 1985 and 1992 and finally to 5 per cent in 2002 (box 1).
The drop of the US production has been mainly the result of the fall of US competitiveness compared to REE imported from China and resulted in the closing of the Molycorp separation and refining plants in 1998 and the consecutive drop of US production by 75 per cent between 1997 and 2000. Finally, all mining operations were suspended in the United States after 2002 with the definitive closing of the Mountain Pass mine (as reflected by USGS data statistics).
BOX 1Approximately 20 years ago the U.S. had twelve rare earth oxide magnet factories, employing 6,000 work-ers and participating in a global market valued at $600 million. As of 2010, only four factories remained, with approximately 600 workers, while the global mar-ket had grown to a value of over $7 billion.Pecht et al. (2011)
11RARE EARTH PRODUCTION
0
20,000
40,000
60,000
80,000
100,000
120,000
140,00019
00
1905
1910
1915
1920
1925
1930
1935
1940
1945
1950
1955
1960
1965
1970
1975
1980
1985
1990
1995
2000
2005
2010
Uni
ted
Sta
tes
Chi
naLeading producer:
Uni
ted
Sta
tes
& C
hina
China96.9
India 2.2 Others 0.9
2005
United States 27.8
Brazil0.5
China 60.1
India 3.4
Malaysia 0.6
FSU7.5
Others 0.2
1995
United States6.4
Australia 3.7
China 86.8
India 2.6Others 0.6
2012
Figure 3. Longtermevolutionofworldrareearthproduction,1900-2012(tons)
Figure 4. Distributionofproducingcountries,1995,2005,2012(percent)
Source: UNCTAD Secretariat from the US Geological SurveyNote(s): World production data are for REO content of ores produced.
Source: UNCTAD Secretariat from Mineral Commodity Summaries (various issues), US Geological Survey
During the mid-1980s-1998 period, the Chinese government encouraged Chinese REE exports through a tax rebate policy,10 as well as subsidized loans for the REE industry.11 As far back as 1992, Deng Xiaoping highlighted that “there is oil in the Middle East; there is rare earth in China”.12 From 21 per cent of world REE production in 1985, China reached 60 per cent of
10 Zhanheng, C. (2011). “Rare earth protection plan”. China Daily. (28 May 2011) http://www.chinadaily.com.cn/opinion/2011-05/28/content_12596658.htm
11 Pecht, M. et al. (2011) “Rare Earth Materials – Insights and concerns”. CALCE EPSC Press, University of Maryland, College Park
12 Rare Earth: An Introduction. Baotou National Rare-Earth High-Tech Industrial Development Zone. http://www.rev.cn/en/int.htm
world production in 1995. During the following period from 1995 to 2012, China accounted on average for 88 per cent of world production recording its largest share from 2005 to 2010 (with around 97 per cent of world production and 126,000 tons produced, according to USGS).
As a consequence of the increase of international prices since the end of 2010, the United States (via Molycorp) decided to restart the Mountain Pass mine. The first 7,000 tons of REEs were extracted in the United States in 2012. After about a decade of near insignificance in terms of production share, the United
12 COMMODITIES AT A GLANCE
States ranked second in REE producing countries in 2012 with 6.4 per cent of world production (figure 4).
According to various reports issued by US and European sources, the expanding role of China in the world REE production and the simultaneous contraction of the share of other producing countries, United States in the lead, may be explained by the support of the Government of China to its REE sector as well as the lower labour costs and more flexible environmental regulatory framework during this period. These factors allowed China to produce REEs at a far lower cost than other producers, explaining why it was financially cheaper to import REEs from China than to produce them domestically. However, while cheap REE exports from China resulted in the contraction and sometimes the end of REE production in other countries, they also allowed companies in the
US, Europe and Japan notably, to invest in Research and Development and develop new technologies as well as to produce more advanced final goods at a more competitive cost; this gave a larger share of the population access to more advanced goods and technologies by decreasing their final price.
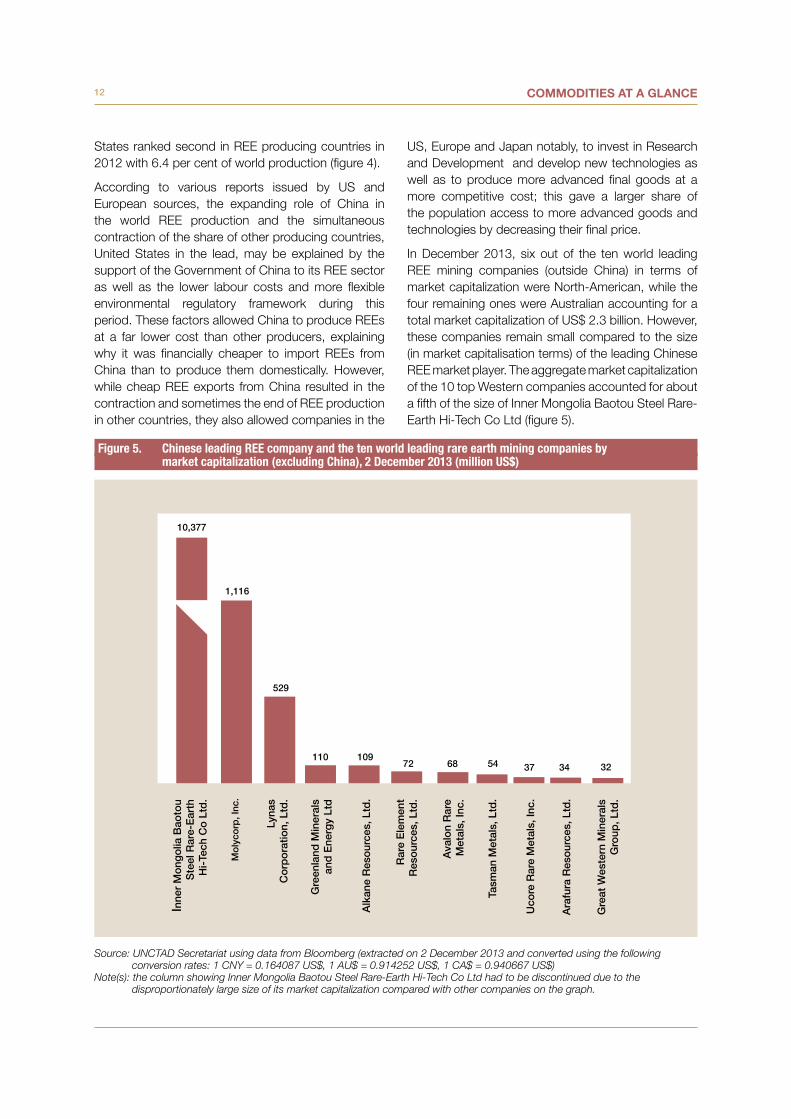
In December 2013, six out of the ten world leading REE mining companies (outside China) in terms of market capitalization were North-American, while the four remaining ones were Australian accounting for a total market capitalization of US$ 2.3 billion. However, these companies remain small compared to the size (in market capitalisation terms) of the leading Chinese REE market player. The aggregate market capitalization of the 10 top Western companies accounted for about a fifth of the size of Inner Mongolia Baotou Steel Rare-Earth Hi-Tech Co Ltd (figure 5).
Inne
r M
ong
olia
Bao
tou
Ste
el R
are-
Ear
thH
i-Te
ch C
o L
td.
Mo
lyco
rp, I
nc.
Lyna
sC
orp
ora
tion,
Ltd
.
Gre
enla
nd M
iner
als
and
Ene
rgy
Ltd
Alk
ane
Res
our
ces,
Ltd
.
Rar
e E
lem
ent
Res
our
ces,
Ltd
.
Ava
lon
Rar
eM
etal
s, In
c.
Tasm
an M
etal
s, L
td.
Uco
re R
are
Met
als,
Inc.
Ara
fura
Res
our
ces,
Ltd
.
Gre
at W
este
rn M
iner
als
Gro
up, L
td.
10,377
1,116
529
110 10972 68 54 37 34 32
Figure 5. ChineseleadingREEcompanyandthetenworldleadingrareearthminingcompaniesby marketcapitalization(excludingChina),2December2013(millionUS$)
Source: UNCTAD Secretariat using data from Bloomberg (extracted on 2 December 2013 and converted using the following conversion rates: 1 CNY = 0.164087 US$, 1 AU$ = 0.914252 US$, 1 CA$ = 0.940667 US$)
Note(s): the column showing Inner Mongolia Baotou Steel Rare-Earth Hi-Tech Co Ltd had to be discontinued due to the disproportionately large size of its market capitalization compared with other companies on the graph.
13RARE EARTH PRODUCTION
For most countries utilizing REEs, the main issue remains the predominant position of China and the potential evolution of its export policy, which casts doubts about the capacity of importing countries to have access to sufficient resources to feed their industries and at a reasonable price. Furthermore, given that China is currently in a process of acquiring more advanced technologies, countries which rely upon China for their imports of REEs also worry about their future capacity to compete with China with regards to the production of REE-related goods, considering that their own production costs may largely depend upon the change in the cost of their inputs.
3. RARE EARTH PRODUCTION IN CHINA
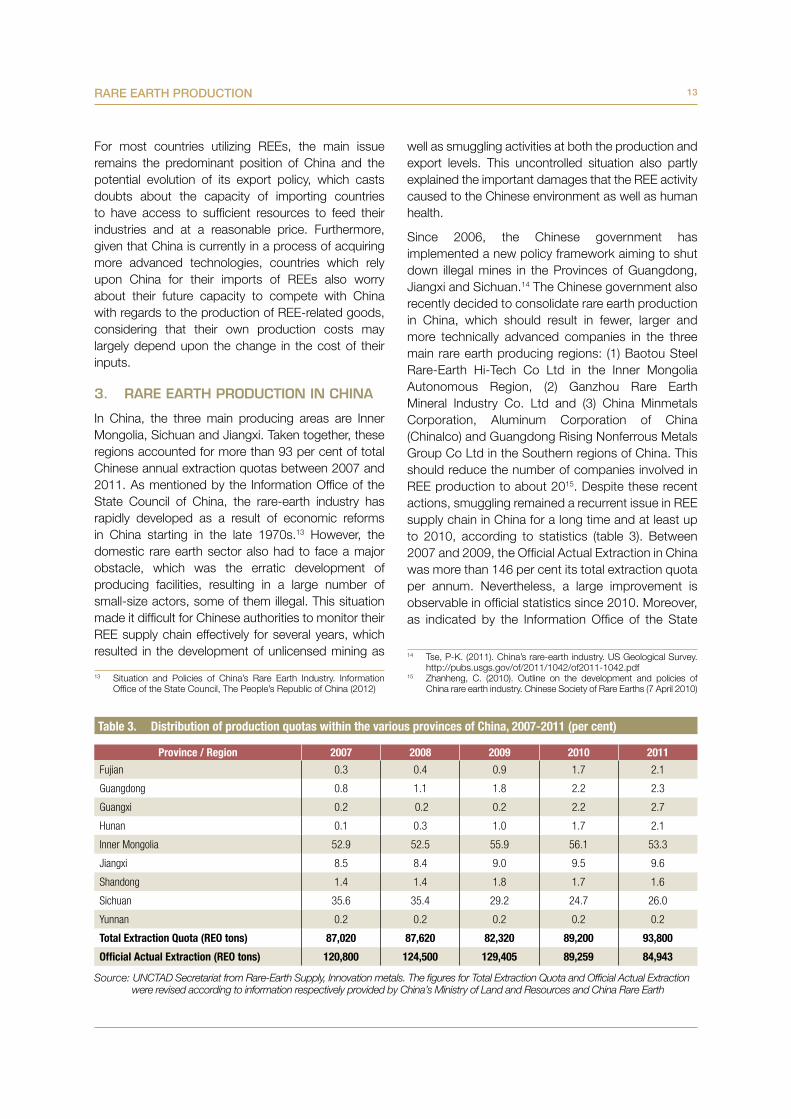
In China, the three main producing areas are Inner Mongolia, Sichuan and Jiangxi. Taken together, these regions accounted for more than 93 per cent of total Chinese annual extraction quotas between 2007 and 2011. As mentioned by the Information Office of the State Council of China, the rare-earth industry has rapidly developed as a result of economic reforms in China starting in the late 1970s.13 However, the domestic rare earth sector also had to face a major obstacle, which was the erratic development of producing facilities, resulting in a large number of small-size actors, some of them illegal. This situation made it difficult for Chinese authorities to monitor their REE supply chain effectively for several years, which resulted in the development of unlicensed mining as
13 Situation and Policies of China’s Rare Earth Industry. Information Office of the State Council, The People’s Republic of China (2012)
well as smuggling activities at both the production and export levels. This uncontrolled situation also partly explained the important damages that the REE activity caused to the Chinese environment as well as human health.
Since 2006, the Chinese government has implemented a new policy framework aiming to shut down illegal mines in the Provinces of Guangdong, Jiangxi and Sichuan.14 The Chinese government also recently decided to consolidate rare earth production in China, which should result in fewer, larger and more technically advanced companies in the three main rare earth producing regions: (1) Baotou Steel Rare-Earth Hi-Tech Co Ltd in the Inner Mongolia Autonomous Region, (2) Ganzhou Rare Earth Mineral Industry Co. Ltd and (3) China Minmetals Corporation, Aluminum Corporation of China (Chinalco) and Guangdong Rising Nonferrous Metals Group Co Ltd in the Southern regions of China. This should reduce the number of companies involved in REE production to about 2015. Despite these recent actions, smuggling remained a recurrent issue in REE supply chain in China for a long time and at least up to 2010, according to statistics (table 3). Between 2007 and 2009, the Official Actual Extraction in China was more than 146 per cent its total extraction quota per annum. Nevertheless, a large improvement is observable in official statistics since 2010. Moreover, as indicated by the Information Office of the State
14 Tse, P-K. (2011). China’s rare-earth industry. US Geological Survey. http://pubs.usgs.gov/of/2011/1042/of2011-1042.pdf
15 Zhanheng, C. (2010). Outline on the development and policies of China rare earth industry. Chinese Society of Rare Earths (7 April 2010)
Province/Region 2007 2008 2009 2010 2011
Fujian 0.3 0.4 0.9 1.7 2.1
Guangdong 0.8 1.1 1.8 2.2 2.3
Guangxi 0.2 0.2 0.2 2.2 2.7
Hunan 0.1 0.3 1.0 1.7 2.1
Inner Mongolia 52.9 52.5 55.9 56.1 53.3
Jiangxi 8.5 8.4 9.0 9.5 9.6
Shandong 1.4 1.4 1.8 1.7 1.6
Sichuan 35.6 35.4 29.2 24.7 26.0
Yunnan 0.2 0.2 0.2 0.2 0.2
TotalExtractionQuota(REOtons) 87,020 87,620 82,320 89,200 93,800
OfficialActualExtraction(REOtons) 120,800 124,500 129,405 89,259 84,943
Table 3. DistributionofproductionquotaswithinthevariousprovincesofChina,2007-2011(percent)
Source: UNCTAD Secretariat from Rare-Earth Supply, Innovation metals. The figures for Total Extraction Quota and Official Actual Extraction were revised according to information respectively provided by China’s Ministry of Land and Resources and China Rare Earth
14 COMMODITIES AT A GLANCE
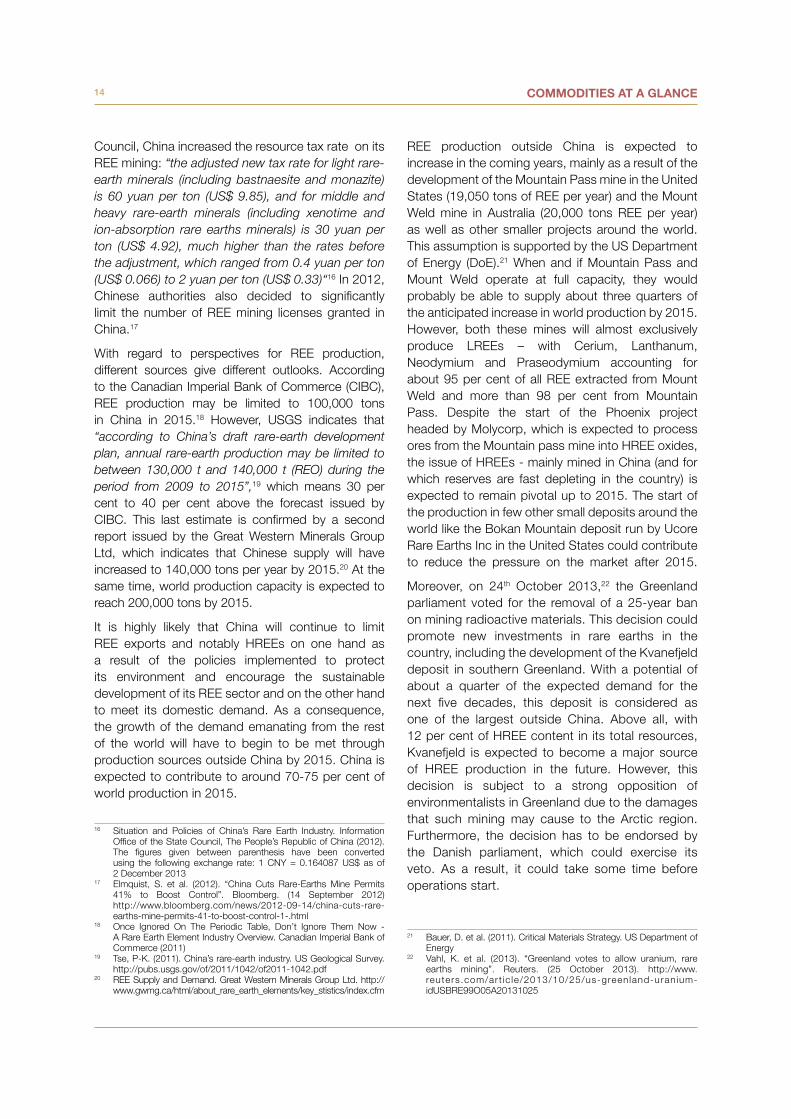
Council, China increased the resource tax rate on its REE mining: “the adjusted new tax rate for light rare-earth minerals (including bastnaesite and monazite) is 60 yuan per ton (US$ 9.85), and for middle and heavy rare-earth minerals (including xenotime and ion-absorption rare earths minerals) is 30 yuan per ton (US$ 4.92), much higher than the rates before the adjustment, which ranged from 0.4 yuan per ton (US$ 0.066) to 2 yuan per ton (US$ 0.33)“16 In 2012, Chinese authorities also decided to significantly limit the number of REE mining licenses granted in China.17
With regard to perspectives for REE production, different sources give different outlooks. According to the Canadian Imperial Bank of Commerce (CIBC), REE production may be limited to 100,000 tons in China in 2015.18 However, USGS indicates that “according to China’s draft rare-earth development plan, annual rare-earth production may be limited to between 130,000 t and 140,000 t (REO) during the period from 2009 to 2015”,19 which means 30 per cent to 40 per cent above the forecast issued by CIBC. This last estimate is confirmed by a second report issued by the Great Western Minerals Group Ltd, which indicates that Chinese supply will have increased to 140,000 tons per year by 2015.20 At the same time, world production capacity is expected to reach 200,000 tons by 2015.
It is highly likely that China will continue to limit REE exports and notably HREEs on one hand as a result of the policies implemented to protect its environment and encourage the sustainable development of its REE sector and on the other hand to meet its domestic demand. As a consequence, the growth of the demand emanating from the rest of the world will have to begin to be met through production sources outside China by 2015. China is expected to contribute to around 70-75 per cent of world production in 2015.
16 Situation and Policies of China’s Rare Earth Industry. Information Office of the State Council, The People’s Republic of China (2012). The figures given between parenthesis have been converted using the following exchange rate: 1 CNY = 0.164087 US$ as of 2 December 2013
17 Elmquist, S. et al. (2012). “China Cuts Rare-Earths Mine Permits 41% to Boost Control”. Bloomberg. (14 September 2012) http://www.bloomberg.com/news/2012-09-14/china-cuts-rare-earths-mine-permits-41-to-boost-control-1-.html
18 Once Ignored On The Periodic Table, Don’t Ignore Them Now - A Rare Earth Element Industry Overview. Canadian Imperial Bank of Commerce (2011)
19 Tse, P-K. (2011). China’s rare-earth industry. US Geological Survey. http://pubs.usgs.gov/of/2011/1042/of2011-1042.pdf
20 REE Supply and Demand. Great Western Minerals Group Ltd. http://www.gwmg.ca/html/about_rare_earth_elements/key_stistics/index.cfm
REE production outside China is expected to increase in the coming years, mainly as a result of the development of the Mountain Pass mine in the United States (19,050 tons of REE per year) and the Mount Weld mine in Australia (20,000 tons REE per year) as well as other smaller projects around the world. This assumption is supported by the US Department of Energy (DoE).21 When and if Mountain Pass and Mount Weld operate at full capacity, they would probably be able to supply about three quarters of the anticipated increase in world production by 2015. However, both these mines will almost exclusively produce LREEs – with Cerium, Lanthanum, Neodymium and Praseodymium accounting for about 95 per cent of all REE extracted from Mount Weld and more than 98 per cent from Mountain Pass. Despite the start of the Phoenix project headed by Molycorp, which is expected to process ores from the Mountain pass mine into HREE oxides, the issue of HREEs - mainly mined in China (and for which reserves are fast depleting in the country) is expected to remain pivotal up to 2015. The start of the production in few other small deposits around the world like the Bokan Mountain deposit run by Ucore Rare Earths Inc in the United States could contribute to reduce the pressure on the market after 2015.
Moreover, on 24th October 2013,22 the Greenland parliament voted for the removal of a 25-year ban on mining radioactive materials. This decision could promote new investments in rare earths in the country, including the development of the Kvanefjeld deposit in southern Greenland. With a potential of about a quarter of the expected demand for the next five decades, this deposit is considered as one of the largest outside China. Above all, with 12 per cent of HREE content in its total resources, Kvanefjeld is expected to become a major source of HREE production in the future. However, this decision is subject to a strong opposition of environmentalists in Greenland due to the damages that such mining may cause to the Arctic region. Furthermore, the decision has to be endorsed by the Danish parliament, which could exercise its veto. As a result, it could take some time before operations start.
21 Bauer, D. et al. (2011). Critical Materials Strategy. US Department of Energy
22 Vahl, K. et al. (2013). “Greenland votes to allow uranium, rare earths mining”. Reuters. (25 October 2013). http://www. reuters .com/ar t ic le/2013/10/25/us-green land-uran ium-idUSBRE99O05A20131025
CHAPTER 3RARE EARTH
DEMAND

17RARE EARTH DEMAND
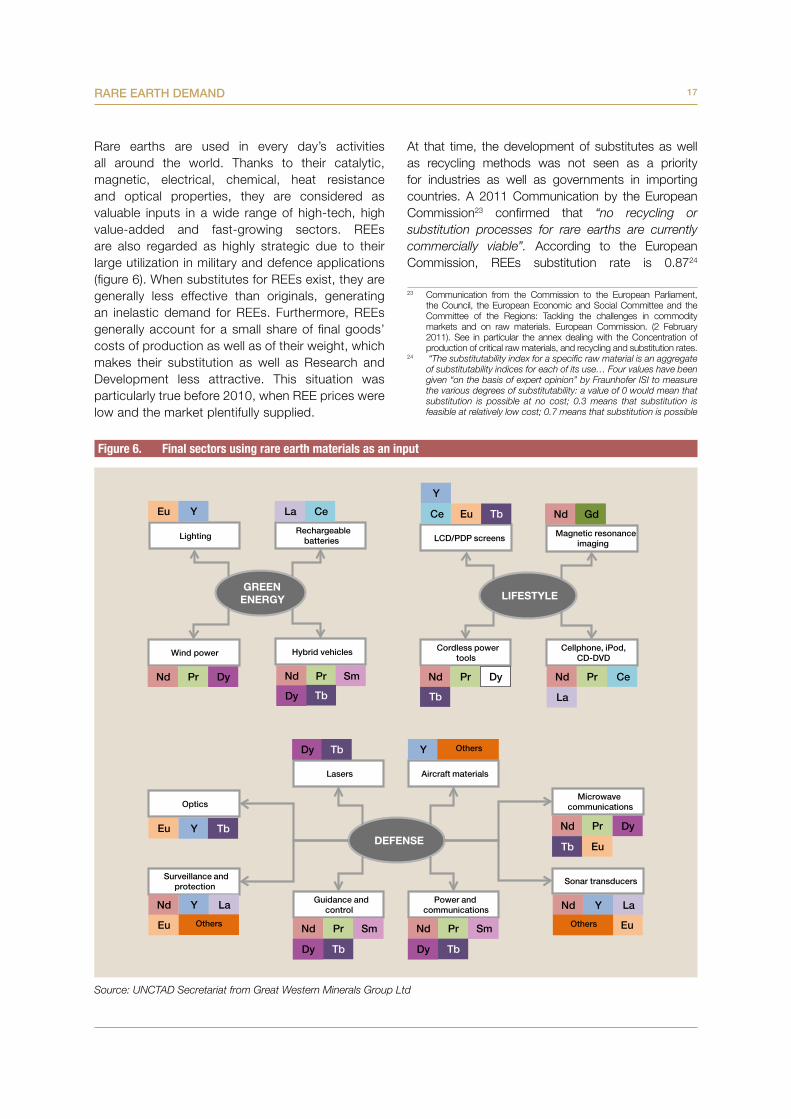
Rare earths are used in every day’s activities all around the world. Thanks to their catalytic, magnetic, electrical, chemical, heat resistance and optical properties, they are considered as valuable inputs in a wide range of high-tech, high value-added and fast-growing sectors. REEs are also regarded as highly strategic due to their large utilization in military and defence applications (figure 6). When substitutes for REEs exist, they are generally less effective than originals, generating an inelastic demand for REEs. Furthermore, REEs generally account for a small share of final goods’ costs of production as well as of their weight, which makes their substitution as well as Research and Development less attractive. This situation was particularly true before 2010, when REE prices were low and the market plentifully supplied.
At that time, the development of substitutes as well as recycling methods was not seen as a priority for industries as well as governments in importing countries. A 2011 Communication by the European Commission23 confirmed that “no recycling or substitution processes for rare earths are currently commercially viable”. According to the European Commission, REEs substitution rate is 0.8724
23 Communication from the Commission to the European Parliament, the Council, the European Economic and Social Committee and the Committee of the Regions: Tackling the challenges in commodity markets and on raw materials. European Commission. (2 February 2011). See in particular the annex dealing with the Concentration of production of critical raw materials, and recycling and substitution rates.
24 “The substitutability index for a specific raw material is an aggregate of substitutability indices for each of its use… Four values have been given “on the basis of expert opinion” by Fraunhofer ISI to measure the various degrees of substitutability: a value of 0 would mean that substitution is possible at no cost; 0.3 means that substitution is feasible at relatively low cost; 0.7 means that substitution is possible
GREEN ENERGY
Rechargeable batteries
La Ce
Hybrid vehicles
PrNd Sm
TbDy
Wind power
PrNd Dy
Lighting
Eu Y
Magnetic resonance imaging
Nd Gd
LCD/PDP screens
Ce Eu Tb
Y
Cordless power tools
Tb
PrNd Dy
Cellphone, iPod,CD-DVD
La
Nd Pr Ce
LIFESTYLE
Lasers
Dy Tb
Guidance and control
Nd Pr Sm
Dy Tb
Power and communications
Nd Pr Sm
Dy Tb
Optics
Eu Y Tb
Surveillance and protection
Nd Y La
OthersEu
Aircraft materials
Y Others
Microwave communications
Nd Pr Dy
Tb Eu
La
Eu
Sonar transducers
Nd Y
Others
DEFENSE
Figure 6. Finalsectorsusingrareearthmaterialsasaninput
Source: UNCTAD Secretariat from Great Western Minerals Group Ltd
18 COMMODITIES AT A GLANCE
Permanent magnets
Battery alloy
Metallurgy excl. batteries
Auto catalysts
Fluid Catalytic Cracking
Polishing powders
Glass additives
Phosphors
Ceramics
69% 23%
5%10% 9%
50% 34% 3%10% 3%
90% 10%
12% 6%12%17%
66% 24% 3% 1%
65% 31% 4%
90% 5% 3% 2%
52% 26% 17% 4%
= 100%
= 100%
= 100%
= 100%
= 98% of total REEsused in this sector.
Lanthanum
Cerium
Praseodymium
Neodymium
Samarium
Europium
= 92% of total REEsused in this sector.
= 24% of total REEsused in this sector.
= 47% of total REEsused in this sector.
= 94% of total REEsused in this sector.
Figure 7. Mainsemi-finalindustriesusingLightRareEarthElements(LREEs)asinputs
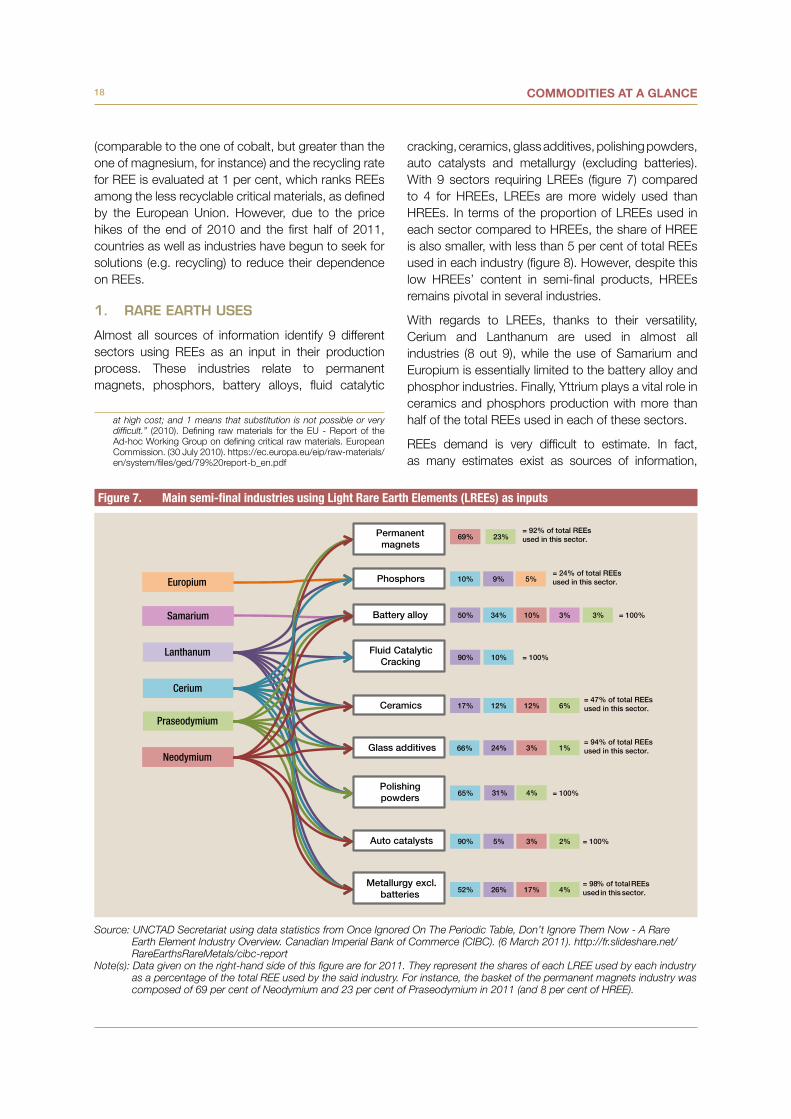
Source: UNCTAD Secretariat using data statistics from Once Ignored On The Periodic Table, Don’t Ignore Them Now - A Rare Earth Element Industry Overview. Canadian Imperial Bank of Commerce (CIBC). (6 March 2011). http://fr.slideshare.net/RareEarthsRareMetals/cibc-report
Note(s): Data given on the right-hand side of this figure are for 2011. They represent the shares of each LREE used by each industry as a percentage of the total REE used by the said industry. For instance, the basket of the permanent magnets industry was composed of 69 per cent of Neodymium and 23 per cent of Praseodymium in 2011 (and 8 per cent of HREE).
(comparable to the one of cobalt, but greater than the one of magnesium, for instance) and the recycling rate for REE is evaluated at 1 per cent, which ranks REEs among the less recyclable critical materials, as defined by the European Union. However, due to the price hikes of the end of 2010 and the first half of 2011, countries as well as industries have begun to seek for solutions (e.g. recycling) to reduce their dependence on REEs.
1. RARE EARTH USES
Almost all sources of information identify 9 different sectors using REEs as an input in their production process. These industries relate to permanent magnets, phosphors, battery alloys, fluid catalytic
at high cost; and 1 means that substitution is not possible or very difficult.” (2010). Defining raw materials for the EU - Report of the Ad-hoc Working Group on defining critical raw materials. European Commission. (30 July 2010). https://ec.europa.eu/eip/raw-materials/en/system/files/ged/79%20report-b_en.pdf
cracking, ceramics, glass additives, polishing powders, auto catalysts and metallurgy (excluding batteries). With 9 sectors requiring LREEs (figure 7) compared to 4 for HREEs, LREEs are more widely used than HREEs. In terms of the proportion of LREEs used in each sector compared to HREEs, the share of HREE is also smaller, with less than 5 per cent of total REEs used in each industry (figure 8). However, despite this low HREEs’ content in semi-final products, HREEs remains pivotal in several industries.
With regards to LREEs, thanks to their versatility, Cerium and Lanthanum are used in almost all industries (8 out 9), while the use of Samarium and Europium is essentially limited to the battery alloy and phosphor industries. Finally, Yttrium plays a vital role in ceramics and phosphors production with more than half of the total REEs used in each of these sectors.
REEs demand is very difficult to estimate. In fact, as many estimates exist as sources of information,
19RARE EARTH DEMAND
Permanent magnets
Glass additives
Phosphors
Ceramics
2%5%
53%
2%5%69%
2% 4%
1%
Others*
Gadolinium
Terbium
Dysprosium
Yttrium
= 8% of total REEsused in this sector.
= 53% of total REEsused in this sector.
= 76% of total REEsused in this sector.
= 6% of total REEsused in this sector.
Figure 8. Mainsemi-finalindustriesusingHeavyRareEarthElements(HREEs),plusScandiumandYttriumasinputs
Source: UNCTAD Secretariat using data statistics from Once Ignored On The Periodic Table, Don’t Ignore Them Now - A Rare Earth Element Industry Overview. Canadian Imperial Bank of Commerce (CIBC). (6 March 2011). http://fr.slideshare.net/RareEarthsRareMetals/cibc-report
Note(s): Data given on the right-hand side of this figure are for 2011 and represent the shares of each HREE used by each industry as a percentage of the total REE used by the said industry. For instance, the basket of the permanent magnets industry was composed of 5 per cent of Dysprosium, 2 per cent of Gadolinium and 1 per cent of Terbium in 2011 (and 92 per cent of LREE). Promethium, Holmium, Erbium, Thulium, Ytterbium, Lutetium and Scandium are included in the «others» category.
probably given the highly strategic nature as well as the narrowness of the REE market in terms of quantity. However, it is clear that REEs demand has significantly increased since the mid-1990s with an acceleration between 2002 and 2010, reaching a maximum of about 134,000 tons in 2010. The yearly growth rate during this period was about 10 per cent. More recently, in 2011 and 2012, REE demand tended to contract slightly as a result of the very high price levels from the end of 2010 to the mid-2011 as well as limited economic growth.
From a general point of view, REE demand is expected to continue to rise in the coming years and reach 200,000-240,000 tons in 2020.25 The growth of the world population, notably within the BRICS (Brazil, Russian Federation, India, China and South Africa) and the improvement of the standards of living in these countries, combined with factors more specific to increasing needs in end-use markets support this forecast increase.
2. COUNTRIES LIKELY TO SUPPORT RARE EARTH DEMAND
According to UN estimates, the world population is expected to reach 7.7 billion people in 2020 and further to 8.3 billion people in 2030, compared to 7 billion people in 2012. In 2030, a large majority
25 Lifton, J. (2013). “Counterpoint: Supply and Demand in the Rare-Earths Market 2015-2020”. Technology Metals Research. (1 August 2013). http://www.techmetalsresearch.com/2013/08/counterpoint-supply-and-demand-in-the-rare-earths-market-2015-2020/
of the world population will be living in developing countries (83 per cent) and about half of them within the BRICS.
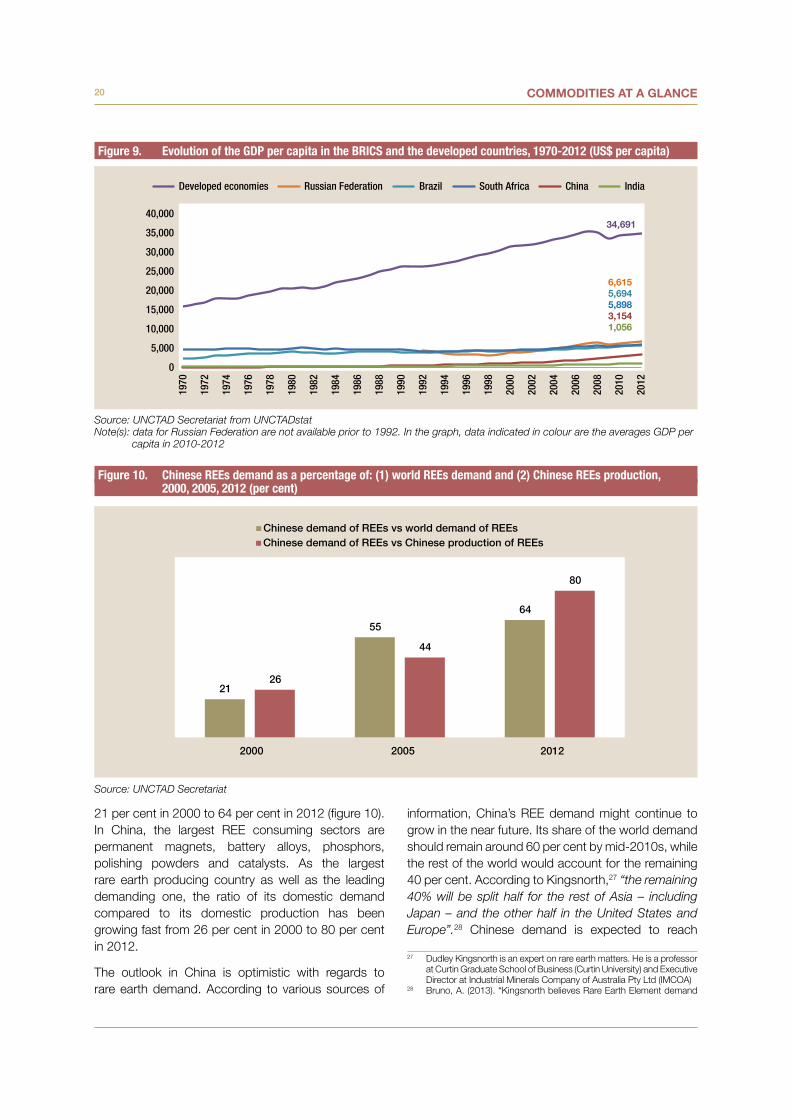
At the same time, the standard of living of the world population increased regularly since the 1970s. Over the period 2000-2012, the world GDP per capita increased by an average 2.7 per cent per year, as a result of the large growth rates recorded within the BRICS (GDP per capita increased by 109 per cent on average between 2000 and 2012 in this group of countries). More recently, over the 2010-2012 period, GDP and GDP per capita in the BRICS increased more than 50 per cent compared to their average level in the 2000s. Despite this large rise, the 2010-2012 average GDP per capita in these countries has remained low. For example, GDP per capita in the Russian Federation is about 20 per cent the one in developed countries and in India, GDP per capita is roughly 3 per cent of the one in developed countries.26 This large gap as well as the rapid expansion of this indicator in these countries since the beginning of the 2000s give good prospects for further improvements, which could finally allow these countries to catch up with the average standard of living in developed countries (figure 9).
The largest REEs consuming country has historically been China. Its share in world REE demand has been increasing since the beginning of the 2000s, from
26 Developed countries list as defined by UNCTAD, extracted November 2013
20 COMMODITIES AT A GLANCE
21 per cent in 2000 to 64 per cent in 2012 (figure 10). In China, the largest REE consuming sectors are permanent magnets, battery alloys, phosphors, polishing powders and catalysts. As the largest rare earth producing country as well as the leading demanding one, the ratio of its domestic demand compared to its domestic production has been growing fast from 26 per cent in 2000 to 80 per cent in 2012.
The outlook in China is optimistic with regards to rare earth demand. According to various sources of
information, China’s REE demand might continue to grow in the near future. Its share of the world demand should remain around 60 per cent by mid-2010s, while the rest of the world would account for the remaining 40 per cent. According to Kingsnorth,27 “the remaining 40% will be split half for the rest of Asia – including Japan – and the other half in the United States and Europe”.28 Chinese demand is expected to reach
27 Dudley Kingsnorth is an expert on rare earth matters. He is a professor at Curtin Graduate School of Business (Curtin University) and Executive Director at Industrial Minerals Company of Australia Pty Ltd (IMCOA)
28 Bruno, A. (2013). “Kingsnorth believes Rare Earth Element demand
0
5,000
10,000
15,000
20,000
25,000
30,000
35,000
40,000
1970
1972
1974
1976
1978
1980
1982
1984
1986
1988
1990
1992
1994
1996
1998
2000
2002
2004
2006
2008
2010
2012
Developed economies Russian Federation Brazil South Africa China India
6,6155,6945,8983,1541,056
34,691
21
55
64
26
44
80
2000 2005 2012
Chinese demand of REEs vs world demand of REEsChinese demand of REEs vs Chinese production of REEs
Figure 9. EvolutionoftheGDPpercapitaintheBRICSandthedevelopedcountries,1970-2012(US$percapita)
Figure 10. ChineseREEsdemandasapercentageof:(1)worldREEsdemandand(2)ChineseREEsproduction, 2000,2005,2012(percent)
Source: UNCTAD Secretariat from UNCTADstatNote(s): data for Russian Federation are not available prior to 1992. In the graph, data indicated in colour are the averages GDP per
capita in 2010-2012
Source: UNCTAD Secretariat
21RARE EARTH DEMAND
70 per cent of world REEs demand by 2020. This is underscored by general factors including the growth of the Chinese population (+79 million inhabitants by 2020 – about the total population of Egypt today), combined with the expected increase in its standard of living, which remains in 2012, less than 13 per cent the average of developed countries. In addition, the policies pursued by China to attract a higher share of value-added in high-tech industries within the country, and the increase of the share of green energy sources in its energy mix may contribute to the rise of the demand for rare earth by the end of the decade.
Within the framework of its energy development plan issued in January 2013, China aims to reduce CO2 emissions and to green its economy. It plans to gradually reduce the contribution of coal (as well as other fossil fuel energy sources) in its total primary energy demand. In China, coal accounted for 68 per cent of all fuel consumed in 2012. Coal is also the main energy source in power generation in China, accounting for 79 per cent of the total in 2011, about “as much coal as the rest of the world combined”.29 This share is expected to contract to 65 per cent by 2017 and to 55 per cent by 2035. Renewable energies and wind power in particular are expected to benefit from that and their contribution should gradually increase up to 2035, when it could reach about 10 per cent of total power generation in China. Moreover, as a means of daily transport, two-wheel vehicles (e-bicycles, e-scooters and e-motorbikes) are widely spread throughout Asia and China in particular. As a result of the implementation of more drastic environmental policies and the development of the middle-class, the electric two-wheel vehicle market is expected to expand significantly in China. According to PikeResearch,30 this market could increase by a compounded annual growth rate of 6.6 per cent and reach more than 65 million units by 2018. The anticipated changes in both the energy and the transportation sectors are expected to contribute to the expansion of Chinese demand of REEs in the future.
The potential increase of the Chinese demand combined with the current re-organization of its domestic supply chain raise concerns about the possibility (or not) for China to meet its internal demand through its domestic production by 2015, which may lead the country to become a net importer of rare earths in the short run instead of a net exporter,
and prices to increase”. investorintel.com. (26 July 2013) http://investorintel.com/rare-earth-intel/dudley-kingsnorth-believes-that-ree-demand-and-prices-will-double-by-2015/
29 World Energy Outlook 2013. International Energy Agency (2013)30 Bae, H. et al. (2012). Electric Two-Wheel Vehicles in Asia Pacific,
Executive summary. PikeResearch
as it is today. This situation may have a direct impact on the availability of REEs on the international market as well as on international prices, especially for REE net-importing countries.
Apart from China, the other main consuming areas are Japan and the Asian region, with just less than 20 per cent of REE consumed worldwide, the United States with about 10 per cent and the rest of the world (European Union in the lead) for the difference. In these areas, where REE production was not a priority for many years due to low REE prices, the contraction of Chinese exports quotas as well as the jump of REE prices in 2010-2011 generated some threats of shortages and encouraged some countries to develop or re-start their own production and processing capacities. Australia and the United States are good examples in this regard.
3. SECTORS LIKELY TO AFFECT RARE EARTH DEMAND
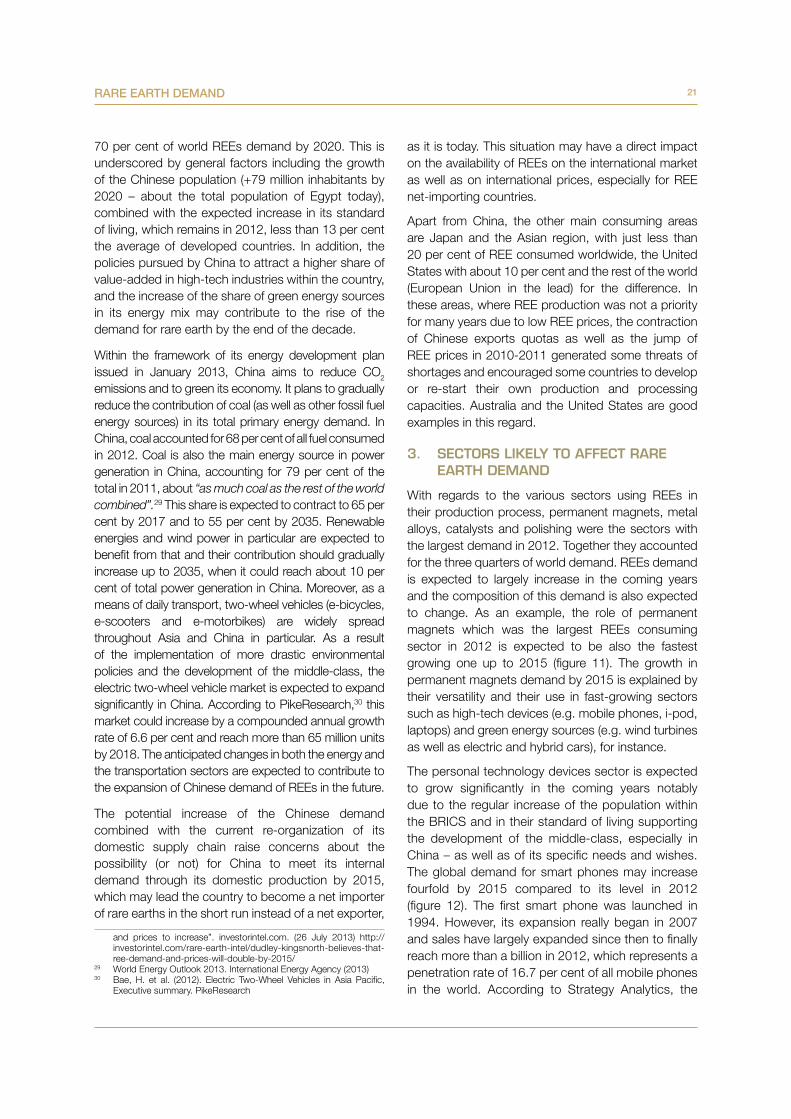
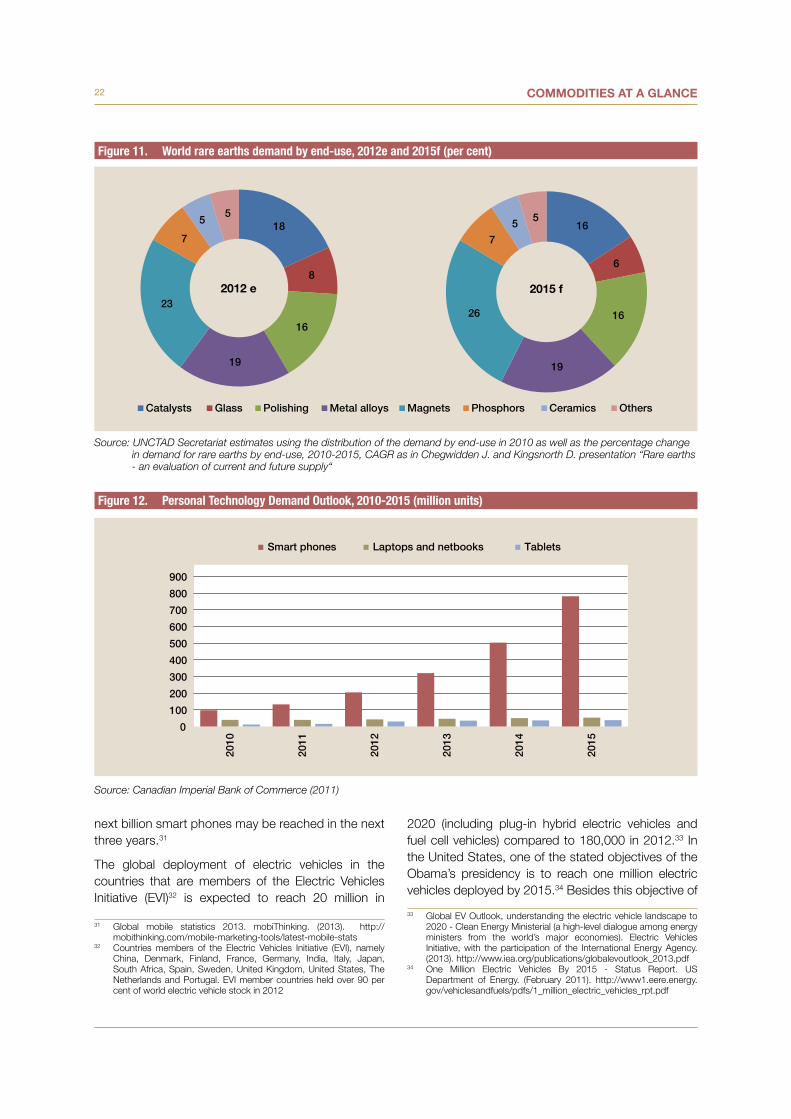
With regards to the various sectors using REEs in their production process, permanent magnets, metal alloys, catalysts and polishing were the sectors with the largest demand in 2012. Together they accounted for the three quarters of world demand. REEs demand is expected to largely increase in the coming years and the composition of this demand is also expected to change. As an example, the role of permanent magnets which was the largest REEs consuming sector in 2012 is expected to be also the fastest growing one up to 2015 (figure 11). The growth in permanent magnets demand by 2015 is explained by their versatility and their use in fast-growing sectors such as high-tech devices (e.g. mobile phones, i-pod, laptops) and green energy sources (e.g. wind turbines as well as electric and hybrid cars), for instance.
The personal technology devices sector is expected to grow significantly in the coming years notably due to the regular increase of the population within the BRICS and in their standard of living supporting the development of the middle-class, especially in China – as well as of its specific needs and wishes. The global demand for smart phones may increase fourfold by 2015 compared to its level in 2012 (figure 12). The first smart phone was launched in 1994. However, its expansion really began in 2007 and sales have largely expanded since then to finally reach more than a billion in 2012, which represents a penetration rate of 16.7 per cent of all mobile phones in the world. According to Strategy Analytics, the
22 COMMODITIES AT A GLANCE
next billion smart phones may be reached in the next three years.31
The global deployment of electric vehicles in the countries that are members of the Electric Vehicles Initiative (EVI)32 is expected to reach 20 million in
31 Global mobile statistics 2013. mobiThinking. (2013). http://mobithinking.com/mobile-marketing-tools/latest-mobile-stats
32 Countries members of the Electric Vehicles Initiative (EVI), namely China, Denmark, Finland, France, Germany, India, Italy, Japan, South Africa, Spain, Sweden, United Kingdom, United States, The Netherlands and Portugal. EVI member countries held over 90 per cent of world electric vehicle stock in 2012
2020 (including plug-in hybrid electric vehicles and fuel cell vehicles) compared to 180,000 in 2012.33 In the United States, one of the stated objectives of the Obama’s presidency is to reach one million electric vehicles deployed by 2015.34 Besides this objective of
33 Global EV Outlook, understanding the electric vehicle landscape to 2020 - Clean Energy Ministerial (a high-level dialogue among energy ministers from the world’s major economies). Electric Vehicles Initiative, with the participation of the International Energy Agency. (2013). http://www.iea.org/publications/globalevoutlook_2013.pdf
34 One Million Electric Vehicles By 2015 - Status Report. US Department of Energy. (February 2011). http://www1.eere.energy.gov/vehiclesandfuels/pdfs/1_million_electric_vehicles_rpt.pdf
0
100
200
300
400
500
600
700
800
900
2010
2011
2012
2013
2014
2015
Smart phones Laptops and netbooks Tablets
Figure 12. PersonalTechnologyDemandOutlook,2010-2015(millionunits)
Source: Canadian Imperial Bank of Commerce (2011)
16
6
16
19
26
7
5 5
2015 f
18
8
16
19
23
7
55
Catalysts Glass Polishing Metal alloys Magnets Phosphors Ceramics Others
2012 e
Figure 11. Worldrareearthsdemandbyend-use,2012eand2015f(percent)
Source: UNCTAD Secretariat estimates using the distribution of the demand by end-use in 2010 as well as the percentage change in demand for rare earths by end-use, 2010-2015, CAGR as in Chegwidden J. and Kingsnorth D. presentation “Rare earths - an evaluation of current and future supply“
23RARE EARTH DEMAND
an increasing number of electric vehicles, the value of REE inputs in the automotive sector is also supposed to continue to rise in the future. These arguments may contribute to push demand for permanent magnets and specific REEs entering into their production process up by the end of the decade.
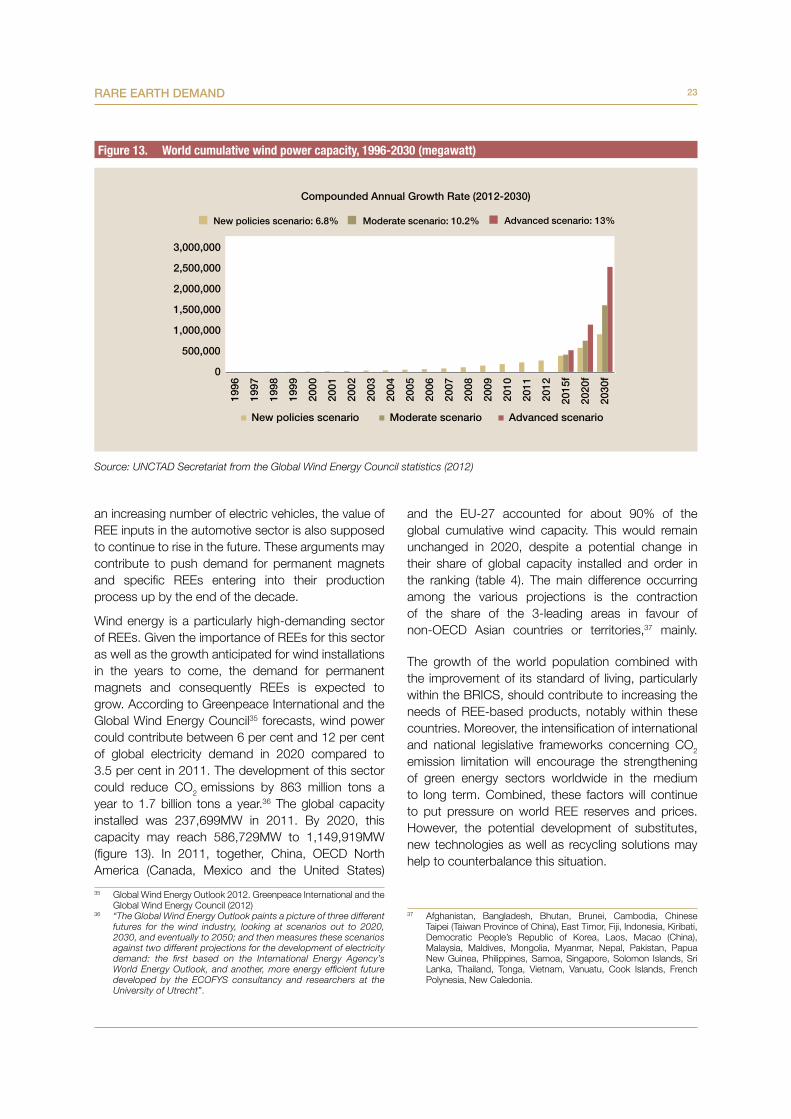
Wind energy is a particularly high-demanding sector of REEs. Given the importance of REEs for this sector as well as the growth anticipated for wind installations in the years to come, the demand for permanent magnets and consequently REEs is expected to grow. According to Greenpeace International and the Global Wind Energy Council35 forecasts, wind power could contribute between 6 per cent and 12 per cent of global electricity demand in 2020 compared to 3.5 per cent in 2011. The development of this sector could reduce CO2 emissions by 863 million tons a year to 1.7 billion tons a year.36 The global capacity installed was 237,699MW in 2011. By 2020, this capacity may reach 586,729MW to 1,149,919MW (figure 13). In 2011, together, China, OECD North America (Canada, Mexico and the United States)
35 Global Wind Energy Outlook 2012. Greenpeace International and the Global Wind Energy Council (2012)
36 “The Global Wind Energy Outlook paints a picture of three different futures for the wind industry, looking at scenarios out to 2020, 2030, and eventually to 2050; and then measures these scenarios against two different projections for the development of electricity demand: the first based on the International Energy Agency’s World Energy Outlook, and another, more energy efficient future developed by the ECOFYS consultancy and researchers at the University of Utrecht”.
0
500,000
1,000,000
1,500,000
2,000,000
2,500,000
3,000,00019
96
1997
1998
1999
2000
2001
2002
2003
2004
2005
2006
2007
2008
2009
2010
2011
2012
2015
f
2020
f
2030
f
New policies scenario Moderate scenario Advanced scenario
Compounded Annual Growth Rate (2012-2030)
New policies scenario: 6.8% Moderate scenario: 10.2% Advanced scenario: 13%
Figure 13. Worldcumulativewindpowercapacity,1996-2030(megawatt)
Source: UNCTAD Secretariat from the Global Wind Energy Council statistics (2012)
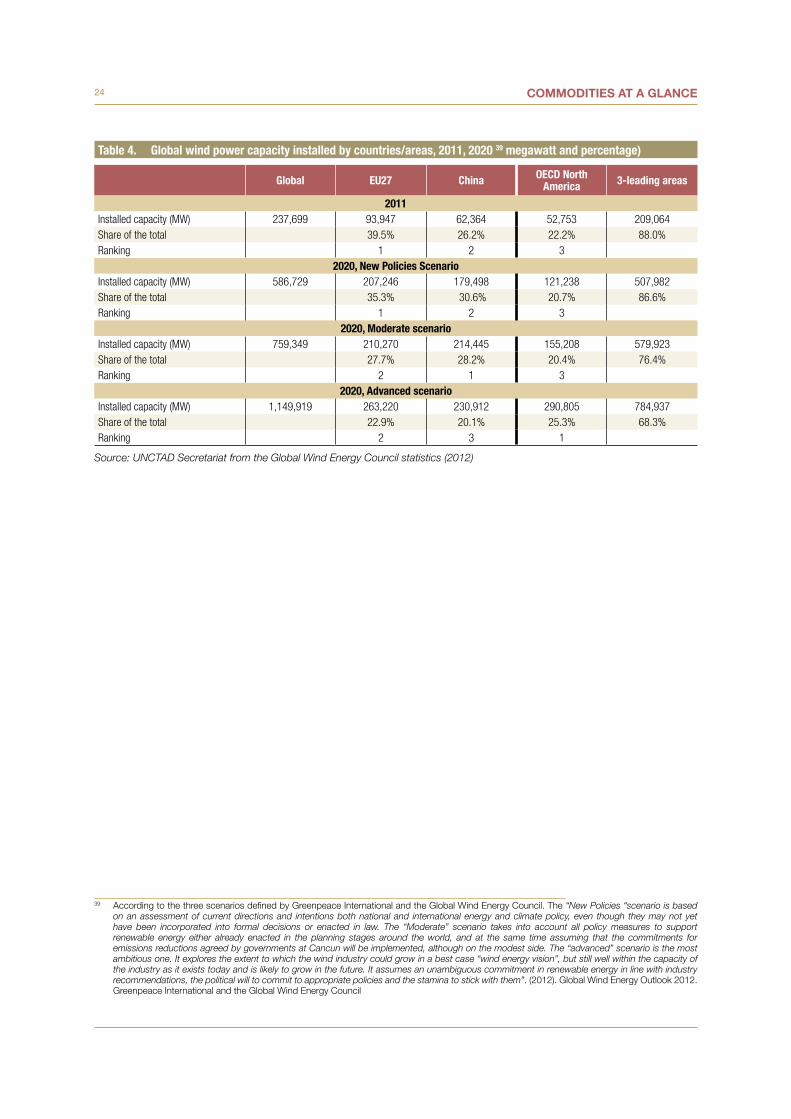
and the EU-27 accounted for about 90% of the global cumulative wind capacity. This would remain unchanged in 2020, despite a potential change in their share of global capacity installed and order in the ranking (table 4). The main difference occurring among the various projections is the contraction of the share of the 3-leading areas in favour of non-OECD Asian countries or territories,37 mainly.
The growth of the world population combined with the improvement of its standard of living, particularly within the BRICS, should contribute to increasing the needs of REE-based products, notably within these countries. Moreover, the intensification of international and national legislative frameworks concerning CO2 emission limitation will encourage the strengthening of green energy sectors worldwide in the medium to long term. Combined, these factors will continue to put pressure on world REE reserves and prices. However, the potential development of substitutes, new technologies as well as recycling solutions may help to counterbalance this situation.
37 Afghanistan, Bangladesh, Bhutan, Brunei, Cambodia, Chinese Taipei (Taiwan Province of China), East Timor, Fiji, Indonesia, Kiribati, Democratic People’s Republic of Korea, Laos, Macao (China), Malaysia, Maldives, Mongolia, Myanmar, Nepal, Pakistan, Papua New Guinea, Philippines, Samoa, Singapore, Solomon Islands, Sri Lanka, Thailand, Tonga, Vietnam, Vanuatu, Cook Islands, French Polynesia, New Caledonia.
24 COMMODITIES AT A GLANCE
Global EU27 China OECDNorthAmerica 3-leadingareas
2011Installed capacity (MW) 237,699 93,947 62,364 52,753 209,064Share of the total 39.5% 26.2% 22.2% 88.0%Ranking 1 2 3
2020,NewPoliciesScenarioInstalled capacity (MW) 586,729 207,246 179,498 121,238 507,982Share of the total 35.3% 30.6% 20.7% 86.6%Ranking 1 2 3
2020,ModeratescenarioInstalled capacity (MW) 759,349 210,270 214,445 155,208 579,923Share of the total 27.7% 28.2% 20.4% 76.4%Ranking 2 1 3
2020,AdvancedscenarioInstalled capacity (MW) 1,149,919 263,220 230,912 290,805 784,937Share of the total 22.9% 20.1% 25.3% 68.3%Ranking 2 3 1
Table 4. Globalwindpowercapacityinstalledbycountries/areas,2011,2020 39megawattandpercentage)
Source: UNCTAD Secretariat from the Global Wind Energy Council statistics (2012)
1
39 According to the three scenarios defined by Greenpeace International and the Global Wind Energy Council. The “New Policies “scenario is based on an assessment of current directions and intentions both national and international energy and climate policy, even though they may not yet have been incorporated into formal decisions or enacted in law. The “Moderate” scenario takes into account all policy measures to support renewable energy either already enacted in the planning stages around the world, and at the same time assuming that the commitments for emissions reductions agreed by governments at Cancun will be implemented, although on the modest side. The “advanced” scenario is the most ambitious one. It explores the extent to which the wind industry could grow in a best case “wind energy vision”, but still well within the capacity of the industry as it exists today and is likely to grow in the future. It assumes an unambiguous commitment in renewable energy in line with industry recommendations, the political will to commit to appropriate policies and the stamina to stick with them”. (2012). Global Wind Energy Outlook 2012. Greenpeace International and the Global Wind Energy Council
CHAPTER 4RARE EARTH
PRICES

27RARE EARTH PRICES
Rare earths are not traded or even quoted on international commodity exchanges. As a consequence, the price discovery mechanism appears to be less “transparent” as for some other commodity markets (e.g. cocoa, crude oil, copper). Furthermore, the oligopolistic nature of this market also creates uncertainties with regards to the availability of REEs as well as their future prices. Moreover, the lack of reliable international statistics on REEs’ trade does not help to improve such a situation and increase the transparency of price formation.
With the purpose of enhancing the transparency of the price discovery mechanism, China planned to implement the first market place dealing with rare earth products – The Baotou Rare Earth Products Exchange – in October 2013. According to China Daily, this exchange is an initiative from Baotou Steel Rare-Earth Hi-Tech Co Ltd (the leading Chinese and world REE producing company) and the trading platform has been registered with 11 other major rare-earth companies with a capital standing at 120 million Yuan (US$ 19.5 million).39 According to Gu Ming, general manager of the Baotou Rare Earth Products Exchange, the exchange aims to strengthen the links among the different REE producing regions, enhance price transparency, adjust long-term market balance and stabilize the market.40 At the time of writing, little information about the exchange is known.41 Furthermore, it would be interesting to know the list of products which will be traded and quoted on the market (commodities, semi-final goods, final products). The exchange is supposed to begin with spot and forward trading, but futures trading may come later.
As a disclaimer, UNCTAD would like to indicate that given that no public or private authoritative source of information exists in regard to REE prices as such, the trends given below are indicative and mainly derived from the analysis of spot prices.
As may be observed from the various sources of information, HREEs generally record higher prices than LREEs due to their higher scarcity. HREEs prices also appear to be more volatile than LREEs, for the same reason.
39 Juan, D. (2013). “First rare-earth products exchange to help stabilize market”. China Daily. (10 August 2013). http://usa.chinadaily.com.cn/business/2013-08/10/content_16884782.htm
40 Kosich, D. (2013). “China to begin trial run of rare earth products exchange”. mineweb.com. (12 August 2013). http://www.mineweb.com/mineweb/content/en/mineweb-industrial-metals-minerals-old?oid=200612&sn=Detail
41 “China starts trial run of rare earth products exchange”. CCTV.com. (8 November 2013). http://english.cntv.cn/program/newshour/ 20131108/103194.shtml
BOX 2 “Molycorp now mixes half as much dysprosium into its magnetic powders as it did even a year ago”
“The global oil industry has similarly begun using less lanthanum, another rare earth, during oil refining. Only 1.5 per cent of the latest catalyst formulations for oil refining are now lanthanum, down from 4 or 5 per cent three years ago”Bradsher, K. (2013)
Historically, REE prices remained relatively unchanged from 2001 to 2009, but dramatically rose between the end of 2010 and mid-2011, notably as a result of the contraction of Chinese REE exports and the anticipation of possible market shortages. The year 2011 recorded the highest prices, historically, particularly at the beginning to mid-2011, especially with regards to HREEs. Thereafter and throughout 2012, prices declined sharply. LREEs were particularly hit during this second period. This downward move of REE prices can be explained by multiple factors. First, due to the surge of REEs prices in 2011, new supply capacities started to be developed worldwide in order to reduce dependence on Chinese exports (e.g. resumption of domestic REEs production in the United States). Second, the sluggish economic situation further dampened REE demand worldwide and was further accentuated by the reduction of activity resulting from the tsunami in Japan in March 2011. Third, REE demand also tended to contract as a result of end-users making efforts to use more efficiently available REE quantities (Box 2) and draw on their stocks.
During the first half of 2013, REE prices remained subdued. However, over the summer, prices firmed up again, partly due to a decrease of quantities available for exports as a result of the crackdown on illegal REE mines in China, the temporary shutdowns of processing plants and the actions carried out by the Chinese government against smuggling (“from 2006 to 2008, the volumes of rare earth products imported from China, according to statistics collected from foreign customs, were 35 %, 59% and 36% higher than the volumes exported”).42 In consonance with this policy, the Chinese government initiated a 3-month campaign (15 August - 15 November 2013) aiming to “reduce illegal exploration, production and
42 Situation and Policies of China’s Rare Earth Industry. Information Office of the State Council, The People’s Republic of China (2012)
28 COMMODITIES AT A GLANCE
distribution of rare earth metals and regulate rare earth recycling companies”.43 REE prices are expected to globally increase in the medium-term.
1. THE INFLUENCE OF CHINA IN RARE EARTH PRICE FORMATION
Given its scale, the jump of REE prices from the end of 2010 to mid-2011 compared to their level since the beginning of the 2000s deserves further clarification.
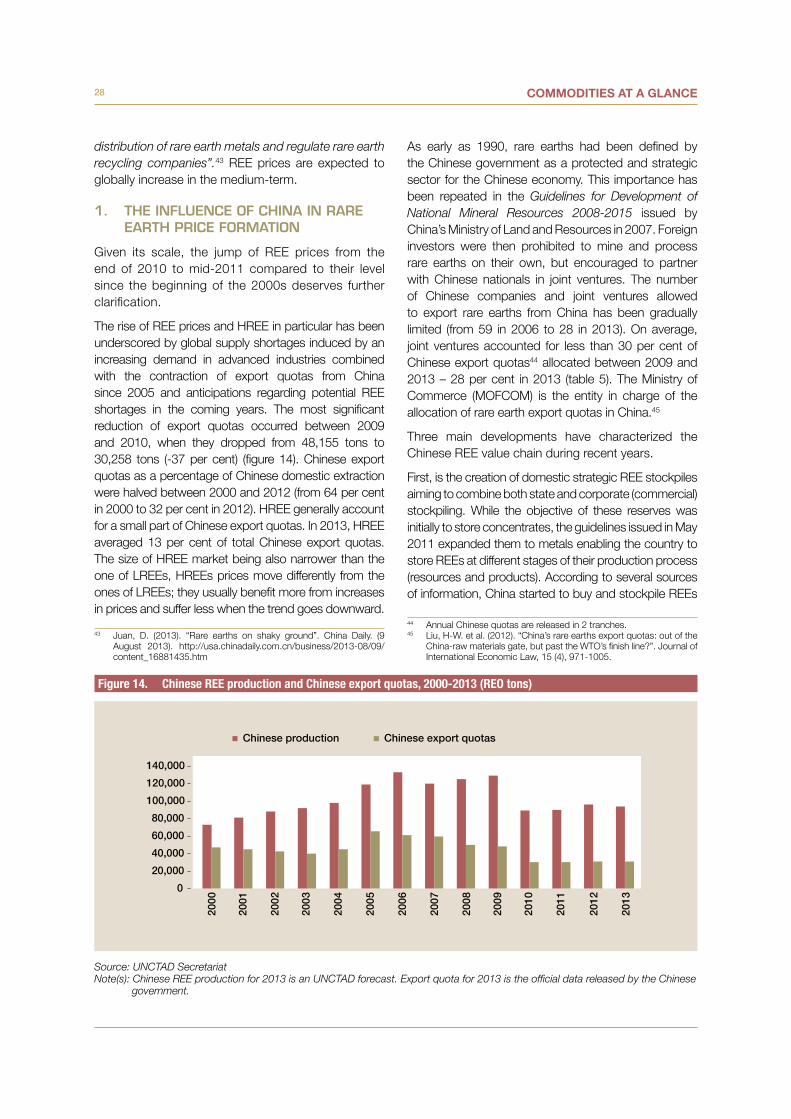
The rise of REE prices and HREE in particular has been underscored by global supply shortages induced by an increasing demand in advanced industries combined with the contraction of export quotas from China since 2005 and anticipations regarding potential REE shortages in the coming years. The most significant reduction of export quotas occurred between 2009 and 2010, when they dropped from 48,155 tons to 30,258 tons (-37 per cent) (figure 14). Chinese export quotas as a percentage of Chinese domestic extraction were halved between 2000 and 2012 (from 64 per cent in 2000 to 32 per cent in 2012). HREE generally account for a small part of Chinese export quotas. In 2013, HREE averaged 13 per cent of total Chinese export quotas. The size of HREE market being also narrower than the one of LREEs, HREEs prices move differently from the ones of LREEs; they usually benefit more from increases in prices and suffer less when the trend goes downward.
43 Juan, D. (2013). “Rare earths on shaky ground”. China Daily. (9 August 2013). http://usa.chinadaily.com.cn/business/2013-08/09/content_16881435.htm
As early as 1990, rare earths had been defined by the Chinese government as a protected and strategic sector for the Chinese economy. This importance has been repeated in the Guidelines for Development of National Mineral Resources 2008-2015 issued by China’s Ministry of Land and Resources in 2007. Foreign investors were then prohibited to mine and process rare earths on their own, but encouraged to partner with Chinese nationals in joint ventures. The number of Chinese companies and joint ventures allowed to export rare earths from China has been gradually limited (from 59 in 2006 to 28 in 2013). On average, joint ventures accounted for less than 30 per cent of Chinese export quotas44 allocated between 2009 and 2013 – 28 per cent in 2013 (table 5). The Ministry of Commerce (MOFCOM) is the entity in charge of the allocation of rare earth export quotas in China.45
Three main developments have characterized the Chinese REE value chain during recent years.
First, is the creation of domestic strategic REE stockpiles aiming to combine both state and corporate (commercial) stockpiling. While the objective of these reserves was initially to store concentrates, the guidelines issued in May 2011 expanded them to metals enabling the country to store REEs at different stages of their production process (resources and products). According to several sources of information, China started to buy and stockpile REEs
44 Annual Chinese quotas are released in 2 tranches.45 Liu, H-W. et al. (2012). “China’s rare earths export quotas: out of the
China-raw materials gate, but past the WTO’s finish line?”. Journal of International Economic Law, 15 (4), 971-1005.
0
20,000
40,000
60,000
80,000
100,000
120,000
140,000
2000
2001
2002
2003
2004
2005
2006
2007
2008
2009
2010
2011
2012
2013
Chinese production Chinese export quotas
Figure 14. ChineseREEproductionandChineseexportquotas,2000-2013(REOtons)
Source: UNCTAD SecretariatNote(s): Chinese REE production for 2013 is an UNCTAD forecast. Export quota for 2013 is the official data released by the Chinese
government.
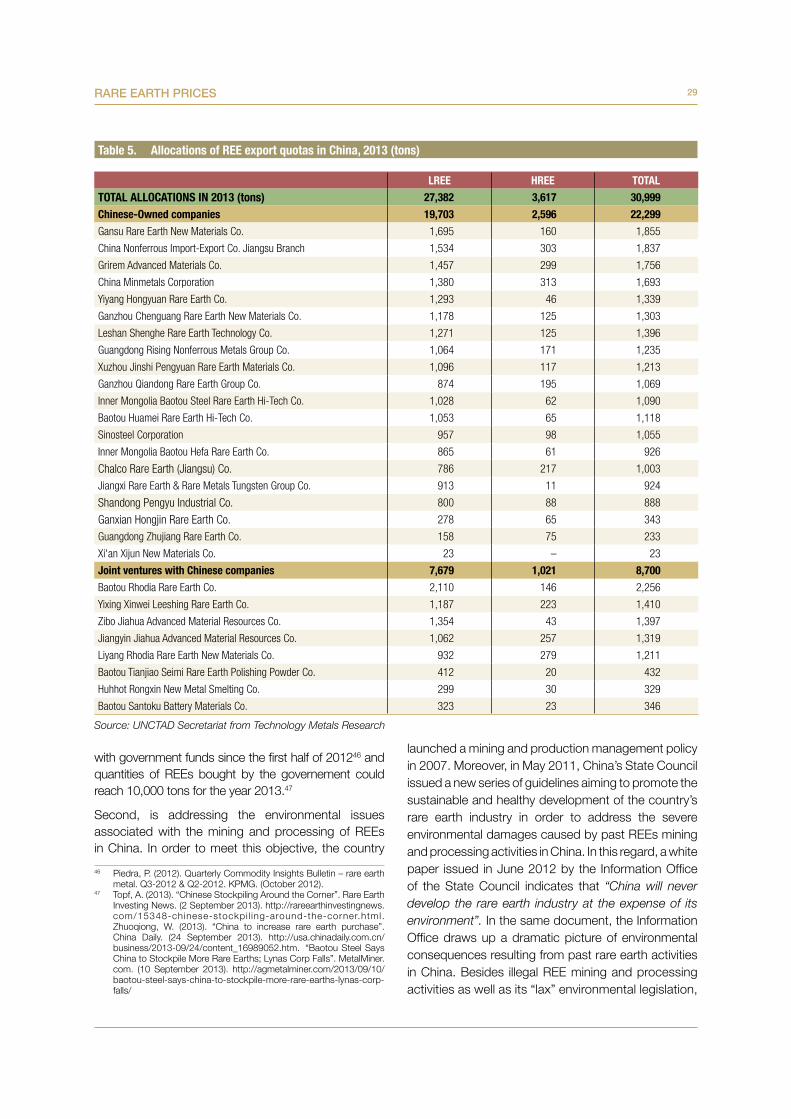
29RARE EARTH PRICES
Table 5. AllocationsofREEexportquotasinChina,2013(tons)
LREE HREE TOTALTOTALALLOCATIONSIN2013(tons) 27,382 3,617 30,999Chinese-Ownedcompanies 19,703 2,596 22,299Gansu Rare Earth New Materials Co. 1,695 160 1,855
China Nonferrous Import-Export Co. Jiangsu Branch 1,534 303 1,837
Grirem Advanced Materials Co. 1,457 299 1,756
China Minmetals Corporation 1,380 313 1,693
Yiyang Hongyuan Rare Earth Co. 1,293 46 1,339
Ganzhou Chenguang Rare Earth New Materials Co. 1,178 125 1,303
Leshan Shenghe Rare Earth Technology Co. 1,271 125 1,396
Guangdong Rising Nonferrous Metals Group Co. 1,064 171 1,235
Xuzhou Jinshi Pengyuan Rare Earth Materials Co. 1,096 117 1,213
Ganzhou Qiandong Rare Earth Group Co. 874 195 1,069
Inner Mongolia Baotou Steel Rare Earth Hi-Tech Co. 1,028 62 1,090
Baotou Huamei Rare Earth Hi-Tech Co. 1,053 65 1,118
Sinosteel Corporation 957 98 1,055
Inner Mongolia Baotou Hefa Rare Earth Co. 865 61 926
Chalco Rare Earth (Jiangsu) Co. 786 217 1,003
Jiangxi Rare Earth & Rare Metals Tungsten Group Co. 913 11 924
Shandong Pengyu Industrial Co. 800 88 888
Ganxian Hongjin Rare Earth Co. 278 65 343
Guangdong Zhujiang Rare Earth Co. 158 75 233
Xi'an Xijun New Materials Co. 23 – 23
JointventureswithChinesecompanies 7,679 1,021 8,700Baotou Rhodia Rare Earth Co. 2,110 146 2,256
Yixing Xinwei Leeshing Rare Earth Co. 1,187 223 1,410
Zibo Jiahua Advanced Material Resources Co. 1,354 43 1,397
Jiangyin Jiahua Advanced Material Resources Co. 1,062 257 1,319
Liyang Rhodia Rare Earth New Materials Co. 932 279 1,211
Baotou Tianjiao Seimi Rare Earth Polishing Powder Co. 412 20 432
Huhhot Rongxin New Metal Smelting Co. 299 30 329
Baotou Santoku Battery Materials Co. 323 23 346
Source: UNCTAD Secretariat from Technology Metals Research
with government funds since the first half of 201246 and quantities of REEs bought by the governement could reach 10,000 tons for the year 2013.47
Second, is addressing the environmental issues associated with the mining and processing of REEs in China. In order to meet this objective, the country
46 Piedra, P. (2012). Quarterly Commodity Insights Bulletin – rare earth metal. Q3-2012 & Q2-2012. KPMG. (October 2012).
47 Topf, A. (2013). “Chinese Stockpiling Around the Corner”. Rare Earth Investing News. (2 September 2013). http://rareearthinvestingnews.com/15348-chinese-stockpi l ing-around-the-corner.html. Zhuoqiong, W. (2013). “China to increase rare earth purchase”. China Daily. (24 September 2013). http://usa.chinadaily.com.cn/business/2013-09/24/content_16989052.htm. “Baotou Steel Says China to Stockpile More Rare Earths; Lynas Corp Falls”. MetalMiner.com. (10 September 2013). http://agmetalminer.com/2013/09/10/baotou-steel-says-china-to-stockpile-more-rare-earths-lynas-corp-falls/
launched a mining and production management policy in 2007. Moreover, in May 2011, China’s State Council issued a new series of guidelines aiming to promote the sustainable and healthy development of the country’s rare earth industry in order to address the severe environmental damages caused by past REEs mining and processing activities in China. In this regard, a white paper issued in June 2012 by the Information Office of the State Council indicates that “China will never develop the rare earth industry at the expense of its environment”. In the same document, the Information Office draws up a dramatic picture of environmental consequences resulting from past rare earth activities in China. Besides illegal REE mining and processing activities as well as its “lax” environmental legislation,
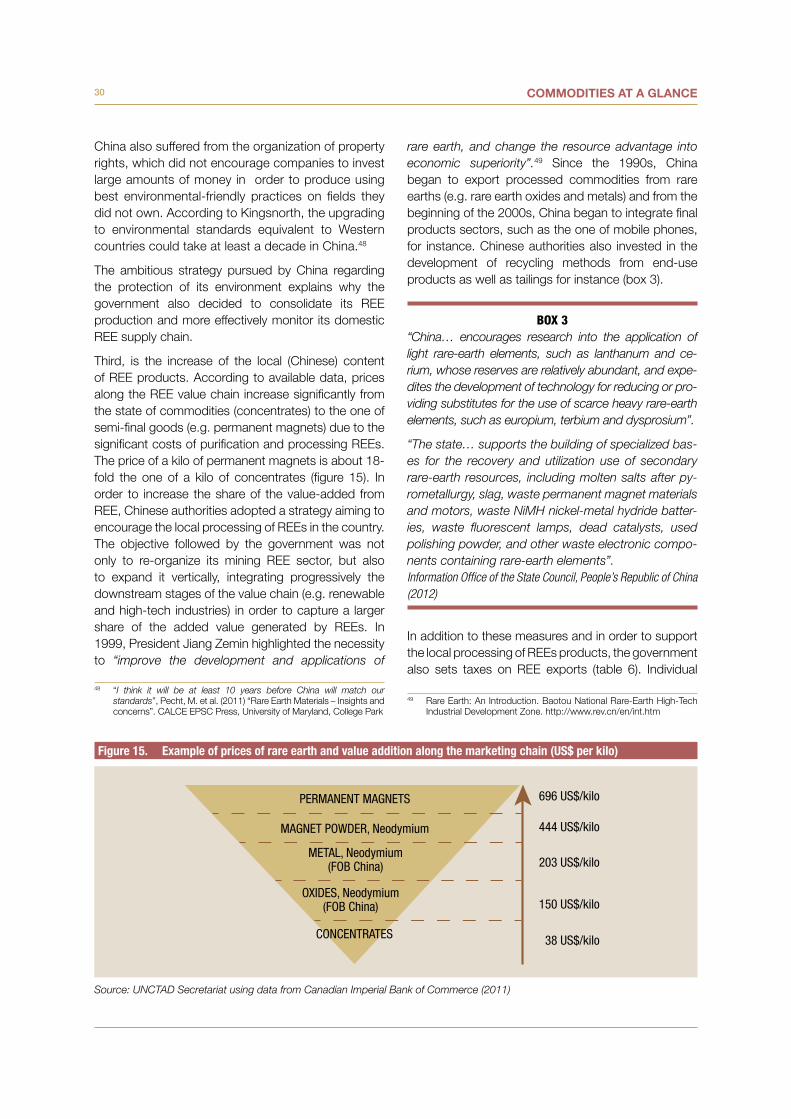
30 COMMODITIES AT A GLANCE
China also suffered from the organization of property rights, which did not encourage companies to invest large amounts of money in order to produce using best environmental-friendly practices on fields they did not own. According to Kingsnorth, the upgrading to environmental standards equivalent to Western countries could take at least a decade in China.48
The ambitious strategy pursued by China regarding the protection of its environment explains why the government also decided to consolidate its REE production and more effectively monitor its domestic REE supply chain.
Third, is the increase of the local (Chinese) content of REE products. According to available data, prices along the REE value chain increase significantly from the state of commodities (concentrates) to the one of semi-final goods (e.g. permanent magnets) due to the significant costs of purification and processing REEs. The price of a kilo of permanent magnets is about 18-fold the one of a kilo of concentrates (figure 15). In order to increase the share of the value-added from REE, Chinese authorities adopted a strategy aiming to encourage the local processing of REEs in the country. The objective followed by the government was not only to re-organize its mining REE sector, but also to expand it vertically, integrating progressively the downstream stages of the value chain (e.g. renewable and high-tech industries) in order to capture a larger share of the added value generated by REEs. In 1999, President Jiang Zemin highlighted the necessity to “improve the development and applications of
48 “I think it will be at least 10 years before China will match our standards”, Pecht, M. et al. (2011) “Rare Earth Materials – Insights and concerns”. CALCE EPSC Press, University of Maryland, College Park
BOX 3“China… encourages research into the application of light rare-earth elements, such as lanthanum and ce-rium, whose reserves are relatively abundant, and expe-dites the development of technology for reducing or pro-viding substitutes for the use of scarce heavy rare-earth elements, such as europium, terbium and dysprosium”.
“The state… supports the building of specialized bas-es for the recovery and utilization use of secondary rare-earth resources, including molten salts after py-rometallurgy, slag, waste permanent magnet materials and motors, waste NiMH nickel-metal hydride batter-ies, waste fluorescent lamps, dead catalysts, used polishing powder, and other waste electronic compo-nents containing rare-earth elements”.Information Office of the State Council, People’s Republic of China (2012)
rare earth, and change the resource advantage into economic superiority”.49 Since the 1990s, China began to export processed commodities from rare earths (e.g. rare earth oxides and metals) and from the beginning of the 2000s, China began to integrate final products sectors, such as the one of mobile phones, for instance. Chinese authorities also invested in the development of recycling methods from end-use products as well as tailings for instance (box 3).
In addition to these measures and in order to support the local processing of REEs products, the government also sets taxes on REE exports (table 6). Individual
49 Rare Earth: An Introduction. Baotou National Rare-Earth High-Tech Industrial Development Zone. http://www.rev.cn/en/int.htm
PERMANENT MAGNETS
MAGNET POWDER, Neodymium
METAL, Neodymium(FOB China)
OXIDES, Neodymium(FOB China)
CONCENTRATES
696 US$/kilo
444 US$/kilo
203 US$/kilo
150 US$/kilo
38 US$/kilo
Figure 15. Exampleofpricesofrareearthandvalueadditionalongthemarketingchain(US$perkilo)
Source: UNCTAD Secretariat using data from Canadian Imperial Bank of Commerce (2011)
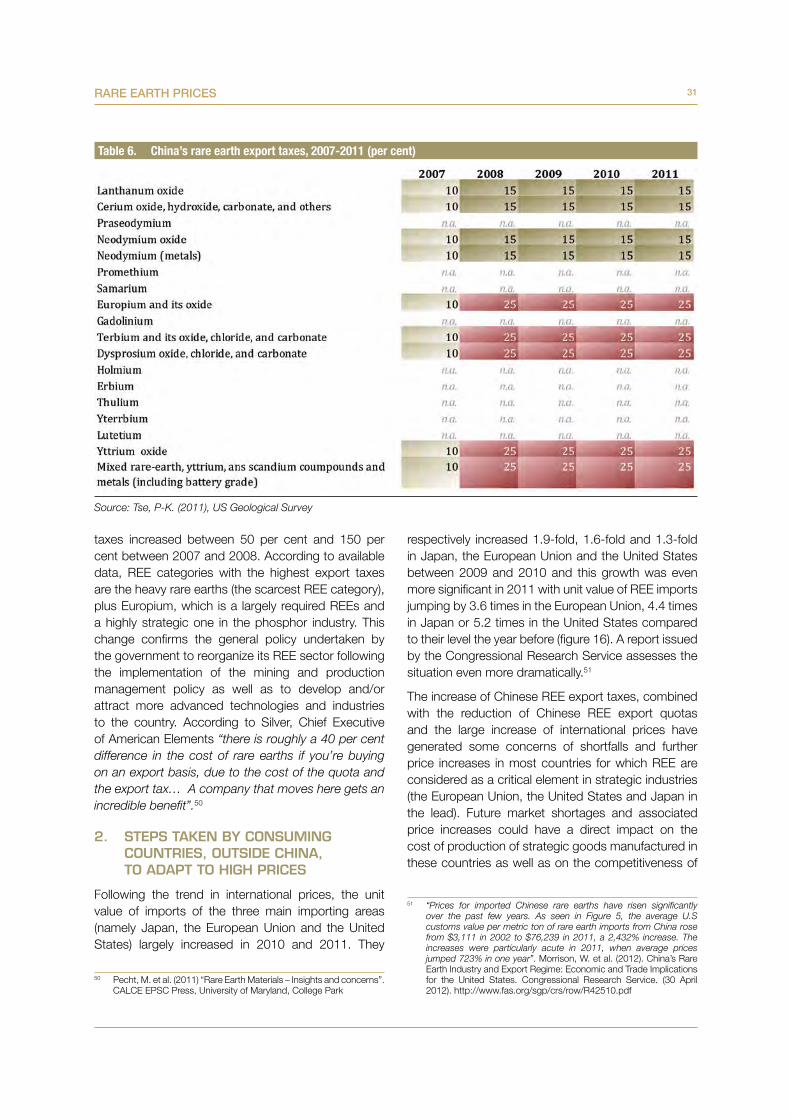
31RARE EARTH PRICES
taxes increased between 50 per cent and 150 per cent between 2007 and 2008. According to available data, REE categories with the highest export taxes are the heavy rare earths (the scarcest REE category), plus Europium, which is a largely required REEs and a highly strategic one in the phosphor industry. This change confirms the general policy undertaken by the government to reorganize its REE sector following the implementation of the mining and production management policy as well as to develop and/or attract more advanced technologies and industries to the country. According to Silver, Chief Executive of American Elements “there is roughly a 40 per cent difference in the cost of rare earths if you’re buying on an export basis, due to the cost of the quota and the export tax… A company that moves here gets an incredible benefit”.50
2. STEPS TAKEN BY CONSUMING COUNTRIES, OUTSIDE CHINA, TO ADAPT TO HIGH PRICES
Following the trend in international prices, the unit value of imports of the three main importing areas (namely Japan, the European Union and the United States) largely increased in 2010 and 2011. They
50 Pecht, M. et al. (2011) “Rare Earth Materials – Insights and concerns”. CALCE EPSC Press, University of Maryland, College Park
respectively increased 1.9-fold, 1.6-fold and 1.3-fold in Japan, the European Union and the United States between 2009 and 2010 and this growth was even more significant in 2011 with unit value of REE imports jumping by 3.6 times in the European Union, 4.4 times in Japan or 5.2 times in the United States compared to their level the year before (figure 16). A report issued by the Congressional Research Service assesses the situation even more dramatically.51
The increase of Chinese REE export taxes, combined with the reduction of Chinese REE export quotas and the large increase of international prices have generated some concerns of shortfalls and further price increases in most countries for which REE are considered as a critical element in strategic industries (the European Union, the United States and Japan in the lead). Future market shortages and associated price increases could have a direct impact on the cost of production of strategic goods manufactured in these countries as well as on the competitiveness of
51 “Prices for imported Chinese rare earths have risen significantly over the past few years. As seen in Figure 5, the average U.S customs value per metric ton of rare earth imports from China rose from $3,111 in 2002 to $76,239 in 2011, a 2,432% increase. The increases were particularly acute in 2011, when average prices jumped 723% in one year”. Morrison, W. et al. (2012). China’s Rare Earth Industry and Export Regime: Economic and Trade Implications for the United States. Congressional Research Service. (30 April 2012). http://www.fas.org/sgp/crs/row/R42510.pdf
Table 6. China’srareearthexporttaxes,2007-2011(percent)
Source: Tse, P-K. (2011), US Geological Survey
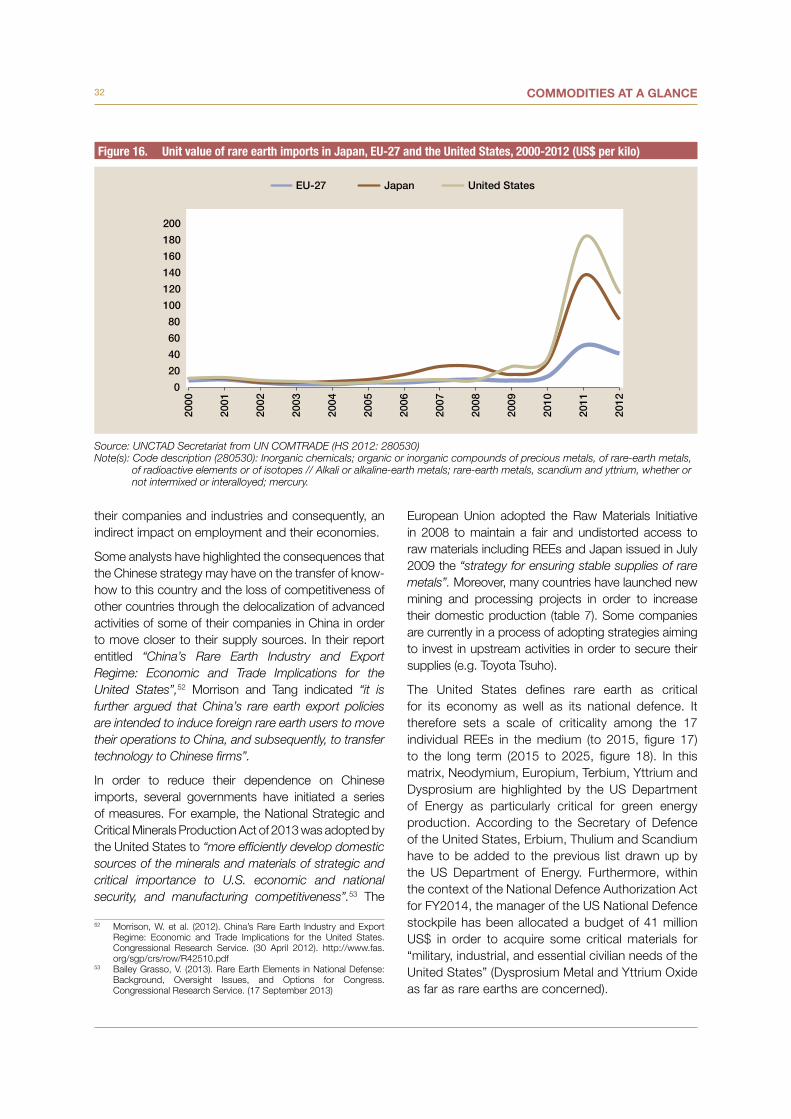
32 COMMODITIES AT A GLANCE
0
20
40
60
80
100
120
140
160
180
200
2000
2001
2002
2003
2004
2005
2006
2007
2008
2009
2010
2011
2012
EU-27 Japan United States
Figure 16. UnitvalueofrareearthimportsinJapan,EU-27andtheUnitedStates,2000-2012(US$perkilo)
Source: UNCTAD Secretariat from UN COMTRADE (HS 2012: 280530)Note(s): Code description (280530): Inorganic chemicals; organic or inorganic compounds of precious metals, of rare-earth metals,
of radioactive elements or of isotopes // Alkali or alkaline-earth metals; rare-earth metals, scandium and yttrium, whether or not intermixed or interalloyed; mercury.
their companies and industries and consequently, an indirect impact on employment and their economies.
Some analysts have highlighted the consequences that the Chinese strategy may have on the transfer of know-how to this country and the loss of competitiveness of other countries through the delocalization of advanced activities of some of their companies in China in order to move closer to their supply sources. In their report entitled “China’s Rare Earth Industry and Export Regime: Economic and Trade Implications for the United States”,52 Morrison and Tang indicated “it is further argued that China’s rare earth export policies are intended to induce foreign rare earth users to move their operations to China, and subsequently, to transfer technology to Chinese firms”.
In order to reduce their dependence on Chinese imports, several governments have initiated a series of measures. For example, the National Strategic and Critical Minerals Production Act of 2013 was adopted by the United States to “more efficiently develop domestic sources of the minerals and materials of strategic and critical importance to U.S. economic and national security, and manufacturing competitiveness”.53 The
52 Morrison, W. et al. (2012). China’s Rare Earth Industry and Export Regime: Economic and Trade Implications for the United States. Congressional Research Service. (30 April 2012). http://www.fas.org/sgp/crs/row/R42510.pdf
53 Bailey Grasso, V. (2013). Rare Earth Elements in National Defense: Background, Oversight Issues, and Options for Congress. Congressional Research Service. (17 September 2013)
European Union adopted the Raw Materials Initiative in 2008 to maintain a fair and undistorted access to raw materials including REEs and Japan issued in July 2009 the “strategy for ensuring stable supplies of rare metals”. Moreover, many countries have launched new mining and processing projects in order to increase their domestic production (table 7). Some companies are currently in a process of adopting strategies aiming to invest in upstream activities in order to secure their supplies (e.g. Toyota Tsuho).
The United States defines rare earth as critical for its economy as well as its national defence. It therefore sets a scale of criticality among the 17 individual REEs in the medium (to 2015, figure 17) to the long term (2015 to 2025, figure 18). In this matrix, Neodymium, Europium, Terbium, Yttrium and Dysprosium are highlighted by the US Department of Energy as particularly critical for green energy production. According to the Secretary of Defence of the United States, Erbium, Thulium and Scandium have to be added to the previous list drawn up by the US Department of Energy. Furthermore, within the context of the National Defence Authorization Act for FY2014, the manager of the US National Defence stockpile has been allocated a budget of 41 million US$ in order to acquire some critical materials for “military, industrial, and essential civilian needs of the United States” (Dysprosium Metal and Yttrium Oxide as far as rare earths are concerned).
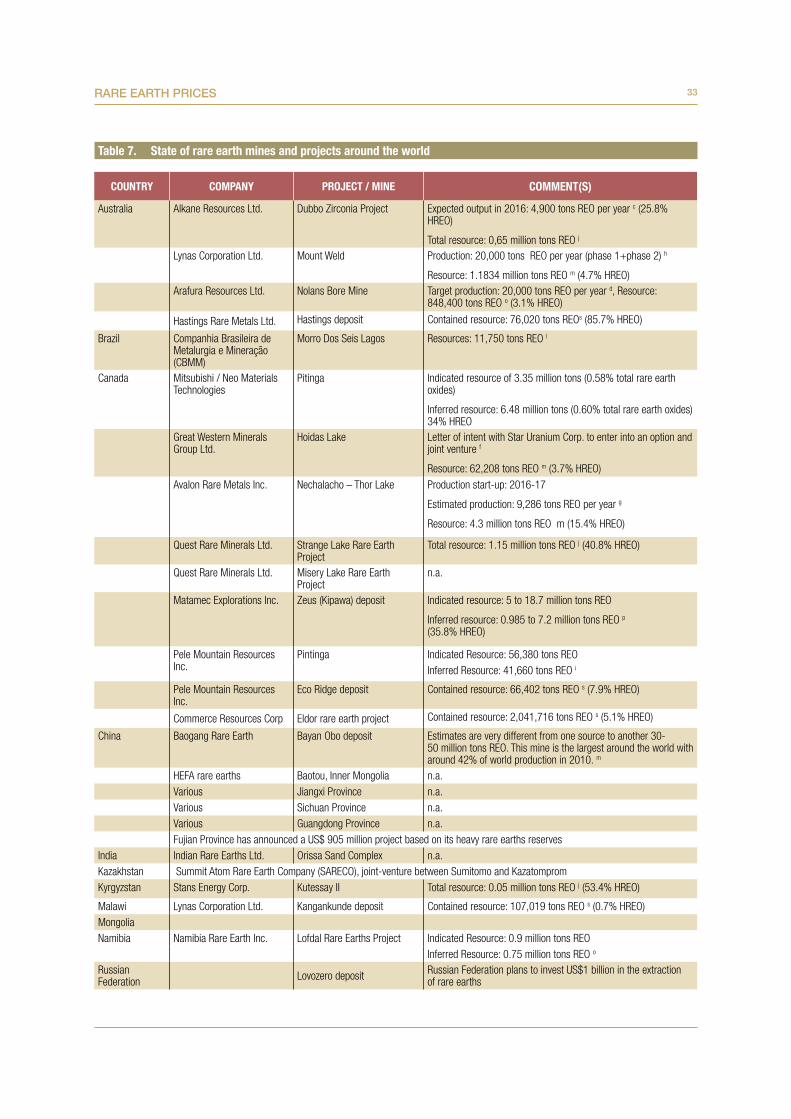
33RARE EARTH PRICES
Table 7. Stateofrareearthminesandprojectsaroundtheworld
COUNTRY COMPANY PROJECT/MINE COMMENT(S)
Australia Alkane Resources Ltd. Dubbo Zirconia Project Expected output in 2016: 4,900 tons REO per year c (25.8% HREO)
Total resource: 0,65 million tons REO j Lynas Corporation Ltd. Mount Weld Production: 20,000 tons REO per year (phase 1+phase 2) h
Resource: 1.1834 million tons REO m (4.7% HREO) Arafura Resources Ltd. Nolans Bore Mine Target production: 20,000 tons REO per year d, Resource:
848,400 tons REO o (3.1% HREO)
Hastings Rare Metals Ltd. Hastings deposit Contained resource: 76,020 tons REOs (85.7% HREO)
Brazil Companhia Brasileira de Metalurgia e Mineração (CBMM)
Morro Dos Seis Lagos Resources: 11,750 tons REO l
Canada Mitsubishi / Neo Materials Technologies
Pitinga Indicated resource of 3.35 million tons (0.58% total rare earth oxides)
Inferred resource: 6.48 million tons (0.60% total rare earth oxides) 34% HREO
Great Western Minerals Group Ltd.
Hoidas Lake Letter of intent with Star Uranium Corp. to enter into an option and joint venture f
Resource: 62,208 tons REO m (3.7% HREO)
Avalon Rare Metals Inc. Nechalacho – Thor Lake Production start-up: 2016-17
Estimated production: 9,286 tons REO per year g
Resource: 4.3 million tons REO m (15.4% HREO)
Quest Rare Minerals Ltd. Strange Lake Rare Earth Project
Total resource: 1.15 million tons REO j (40.8% HREO)
Quest Rare Minerals Ltd. Misery Lake Rare Earth Project
n.a.
Matamec Explorations Inc. Zeus (Kipawa) deposit Indicated resource: 5 to 18.7 million tons REO
Inferred resource: 0.985 to 7.2 million tons REO p (35.8% HREO)
Pele Mountain Resources Inc.
Pintinga Indicated Resource: 56,380 tons REOInferred Resource: 41,660 tons REO i
Pele Mountain Resources Inc.
Eco Ridge deposit Contained resource: 66,402 tons REO s (7.9% HREO)
Commerce Resources Corp Eldor rare earth project Contained resource: 2,041,716 tons REO s (5.1% HREO)
China Baogang Rare Earth Bayan Obo deposit Estimates are very different from one source to another 30-50 million tons REO. This mine is the largest around the world with around 42% of world production in 2010. m
HEFA rare earths Baotou, Inner Mongolia n.a. Various Jiangxi Province n.a. Various Sichuan Province n.a. Various Guangdong Province n.a. Fujian Province has announced a US$ 905 million project based on its heavy rare earths reservesIndia Indian Rare Earths Ltd. Orissa Sand Complex n.a.Kazakhstan Summit Atom Rare Earth Company (SARECO), joint-venture between Sumitomo and KazatompromKyrgyzstan Stans Energy Corp. Kutessay II Total resource: 0.05 million tons REO j (53.4% HREO)
Malawi Lynas Corporation Ltd. Kangankunde deposit Contained resource: 107,019 tons REO s (0.7% HREO)MongoliaNamibia Namibia Rare Earth Inc. Lofdal Rare Earths Project Indicated Resource: 0.9 million tons REO
Inferred Resource: 0.75 million tons REO o
Russian Federation Lovozero deposit Russian Federation plans to invest US$1 billion in the extraction
of rare earths
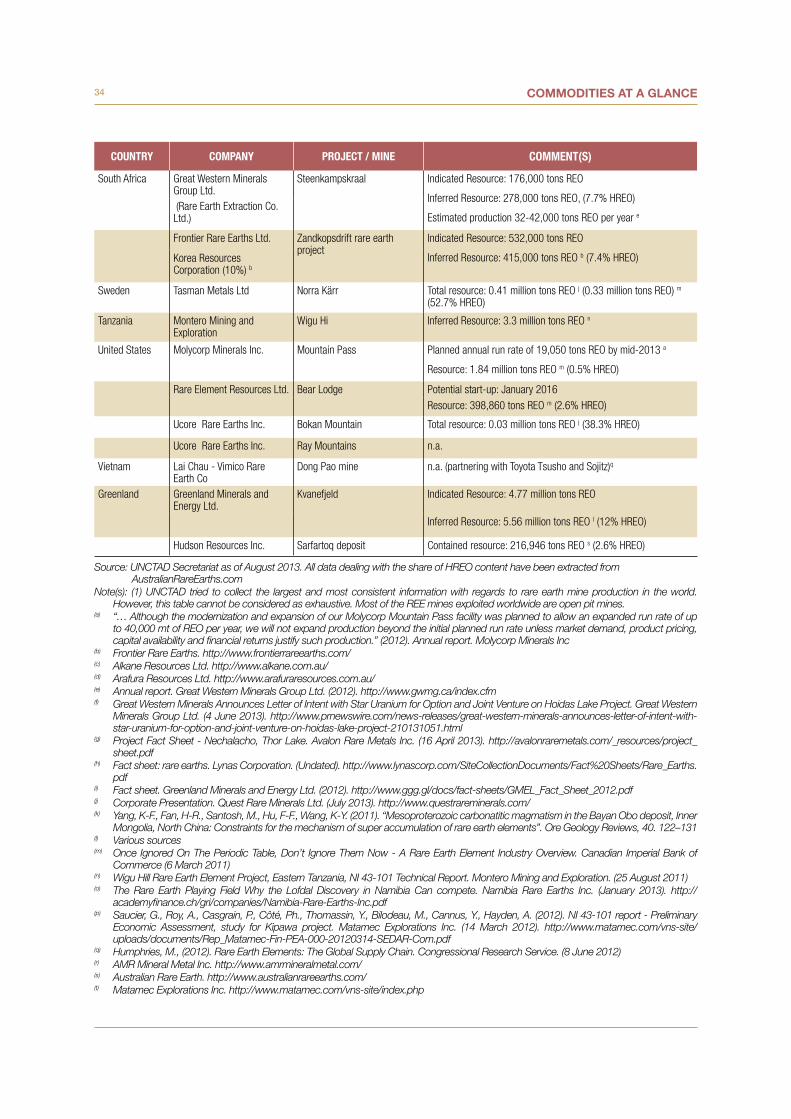
34 COMMODITIES AT A GLANCE
COUNTRY COMPANY PROJECT/MINE COMMENT(S)
South Africa Great Western Minerals Group Ltd.
Steenkampskraal Indicated Resource: 176,000 tons REO
Inferred Resource: 278,000 tons REO, (7.7% HREO)
Estimated production 32-42,000 tons REO per year e (Rare Earth Extraction Co. Ltd.)
Frontier Rare Earths Ltd. Zandkopsdrift rare earth project
Indicated Resource: 532,000 tons REO
Inferred Resource: 415,000 tons REO b (7.4% HREO)Korea Resources Corporation (10%) b
Sweden Tasman Metals Ltd Norra Kärr Total resource: 0.41 million tons REO j (0.33 million tons REO) m (52.7% HREO)
Tanzania Montero Mining and Exploration
Wigu Hi Inferred Resource: 3.3 million tons REO n
United States Molycorp Minerals Inc. Mountain Pass Planned annual run rate of 19,050 tons REO by mid-2013 a
Resource: 1.84 million tons REO m (0.5% HREO)
Rare Element Resources Ltd. Bear Lodge Potential start-up: January 2016Resource: 398,860 tons REO m (2.6% HREO)
Ucore Rare Earths Inc. Bokan Mountain Total resource: 0.03 million tons REO j (38.3% HREO)
Ucore Rare Earths Inc. Ray Mountains n.a.
Vietnam Lai Chau - Vimico Rare Earth Co
Dong Pao mine n.a. (partnering with Toyota Tsusho and Sojitz)q
Greenland Greenland Minerals and Energy Ltd.
Kvanefjeld Indicated Resource: 4.77 million tons REO
Inferred Resource: 5.56 million tons REO I (12% HREO)
Hudson Resources Inc. Sarfartoq deposit Contained resource: 216,946 tons REO s (2.6% HREO)
Source: UNCTAD Secretariat as of August 2013. All data dealing with the share of HREO content have been extracted from AustralianRareEarths.com
Note(s): (1) UNCTAD tried to collect the largest and most consistent information with regards to rare earth mine production in the world. However, this table cannot be considered as exhaustive. Most of the REE mines exploited worldwide are open pit mines.
(a) “… Although the modernization and expansion of our Molycorp Mountain Pass facility was planned to allow an expanded run rate of up to 40,000 mt of REO per year, we will not expand production beyond the initial planned run rate unless market demand, product pricing, capital availability and financial returns justify such production.” (2012). Annual report. Molycorp Minerals Inc
(b) Frontier Rare Earths. http://www.frontierrareearths.com/ (c) Alkane Resources Ltd. http://www.alkane.com.au/ (d) Arafura Resources Ltd. http://www.arafuraresources.com.au/ (e) Annual report. Great Western Minerals Group Ltd. (2012). http://www.gwmg.ca/index.cfm (f) Great Western Minerals Announces Letter of Intent with Star Uranium for Option and Joint Venture on Hoidas Lake Project. Great Western
Minerals Group Ltd. (4 June 2013). http://www.prnewswire.com/news-releases/great-western-minerals-announces-letter-of-intent-with-star-uranium-for-option-and-joint-venture-on-hoidas-lake-project-210131051.html
(g) Project Fact Sheet - Nechalacho, Thor Lake. Avalon Rare Metals Inc. (16 April 2013). http://avalonraremetals.com/_resources/project_sheet.pdf
(h) Fact sheet: rare earths. Lynas Corporation. (Undated). http://www.lynascorp.com/SiteCollectionDocuments/Fact%20Sheets/Rare_Earths.pdf
(i) Fact sheet. Greenland Minerals and Energy Ltd. (2012). http://www.ggg.gl/docs/fact-sheets/GMEL_Fact_Sheet_2012.pdf (j) Corporate Presentation. Quest Rare Minerals Ltd. (July 2013). http://www.questrareminerals.com/ (k) Yang, K-F., Fan, H-R., Santosh, M., Hu, F-F., Wang, K-Y. (2011). “Mesoproterozoic carbonatitic magmatism in the Bayan Obo deposit, Inner
Mongolia, North China: Constraints for the mechanism of super accumulation of rare earth elements”. Ore Geology Reviews, 40. 122–131 (l) Various sources(m) Once Ignored On The Periodic Table, Don’t Ignore Them Now - A Rare Earth Element Industry Overview. Canadian Imperial Bank of
Commerce (6 March 2011)(n) Wigu Hill Rare Earth Element Project, Eastern Tanzania, NI 43-101 Technical Report. Montero Mining and Exploration. (25 August 2011)(o) The Rare Earth Playing Field Why the Lofdal Discovery in Namibia Can compete. Namibia Rare Earths Inc. (January 2013). http://
academyfinance.ch/gri/companies/Namibia-Rare-Earths-Inc.pdf (p) Saucier, G., Roy, A., Casgrain, P., Côté, Ph., Thomassin, Y., Bilodeau, M., Cannus, Y., Hayden, A. (2012). NI 43-101 report - Preliminary
Economic Assessment, study for Kipawa project. Matamec Explorations Inc. (14 March 2012). http://www.matamec.com/vns-site/uploads/documents/Rep_Matamec-Fin-PEA-000-20120314-SEDAR-Com.pdf
(q) Humphries, M., (2012). Rare Earth Elements: The Global Supply Chain. Congressional Research Service. (8 June 2012)(r) AMR Mineral Metal Inc. http://www.amrmineralmetal.com/ (s) Australian Rare Earth. http://www.australianrareearths.com/ (t) Matamec Explorations Inc. http://www.matamec.com/vns-site/index.php
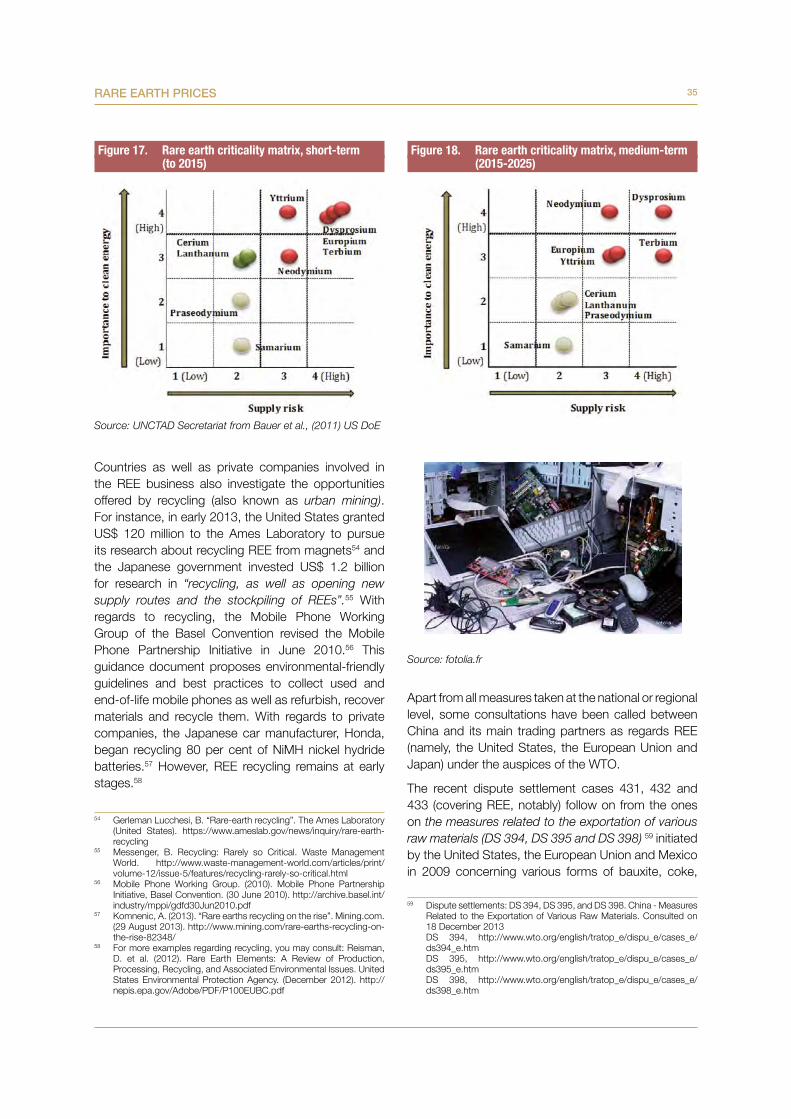
35RARE EARTH PRICES
Countries as well as private companies involved in the REE business also investigate the opportunities offered by recycling (also known as urban mining). For instance, in early 2013, the United States granted US$ 120 million to the Ames Laboratory to pursue its research about recycling REE from magnets54 and the Japanese government invested US$ 1.2 billion for research in “recycling, as well as opening new supply routes and the stockpiling of REEs”.55 With regards to recycling, the Mobile Phone Working Group of the Basel Convention revised the Mobile Phone Partnership Initiative in June 2010.56 This guidance document proposes environmental-friendly guidelines and best practices to collect used and end-of-life mobile phones as well as refurbish, recover materials and recycle them. With regards to private companies, the Japanese car manufacturer, Honda, began recycling 80 per cent of NiMH nickel hydride batteries.57 However, REE recycling remains at early stages.58
54 Gerleman Lucchesi, B. “Rare-earth recycling”. The Ames Laboratory (United States). https://www.ameslab.gov/news/inquiry/rare-earth-recycling
55 Messenger, B. Recycling: Rarely so Critical. Waste Management World. http://www.waste-management-world.com/articles/print/volume-12/issue-5/features/recycling-rarely-so-critical.html
56 Mobile Phone Working Group. (2010). Mobile Phone Partnership Initiative, Basel Convention. (30 June 2010). http://archive.basel.int/industry/mppi/gdfd30Jun2010.pdf
57 Komnenic, A. (2013). “Rare earths recycling on the rise”. Mining.com. (29 August 2013). http://www.mining.com/rare-earths-recycling-on-the-rise-82348/
58 For more examples regarding recycling, you may consult: Reisman, D. et al. (2012). Rare Earth Elements: A Review of Production, Processing, Recycling, and Associated Environmental Issues. United States Environmental Protection Agency. (December 2012). http://nepis.epa.gov/Adobe/PDF/P100EUBC.pdf
Figure 17. Rareearthcriticalitymatrix,short-term (to2015)
Figure 18. Rareearthcriticalitymatrix,medium-term (2015-2025)
Source: UNCTAD Secretariat from Bauer et al., (2011) US DoE
Apart from all measures taken at the national or regional level, some consultations have been called between China and its main trading partners as regards REE (namely, the United States, the European Union and Japan) under the auspices of the WTO.
The recent dispute settlement cases 431, 432 and 433 (covering REE, notably) follow on from the ones on the measures related to the exportation of various raw materials (DS 394, DS 395 and DS 398) 59 initiated by the United States, the European Union and Mexico in 2009 concerning various forms of bauxite, coke,
59 Dispute settlements: DS 394, DS 395, and DS 398. China - Measures Related to the Exportation of Various Raw Materials. Consulted on 18 December 2013
DS 394, http://www.wto.org/english/tratop_e/dispu_e/cases_e/ds394_e.htm
DS 395, http://www.wto.org/english/tratop_e/dispu_e/cases_e/ds395_e.htm
DS 398, http://www.wto.org/english/tratop_e/dispu_e/cases_e/ds398_e.htm
Source: fotolia.fr
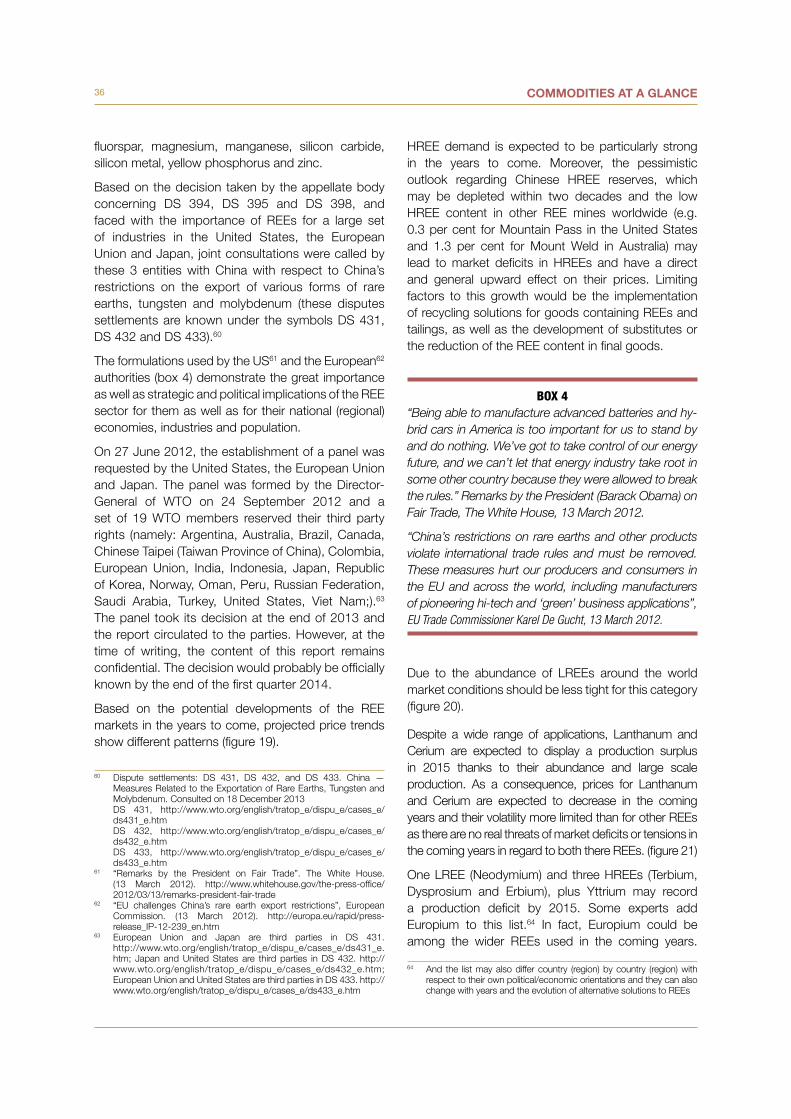
36 COMMODITIES AT A GLANCE
fluorspar, magnesium, manganese, silicon carbide, silicon metal, yellow phosphorus and zinc.
Based on the decision taken by the appellate body concerning DS 394, DS 395 and DS 398, and faced with the importance of REEs for a large set of industries in the United States, the European Union and Japan, joint consultations were called by these 3 entities with China with respect to China’s restrictions on the export of various forms of rare earths, tungsten and molybdenum (these disputes settlements are known under the symbols DS 431, DS 432 and DS 433).60
The formulations used by the US61 and the European62 authorities (box 4) demonstrate the great importance as well as strategic and political implications of the REE sector for them as well as for their national (regional) economies, industries and population.
On 27 June 2012, the establishment of a panel was requested by the United States, the European Union and Japan. The panel was formed by the Director-General of WTO on 24 September 2012 and a set of 19 WTO members reserved their third party rights (namely: Argentina, Australia, Brazil, Canada, Chinese Taipei (Taiwan Province of China), Colombia, European Union, India, Indonesia, Japan, Republic of Korea, Norway, Oman, Peru, Russian Federation, Saudi Arabia, Turkey, United States, Viet Nam;).63 The panel took its decision at the end of 2013 and the report circulated to the parties. However, at the time of writing, the content of this report remains confidential. The decision would probably be officially known by the end of the first quarter 2014.
Based on the potential developments of the REE markets in the years to come, projected price trends show different patterns (figure 19).
60 Dispute settlements: DS 431, DS 432, and DS 433. China — Measures Related to the Exportation of Rare Earths, Tungsten and Molybdenum. Consulted on 18 December 2013
DS 431, http://www.wto.org/english/tratop_e/dispu_e/cases_e/ds431_e.htm
DS 432, http://www.wto.org/english/tratop_e/dispu_e/cases_e/ds432_e.htm
DS 433, http://www.wto.org/english/tratop_e/dispu_e/cases_e/ds433_e.htm
61 “Remarks by the President on Fair Trade”. The White House. (13 March 2012). http://www.whitehouse.gov/the-press-office/ 2012/03/13/remarks-president-fair-trade
62 “EU challenges China’s rare earth export restrictions”, European Commission. (13 March 2012). http://europa.eu/rapid/press-release_IP-12-239_en.htm
63 European Union and Japan are third parties in DS 431. http://www.wto.org/english/tratop_e/dispu_e/cases_e/ds431_e.htm; Japan and United States are third parties in DS 432. http://www.wto.org/english/tratop_e/dispu_e/cases_e/ds432_e.htm; European Union and United States are third parties in DS 433. http://www.wto.org/english/tratop_e/dispu_e/cases_e/ds433_e.htm
HREE demand is expected to be particularly strong in the years to come. Moreover, the pessimistic outlook regarding Chinese HREE reserves, which may be depleted within two decades and the low HREE content in other REE mines worldwide (e.g. 0.3 per cent for Mountain Pass in the United States and 1.3 per cent for Mount Weld in Australia) may lead to market deficits in HREEs and have a direct and general upward effect on their prices. Limiting factors to this growth would be the implementation of recycling solutions for goods containing REEs and tailings, as well as the development of substitutes or the reduction of the REE content in final goods.
Due to the abundance of LREEs around the world market conditions should be less tight for this category (figure 20).
Despite a wide range of applications, Lanthanum and Cerium are expected to display a production surplus in 2015 thanks to their abundance and large scale production. As a consequence, prices for Lanthanum and Cerium are expected to decrease in the coming years and their volatility more limited than for other REEs as there are no real threats of market deficits or tensions in the coming years in regard to both there REEs. (figure 21)
One LREE (Neodymium) and three HREEs (Terbium, Dysprosium and Erbium), plus Yttrium may record a production deficit by 2015. Some experts add Europium to this list.64 In fact, Europium could be among the wider REEs used in the coming years.
64 And the list may also differ country (region) by country (region) with respect to their own political/economic orientations and they can also change with years and the evolution of alternative solutions to REEs
BOX 4“Being able to manufacture advanced batteries and hy-brid cars in America is too important for us to stand by and do nothing. We’ve got to take control of our energy future, and we can’t let that energy industry take root in some other country because they were allowed to break the rules.” Remarks by the President (Barack Obama) on Fair Trade, The White House, 13 March 2012.
“China’s restrictions on rare earths and other products violate international trade rules and must be removed. These measures hurt our producers and consumers in the EU and across the world, including manufacturers of pioneering hi-tech and ‘green’ business applications”,EU Trade Commissioner Karel De Gucht, 13 March 2012.
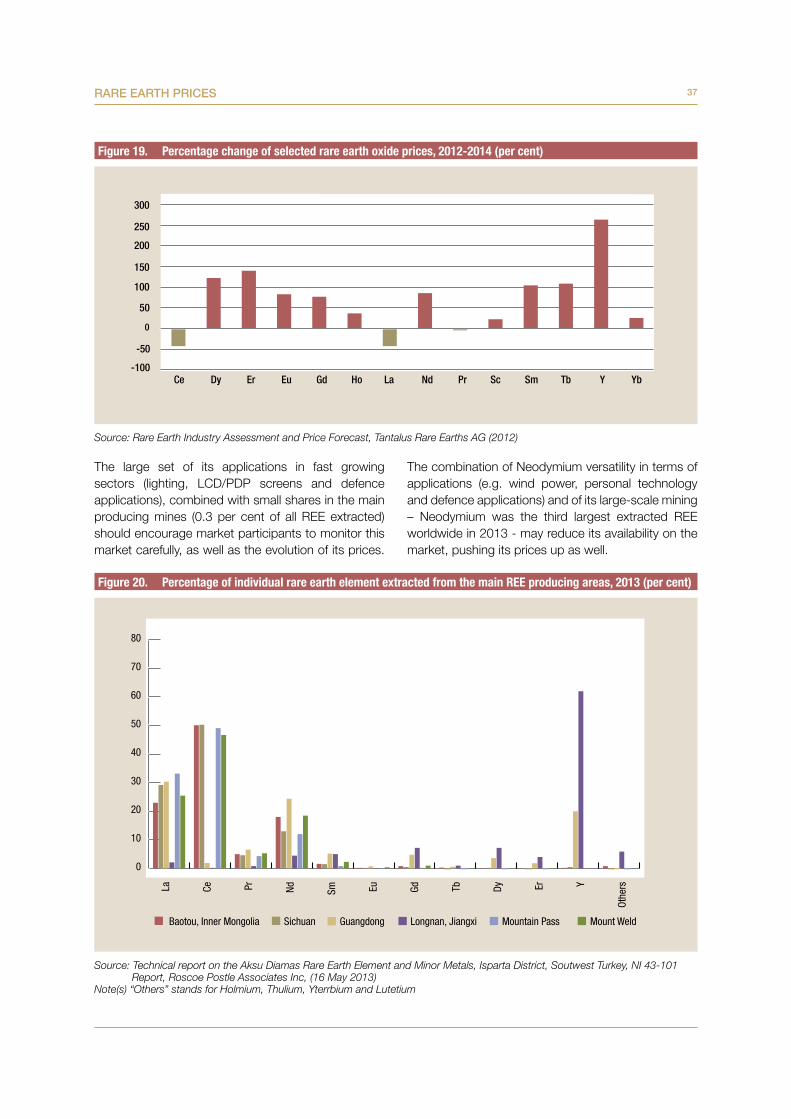
37RARE EARTH PRICES
The large set of its applications in fast growing sectors (lighting, LCD/PDP screens and defence applications), combined with small shares in the main producing mines (0.3 per cent of all REE extracted) should encourage market participants to monitor this market carefully, as well as the evolution of its prices.
The combination of Neodymium versatility in terms of applications (e.g. wind power, personal technology and defence applications) and of its large-scale mining – Neodymium was the third largest extracted REE worldwide in 2013 - may reduce its availability on the market, pushing its prices up as well.
-100
-50
0
50
100
150
200
250
300
Ce Dy Er Eu Gd Ho La Nd Pr Sc Sm Tb Y Yb
0
10
20
30
40
50
60
70
80
La Ce Pr Nd Sm Eu Gd Tb Dy Er Y
Othe
rs
Figure 19. Percentagechangeofselectedrareearthoxideprices,2012-2014(percent)
Figure 20. PercentageofindividualrareearthelementextractedfromthemainREEproducingareas,2013(percent)
Source: Rare Earth Industry Assessment and Price Forecast, Tantalus Rare Earths AG (2012)
Source: Technical report on the Aksu Diamas Rare Earth Element and Minor Metals, Isparta District, Soutwest Turkey, NI 43-101 Report, Roscoe Postle Associates Inc, (16 May 2013)
Note(s) “Others” stands for Holmium, Thulium, Yterrbium and Lutetium
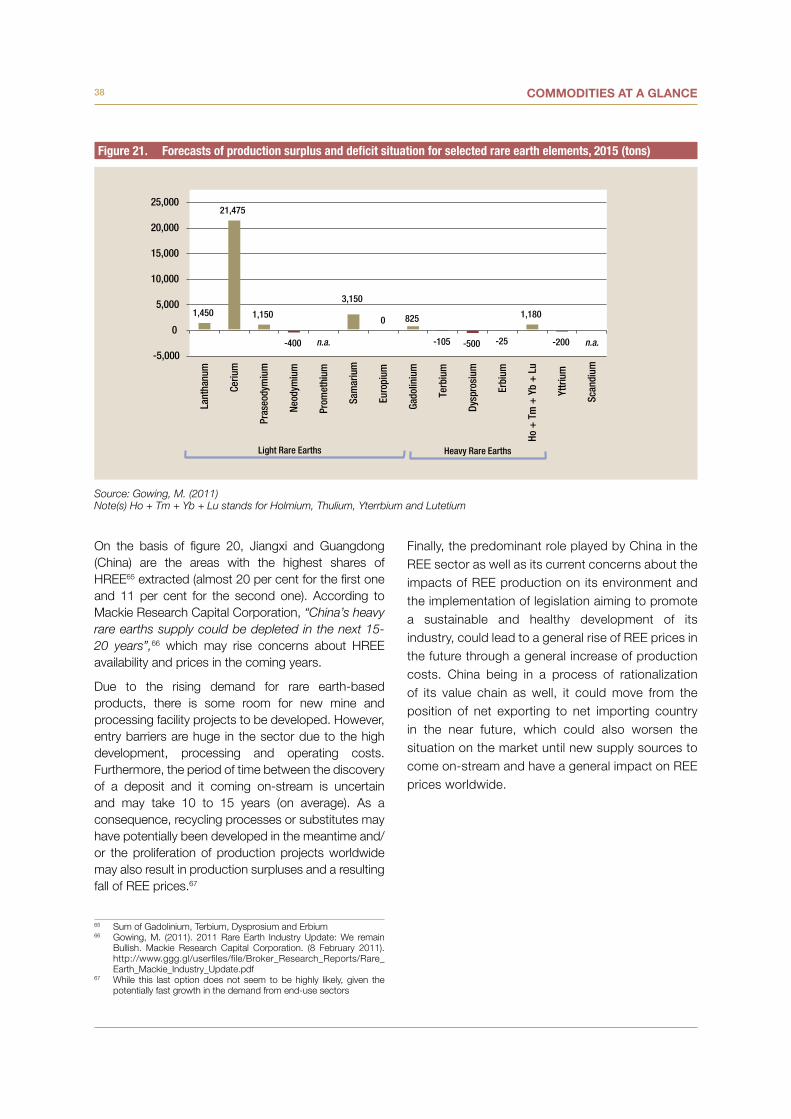
38 COMMODITIES AT A GLANCE
On the basis of figure 20, Jiangxi and Guangdong (China) are the areas with the highest shares of HREE65 extracted (almost 20 per cent for the first one and 11 per cent for the second one). According to Mackie Research Capital Corporation, “China’s heavy rare earths supply could be depleted in the next 15-20 years”,66 which may rise concerns about HREE availability and prices in the coming years.
Due to the rising demand for rare earth-based products, there is some room for new mine and processing facility projects to be developed. However, entry barriers are huge in the sector due to the high development, processing and operating costs. Furthermore, the period of time between the discovery of a deposit and it coming on-stream is uncertain and may take 10 to 15 years (on average). As a consequence, recycling processes or substitutes may have potentially been developed in the meantime and/or the proliferation of production projects worldwide may also result in production surpluses and a resulting fall of REE prices.67
65 Sum of Gadolinium, Terbium, Dysprosium and Erbium66 Gowing, M. (2011). 2011 Rare Earth Industry Update: We remain
Bullish. Mackie Research Capital Corporation. (8 February 2011). http://www.ggg.gl/userfiles/file/Broker_Research_Reports/Rare_Earth_Mackie_Industry_Update.pdf
67 While this last option does not seem to be highly likely, given the potentially fast growth in the demand from end-use sectors
Finally, the predominant role played by China in the REE sector as well as its current concerns about the impacts of REE production on its environment and the implementation of legislation aiming to promote a sustainable and healthy development of its industry, could lead to a general rise of REE prices in the future through a general increase of production costs. China being in a process of rationalization of its value chain as well, it could move from the position of net exporting to net importing country in the near future, which could also worsen the situation on the market until new supply sources to come on-stream and have a general impact on REE prices worldwide.
1,450
21,475
1,150
-400
3,150
0 825
-105 -500 -25
1,180
-200 -5,000
0
5,000
10,000
15,000
20,000
25,000La
ntha
num
Ceriu
m
Pras
eody
miu
m
Neod
ymiu
m
Prom
ethi
um
Sam
ariu
m
Euro
pium
Gado
liniu
m
Terb
ium
Dysp
rosi
um
Erbi
um
Ho +
Tm
+ Y
b +
Lu
Yttr
ium
Scan
dium
Light Rare Earths Heavy Rare Earths
n.a. n.a.
Figure 21. Forecastsofproductionsurplusanddeficitsituationforselectedrareearthelements,2015(tons)
Source: Gowing, M. (2011) Note(s) Ho + Tm + Yb + Lu stands for Holmium, Thulium, Yterrbium and Lutetium
39RARE EARTH PRICES
CONCLUSION
The issue of rare earth elements discussed in this report is complex and sensitive. The main difficulty is the lack of systematic and authoritative information. The main sources of information used are reports issued by national or intergovernmental authorities (e.g. China, European Union, United States) and by a number of private companies involved in the rare earth sector, from extraction to financing and trading. Research publications also provide valuable information. The challenge is how best to combine this disparate information in order to produce an objective analysis of this delicate issue. This report is the result of a balancing act.
The lack of accurate historical statistics has also been a major challenge. In fact, while some sources of statistics are relatively coherent, most sources show significant contradictions, even within the same country. As a result, efforts were put into data collection in order to provide the reader with the most accurate and reliable statistical information are gleaned from all these sources. This situation is partly due to the lack of structure, organization and monitoring of the value chain, the strategic nature of REEs and the political sensitivity associated with their extraction and trading. The limited size of REEs market helps to explain why no international commodity exchange traded and quoted their prices until the end of 2013. The implementation of the Baotou Rare Earth Products Exchange in China could contribute to addressing this issue in the future depending on which products will be traded and the modalities governing their trading on the market place.
Despite the common denomination of “rare earths” and some common characteristics, such as the
predominant role played by China for about two decades in terms of reserves, production, demand and exports, the 17 rare earth elements have individual markets governed by specific sectoral demand patterns and display various market outlooks. For instance, the evolution of the use of green energies in the world energy mix or the expansion of advanced technologies using REEs in regions where their penetration rate is currently low, but opportunities are high, would likely affect the demand for specific rare earths, their prices and depletion rates in the years to come. In this regard, three out of the eight HREEs (namely, Terbium, Dysprosium and Erbium), plus Yttrium could be in deficit by 2015, exerting upward pressure on prices. On the other hand, the combination of the current reorganization and consolidation of the REE value chain in China and the expansion of extraction and processing facilities around the world could give consuming countries more opportunities to diversify their sources of imports. Together with the development of recycling solutions and availability of substitutes, diversification would contribute to reducing countries’ dependence on rare earth imports, easing pressure on prices.
Global interest with regards to the rare earth issue arose quite recently in the media and in the international agenda, mainly as a result of the price boom of the end of 2010 to the first half of 2011. Given its increasing importance, as discussed in this report, it would be important to monitor this market more carefully. In this regard, international cooperation is probably needed to ensure that data and information on REEs are consistent and reliable. This would contribute to enhancing market transparency and encouraging a more sustainable approach to the extraction and processing of REEs.

BIBLIOGRAPHY

43BIBLIOGRAPHY
Annual report. Molycorp Minerals Inc. (2012)
Annual Report. Quest Rare Minerals Ltd. (2012)
Bae, H., Hurst, D. (2012). Electric Two-Wheel Vehicles in Asia Pacific, Executive summary. PikeResearch. http://www.navigantresearch.com/wp-assets/uploads/2012/04/ETVAP-12-Executive-Summary.pdf
Bailey Grasso, V. (2013). Rare Earth Elements in National Defense: Background, Oversight Issues, and Options for Congress. Congressional Research Service. (17 September 2013). http://www.fas.org/sgp/crs/natsec/R41744.pdf
“Baotou Steel Says China to Stockpile More Rare Earths; Lynas Corp Falls”. MetalMiner. (10 September 2013). http://agmetalminer.com/2013/09/10/baotou-steel-says-china-to-stockpile-more-rare-earths-lynas-corp-falls/
Bauer, D., Diamond, D., Li, J., McKittrick, M., Sandalow, D., Telleen, P. (2011). Critical Materials Strategy. US Department of Energy. (December 2011). http://energy.gov/sites/prod/files/DOE_CMS2011_FINAL_Full.pdf
Billingsley, G. (2012). What is the future of the Rare Earths sector? Great Western Minerals Group Ltd. (25 September 2012). http://fr.slideshare.net/objectivecapital/what-is-the-future-of-the-rare-earths-sector
Blakely, Ch., Cooter, J., Khaitan, A., Sincer, I., Williams, R. (2012). “Rare Earth Metals & China”. Policy Reports. University of Michigan, Gerald R. Ford School of Public Policy. http://sites.fordschool.umich.edu/china-policy/files/2012/09/Rare-Earth-Metals-China.pdf
BP Energy Outlook 2030. BP. (2013)
Bradsher, K. (2013). “China Tries to Clean Up Toxic Legacy of Its Rare Earth Riches”. The New York Times. (22 October 2013)
Bruno, A. (2013). “Kingsnorth believes Rare Earth Element demand and prices to increase”. investorintel.com. (26 July 2013). http://investorintel.com/rare-earth-intel/dudley-kingsnorth-believes-that-ree-demand-and-prices-will-double-by-2015/
Buckley, C. (2010). “Fight for rare earth”. Thomson Reuters. http://www.groenerekenkamer.nl/download/RareEarths.pdf
Ch.-A. Paillard. (2012). “Géopolitique des terres rares - la Chine, l’OMC et les terres rares. Une nouvelle guerre économique en perspective ?” diploweb.com. (2 avril 2012). http://www.diploweb.com/Geopolitique-des-terres-rares.html
Chegwidden, J. Kingsnorth, D. (Undated). Rare earths - an evaluation of current and future supply. http://fr.slideshare.net/RareEarthsRareMetals/rare-earths-an-evaluation-of-current-and-future-supply
“China sets rare earth export quota for second half”. GMA News Online, Agence France Presse. (2 July 2013). http://www.gmanetwork.com/news/story/315543/economy/agricultureandmining/china-sets-rare-earth-export-quota-for-second-half
“China starts trial run of rare earth products exchange”. CCTV.com. (8 November 2013). http://english.cntv.cn/program/newshour/20131108/103194.shtml
Communication from the Commission to the European parliament and the council, the raw materials initiative - meeting our critical needs for growth and jobs in Europe. Commission of the European Communities. (4 November 2008)
Communication from the Commission to the European Parliament, the Council, the European Economic and Social Committee and the Committee of the Regions: Tackling the challenges in commodity markets and on raw materials. European Commission. (2 February 2011)
Corporate Presentation. Quest Rare Minerals Ltd. (July 2013). http://www.questrareminerals.com/
Corporate Presentation. Quest Rare Minerals Ltd. (October 2013). http://www.questrareminerals.com/
44 COMMODITIES AT A GLANCE
Cox, J., Ciuculescu, T., Altman, K., Hwozdyk, L. (2012). Technical report on the eco ridge mine project, Elliot Lake, Ontario, Canada, NI 43-101 Report. Pele Mountain Resources Inc. (20 June 2012). http://www.pelemountain.com/pdfs/SEDAR_RPA%20Pele%20Mountain%20Eco%20Ridge%20FINAL%20-%20June%2020,%202012.pdf
Defining raw materials for the EU - Report of the Ad-hoc Working Group on defining critical raw materials. European Commission. (30 July 2010). https://ec.europa.eu/eip/raw-materials/en/system/files/ged/79%20report-b_en.pdf
Dispute settlement: dispute DS431. China - Measures Related to the Exportation of Rare Earths, Tungsten and Molybdenum. World Trade Organization. http://www.wto.org/english/tratop_e/dispu_e/cases_e/ds431_e.htm
Dispute settlement: dispute DS432. China - Measures Related to the Exportation of Rare Earths, Tungsten and Molybdenum. World Trade Organization. http://www.wto.org/english/tratop_e/dispu_e/cases_e/ds432_e.htm
Dispute settlement: dispute DS433. China - Measures Related to the Exportation of Rare Earths, Tungsten and Molybdenum. World Trade Organization. http://www.wto.org/english/tratop_e/dispu_e/cases_e/ds433_e.htm
Elmquist, S., Yuan, H., (2012). “China Cuts Rare-Earths Mine Permits 41% to Boost Control”. Bloomberg. (14 September 2012). http://www.bloomberg.com/news/2012-09-14/china-cuts-rare-earths-mine-permits-41-to-boost-control-1-.html
“EU challenges China’s rare earth export restrictions”. European Commission. (13 March 2012). http://europa.eu/rapid/press-release_IP-12-239_en.htm
EU Trade Policy for Raw Materials - Second Activity Report. European Commission. (30 May 2012). http://trade.ec.europa.eu/doclib/docs/2012/may/tradoc_149515.pdf
“Ex China reserves and resources of rare earth elements”. AustralianRareEarths.com. http://www.australianrareearths.com/known-rees-resources-reserves.html
Fact sheet. Greenland Minerals and Energy Ltd. http://www.ggg.gl/docs/fact-sheets/GMEL_Fact_Sheet_2012.pdf
Fact Sheet: Rare Earths Oxides (REO). Polinares working paper n°37. (March 2012). http://www.polinares.eu/docs/d2-1/polinares_wp2_annex2_factsheet3_v1_10.pdf
Genito, L. (2013). “Recycling as a response to rare earth elements’ import dependence”. European Parliamentary Research Service. (September 2013). http://epthinktank.eu/2013/09/03/recycling-as-a-response-to-rare-earth-elements-import-dependence/
Gerleman Lucchesi, B. (Undated). “Rare-earth recycling”. The Ames Laboratory (United States). https://www.ameslab.gov/news/inquiry/rare-earth-recycling
Global EV Outlook, understanding the electric vehicle landscape to 2020 - Clean Energy Ministerial (a high-level dialogue among energy ministers from the world’s major economies). Electric Vehicles Initiative, with the participation of the International Energy Agency. (April 2013). http://www.iea.org/publications/globalevoutlook_2013.pdf
Global mobile statistics 2013. mobiThinking. (May 2013). http://mobithinking.com/mobile-marketing-tools/latest-mobile-stats
Global Wind Energy Outlook 2012. Greenpeace International and the Global Wind Energy Council. (November 2012). http://www.gwec.net/wp-content/uploads/2012/11/GWEO_2012_lowRes.pdf
Global wind statistics 2012. Global Wind Energy Council. (February 2013). http://www.gwec.net/wp-content/uploads/2013/02/GWEC-PRstats-2012_english.pdf
Goonan, T. (2011). Rare Earth Elements - End Use and Recyclability. US Geological Survey. http://pubs.usgs.gov/sir/2011/5094/pdf/sir2011-5094.pdf
45BIBLIOGRAPHY
Gowing, M. (2011). 2011 Rare Earth Industry Update: We remain Bullish. Mackie Research Capital Corporation. (8 February 2011). http://www.ggg.gl/userfiles/file/Broker_Research_Reports/Rare_Earth_Mackie_Industry_Update.pdf
“Greenland says yes to uranium, rare earth extraction”. International Centre for Trade and Sustainable Development (ICTSD). (November 2013). http://ictsd.org/i/news/bridgesweekly/178469/
Gschneidner, K.A. (Undated). “The Rare Earth Crisis - The Supply/Demand Situation for 2010–2015”. The Ames Laboratory, U.S. Department of Energy and Department of Materials Science and Engineering, Iowa State University (United States). Material Matters, Volume 6, Article 2. http://www.sigmaaldrich.com/content/dam/sigma-aldrich/articles/material-matters/pdf/the-rare-earth-crisis.pdf
Hatch, G. (2012). “Chinese rare-earth mining quotas for 2012”, Technology Metals Research. (13 May 2012). http://www.techmetalsresearch.com/2012/05/chinese-rare-earth-mining-quotas-for-2012/
Hatch, G. (2012). “The First Round Of Chinese Rare-Earth Export-Quota Allocations for 2013”. Technology Metals Research. (28 December 2012). http://www.techmetalsresearch.com/2012/12/the-first-round-of-chinese-rare-earth-export-quota-allocations-for-2013/
Hatch, G. (2013). “The Second Round of Chinese Rare-Earth Export-Quota Allocations for 2013”. Technology Metals Research. (6 July 2013). http://www.techmetalsresearch.com/2013/07/the-second-round-of-chinese-rare-earth-export-quota-allocations-for-2013/
Hatch, G., Lifton, J. (2012). “Recent dynamics in the rare-earth sector”. Technology Metals Research. (May 2012). http://www.akademisains.gov.my/download/rareearth/symposium/Lifton.pdf
Hendrix, L. (2012). Competition for Strategic Materials. Center for Strategic and International Studies. (16 July 2012). http://csis.org/files/publication/120713_Hendrix_CompetitionStrategicMaterials_Commentary.pdf
Hornby, L., Donnan, S. (2013). “WTO rules against China on rare earths export quotas”. Financial Times. (29 October 2013). http://www.ft.com/intl/cms/s/0/486d5c68-40b5-11e3-ae19-00144feabdc0.html#axzz2sTM0NkWf
Humphries, M., (2012). Rare Earth Elements: The Global Supply Chain. Congressional Research Service. (8 June 2012). http://www.fas.org/sgp/crs/natsec/R41347.pdf
Hurst, C. (2010). China’s Rare Earth Elements Industry: What Can the West Learn? Institute for the Analysis of Global Security. (March 2010). http://fmso.leavenworth.army.mil/documents/rareearth.pdf
(2013). Hybrid and Electric Vehicles - the electric drive gains traction. International Energy Agency. (May 2013). http://www.ieahev.org/assets/1/7/IA-HEV_Annual_Report_May_2013_3MB.pdf
Investor Presentation. Lynas Corporation Ltd. (1 August 2013). http://www.lynascorp.com/Presentations/2013/Investor%20Presentation%20August%202013_final%201242537.pdf
Investor Presentation. Lynas Corporation Ltd. (4 March 2013). http://www.lynascorp.com/Presentations/2013/Investor%20Presentation%20March%202013_final%201200976.pdf
Juan, D. (2013). “First rare-earth products exchange to help stabilize market”. China Daily. (10 August 2013). http://usa.chinadaily.com.cn/business/2013-08/10/content_16884782.htm
Juan, D. (2013). “Rare earths on shaky ground”. China Daily. (9 August 2013). http://usa.chinadaily.com.cn/business/2013-08/09/content_16881435.htm
Kato, Y., Fujinaga, K., Nakamura, K., Takaya, Y., Kitamura, K., Ohta, J., Toda, R., Nakashima, T., Iwamori, H. (2011) “Deep-sea mud in the Pacific Ocean as a potential resource for rare-earth elements”. Nature Geoscience, 4, 535-539. http://www.nature.com/ngeo/journal/v4/n8/full/ngeo1185.html
Kelly, T. Matos, G. (2013). Historical Statistics for Mineral and Material Commodities in the United States. US Geological Survey. http://minerals.usgs.gov/ds/2005/140/
46 COMMODITIES AT A GLANCE
Kingsnorth, D. (2010). The Challenges of Meeting Rare Earths Demand in 2015. Industrial Minerals Company of Australia Pty Ltd (IMCOA). (March 2010).
Kingsnorth, D. (2011). Rare earth opportunities - real or imaginary? (April 2011)
Kingsnorth, D. (2012). The Global Rare Earths Industry: A Delicate Balancing Act. Centre for Research in Energy and Minerals Economics and Industrial Minerals Company of Australia Pty Ltd (IMCOA). (February 2012)
Komnenic, A. (2013). “Greenland says yes to uranium mining”. Mining.com. (25 October 2013). http://www.mining.com/greenland-says-yes-to-uranium-mining-65162/
Komnenic, A. (2013). “Rare earths recycling on the rise”. Mining.com. (29 August 2013). http://www.mining.com/rare-earths-recycling-on-the-rise-82348/
Kosich, D. (2013). “China to begin trial run of rare earth products exchange”. mineweb.com. (12 August 2013). http://www.mineweb.com/mineweb/content/en/mineweb-industrial-metals-minerals-old?oid= 200612&sn=Detail
Lifton, J. (2013). “Counterpoint: Supply and Demand in the Rare-Earths Market 2015-2020”. Technology Metals Research. (1 August 2013). http://www.techmetalsresearch.com/2013/08/counterpoint-supply-and-demand-in-the-rare-earths-market-2015-2020/
Liu, H-W., Maughan, J. (2012). “China’s rare earths export quotas: out of the China-raw materials gate, but past the WTO’s finish line?”. Journal of International Economic Law, 15 (4), 971-1005.
Long, K., Van Gosen, B., Foley. N., Cordier, D. (2010). The Principal Rare Earth Elements Deposits of the United States - A Summary of Domestic Deposits and a Global Perspective. US Geological Survey. http://pubs.usgs.gov/sir/2010/5220/pdf/SIR2010-5220.pdf
Messenger, B. (Undated). Recycling: Rarely so Critical. Waste Management World. http://www.waste-management-world.com/articles/print/volume-12/issue-5/features/recycling-rarely-so-critical.html
(2012). Metal prices in the United States through 2010. US Geological Survey. http://pubs.usgs.gov/sir/2012/5188/sir2012-5188.pdf
Mobile Phone Working Group. (2010). Mobile Phone Partnership Initiative, Basel Convention. (30 June 2010). http://archive.basel.int/industry/mppi/gdfd30Jun2010.pdf
Mobile phones and the environment. UNEP, Basel Convention, Rotterdam Convention, Stockholm Convention, FAO. (Undated)
Morrison, W., Tang, R. (2012). China’s Rare Earth Industry and Export Regime: Economic and Trade Implications for the United States. Congressional Research Service. (30 April 2012). http://www.fas.org/sgp/crs/row/R42510.pdf
Once Ignored On The Periodic Table, Don’t Ignore Them Now - A Rare Earth Element Industry Overview. Canadian Imperial Bank of Commerce (CIBC). (6 March 2011). http://fr.slideshare.net/RareEarthsRareMetals/cibc-report
One Million Electric Vehicles By 2015 - Status Report. US Department of Energy. (February 2011). http://www1.eere.energy.gov/vehiclesandfuels/pdfs/1_million_electric_vehicles_rpt.pdf
Pecht, M., Kaczmarek, R., Song, X., Hazelwood, D., Kavetsky, R., Anand, D.K. (2011). Rare Earth Materials – Insights and concerns”. CALCE EPSC Press, University of Maryland, College Park. http://www.cecd.umd.edu/news-archives/book-rare-earth.html
Philipps, D. (2011). Rare Earth metals. Postnote number 368. The Parliamentary Office of Science and Technology
Piedra, P. (2012). Quarterly Commodity Insights Bulletin – rare earth metal. Q1-2012. KPMG. (June 2012)
Piedra, P. (2012). Quarterly Commodity Insights Bulletin – rare earth metal. Q3-2012 & Q2-2012. KPMG. (October 2012)
47BIBLIOGRAPHY
Rare Earth Element Mines, Deposits, and Occurrences. US Geological Survey. (2002). http://pubs.usgs.gov/of/2002/of02-189/of02-189.pdf
Rare Earth Elements – The basics, economics supply chain and applications. Avalon Rare Metals Inc. (Undated). http://www.avalonraremetals.com/_resources/REE101-2012efile.pdf
Rare Earth Elements 101. IAM Gold Corporation. (April 2012). http://www.iamgold.com/files/REE101_April_2012.pdf
Rare Earth Elements 101. IAM Gold Corporation. (February 2012). http://www.iamgold.com/files/REE101.pdf
Rare Earth Elements. NERC, British Geological Survey. (November 2011)
Rare earth industry assessment and price forecast. Tantalus Rare Earths AG. (30 December 2012). http://www. tre-ag.com/~/media/Files/T/Tantalus-Rare-Earths/Attachments/pdf/Asian%20Metal%20-%20Updated%20Rare%20Earth%20Market%20Assessment%20and%20Price%20Forecast%20301212.pdf
Rare Earth: An Introduction. Baotou National Rare-Earth High-Tech Industrial Development Zone. (Undated). http://www.rev.cn/en/int.htm
Rare Earths, Mineral Commodity Summaries. US Geological Survey (various issues). http://minerals.usgs.gov/minerals/pubs/commodity/rare_earths/index.html
Rare Earths, Minerals Yearbook. US Geological Survey (various issues). http://minerals.usgs.gov/minerals/pubs/commodity/rare_earths/index.html
REE Supply and Demand. Great Western Minerals Group Ltd. (Undated). http://www.gwmg.ca/html/about_rare_earth_elements/key_stistics/index.cfm
Reisman, D., Weber, R., Northeim, C., Guthrie, S., Cunningham, J., Wolf, S. (2012). Rare Earth Elements: A Review of Production, Processing, Recycling, and Associated Environmental Issues. United States Environmental Protection Agency. (December 2012). http://nepis.epa.gov/Adobe/PDF/P100EUBC.pdf
“Remarks by the President on Fair Trade”. The White House. (13 March 2012). http://www.whitehouse.gov/the-press-office/2012/03/13/remarks-president-fair-trade
Remeur, C. (2013). Rare earth elements and recycling possibilities. Library of the European Parliament. (2 May 2013). http://www.europarl.europa.eu/RegData/bibliotheque/briefing/2013/130514/LDM_BRI (2013)130514_REV1_EN.pdf
Robinson, D. (Undated). CSIRO and the rare earths industry. Commonwealth Scientific and Industrial Research Organization (CSIRO)
Sandalow, D., Bauer, D., Diamond, D., Li, J., Telleen, P., Wanner, B. (2010). Critical Materials Strategy, US Department of Energy. (December 2010). http://energy.gov/sites/prod/files/edg/news/documents/criticalmaterialsstrategy.pdf.
Schüler, D. (2011). Rare earths - facts and figures. Öko-Institut e.V. (January 2011). http://www.oeko. de/oekodoc/1111/2011-002-en.pdf
Schüler, D., Buchert, M., Liu, R., Dittrich, S., Merz, C. (2011). Study on rare earths and their recycling. Öko-Institut e.V. (January 2011). http://www.oeko.de/oekodoc/1112/2011-003-en.pdf
Shaw, S. Chegwidden, J. (2012). Global drivers for rare earth demand. Roskill Information Services. (August 2012).
Situation and policies of China’s rare earth industry. Information Office of the State Council, The People’s Republic of China. (June 2012). http://ycls.miit.gov.cn/n11293472/n11295125/n11299425/n14676844.files/n14675980.pdf
Stanway, D. (2011). “China could become net rare earth importer by 2015 – Molycorp”. Reuters. (9 March 2011). http://www.reuters.com/article/2011/03/10/china-rareearth-molycorp-idAFTOE72901L20110310
48 COMMODITIES AT A GLANCE
Strategic and critical materials 2013 - Report on stockpile requirements office, Department of Defense. (January 2013). http://www.cecd.umd.edu/publications/Argonne%20Lab/Report%20Nat%20Def%20Stockpile%20Requirements%202013.pdf
Topf, A. (2013). “Chinese Stockpiling Around the Corner”. Rare Earth Investing News. (2 September 2013). http://rareearthinvestingnews.com/15348-chinese-stockpiling-around-the-corner.html.
Tse, P-K., (2011). China’s rare-earth industry. US Geological Survey. http://pubs.usgs.gov/of/2011/1042/of2011-1042.pdf
Vahl, K., Scrutton, A. (2013). “Greenland votes to allow uranium, rare earths mining”. Reuters. (25 October 2013). http://www.reuters.com/article/2013/10/25/us-greenland-uranium-idUSBRE99O05A20131025
World Energy Outlook 2013. International Energy Agency. (12 November 2013). http://www.worldenergyoutlook.org/publications/weo-2013/
Zhanheng, C. (2010). Outline on the development and policies of China rare earth industry. Chinese Society of Rare Earths. (7 April 2010)
Zhanheng, C. (2011). “Rare earth protection plan”. China Daily. (28 May 2011). http://www.chinadaily.com.cn/opinion/2011-05/28/content_12596658.htm
Zhanheng, C. (2011). China’s Role in a Changing Global Rare Earths Market. Chinese Society of Rare Earths. (21-22 January 2011). http://www.lynascorp.com/Industry%20Articles%20Files/CSRE_Presentation_FINAL.pdf
Zhanheng, C. (2011). Global rare earth resources and scenarios of future rare earth industry. Chinese Society of Rare Earths. (17 January 2011)
Zhanheng, C. (Undated). China Rare Earth Industry: Resources, Domestic Market and Environment. Chinese Society of Rare Earths
Zhanheng, C. (Undated). Export of rare earths in 2012 and 1H of 2013. Chinese Society of Rare Earths
Zhanheng, C. (Undated). Rare earth supply and demand in the post-WTO Era. Chinese Society of Rare Earths
Zhuoqiong, W. (2013). “China to increase rare earth purchase”. China Daily. (24 September 2013). http://usa.chinadaily.com.cn/business/2013-09/24/content_16989052.htm
U N I T E D N AT I O N S C O N F E R E N C E O N T R A D E A N D D E V E L O P M E N T
N°5
Special issue on rare earthsCOMMODITIES AT A GLANCE
Printed at United Nations, Geneva – GE.14-50515 – May 2014 – 984 – UNCTAD/SUC/2014/1