Embed Size (px)
Citation preview
24 JR EAST Technical Review-No.10
Special edition paperSpecial edition paperSpecial edition paperSpecial edition paperSpecial edition paperSpecial edition paperSpecial edition paperSpecial edition paperSpecial edition paperSpecial edition paperSpecial edition paperSpecial edition paperSpecial edition paper
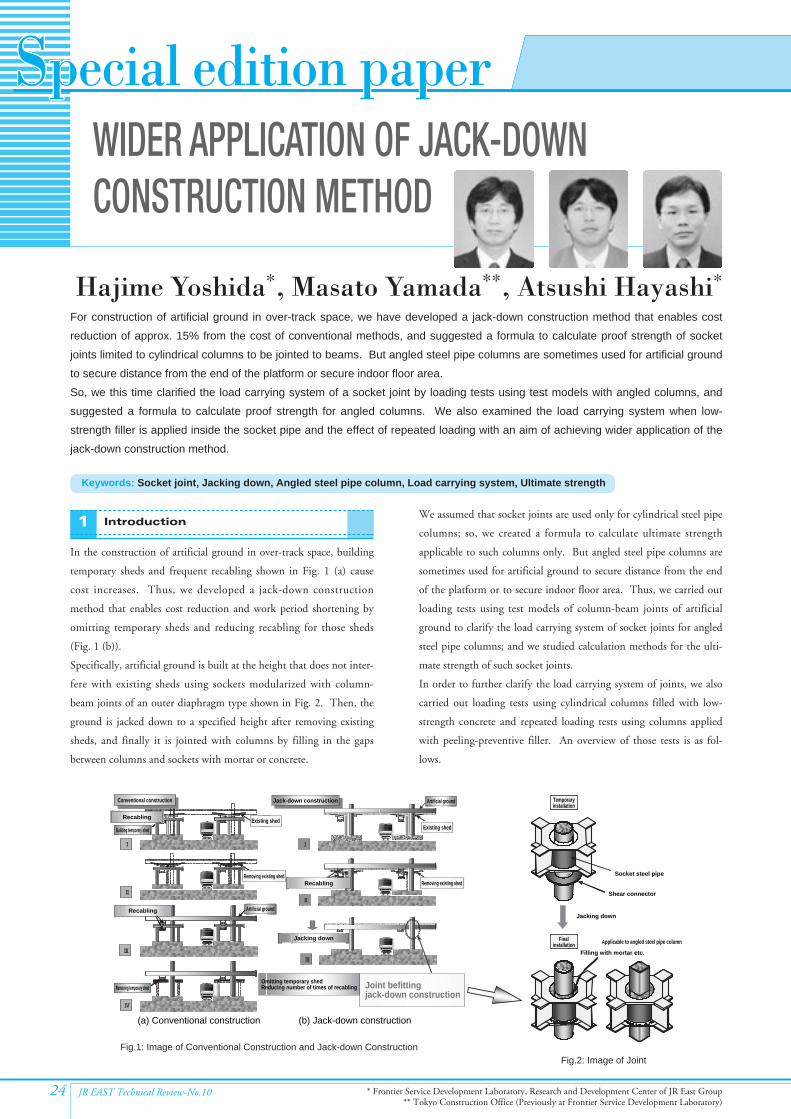
In the construction of artificial ground in over-track space, building
temporary sheds and frequent recabling shown in Fig. 1 (a) cause
cost increases. Thus, we developed a jack-down construction
method that enables cost reduction and work period shortening by
omitting temporary sheds and reducing recabling for those sheds
(Fig. 1 (b)).
Specifically, artificial ground is built at the height that does not inter-
fere with existing sheds using sockets modularized with column-
beam joints of an outer diaphragm type shown in Fig. 2. Then, the
ground is jacked down to a specified height after removing existing
sheds, and finally it is jointed with columns by filling in the gaps
between columns and sockets with mortar or concrete.
We assumed that socket joints are used only for cylindrical steel pipe
columns; so, we created a formula to calculate ultimate strength
applicable to such columns only. But angled steel pipe columns are
sometimes used for artificial ground to secure distance from the end
of the platform or to secure indoor floor area. Thus, we carried out
loading tests using test models of column-beam joints of artificial
ground to clarify the load carrying system of socket joints for angled
steel pipe columns; and we studied calculation methods for the ulti-
mate strength of such socket joints.
In order to further clarify the load carrying system of joints, we also
carried out loading tests using cylindrical columns filled with low-
strength concrete and repeated loading tests using columns applied
with peeling-preventive filler. An overview of those tests is as fol-
lows.
Special edition paperSpecial edition paperSpecial edition paperSpecial edition paperSpecial edition paperSpecial edition paperSpecial edition paperSpecial edition paperSpecial edition paperSpecial edition paperSpecial edition paperSpecial edition paperSpecial edition paperSpecial edition paper
For construction of artificial ground in over-track space, we have developed a jack-down construction method that enables cost
reduction of approx. 15% from the cost of conventional methods, and suggested a formula to calculate proof strength of socket
joints limited to cylindrical columns to be jointed to beams. But angled steel pipe columns are sometimes used for artificial ground
to secure distance from the end of the platform or secure indoor floor area.
So, we this time clarified the load carrying system of a socket joint by loading tests using test models with angled columns, and
suggested a formula to calculate proof strength for angled columns. We also examined the load carrying system when low-
strength filler is applied inside the socket pipe and the effect of repeated loading with an aim of achieving wider application of the
jack-down construction method.
WIDER APPLICATION OF JACK-DOWN CONSTRUCTION METHOD
Hajime Yoshida*, Masato Yamada**, Atsushi Hayashi*
Introduction1
Keywords: Socket joint, Jacking down, Angled steel pipe column, Load carrying system, Ultimate strength
* Frontier Service Development Laboratory, Research and Development Center of JR East Group** Tokyo Construction Office (Previously at Frontier Service Development Laboratory)
(a) Conventional construction
Conventional construction
Building temporary shed
Removing temporary shed
RecablingExisting shed
Existing shed
Jack-down construction
Removing existing shedRemoving existing shed
Artificial ground
Artificial ground Temporaryinstallation
Finalinstallation
Socket steel pipe
Shear connector
Jacking down
Applicable to angled steel pipe column
Filling with mortar etc.
Recabling
Recabling
Jacking down
Omitting temporary shedReducing number of times of recabling Joint befitting
jack-down construction
(b) Jack-down construction
Fig.1: Image of Conventional Construction and Jack-down ConstructionFig.2: Image of Joint
25JR EAST Technical Review-No.10
Special edition paper
2.1.2 Loading Method
We selected one-side monotonic loading at the point shown in Fig.
3. Loading was carried out until the test model was broken or up to
approx. 200 mm, the stroke limit of the jack.
We measured load carrying capacity, displacement of the specified
points, and strain of the socket steel pipe, column steel pipe, and
outer diaphragm.
2.2 Test Results and Considerations
2.2.1 Destruction Process and Status
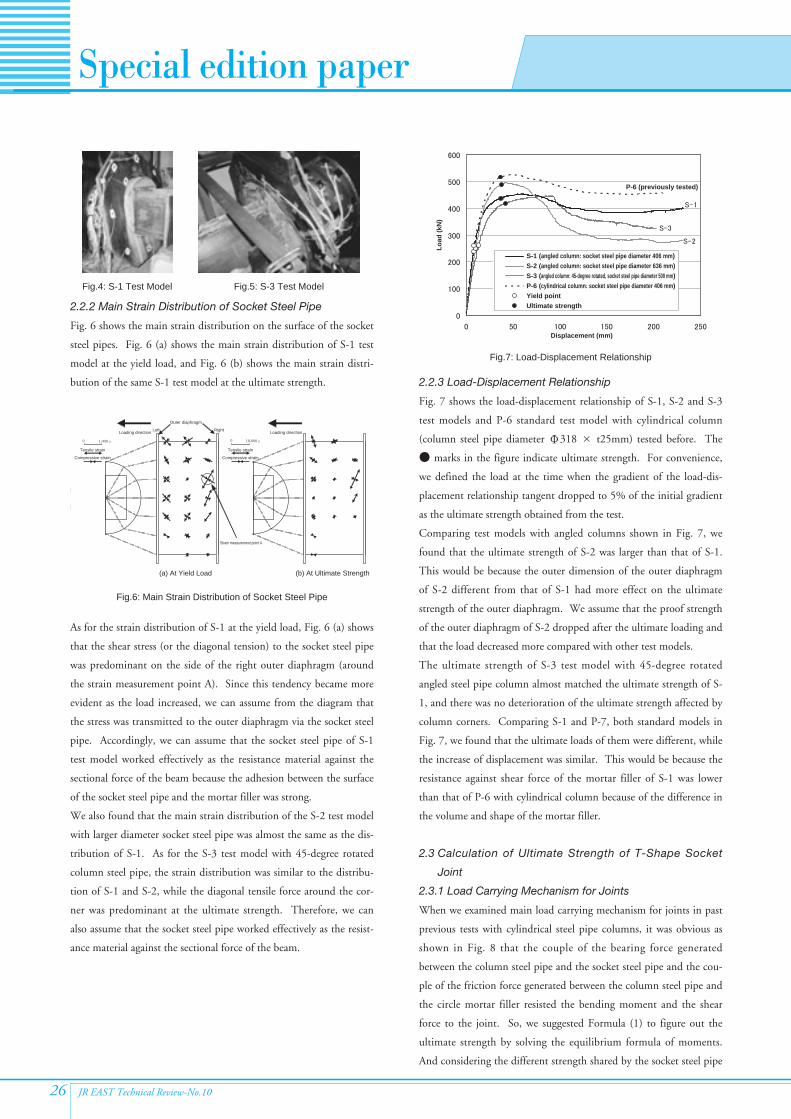
First, we will explain the destruction of the standard S-1 test model.
Cracking occurred on the side of the mortar filler by the corner of
the angled steel pipe, and it developed as loading was repeated. We
found gaps between the mortar filler and the socket steel pipe and
between the mortar filler and the steel pipe column. Then the strain
at a part of the socket steel pipe increased in a 45-degree angle direc-
tion to the circumference and reached the yield strain. As the load
increased, the crack further developed and the mortar filler came off.
Both gaps became larger. The black skin of the outer diaphragm
peeled off. Shear deformation of the socket steel pipe developed.
Outside deformation of the outer diaphragm also developed. Finally,
we suspended the test when the displacement at the loading point
reached 250 mm.
S-2 and S-3 test models also broke almost the same way as the S-1
test model, while they differed from S-1 in the position and the
direction of the yield strain and damage of each part. Fig. 4 shows
the destruction of S-1 test model and Fig. 5 shows the destruction of
S-3 test model.
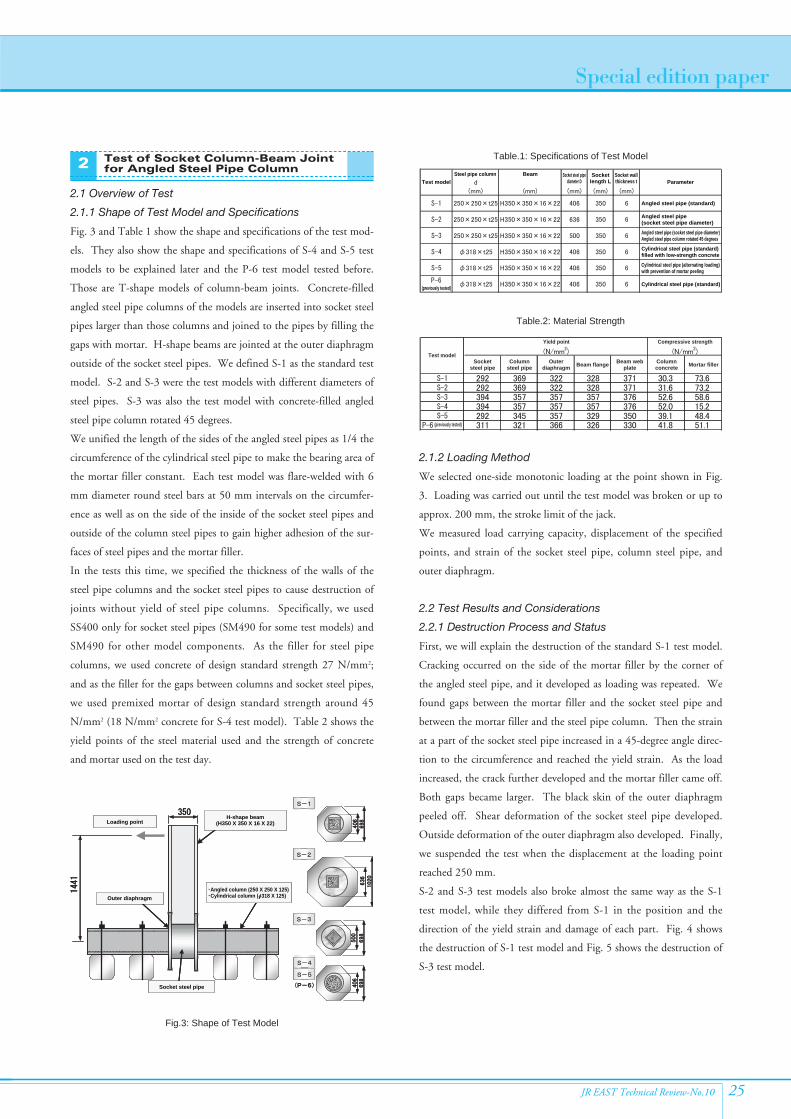
2.1 Overview of Test
2.1.1 Shape of Test Model and Specifications
Fig. 3 and Table 1 show the shape and specifications of the test mod-
els. They also show the shape and specifications of S-4 and S-5 test
models to be explained later and the P-6 test model tested before.
Those are T-shape models of column-beam joints. Concrete-filled
angled steel pipe columns of the models are inserted into socket steel
pipes larger than those columns and joined to the pipes by filling the
gaps with mortar. H-shape beams are jointed at the outer diaphragm
outside of the socket steel pipes. We defined S-1 as the standard test
model. S-2 and S-3 were the test models with different diameters of
steel pipes. S-3 was also the test model with concrete-filled angled
steel pipe column rotated 45 degrees.
We unified the length of the sides of the angled steel pipes as 1/4 the
circumference of the cylindrical steel pipe to make the bearing area of
the mortar filler constant. Each test model was flare-welded with 6
mm diameter round steel bars at 50 mm intervals on the circumfer-
ence as well as on the side of the inside of the socket steel pipes and
outside of the column steel pipes to gain higher adhesion of the sur-
faces of steel pipes and the mortar filler.
In the tests this time, we specified the thickness of the walls of the
steel pipe columns and the socket steel pipes to cause destruction of
joints without yield of steel pipe columns. Specifically, we used
SS400 only for socket steel pipes (SM490 for some test models) and
SM490 for other model components. As the filler for steel pipe
columns, we used concrete of design standard strength 27 N/mm2;
and as the filler for the gaps between columns and socket steel pipes,
we used premixed mortar of design standard strength around 45
N/mm2 (18 N/mm2 concrete for S-4 test model). Table 2 shows the
yield points of the steel material used and the strength of concrete
and mortar used on the test day.
Test of Socket Column-Beam Jointfor Angled Steel Pipe Column2
Loading pointH-shape beam
(H350 X 350 X 16 X 22)
・Angled column (250 X 250 X 125)・Cylindrical column (φ318 X 125)Outer diaphragm
Socket steel pipe
Fig.3: Shape of Test Model
Test model
(previously tested)
Steel pipe column Beam Socket steel pipediameter D
Socketlength L
Socket wallthickness t Parameter
Angled steel pipe (standard)
Angled steel pipe(socket steel pipe diameter)
Cylindrical steel pipe (standard)filled with low-strength concrete
Angled steel pipe (socket steel pipe diameter)Angled steel pipe column rotated 45 degrees
Cylindrical steel pipe (alternating loading)with prevention of mortar peeling
Cylindrical steel pipe (standard)
Table.1: Specifications of Test Model
Test model
(previously tested)
Yield point Compressive strength
Socketsteel pipe
Columnsteel pipe
Outerdiaphragm
Beam webplate
Columnconcrete Mortar fillerBeam flange
Table.2: Material Strength
26 JR EAST Technical Review-No.10
Special edition paper
2.2.3 Load-Displacement Relationship
Fig. 7 shows the load-displacement relationship of S-1, S-2 and S-3
test models and P-6 standard test model with cylindrical column
(column steel pipe diameter Φ318 × t25mm) tested before. The
● marks in the figure indicate ultimate strength. For convenience,
we defined the load at the time when the gradient of the load-dis-
placement relationship tangent dropped to 5% of the initial gradient
as the ultimate strength obtained from the test.
Comparing test models with angled columns shown in Fig. 7, we
found that the ultimate strength of S-2 was larger than that of S-1.
This would be because the outer dimension of the outer diaphragm
of S-2 different from that of S-1 had more effect on the ultimate
strength of the outer diaphragm. We assume that the proof strength
of the outer diaphragm of S-2 dropped after the ultimate loading and
that the load decreased more compared with other test models.
The ultimate strength of S-3 test model with 45-degree rotated
angled steel pipe column almost matched the ultimate strength of S-
1, and there was no deterioration of the ultimate strength affected by
column corners. Comparing S-1 and P-7, both standard models in
Fig. 7, we found that the ultimate loads of them were different, while
the increase of displacement was similar. This would be because the
resistance against shear force of the mortar filler of S-1 was lower
than that of P-6 with cylindrical column because of the difference in
the volume and shape of the mortar filler.
2.3 Calculation of Ultimate Strength of T-Shape Socket
Joint
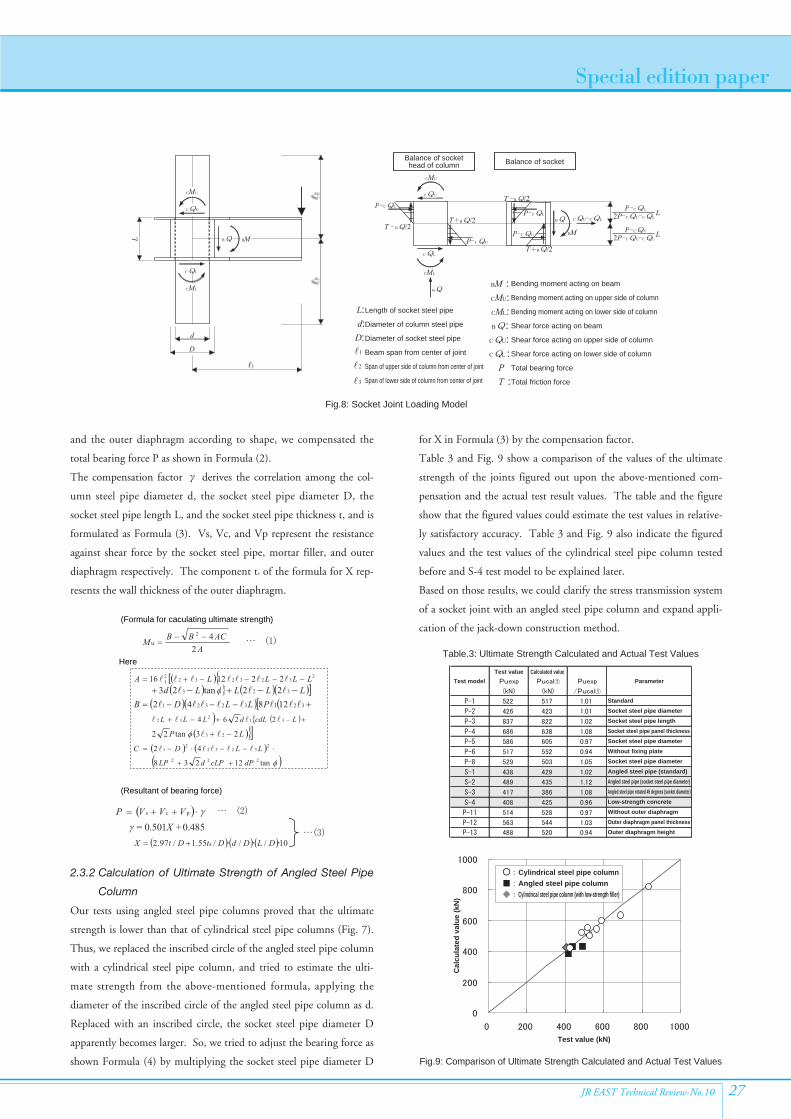
2.3.1 Load Carrying Mechanism for Joints
When we examined main load carrying mechanism for joints in past
previous tests with cylindrical steel pipe columns, it was obvious as
shown in Fig. 8 that the couple of the bearing force generated
between the column steel pipe and the socket steel pipe and the cou-
ple of the friction force generated between the column steel pipe and
the circle mortar filler resisted the bending moment and the shear
force to the joint. So, we suggested Formula (1) to figure out the
ultimate strength by solving the equilibrium formula of moments.
And considering the different strength shared by the socket steel pipe
2.2.2 Main Strain Distribution of Socket Steel Pipe
Fig. 6 shows the main strain distribution on the surface of the socket
steel pipes. Fig. 6 (a) shows the main strain distribution of S-1 test
model at the yield load, and Fig. 6 (b) shows the main strain distri-
bution of the same S-1 test model at the ultimate strength.
As for the strain distribution of S-1 at the yield load, Fig. 6 (a) shows
that the shear stress (or the diagonal tension) to the socket steel pipe
was predominant on the side of the right outer diaphragm (around
the strain measurement point A). Since this tendency became more
evident as the load increased, we can assume from the diagram that
the stress was transmitted to the outer diaphragm via the socket steel
pipe. Accordingly, we can assume that the socket steel pipe of S-1
test model worked effectively as the resistance material against the
sectional force of the beam because the adhesion between the surface
of the socket steel pipe and the mortar filler was strong.
We also found that the main strain distribution of the S-2 test model
with larger diameter socket steel pipe was almost the same as the dis-
tribution of S-1. As for the S-3 test model with 45-degree rotated
column steel pipe, the strain distribution was similar to the distribu-
tion of S-1 and S-2, while the diagonal tensile force around the cor-
ner was predominant at the ultimate strength. Therefore, we can
also assume that the socket steel pipe worked effectively as the resist-
ance material against the sectional force of the beam.
Fig.4: S-1 Test Model Fig.5: S-3 Test Model
Tensile strain
Loading direction Loading direction
Outer diaphragm
Strain measurement point A
Left Right
Compressive strain
Tensile strain
Compressive strain
(a) At Yield Load (b) At Ultimate Strength
Fig.6: Main Strain Distribution of Socket Steel Pipe
Lo
ad (
kN)
Displacement (mm)
P-6 (previously tested)
S-1 (angled column: socket steel pipe diameter 406 mm)S-2 (angled column: socket steel pipe diameter 636 mm)S-3 (angled column: 45-degree rotated, socket steel pipe diameter 500 mm)P-6 (cylindrical column: socket steel pipe diameter 406 mm)Yield pointUltimate strength
Fig.7: Load-Displacement Relationship
27JR EAST Technical Review-No.10
Special edition paper
for X in Formula (3) by the compensation factor.
Table 3 and Fig. 9 show a comparison of the values of the ultimate
strength of the joints figured out upon the above-mentioned com-
pensation and the actual test result values. The table and the figure
show that the figured values could estimate the test values in relative-
ly satisfactory accuracy. Table 3 and Fig. 9 also indicate the figured
values and the test values of the cylindrical steel pipe column tested
before and S-4 test model to be explained later.
Based on those results, we could clarify the stress transmission system
of a socket joint with an angled steel pipe column and expand appli-
cation of the jack-down construction method.
and the outer diaphragm according to shape, we compensated the
total bearing force P as shown in Formula (2).
The compensation factor γ derives the correlation among the col-
umn steel pipe diameter d, the socket steel pipe diameter D, the
socket steel pipe length L, and the socket steel pipe thickness t, and is
formulated as Formula (3). Vs, Vc, and Vp represent the resistance
against shear force by the socket steel pipe, mortar filler, and outer
diaphragm respectively. The component ts of the formula for X rep-
resents the wall thickness of the outer diaphragm.
2.3.2 Calculation of Ultimate Strength of Angled Steel Pipe
Column
Our tests using angled steel pipe columns proved that the ultimate
strength is lower than that of cylindrical steel pipe columns (Fig. 7).
Thus, we replaced the inscribed circle of the angled steel pipe column
with a cylindrical steel pipe column, and tried to estimate the ulti-
mate strength from the above-mentioned formula, applying the
diameter of the inscribed circle of the angled steel pipe column as d.
Replaced with an inscribed circle, the socket steel pipe diameter D
apparently becomes larger. So, we tried to adjust the bearing force as
shown Formula (4) by multiplying the socket steel pipe diameter D
Balance of sockethead of column
Length of socket steel pipe
Diameter of column steel pipe
Diameter of socket steel pipe
Beam span from center of joint
Span of upper side of column from center of joint
Span of lower side of column from center of joint
Bending moment acting on beam
Bending moment acting on upper side of column
Bending moment acting on lower side of column
Shear force acting on beam
Shear force acting on upper side of column
Shear force acting on lower side of column
Total bearing force
Total friction force
Balance of socket
Fig.8: Socket Joint Loading Model
(Formula for caculating ultimate strength)
(Resultant of bearing force)
Here
Test model Parameter
Standard
Socket steel pipe diameter
Socket steel pipe length
Socket steel pipe panel thickness
Socket steel pipe diameter
Without fixing plate
Socket steel pipe diameter
Angled steel pipe (standard)
Angled steel pipe (socket steel pipe diameter)
Angled steel pipe rotated 45 degrees (socket diameter)
Low-strength concrete
Without outer diaphragm
Outer diaphragm panel thickness
Outer diaphragm height
Test value Calculated value
Table.3: Ultimate Strength Calculated and Actual Test Values
Cal
cula
ted
val
ue
(kN
)
Test value (kN)
Cylindrical steel pipe columnAngled steel pipe columnCylindrical steel pipe column (with low-strength filler)
Fig.9: Comparison of Ultimate Strength Calculated and Actual Test Values
28 JR EAST Technical Review-No.10
Special edition paper
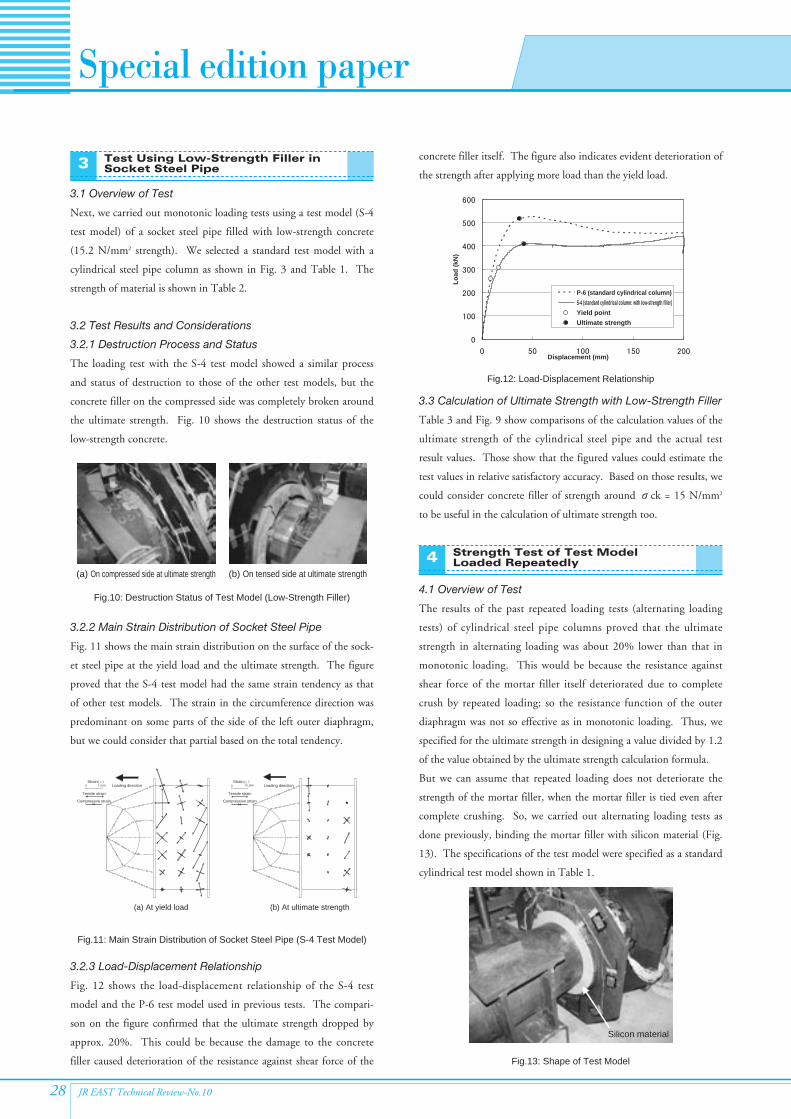
3.1 Overview of Test
Next, we carried out monotonic loading tests using a test model (S-4
test model) of a socket steel pipe filled with low-strength concrete
(15.2 N/mm2 strength). We selected a standard test model with a
cylindrical steel pipe column as shown in Fig. 3 and Table 1. The
strength of material is shown in Table 2.
3.2 Test Results and Considerations
3.2.1 Destruction Process and Status
The loading test with the S-4 test model showed a similar process
and status of destruction to those of the other test models, but the
concrete filler on the compressed side was completely broken around
the ultimate strength. Fig. 10 shows the destruction status of the
low-strength concrete.
3.2.2 Main Strain Distribution of Socket Steel Pipe
Fig. 11 shows the main strain distribution on the surface of the sock-
et steel pipe at the yield load and the ultimate strength. The figure
proved that the S-4 test model had the same strain tendency as that
of other test models. The strain in the circumference direction was
predominant on some parts of the side of the left outer diaphragm,
but we could consider that partial based on the total tendency.
3.2.3 Load-Displacement Relationship
Fig. 12 shows the load-displacement relationship of the S-4 test
model and the P-6 test model used in previous tests. The compari-
son on the figure confirmed that the ultimate strength dropped by
approx. 20%. This could be because the damage to the concrete
filler caused deterioration of the resistance against shear force of the
concrete filler itself. The figure also indicates evident deterioration of
the strength after applying more load than the yield load.
3.3 Calculation of Ultimate Strength with Low-Strength Filler
Table 3 and Fig. 9 show comparisons of the calculation values of the
ultimate strength of the cylindrical steel pipe and the actual test
result values. Those show that the figured values could estimate the
test values in relative satisfactory accuracy. Based on those results, we
could consider concrete filler of strength around σck = 15 N/mm2
to be useful in the calculation of ultimate strength too.
4.1 Overview of Test
The results of the past repeated loading tests (alternating loading
tests) of cylindrical steel pipe columns proved that the ultimate
strength in alternating loading was about 20% lower than that in
monotonic loading. This would be because the resistance against
shear force of the mortar filler itself deteriorated due to complete
crush by repeated loading; so the resistance function of the outer
diaphragm was not so effective as in monotonic loading. Thus, we
specified for the ultimate strength in designing a value divided by 1.2
of the value obtained by the ultimate strength calculation formula.
But we can assume that repeated loading does not deteriorate the
strength of the mortar filler, when the mortar filler is tied even after
complete crushing. So, we carried out alternating loading tests as
done previously, binding the mortar filler with silicon material (Fig.
13). The specifications of the test model were specified as a standard
cylindrical test model shown in Table 1.
Test Using Low-Strength Filler inSocket Steel Pipe3
Strength Test of Test ModelLoaded Repeatedly4
Fig.10: Destruction Status of Test Model (Low-Strength Filler)
(a) On compressed side at ultimate strength (b) On tensed side at ultimate strength
Lo
ad (
kN)
P-6 (standard cylindrical column)
S-4 (standard cylindrical column: with low-strength filler)
Yield point
Ultimate strength
Displacement (mm)
Fig.12: Load-Displacement Relationship
Silicon material
Fig.13: Shape of Test Model
(a) At yield load
Strain Strain
Tensile strain
Compressive strain
Tensile strain
Compressive strain
Loading direction Loading direction
(b) At ultimate strength
Fig.11: Main Strain Distribution of Socket Steel Pipe (S-4 Test Model)
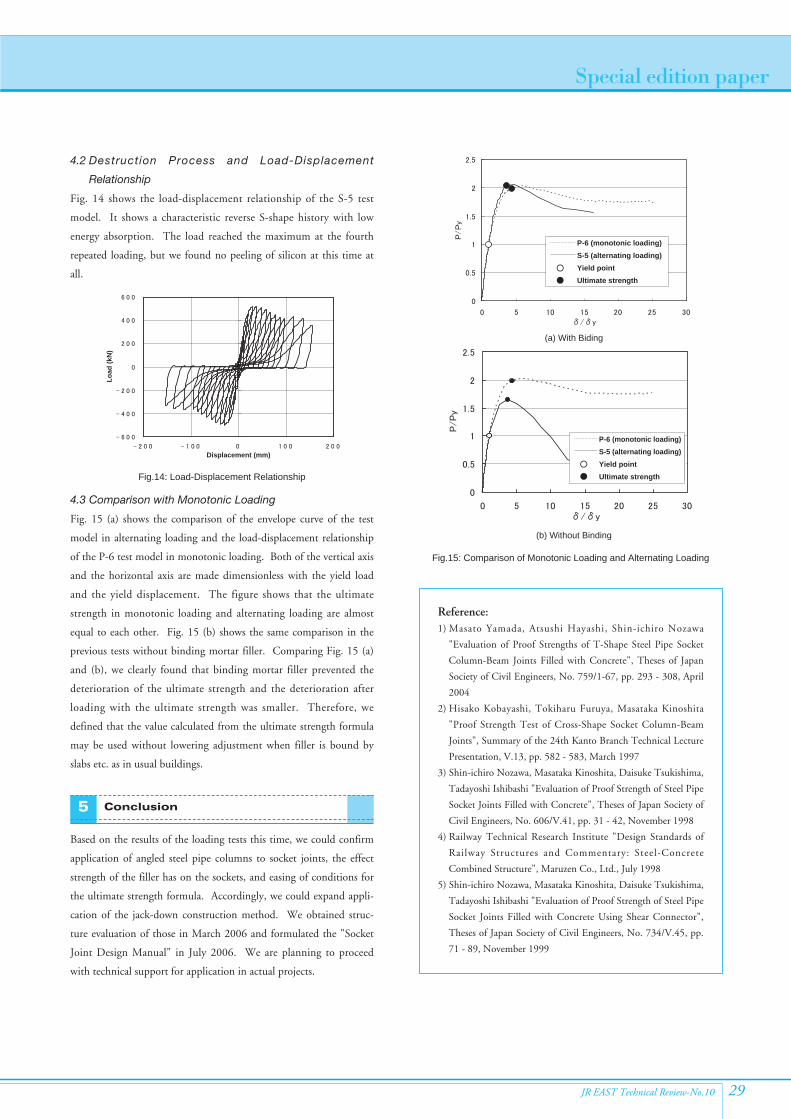
4.2 Destruction Process and Load-Displacement
Relationship
Fig. 14 shows the load-displacement relationship of the S-5 test
model. It shows a characteristic reverse S-shape history with low
energy absorption. The load reached the maximum at the fourth
repeated loading, but we found no peeling of silicon at this time at
all.
4.3 Comparison with Monotonic Loading
Fig. 15 (a) shows the comparison of the envelope curve of the test
model in alternating loading and the load-displacement relationship
of the P-6 test model in monotonic loading. Both of the vertical axis
and the horizontal axis are made dimensionless with the yield load
and the yield displacement. The figure shows that the ultimate
strength in monotonic loading and alternating loading are almost
equal to each other. Fig. 15 (b) shows the same comparison in the
previous tests without binding mortar filler. Comparing Fig. 15 (a)
and (b), we clearly found that binding mortar filler prevented the
deterioration of the ultimate strength and the deterioration after
loading with the ultimate strength was smaller. Therefore, we
defined that the value calculated from the ultimate strength formula
may be used without lowering adjustment when filler is bound by
slabs etc. as in usual buildings.
Based on the results of the loading tests this time, we could confirm
application of angled steel pipe columns to socket joints, the effect
strength of the filler has on the sockets, and easing of conditions for
the ultimate strength formula. Accordingly, we could expand appli-
cation of the jack-down construction method. We obtained struc-
ture evaluation of those in March 2006 and formulated the "Socket
Joint Design Manual" in July 2006. We are planning to proceed
with technical support for application in actual projects.
29JR EAST Technical Review-No.10
Special edition paper
Conclusion5
Reference:1) Masato Yamada, Atsushi Hayashi, Shin-ichiro Nozawa
"Evaluation of Proof Strengths of T-Shape Steel Pipe Socket
Column-Beam Joints Filled with Concrete", Theses of Japan
Society of Civil Engineers, No. 759/1-67, pp. 293 - 308, April
2004
2) Hisako Kobayashi, Tokiharu Furuya, Masataka Kinoshita
"Proof Strength Test of Cross-Shape Socket Column-Beam
Joints", Summary of the 24th Kanto Branch Technical Lecture
Presentation, V.13, pp. 582 - 583, March 1997
3) Shin-ichiro Nozawa, Masataka Kinoshita, Daisuke Tsukishima,
Tadayoshi Ishibashi "Evaluation of Proof Strength of Steel Pipe
Socket Joints Filled with Concrete", Theses of Japan Society of
Civil Engineers, No. 606/V.41, pp. 31 - 42, November 1998
4) Railway Technical Research Institute "Design Standards of
Railway Structures and Commentary: Steel-Concrete
Combined Structure", Maruzen Co., Ltd., July 1998
5) Shin-ichiro Nozawa, Masataka Kinoshita, Daisuke Tsukishima,
Tadayoshi Ishibashi "Evaluation of Proof Strength of Steel Pipe
Socket Joints Filled with Concrete Using Shear Connector",
Theses of Japan Society of Civil Engineers, No. 734/V.45, pp.
71 - 89, November 1999
Lo
ad (
kN)
Displacement (mm)
Fig.14: Load-Displacement Relationship
(a) With Biding
P-6 (monotonic loading)
S-5 (alternating loading)
Yield point
Ultimate strength
P-6 (monotonic loading)
S-5 (alternating loading)
Yield point
Ultimate strength
(b) Without Binding
Fig.15: Comparison of Monotonic Loading and Alternating Loading


![Advancement of the JR EAST Group's Inbound Strategy[PDF/1.0MB]](https://img.pdfslide.us/doc/110x75/589eea5e1a28ab814a8c1f1b/advancement-of-the-jr-east-groups-inbound-strategypdf10mb.jpg)