Embed Size (px)
Citation preview

1
Special Economic Zones:
Are They Good for the Country?
Ram Krishna Ranjan
CCS Working Paper No. 156 Summer Research Internship Program 2006
Centre for Civil Society www.ccs.in

2
Contents
i. Executive summary
ii. Major findings
Section-1 (SEZ policy: An overview)
1.1 Introduction
1.2 Evolution of EPZs/SEZ in India
1.3 How SEZs are different from EPZs
1.4 Objectives of SEZ policy
1.5 Establishing SEZs
1.6 Setting up units
1.7 Important features of SEZ policy and incentives given to SEZ
Section-2 (Performance Analysis)
Introduction
2.1 Share in total exports: aggregate analysis
2.2 FDI inflow and employment generation
Section-3 (International Experience)
3.1 Comparative study of China
3.2 Comparative study with other countries
Section-4 (Case Study)
4.1 Introduction
4.2 Reasons for NSEZ’s success
Section- 5 (Policy Analysis: a critical approach)
4.1 Corporate Welfare
4.2 Real Estate Scam
4.3 Migration
4.4 Labour Policy
4.5 Heavy Economic Cost
4.6 Conclusion

3
Executive Summary
India over the past decade has progressively opened up its economy to effectively face new challenges and opportunities of the 21st Century. To compete in the global market, the Government of India (GoI) has liberalized export policies & licensing of technology and implemented tax reforms providing various incentives. Special Economic Zone (SEZ) policy is also one of the steps India has taken to boost economic growth through outward looking approach. Special economic zone is a specifically duty fee enclave and shall be deemed to be foreign territory for the purpose of trade operations and duties and tariffs. When SEZ policy was introduced in the country, it made headlines and people started considering it as a policy to create a hassle free and investment friendly environment.
The main objective of this research paper is to analyze SEZ policy in terms of export performance, FDI inflow, employment generation and overall physical and financial infrastructure building. This research paper tries to investigate whether having these policies are good for the country or not. SEZs are a larger variant of Export Processing Zone (EPZ), thus performance of EPZ has also been discussed briefly. It has been five years now since all then existing EPZs have been converted into SEZs. Section –II has been devoted to performance analysis of these zones.
After the failure of EPZs, a significant change has been made in the rules/regulations and a new package of fiscal and non- fiscal incentives is also being offered to developers and units. According to Finance Msinistry, the government has to forego about Rs. 90,000 crore in direct and indirect taxes over the next four years on account of SEZs. Despite so many incentives, performance of these privileged enclaves over the last five years indicates the failure of this scheme. For instance, the share of exports from SEZs in the total exports of the country has only increased from 4.2% in 2000-01 to 5.1% in 2004-05. Some economic experts are also seeing it as a corporate welfare scheme and the possibility of a sharp decline in investments in SEZs can’t be ruled out as tax benefits are only for 10 years. Other issues of concern like the heavy economic cost, real estate scam and labour policies are also discussed in the last section of the paper. Data are mostly secondary but the opinion of different economists and the Development Commissioners (SEZ) has also been taken into account. The zones cannot be insulated from the broader institutional and economic context of the country and be treated as an economy within the economy. Zones are a part of the economy and require overall improvement in the investment climate to ensure success in the long run. They should not, therefore, be viewed as an alternative to the overall development model. This is perhaps the reason why SEZs failed to fulfill the role of engines of economic growth in most countries on a sustainable basis.

4
Major Findings
• The union Govt has foregone a whopping Rs 39,704 crore of duty under
export promotion schemes during 2003-2004 accounting for 82% of customs
duty collected in that year.
• The foreign exchange earned by all the 811 units in the 8 zones put together
came to only Rs. 18,309 crores, a mere 5% of India’s exports during the
fiscal year 2004-05.
• During 1966-1980 average annual export growth rates of EPZs was over
77%, whereas during the post 2000 period (2001-03) it came down to 7%.
• Total share of FDI investment in Noida SEZ in 1997 was 12.3% and it went
up by a mere 0.4% in the six years. Total FDI share in 2003 was 12.7%.
• A slew of tax exemption planned for SEZ to boost exports will erode Rs.
93,900 ($ 20.62 billion) in government revenue over the next four years.
• Haryana Govt has offered over 1700 acres of land near Gurgaon to RIL
(Reliance) for about Rs.360 crore while it is estimated that the land was
worth 5000 crore and HSIDC had acquired this land by paying Rs. 300 crore
in compensation to the farmers.

5
Section – 1
SEZ Policy: An Overview

6
1.1 Introduction
A Special Economic Zone (SEZ) is defined as a deemed foreign territory within a country
with special rules for facilitating FDI for export-oriented production, and for purposes of
trade and customs duties. These Zones (SEZs) are geographical region that have
economic laws different from a country's typical economic laws. Different economic
institution and government departments have defined it in different ways. As per Ministry
of Commerce and Industry they are defined as:
Special economic zone is a specifically duty fee enclave and shall be deemed to be foreign
territory for the purpose of trade operations and duties and tariffs.
SEZs have been established in several countries, including the People's Republic of China,
India, Jordan, Poland, Kazakhstan, the Philippines and Russia. The concept of having free
trade zones, export oriented zones and SEZs dates back to 1970. In 1979-80, China
opened up its economy to foreign investment with the establishment of Shenzhen SEZ.
Situated close to the Hong Kong port, this small fishing hamlet has today acquired the
distinction of being the manufacturing hub of the world with a GDP of $20 billion and an
annual foreign trade of nearly $50 billion. Inspired by the success of Chinese SEZs our
policy makers also tried to experiment with SEZs in India. Despite the failure of Export
Processing Zones (EPZs) Murasoli Maran after visiting China in the year 2000 introduced
the SEZ policy very same year considering the need to enhance foreign investment and
promote exports from the country. The SEZ bill was passed by parliament in 2005 and the
Commerce Ministry notified the Special Economic Zones law on February 9, 2006 and the
rule came into effect from February 10, 2006 but the rush of proposals for setting up SEZs
had begun much earlier and by November 2005 some 61 SEZs were already approved.
According to reports, so far, the Government has cleared around 150 SEZ proposals out of
around 200 received.
The policy provides for setting up of SEZs in the public, private, joint sector or by State
Governments. It was also envisaged that some of the existing EPZs would be converted
7
into SEZ. Accordingly, the Government has converted all eight EPZs into SEZs. Table 1.1.1
below shows all the EPZs which has been coveted to SEZs with their size
Table 1.1.1 List of all the EPZs converted into SEZs with their size
Location Size (Sq.KM)
Kandla (Gujarat) 2.99
SEEPZ (Mumbai) 0.38
Cochin (Kerala) 0.40
Surat (Gujarat) NA
NOIDA (UP) 1.22
Chennai (TN) 1.04
Vizag (AP) 1.43
Falta (WB) 1.12
Source: Export Promotion Council. Ministry of Commerce, Government of India
1.2 Evolution of EPZs/SEZs in India
The economic policy of 1960’s which were geared towards selective import liberalization
and export promotion, marked the development of EPZ’s in the country. The first EPZ in
India which was also the first in Asia was set up at Kandla in 1965.The proposal for setting
up the Kandla free trade zone was mooted in 1961, with the objective of facilitating the
development of the Kutch region, to ensure greater utilization of Kandla port and to create
employment opportunities in the Kandla.
The second EPZ in the country, the Santa Cruz Electronics Export Processing Zone
(SEEPZ), was set up at Mumbai in 1974. This EPZ was developed specifically for
processing electronics goods and was expected to generate employment opportunities and
facilitate the technology transfer. SEEPZ was initially planed as single product zone for
processing electronics goods but by 1986 it was made a two product zone providing for
gems and jewellery complex as well.

8
Four more zones were set up in the mid-eighties at Noida (NEPZ), Chennai (MEPZ), Cochin
(CEPZ, Kerala), and Falta (FEPZ, West Bengal) and the seventh EPZ in the country was
commissioned at Vishakhapatnam (VEPZ, Andhra Pradesh) in 1994.
Initially the Central Government was solely responsible for establishing EPZ, but this policy
was amended in 1994 to enable state governments, autonomous agencies and the private
sectors to participate in the development agencies and operation of EPZs. Following the
implementation of this policy, one EPZ was developed by private sector in Surat. A joint
sector EPZ (now SEZ) has been approved for Greater Noida (UP). In terms of export
performance, employment generation and FDI inflow EPZs failed in India but considering
the need of better export performance and infrastructure building, central government
came up with SEZ policy in 2000. Section II of this research paper has been devoted to
analysis of the failure of EPZs in India. Without understanding the key difference between
these two similar policies it would not be fair to comment upon the future of SEZ scheme.
1.3 How SEZs are different from EPZs ?
SEZs are a larger variant of EPZs. Both have a delineated area and permit duty free import
of capital goods and raw materials; both aim to attract foreign investment for setting up
export-oriented units by providing developed infrastructure, conducive operating
environment and a package of fiscal incentives. However, the objective of SEZs is much
larger than mere promotion of export processing activities. While EPZs are industrial
estates, SEZs are virtually industrial townships that provide supportive infrastructure such
as housing, roads, ports and telecommunications hospitals, hotels, educational institutions,
leisure and entertainment units, residential/industrial/commercial complexes, water supply
sanitation and sewerage system and any other facility required for development of the
zone.
The scope of activities that can be undertaken in the SEZs is much wider and their
linkages with the domestic economy are stronger. Resultantly they have a diversified
industrial base. Their role is not transient like the EPZs, as they are intended to be
instruments of regional development as well as export promotion. Although the objectives

9
of SEZ policy are quite similar to the objectives envisaged by central government through
EPZ policy in early eighties but there is significant difference between these two policies in
terms of tax benefits and rules and regulations. The table 1.3.1 below summarizes the
difference between these two:
Table 1.3.1 Comparison between SEZ and EPZ
India’s SEZ India’s EPZ SEZ vs. EPZ
Restriction on
sectors
Open to
manufacturing,
services and
trading activities
Open to
manufacturing and
trading activities.
Services may also be
considered
While SEZs are
generally open to
all activities, EPZs
appear to focus
more on
manufacturing
and trading
Tax exemption Companies in
SEZs enjoy a 5
year corporate tax
holiday, followed
by 50%
exemption for 2
more years
Companies in EPZs
were exempted from
corporate tax for a
block of 5 years in
first 8 years of
operations. However,
under section 10a of
the income tax act,
the concession was to
be phased out by
2009
SEZs offer more
attractive tax
benefits than
EPZs
Retention of
foreign
exchange
earnings
Retain 100%
foreign exchange
earnings in
Exchange Earner
Retain 70% foreign
exchange earnings in
Exchange Earner
Foreign Currency
Companies in
SEZs would have
better control
over foreign

10
Foreign Currency
Account (EEFC).
Account (EEFC). currency in
relation to
purchase of
imported inputs.
Export
performance
(EP) & Net
Foreign
Exchange
Earning as % of
exports (NFEP)
requirements
No minimum EP
required. Positive
NFEP required
(varies across
industries and
states)
Minimum EP and
NFEP required.
(varies across
industries and states)
Companies in SEZ
enjoy more
leeway in meeting
export
performance
requirements.
Duty recovery in
case of failure to
achieve positive
NFEP
Duty recovery is
in proportion to
shortfall
Full duty recovery is
imposed
Lesser penalty for
SEZs failing to
achieve positive
NFEP
DTA* sales Unlimited DTA
sales on full duty
Only 50% of exports
qualify for DTA sales
SEZs enjoy
greater access to
domestic market
Duty free
imported raw
material
Allowed. These
duty free
materials are to
be utilized over 5
years
Allowed, but duty
free materials are to
be utilized over 1
year.
More flexibility in
production and
inventory
planning for
companies in
SEZs.
Certifications of
imports
Imports on self-
certification basis
Imports require
attestation of
Development
Commissioner
Simplified
customs
procedures
facilitate
movement of

11
imports into SEZs
Customs
inspection
No routine
examination of
import/export
cargo by Cusoms
Routine customs
inspections of
import/export cargo
Expedited
movement of
goods in an out of
SEZs
FDI approval
process
100% FDI
investment
through automatic
route available for
manufacturing
companies
Foreign investment
promotion board
approval is required
for FDI
Easier and
quicker FDI flows
into SEZs for
manufacturing
companies.
Source: SEZ Authority, Ministry of Commerce and Industry, Government of India Available
at sezindia.nic.in. Accessed on June 5, 2006
1.4 Objectives of SEZ envisaged by the Government of India
The main objective of the SEZ scheme according to the finance and commerce ministries
is to create delineated, duty –free zones with world class infrastructure, internationally
competitive production environment and fast track clearance system for attracting private
investments, especially foreign direct investment (FDI) for setting up export oriented unit.
The broad objectives of the SEZ policy are:
Attract Foreign Direct Investment (FDI)
Earn foreign exchange and contribute to exchange rate stability
Boost the export sector, particularly non traditional exports
Create jobs and raise standard of living
Transfer new skills and expertise to local human resources
Create backward & forward linkages to increase the output and raise the standard of
local enterprise that supply goods and services to the zone
Introduce new technology

12
Develop backward regions by locating such zones in these areas and attracting
industries
Provide a stimulus to the economy
Test key policy reforms in these ‘pilot areas’
According to the Commerce Ministry, investment of the order of Rs.100,000 crore over the
next 3 years with an employment potential of over 5 lakh is expected from the new SEZs
apart from indirect employment during the construction period of the SEZs. Heavy
investments are expected in sectors like IT, pharma, bio-technology, textiles, petro-
chemicals, auto-components etc. With the Act and Rules in place, it is expected that many
large format, multi-product SEZs that have so far been unable to achieve financial closure
will now quickly move towards such closure. It is anticipated that this will trigger a large
flow of foreign and domestic investment in SEZs, in infrastructure and productive capacity,
leading to generation of additional economic activity and creation of employment
opportunities. Fiscal and other incentives are being offered to woo investors and SEZ
developers. Incentives like tax benefits, single window clearance, flexibility in export and
import rules and regulations has made SEZs an important and most sought after
destination for setting up the business empire. Unlike most of the international instances
where zones are primarily developed by Governments, the Indian SEZ policy provides for
development of these zones by the government, private or joint sector.
1.5 Establishing SEZs : Procedures and Requirements
According to Commerce Ministry and SEZ authority SEZs may be developed and managed
in the private sector or jointly by state government and a private agency or exclusively by
the State Government or their agencies. In the case of privately developed zones, the
investors could be either Indian individuals, NRIs, Indian or foreign companies. New
infrastructural development works such as construction of Standard Design Factory
Building, operation and maintenance of infrastructure in the Zones may also be
undertaken through private/joint/state sector in the Export Processing Zones, now
converted into Special Economic Zones. Any person, who intends to set up a SEZ, may,

13
after identifying the area can make a proposal to the Board of Approval (BOA) but will also
have to obtain the concurrence of the State Government. SEZ developer will have to get a
no-dispute certificate for that area where he wants to establish SEZ from the Chief
Secretary of that state. After getting clearance from the state government BOA considers
that proposal and if the proposal is within the purview of SEZ act BOA can approve the
proposal. However if a state government wants to set up a special economic zone, after
identifying the area can make a proposal directly to the board. The central government
has prescribed the minimum area requirement for setting up SEZs. Table 1.5.1 shows the
minimum requirement of area for various sectors.
Table 1.5.1 Minimum area requirement for various sectors
Sector Minimum area
required (in hectare)
Multi Product 1000
Green field 1000
Service sector 100
Bio-Technology 10
Information-
Technology
10
Gems & Jewellery 10
All other sectors 100
Source: SEZ authority, Ministry of Commerce & Industry. Government of India. Available
at sezindia.nic.in. Accessed on June 15, 2006
The area requirement for multi-product SEZs has been relaxed to 200 hectares and for
sector specific SEZs to 50 hectares, for certain States (Assam, Meghalaya, Nagaland,
Arunachal Pradesh, Mizoram, Manipur, Tripura Himachal Pradesh, Uttaranchal, Sikkim,
Jammu & Kashmir, Goa) and Union Territories, keeping in view the difficulty in finding
large tracts of contiguous land in such states/union territories. According to the SEZ Act at

14
least 25 % area of the SEZ shall be used for developing industrial area for setting up of
such units and the remaining 75% can be used for building infrastructures like roads,
hotels, power generation station, educational institution and other facilities.
1.6 Setting up Units
Any person who wants to set up a unit for operating in a SEZ will have to submit a
proposal to the development commissioner of that SEZ. Development commissioner
submits the application to the Approval Committee and the Approval Committee may,
either approve the proposal without modification, or approve the proposal with
modification. A modification suggested by Approval Committee will be well within the
purview of SEZ Act.
1.7 Important Features of SEZ Policy and Incentives given to SEZ
In India SEZs are deemed foreign territory within the country with special rules for
facilitating FDI for export-oriented production, and for purposes of trade and customs
duties. The key implication of being a deemed foreign territory is that individual units
within the SEZ are allowed operational freedom in routine activities and not supervised by
the customs authorities. Units may be set up in SEZ for manufacture of goods and
rendering of services.
To woo the investors to the zones, the Central Government has been offering a number of
fiscal incentives and concessions. For instance, the zones are deemed as foreign territories
as far as trade operation, duties and tariffs are concerned. The units (100% export
oriented) also have full flexibility in operations. They are exempt from all direct and
indirect taxes. No export and import duties, no excise duties, no central or state sales tax
and no service tax. The units don’t require license for importing capital goods and raw
material. According to SEZ Act 2005, the firms are eligible for getting an extended Income
Tax holiday for 15 years. Income tax exemption for 15 years is available for SEZ units as
detailed below:-

15
a) 100% of profits and gains from exports for the first 5 years
b) 50% of profits and gains from exports for the next 5 years
c) Amount not exceeding 50% which is credited to a reserve account 'Special Economic
Zone Re-investment Reserve Account' and utilized for business for the next 5 years.
The only condition imposed on the firms is that they must have positive net foreign
earning (NFE). The important fiscal and non-fiscal incentives given to SEZ developers and
firms are as follows:
• 100% FDI in the manufacturing sector permitted through automatic route1 except arms
and ammunition, explosives, atomic substance, narcotics and hazardous chemicals,
distillation and brewing of alcoholic drinks and cigarettes, cigars and manufactured
tobacco substitutes.
• External commercial borrowings by SEZ units upto US$500 million in a year without
any maturity restrictions through recognized banking channels.
• Facility to retain 100% foreign exchange receipts in Exchange Earners’ Foreign
Currency Account.
• Exemption from Central Sales Tax and Service Tax
• Facilities to set up off-shore banking units in SEZs.
• Exemption from duties on import /procurement of goods for the development,
operation and maintenance of SEZ.
• FDI to develop townships within SEZs with residential, educational, health care and
recreational facilities permitted on a case-to-case basis.
The full list of all the fiscal and non-fiscal incentives being offered to SEZ developers and
units has been given in the (appendix-i). Apart from getting tax benefits from central
government these zones are also getting tax benefits from state governments. TABLE
1.7.1 shows the list of tax benefits given by state governments to all the EPZs which has
been converted into SEZs.
Table: 1.7.1 Exemption From The State Level Taxes By Zone
Falta Cochin Chennai Noida Vizag Kandla

16
Sales tax Yes Yes Yes Yes Yes Yes
Contract tax No n.a. n.a. No n.a. Yes
Purchase tax Yes n.a. n.a. Yes Yes Yes
VAT Yes n.a. n.a. n.a. n.a.
State entry tax Yes Yes n.a. Yes No Yes
Octroi tax No n.a. n.a. Yes No Yes
CESS No No n.a. Yes No Yes
Luxury tax No n.a. No No Yes Yes
Entertainment tax No n.a. No No Yes Yes
Stamp duty and registration chages
on land transfers No Yes No No Yes Yes
Stamp duty and registration charges
on loan agreements/credit deeds No No No No Yes Yes
Source: Agrawal,2004
Units within the SEZ and EPZ also get subsidies sometimes on land rents and built up
areas are also provided on lower rental rate. In some countries utility services such as
electricity, water, and telecommunication are also subsidized. Table 1.7.2 shows the list of
subsidies being given to zone units in six EPZs (now SEZs):
Table: 1.7.2 Provision of subsidies by Zone
Falta Cochin Chennai Noida Vizag Kandla
On land rent Yes Yes Yes Yes Yes Yes
Factory rent Yes Yes Yes Yes Yes Yes
On purchase on capital goods Yes No No No Yes No
On capital investments Yes No No No Yes No
Interest rate subsidies Yes No No No No No
Concessional finance Yes No No No No No
Any other No No No No No No
Source: Agrawal,2004
In terms of fiscal and other benefits we are ahead of China but the record of the Indian
EPZs stands in contrast even to the performance of the general economy. Unlike other
countries, in India, SEZs are being developed by the private sectors as well and to attract

17
the private and foreign investment a package of incentives is being offered by both state
as well as central government. Later in the research paper an investigation has also been
made to analyse the worth of these benefits.
Section – II
Performance Analysis of EPZs & SEZs

18
Introduction
What is a successful SEZ? Is it the one that contributes to the host economy, one that
generates profit for its own owners/managers? SEZs are extensions of EPZs and taking
this into consideration, an attempt has been made to analyze the success of both EPZs
and SEZs in India. It has been just five years since the introduction of the SEZ policy in
India. Some economists believe that it’s too early to comment upon its potential or
chances of its failure. A significant change has been made in the rules and regulations but
by and large the objectives of SEZs and EPZs are similar. Taking this into account this
section has been devoted to explain the experience India had with EPZ policy in terms of
export performance, employment generation, FDI inflow and infrastructure development.
SEZs have been viewed as a tool to attract FDI and boost the export sector, which will

19
further create employment. It might be argued that policies like SEZ which has been
introduced very recently can not be categorized as a good or a bad policy by looking at
the performance analysis of five years but it definitely gives an insight into its potential
success or failure.
2.1 Share in Total Exports: Aggregate Analysis
Exports from SEZs grew by 16.4% from 2000-01 to 2004-05. In the same period, total
exports in India grew by 12.1%. This clearly indicates that despite getting special
treatment, performance of SEZs in India is not satisfactory. Even, the share of exports
from SEZs in the total exports of the country has only increased from 4.2% in 2000-01 to
5.1% in 2004-05. It’s quite apparent from the diagram that Domestic Tariff Area is also
more or less witnessing the same rate of growth. Exports from SEZ touched the figure of
18,309 crore in 2004-2005 which is just a mere 5% of the total exports from India.
Figure: 2.1.1 Trend in export performance of SEZs
Exports from SEZs (Rs. in Crores)
0
5000
10000
15000
20000
2000-01 2001-02 2002-03 2003-04 2004-05
Year
Rs
(in C
rore
s)
Source: Export Promotion Council, Ministry of Commerce & Industry, Government of India
Note: figures in parenthesis shows the No. of functional SEZs
(4)(4) (8)
(8)
(11)
20
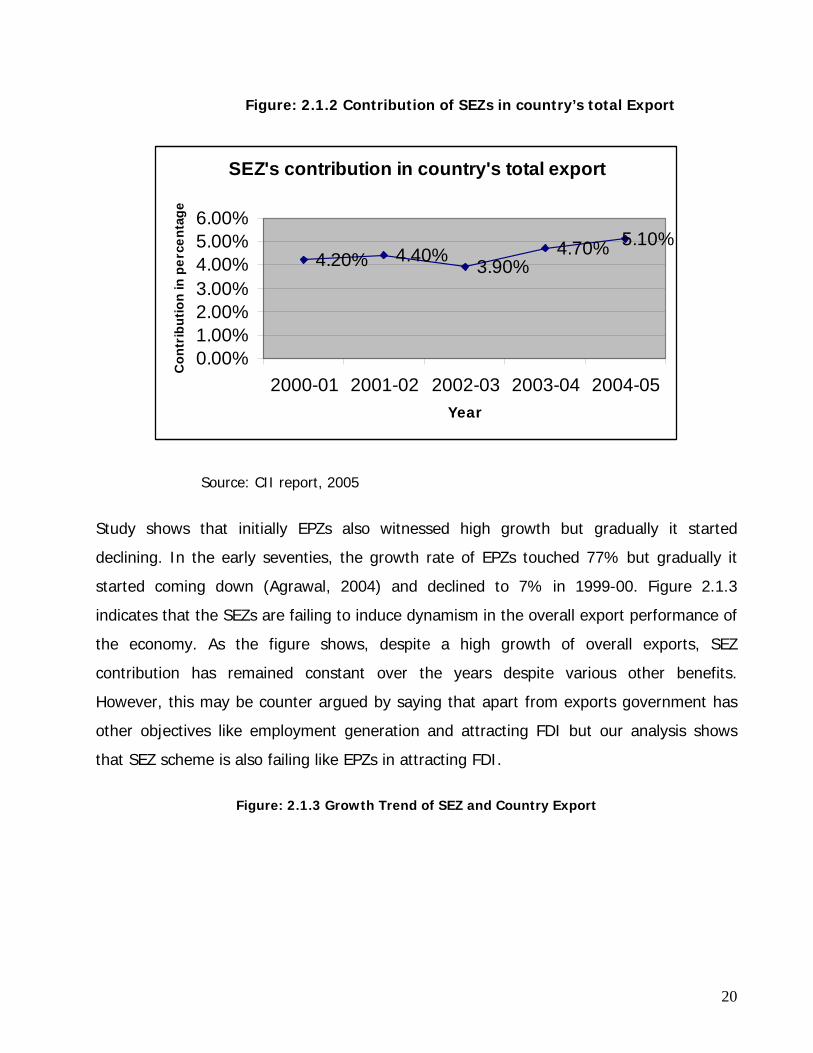
Figure: 2.1.2 Contribution of SEZs in country’s total Export
SEZ's contribution in country's total export
4.20% 4.40% 3.90%4.70% 5.10%
0.00%1.00%2.00%3.00%4.00%5.00%6.00%
2000-01 2001-02 2002-03 2003-04 2004-05Year
Con
trib
utio
n in
per
cent
age
Source: CII report, 2005
Study shows that initially EPZs also witnessed high growth but gradually it started
declining. In the early seventies, the growth rate of EPZs touched 77% but gradually it
started coming down (Agrawal, 2004) and declined to 7% in 1999-00. Figure 2.1.3
indicates that the SEZs are failing to induce dynamism in the overall export performance of
the economy. As the figure shows, despite a high growth of overall exports, SEZ
contribution has remained constant over the years despite various other benefits.
However, this may be counter argued by saying that apart from exports government has
other objectives like employment generation and attracting FDI but our analysis shows
that SEZ scheme is also failing like EPZs in attracting FDI.
Figure: 2.1.3 Growth Trend of SEZ and Country Export

21
0200000400000600000800000
100000012000001400000160000018000002000000
1990 1992 1994 1996 1998 2000 2002
SEZs exportCountry export
Source: sezindia.nic.in, Ministry of Commerce & Industry. Government of India
2.2 FDI inflow and Employment
India had a very slow expansion in the initial phases of EPZ policy. Expansion in the zones
started picking up in the 1980s in terms of employment but total investment remained
abysmally low till the late 1980s8. In the 1990s, investment also started increasing. Growth
rates in employment slowed down considerably in the late 1990s but in terms of
investment EPZs in India continue to be dominated by domestic investment. This was
despite its edge in terms of labour costs, availability of trained manpower and a stable
macroeconomic environment. The share of FDI in total investment increased slowly from
12% in 1989 to slightly over 18% in 2000 ( Agrawal, 2004). During 2000-03, however,
FDI inflows increased faster. Table 2.2.1 below shows the share of FDI in EPZ/SEZ
investment. In 2000, all the EPZs were converted into SEZs, and with new rules and
incentives it was expected that FDI will pour in but a more detailed study of Noida SEZ
shows a mere 0.4% growth in FDI investment in six years while in Chennai it just went up
by 2.3%. Despite this, new SEZs are becoming the most sought after destinations for
foreign investors, however the chances of decline in FDI in SEZs can’t be ruled out as once
the tax benefit period gets over and there would not be much incentives for investors to
invest in SEZs.
Rs.in Crores

22
TABLE: 2.2.1 Share of FDI in total EPZ/SEZ investment (%)
Source: Ministry of Commerce & Industry. Government of India
Unlike other countries, in India SEZs are being developed largely by private sectors and to
avail the tax and other benefits private players are rushing in but it would be interesting to
see if Govt doesn’t extend the benefits again once the period gets over , will they be still
interested in investing and building infrastructure. Employment creation is one of the
important goals which Indian government wants to achieve through SEZs but previous
experiences with EPZ and other free trade zones doesn’t give us any rosy picture. EPZ had
a share of near about 1% in organized employment (Agrawal, 2004) and till now all eight
functional SEZs has created 1 lac employment and it is being expected that in next five
years it will cross the figure of 5 lac. Table 2.2.2 shows the employment generated by
different zones and the amount of Government and private investment in these zones.
Table: 2.2.2 Zone wise employment and Investment upto 31.03.2005
Zone
No of
units
Employment as
on 31.03.2005
Govt investment upto
31.03.2005
Private
investment upto
31.03.2005
KSEZ 123 9821 26.93 134
SEEPZ 176 42150 57.39 279.49
NSEZ 151 19857 78.04 650
MSEZ 105 16107 74.83 223.96
CSEZ 74 4712 87.53 92.79
Zone 1997 2003
Kandla 1.3 4.9
Santacruz 8.4 9.2
Noida 12.3 12.7
Chennai 28.4 30.7
Cochin 9.6 13.7
Falta 3.1 4
Vizag 38.8

23
FSEZ 83 2753 82.83 263.85
VSEZ 28 2500 39.3 311.58
Surat 62 2250 32.46 5.07
Manikan
chan 5 300 4
Jaipur 2 50 1
Indore 2 150 3
Source: Export Promotion Council, Ministry of Commerce & Industry. Government of India
SEZ or any other free trade zone should not be viewed as a tool to generate employment.
Studies show that even small countries like Philippines has created 1.1 million jobs through
these economic zones (KPMG Report, 2004) but despite being the first country to have
EPZ in Asia, India failed to achieve a high employment rate. Dysfunctional policies,
regulations, lack of single window clearance facilities, poor attitude of the officials,
centralized governance, stringent labour laws, poor physical and financial infrastructure, all
accounted for an undesirable investment climate and thus EPZ failed to create
employment. SEZ should have witnessed much higher growth in exports and employment
but it is not happening either. If SEZ policy is really an example of decentralized
governance, is it capable to strengthen our physical and financial infrastructure and if
single window clearance facilities are no longer a dream, all these issues and concerns
have been emphasized in the last section.
Generally, it is argued that the SEZ concept is attractive because it is much easier to
resolve the problems of infrastructure and governance on a limited geographical area than
it is to resolve them countrywide. On the contrary, the performance over the last five
years of these privileged enclaves indicates the failure of this scheme. The zones cannot
be insulated from the broader institutional and economic context of the country and be
treated as an economy within the economy. Zones are a part of the economy and require
overall improvement in the investment climate to ensure success in the long run. They
should not, therefore, be viewed as an alternative to the overall development model. This
is perhaps the reason why SEZs failed to fulfill the role of engines of economic growth in
most countries on a sustainable basis.

24
Section – III
A comparative study of Chinese SEZ policy

25
3.1 SEZs in China
The development of Special Economic Zones is one of the highlights of remarkable
Chinese economic achievements. The Development of Chinese Special Economic Zones
dates back to 1980’s. It is different from Indian practice: SEZ in China is classified in two
levels by their scales. SEZ is the whole city even whole province opened to special
financial, investment and trade policy, while Economic and Technological Development
Zones (ETDZ) is a relatively small piece of land earmarked in coastal and other open cities
for industry and trade development.
As early as 1980, under the opening-up and reform policy, the Chinese Government set up
the first group of Special Economic Zones in Shen Zhen, Zhu Hai, Shan Tou and Xia Men,

26
all of which are located in costal areas of Southeast China, followed by other 10 costal
cities, Hai Nan Province and Pu Dong area in Shanghai as the second group. To further
open to the outside world and to spread successful experiences of SEZs, at the beginning
of 1984, the government decided to establish ETDZs along coastal line on the basis of
successful experiences of and favorable policies granted to the SEZs in the previous
period. Consequently, China's first group of 14 National Economic and Technological
Development Zones (NETDZ) were established from 1984 to 1988 successively. The
distinguishing features of Chinese SEZs are their large size, investment friendly customs
regime, flexible labour laws, liberal policy for DTA access, attractive package of incentives
and delegation of powers in favour of provinces and local authorities for managing the
zones.
3.2 Comparing Chinese SEZ policy with India
In spite of the fact that India was a pioneer in creating one of the worlds’s first export
processing zones at Kandla in 1965, EPZs have never had much impact on India’s export
performance. Tariff exemption schemes have tended to be excessively complex and
encourage a ‘licence raj’ mentality at the operational level. Both economies are large
emerging markets that had rather similar profiles in 1978. Today, China ranks number one
as the world’s preferred foreign investment destination. Closer examination of the FDI
statistics suggests that India’s performance has been abysmal in comparison to China.
India lags behind for a number of reasons. These include a high tariff regime, poor
infrastructure (power, ports, roads and railways), and a regulatory system that is too often
not business-friendly and inflexible labour laws. In this section a comparison has been
done between Chinese and Indian SEZ policy on different parameters like tax incentives,
labor laws, FDI inflow, employment and export performance.
First, consider the size of the proposed SEZs. Chinese SEZs are like townships. India has
not gone that far, but according to the SEZ guidelines, the area of an SEZ should be 1000
hectares. It is being argued that large sized SEZs can perform better as they will have a
larger scale of economy but on contrary to that the best performing SEZ in Mumbai has an

27
area of 93 acres only. It is being considered that one of the china’s success factors was
large size of SEZs. For instance, entire Hai Nan Island has been declared as SEZ with an
area of 34,000 Sq. km. Table 3.2.1 below shows the size of all five existing SEZs in china.
Table: 3.2.1 Size of Chinese SEZs
Source: Kumar, 2003
There is no doubt that SEZs have an edge over rest of the economy in terms of
investment friendly environment and it’s quite obvious that if we have an investment
friendly environment in a larger area, economy would do well. Rather than applying the
theory of having larger scale of economy we should focus on an overall hassle free
environment for export and this can be done only by extending the SEZ policy to whole
country where every small and big export oriented manufacturers will have the access to
business friendly environment. One counter argument to this proposal might be that SEZ
policy in India is being implemented on a pilot basis, and government can extend this
policy to whole country if SEZ works as a tool to bring economic reform. But unfortunately
SEZ policy nowhere talks about extending the same hassle free system to rest of the
country. It means that carrying out businesses in hassle free environment would still be a
dream for rest of the country, so infrastructure else where in the country would not
improve. The performance of SEZ also depends on the inner infrastructure and how can
we think of a great performance from SEZs when rest of the economy still suffers from the
same unfriendly environment.
SEZ Area (Sq. KM)
1) Shenzhen 327
2) Zhuhai 121
3) Xiamen 131
4) Hainan 34000
5) Shantou 234

28
SEZ's were established by the China to encourage foreign investment, bringing jobs,
technical knowledge, and future tax revenues in return for significant tax concessions at
start-up of the operations and over a number of years. The biggest benefit to the investor
is significant tax concessions early in the project. Tax concessions offered to a
manufacturing startup in Chinese SEZ are:
• No tax during start-up years before making a profit
• The first year that any company makes a profit starts the "Tax Clock" and is year one
• The first and second year after the tax clock starts, there is no tax.
• For years three and four, there is 1/2 of the normal tax rate.
• In the fifth year, the company pays the full normal tax rate
In terms of tax benefits we are ahead of china. In SEZ policy tax benefits has been
increased in comparison to EPZ but the failure of EPZs indicates that tax benefits can’t
alone boost the FDI and export performance. Table 3.2.2 below compares the
performance of these two countries.
Table 3.2.2: Comparison of SEZ performance
China India
Share of SEZs in total export 23% 5% Employmnet(Direct) generated through SEZs 2 million 0.1 million
FDI inflow through SEZs US $ 60 billion US $ 2 billion Source: KPMG report, ministry of commerce and industry (GoI)
The contribution of Chinese SEZs to the country exports is in the range of 15-23%.
According to available statistics, the share of SEZ exports to country exports in 1997 was
23% (i.e. approximately US $ 42 billion). Overall, all the zones put together have played
an important role in the overall growth of the Chinese economy. These zones taken
together employ more than two million people directly and approximately 16 million
overall (both direct and indirect). Cumulatively, 20% of the total foreign direct investments

29
into China have made its way into SEZs (i.e. approximately US $ 60 billion till date).
Performance of SEZs in these two countries should not be compared just on the basis of
export and other figures because size wise Chinese SEZs are much larger than Indian
SEZs. But even in performance (export, employment) per Sq. KM China witnessed higher
rate of growth and it was possible because of their liberal framework of SEZ policy.
As regards labour laws, it is difficult to imagine that a communist country like China has
relaxed these laws by allowing a hire and fire policy for the SEZs. This single measure
went a long way in attracting foreign investment to these zones. After investors gained
confidence in the productivity of Chinese workforce, the hire and fire policy was
substituted by the contract system. There is ample justification for adopting in India a
flexible labour policy in India, not just for these exporting enclaves but also for rest of the
country. Rigid and outdated labour laws hinder the economic development and it sets the
rationale for having a labour reform. According to section 5B of the labour code any
registered firm, that is employing more than 100 people, is required to seek permission
from the state government to retrench its workforce. The country budget of March 2002
promised a change in the legislation to raise the level to 300 but due to coalition
government it never happened. The result is that formal-sector firms (those that are
registered and that pay their taxes) loath to take on new employment, and the vast
majority of India’s employment is informal, in small, tax-evading, inefficient enterprises.
The policy in India on these critical issues is lukewarm. It just mentions that the laws of
the land will apply and that the zones can be declared as public utilities under the
Industrial Disputes Act. Merely declaring SEZs as public utilities will, however, not serve
much purpose as seen in the EPZ experience.
The radical difference in the attitude of the Indian and Chinese governments on this
matter is reflected in the recently published investors guide for Special Economic Zones in
India. It states ‘the labour laws of the land will apply to all units inside the Zone. However,
the respective State Governments may declare units within the SEZ as public utilities and
may delegate powers of the Labour Commissioner to the Development Commissioner of

30
the SEZ’ (Ministry of Commerce and Industry, 2002, p.15). In China, the right to hire and
fire has been enshrined in SEZ regulations since 1982. Moreover, in India there are strict
regulations stipulating that contract labour is only allowed work of a temporary nature. By
contrast, the World Bank survey (2002b), estimates that in Guangzhou firms employ more
than 20 per cent of the labour force as non-permanent workers. Of course many Indian
employers find ways round the regulations through outsourcing and less formal means but
the current system undoubtedly reduces flexibility.
China made the provincial and local authorities act as partners and stakeholders by
delegating them powers for approving foreign investment. The SEZ authorities in China
can approve investment proposals up to $30 million. This has been a significant feature of
the Chinese policy and a key contributor to the success of SEZs. The Indian policy only
enables the State governments to set up SEZs, but does not empower them to approve
investment proposals. These powers have been vested with the development
commissioners concerned who represent the Central Government. This will result in
centralization of work in their offices. Government boasts of decentralizing the whole
process and talks about single window clearance but anybody who goes through the SEZ
act can figure out how complex and centralized this policy is. Last section of this research
paper critically analyzes the ‘so -called’ decentralized nature of the SEZ policy.
Another ticklish issue is involvement of local government. Unless the State and local
governments are directly made responsible for the management of SEZs and approving
investment proposals, their political leadership and bureaucratic set up may not have any
incentive to push the initiative forward. But in India all the important decisions are being
taken by central government China has gone a step further by delegating powers to the
local authorities. The local authority manages Shenzhen SEZ, which has the highest export
turnover.
3.3 Current scenario in China

31
Over the last five years the GDP growth of china has been near about 10% and SEZs is
being viewed as an engine for this rapid growth. Higher GDP rate can be considered as
one of the major success of SEZ policy but regional disparities as an outcome of this policy
has forced China to rethink and restructure this policy. Per capita income in the richest city
is over 50 times per capita income in poorest city. Awarding a privileged status to some
zones at the cost of others is responsible for this higher disparity. For instance, china had
received the cumulative amount of US $ 128.1 billion of FDI between the year 1979 to
1995 and the coastal areas accounted for over 90% of all the FDI received in this period.
It might be argued that there is no harm in developing country in pockets but how we can
forget that these areas were developed by tax money paid by everyone. Government had
to forego tax revenues as tax concessions were the main attracting features. All the tax
revenue lost due to SEZ was/is being recovered through taxes from rest part of the
country and resultantly all tax payers end up paying higher tax but the benefits are
available for very few of them. I see this as the one of the main causes for high income
disparity in China. To combat this problem even China has given emphasis on balanced
development and tax benefits accorded to foreign investments in the SEZs has been
partially lifted.
India’s tax and tariff structures are still anti export. India’s high overall tariff rates,
especially tariffs on intermediate products that are used by exporters, impose a heavy
indirect tax on export competitiveness. Deregulation of the private sector is perhaps one
of the most critical areas in the context of India’s reforms. Since almost 90-plus percent of
the workforce is in the informal sector, it is of utmost importance to deregulate the private
sector so as to get the unorganized sector workforce in the mainstream. Workers in large
firms in the formal sector have a virtual guarantee of continued employment according to
the Industrial Disputes Act. For firms of 100 employees or more, reductions in the
workforce must be upon the permission of state government, which is almost never
granted. Remarkably, loss-making firms are also not allowed to close their operations
without government consent. The results of India’s highly regulated labor markets have
been devastating. Formal-sector employment in India is shockingly low, in large part

32
because so much urban employment is carried on outside of formal registration. Out of a
total labor force of around 406 million, formal sector employment accounts for only 28.1
million. Of this, 19.4 million works in the state sector (state enterprises and public
administration), and just 8.7 million works in private firms with formal employment.
Indeed with a more open and deregulated economy (economy is not just SEZs), India may
well be in a position to perform as China has done over the last two decades.

33
SECTION- IV
CASE STUDY: NOIDA SPECIAL ECONOMIC ZONE
34
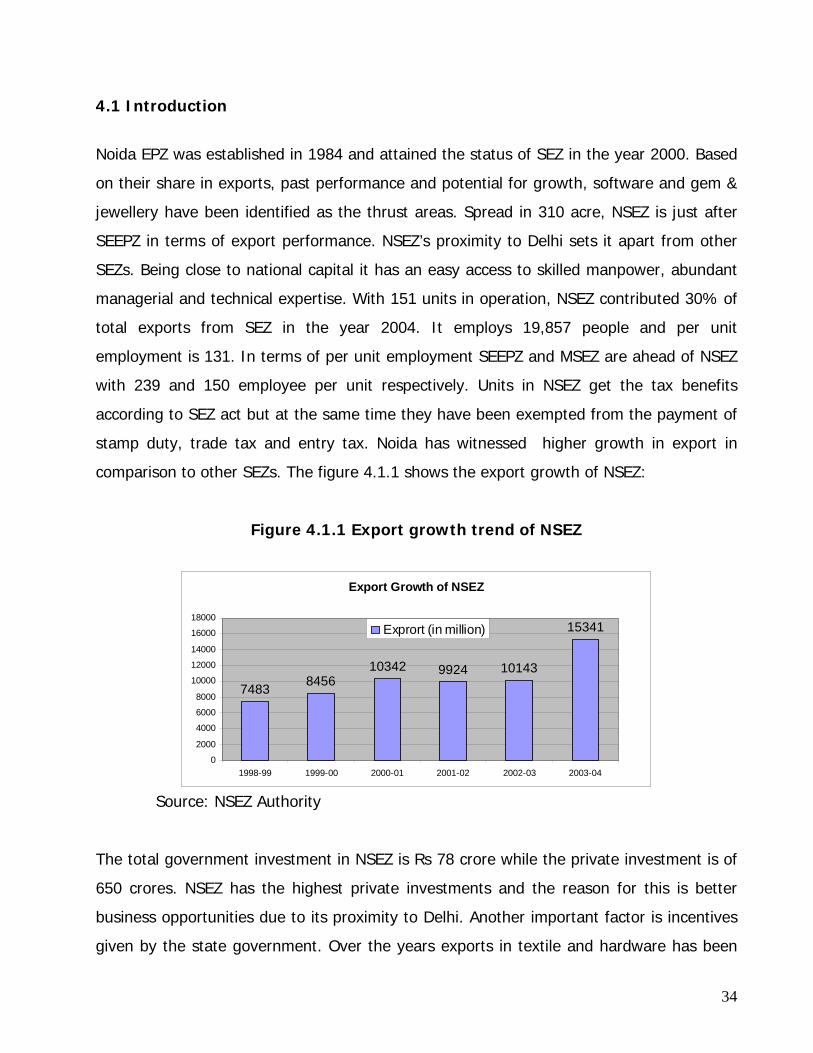
4.1 Introduction
Noida EPZ was established in 1984 and attained the status of SEZ in the year 2000. Based
on their share in exports, past performance and potential for growth, software and gem &
jewellery have been identified as the thrust areas. Spread in 310 acre, NSEZ is just after
SEEPZ in terms of export performance. NSEZ’s proximity to Delhi sets it apart from other
SEZs. Being close to national capital it has an easy access to skilled manpower, abundant
managerial and technical expertise. With 151 units in operation, NSEZ contributed 30% of
total exports from SEZ in the year 2004. It employs 19,857 people and per unit
employment is 131. In terms of per unit employment SEEPZ and MSEZ are ahead of NSEZ
with 239 and 150 employee per unit respectively. Units in NSEZ get the tax benefits
according to SEZ act but at the same time they have been exempted from the payment of
stamp duty, trade tax and entry tax. Noida has witnessed higher growth in export in
comparison to other SEZs. The figure 4.1.1 shows the export growth of NSEZ:
Figure 4.1.1 Export growth trend of NSEZ
Export Growth of NSEZ
7483 845610342 9924 10143
15341
0
2000
4000
6000
8000
10000
12000
14000
16000
18000
1998-99 1999-00 2000-01 2001-02 2002-03 2003-04
Exprort (in million)
Source: NSEZ Authority
The total government investment in NSEZ is Rs 78 crore while the private investment is of
650 crores. NSEZ has the highest private investments and the reason for this is better
business opportunities due to its proximity to Delhi. Another important factor is incentives
given by the state government. Over the years exports in textile and hardware has been

35
declining but gems & jewellery has witnessed a very high growth and in the year 2003-04
the total contribution was 49.87% in total exports from NSEZ. The table below
summarizes the contribution of different sectors in total exports.
Table: 4.1.1 Contribution of different sectors in exports from NSEZ
Exports (Rs. Million) Sector
1999-2000
2000-01 2001-02 2002-03 2003-04
Textile/Garments 1341 1388 1199 990 990Hardware 1660 2697 885 739 930Software 1393 1786 1906 1787 1980ENGG. Goods 1201 1014 1184 1374 1640 GEM & Jewellery 1295 1928 3015 3437 7650Chemical & Pharma 462 329 207 238 310Leather Products 127 88 100 53 50Plastic/Rubber/Synthetic 295 269 287 229 230Miscellaneous 682 843 1141 1296 1560 Total 8456 10342 9924 10143 15341
Source: NSEZ Authority 4.2 The reasons for NSEZ’s success: A) Proximity to Delhi: One of the prime reasons of NSEZ’s success is its proximity to
Delhi. Noida has better transport and other infrastructural facilities in comparison to
others SEZ. Noida was developed as an industrial area and therefore, the whole
environment is business friendly. Noida is just 24 KM away from Delhi and it comes
under national capital territory (NCT), so in terms of administration, infrastructure and
business opportunities NSEZ has an edge over other SEZs.
B) Special benefits given by the U.P. government: It has been discussed in previous
sections that the tax benefits are the key determinants in attracting investments. To
woo the investors U.P. government has exempted SEZ developers and units from some
state taxes as well and it has resulted in higher private investments in NSEZ
Exemptions from the payment of entry tax, trade tax and stamp duty makes NSEZ the

36
most sought after destination for setting up the units. Due to these exemption units in
NSEZ export more to reap the benefits given by the state government at the fullest.
37
Section – V
Policy Analysis: A Critical Approach

38
Without doing the cost benefit analysis when a government establishes any economic
policy which affects all the people in a direct or indirect way, it becomes important to raise
some basic questions like whether the benefits of that policy would outweigh their costs, is
it good for the country in the long run? SEZ policy has been enacted by parliament but
ironically no cost benefit analysis was done before announcing it. As discussed earlier the
prime objective of this scheme is to boost the export sector and a package of fiscal and
non fiscal incentives are being offered to developers and units to achieve the objectives.
One way to assess the rationale for having SEZ policy is to investigate what would have
been the performance of the economy in the absence of this policy. Anticipating this would
not be an easy task. Export performance of our country has been abysmal and there was
a need to take some measures but according to me, preferential treatment should be the
last measure and firstly any government should root out all those evils which are hindering
the growth of export or for that matter whole economy. Rigid tariff regime highly
regulated labour market, centralized governance are some major problems which obstruct
the growth of the export sector and this also makes the investment climate unfriendly.
Deregulating the labour market and decentralizing the whole process should have been
the first priority of the government and making the whole country hassle free for
investments and business opportunities would automatically boost the export sector.
Establishing SEZs is a very complex task encompassing a wide range of policy, legal and
regulatory issues. SEZ policy was praised initially as a well drafted policy but inter
ministerial conflicts, heavy economic costs and recent cases of migration from DTA to
SEZs actually highlights the blind spots of its designers.
5.1 Heavy Economic Costs
According to SEZ Act 2005, the firms are eligible for getting an extended Income Tax
holiday for 15 years. Firms and developers have also been exempted from excise duty and
custom duty. A loss of Rs. 39,704 crore of duty under export promotion schemes during
2003-04 (CAG Report, 2004) which accounts for 82% of customs duty collected that year
gives an idea of how costly this whole affair is. According to an internal assessment by the

39
Finance Ministry, the Government may have to forego about Rs 90,000 crore in direct and
indirect taxes over the next four years on account of SEZs.
5.2 Corporate Welfare
Very recently an article written by M.Bhardwaj appeared in ‘Business Standard’ which
alleges that Haryana government acquired over 1700 acres of land from farmers at Rs.
300 crore and offered this land to Reliance for 360 crore in the name of SEZ while it was
estimated that land was worth 5,000 crore. This is a perfect example of corporate welfare.
It’s true that the value of land goes up drastically when market anticipates the introduction
of any such scheme into that particular area but taking away the land from farmers at a
much lower rate can’t be justified. According to the SEZ Act any state government can set
up SEZ jointly with private sector. This can be called public private participation.
Theoretically everything sounds good, so where is the problem. Now if any company has
link with top politicians of a state, the possibility of favoured treatment can’t be ruled out.
Even in terms of incentives state can also offer a package of tax benefits. Imagine a
situation where two firms which produces the same good, are operating from two different
states and one of them gets an edge over another just because of preferential treatment
by the state. Would you call it a fair competition? SEZ act enables the state government to
offer land at a much lower rate and to provide extra incentives and what do we expect
that the state governments would not misuse these powers?
5.3 Migration from DTA to SEZ
To avail all the facilities and incentives offered by SEZs, small firms and even big
companies are shifting to these privileged enclaves. SEZs have encouraged inward
migration. One of the prime objectives of this policy was to attract FDI but the share of
FDI in investments in SEZs is very low and due to inward migration very few new
manufacturing units have been set up in the SEZs.
5.4 Real Estate Play

40
State governments are offering land to SEZ developers at concessional rates. For real
estate developers SEZ policy has come as an opportunity to grab the scarce land near
cities. Ideally SEZs should be established in remote areas but due to lack of infrastructure
the concentration of SEZs are near by cities. According to SEZ Act at least 25% of the total
acquired area would be processing area and in the remaining area developers can build
commercial complexes, malls, hospitals, hotels, educational institutions etc. Minimum area
requirement for setting up SEZ is 1000 hectares and according to SEZ guidelines
developers get a tax break even on all the buildings on the 750 hectares. On going real
estate boom has shifted the focus from export to building residential complexes and
commercial malls. Developers can always make huge profit from selling or leasing the
buildings and this is where real estate play comes in. Land deals and compensation
payments are known to be hot-beds of corruption so no wonder if farmers are being
displaced from their place in the name of SEZ without giving adequate compensation.
Conclusion
Considering the need to boost export sector and attract FDI, government announced this
policy but ironically the performance of SEZs in exports highlights the failure. When
government should liberalize overall policy, government has decided to focus on one or
two areas. The real attraction of SEZs is the tax holiday promised and to grow the
business in hassle free environment firms are just shifting to these privileged enclaves. To
compete with China a package of fiscal and non fiscal incentives are being given but this
has been overlooked that tax benefits in china’s SEZ were available only to foreign
investments, not exports. All exemptions and fiscal incentives should go in the process of
overall tax and labour reform. Giving preferential treatment to any particular area in the
name of exports can’t be justified in the democratic set up. Even if government wants to
continue with this policy, only developers should be given the tax benefits if they are
developing any SEZ in the remote area. The whole process is still centralized and
government should minimize their role.

41
References:
1. Official Website of SEZ. http:// sezindia.nic.in. 2006, accessed on 23 May
2006
2. Ministry of Commerce.2005. Annual Report2004-05.
3. CII report. 2005. Special Economic Zone: Engines for Growth. Available at
http://www.ciionline.org/Northern/regionalfocus/836/images/sez.pdf.
Accessed on 23 June 2006.
4. Bhardwaj, M.2006. No review, RIL mega SEZ signing next week, says
Haryana CM. June 13.Business Standard
5. Aggarwal, A. 2004. Export Processing Zones in india : Analysis of the Export
Performance. ICRIER Working paper No. 148.
6. Jain, S.2006. Killing SEZs, making a killing. 22 May. Business Standard
7. Tondon Committee (1982) ‘The Committee on Free trade Zones and 100%
Export oriented Units, Apponited by the Ministry of Commerce, Government
of India, September 1981.
8. IIPM Editorial.2006.The Great Indian obsession.
9. The Hindu.2005. Lok Sabha passes SEZ Bill. 11 May
10. Suchitra, M. 2006. The high cost of easy foreign exchange. 9 March. India
Together

42
Annexure-1
(List of all the fiscal and non-fiscal benefits given to SEZ developers and units)
i. 100% income tax exemption for a block of five years and an additional
50% tax exemption for two years thereafter
ii. 100% FDI in the manufacturing sector permitted through automatic route,
barring a few sectors.
iii. External commercial borrowings by SEZ units upto US$500 million in a year
without any maturity restrictions through recognized banking channels.
iv. Facility to retain 100% foreign exchange receipts in Exchange Earners’
Foreign Currency Account.
v. 100% FDI permitted to SEZ franchisee in providing basic telephone
services in SEZs.
vi. No cap on foreign investment for small scale sector reserved items.
vii. Exemption from industrial licensing requirements for items reserved for the
SSI sector.
viii. No import licence requirements

43
ix. Exemption from customs duties on import of capital goods, raw materials,
consumables, spares etc
x. Exemption from Central Excise duties on procurement of capital goods, raw
materials, consumable spares etc., from the domestic market.
xi. No routine examinations by Customs for export and import cargo.
xii. Facility to realize and repatriate export proceeds within 12 months.
xiii. Profits allowed to be repatriated without any dividend-balancing
requirement.
xiv. Job work on behalf of domestic exporters for direct export allowed.
xv. Subcontracting both domestic and international is permitted; this facility is
available to jewellery units as well.
xvi. • Exemption from Central Sales Tax and Service Tax
• Facilities to set up off-shore banking units in SEZs.
• Exemption from duties on import /procurement of goods for the development,
operation and maintenance of SEZ.
• Income tax exemption for a block of 10 years in 15 years.
• Exemption from Service Tax

44
• FDI to develop townships within SEZs with residential, educational, health care
and recreational facilities permitted on a case-to-case basis.
Annexure – 2
Zone wise export performance of five years
ZONE 2000-01 2001-02 2002-03 2003-04
2004-05
(P)
KSEZ 527.89 475.98 729.29 1018.82 1060.14
SEEPZ 5193.74 5225.6 6083.02 7832.81 8298.59
NSEZ 1034.2 980.41 1001.17 1534.17 4266
MSEZ 690.84 762.59 822.35 1037.96 1376.91
CSEZ 304.3 258.5 270.42 298.91 462.99
FSEZ 519.97 923.63 512.39 825.34 569.15
VSEZ 219.08 250.98 357.27 435.97 579.27
Surat 62.28 311.86 280.71 869.9 1539.72
Manikan chan Nil Nil Nil Nil 95.94
Jaipur Nil Nil Nil Nil 5.27
Indore Nil Nil Nil Nil 55.02
Total 8552.3 9189.55 10056.62 13853.58 18309

45