Embed Size (px)
Citation preview

Laura: Welcome to all participants to our 21st Sustainable Operations Peer Learning Series webinar. The top of today’s webinar is driving energy efficiency through data and engagement. We’re fortunate to have five of our leading sustainable operation folks with us today as speakers; Corri Apodaca, Sarah Baker, Heather Boaz, Ted Etter, and Laurie Yeager.
To provide you with an outline of where we’ll be headed today, we’ll first start with Heather Boaz speaking about incentivizing cost savings. She’ll describe where the team is headed in FY ‘14 and also speak to you about how you could get involved with this exciting work.
We’ll then transition to Laurie Yeager to talk about a Bike-to-Work Worksite Challenge that she helped spearhead at her unit in Region Two.
We’ll then transition to a dual presentation by Ted Etter and Corri Apodaca who will provide us an express version of the advanced metering training that has been offered and will continue to be offered nationwide.
Finally we’ll conclude with Sarah Baker, one of our leading energy experts. She will speak about the utility bills unit process, Ameresco’s access system and updates to that and the Bills to Buildings effort that connects these two processes.
With that, I would like to introduce Heather Boaz. Heather is a civil engineer on the White River National Forest. She’ll be speaking with us today about incentivizing cost savings, FY ‘14 team overview and recruitment. Take it away Heather.
Heather: Thanks Laura. My name is Heather Boaz. I am a co-chair to the Incentivizing Cost Savings Team with Randy Parker, who is also on the White River National Forest and is our forest engineer. Next slide please.
Today I’m going to keep it short and cover four key questions about incentivizing cost savings. The first question I want to answer is why incentivized cost savings? The second is how do we figure out what the cost savings are? Third, what existing tools can help incentivize cost savings? Fourth, what is happening in fiscal year 2014 and how can you be involved? Next slide please.
In the first question, why incentivized cost savings? The reason we would like to do this is because in the current Forest Service budget process, it is complicated to identify what your savings could be. This is because we pay our bills through cost pools. Utilities such as energy and water would
080713-412064-Usda-SustainableOperations21 (Completed 08/10/13)
1 of 25
be tied in with our building costs and facility costs. At the end of the year, we might not be able to pull those savings back out to realize them. So with this challenge, we want to look at the budget allocation process and find ways to help get those savings back to the unit to continue to support their projects. Next slide please.
The second question I want to answer is how do we figure out what the cost savings are? There are two ways, but before we start looking at cost savings we have to look at the resources that are invested to accomplish sustainable operations projects. Those two key resources that are invested are engaged people. Those are those folks that are supporting the project, making the project possible, overseeing it and keeping it going.
The second part is financial support that could either come from our partners or our own core service budget. Those are important parts to understand. After we understand the resources that are invested, we have two ways. Then the top arrow, I’m going to call that our real-time data method. That’s going to start with a utility bill clean up process to identify what your baseline is. Then you can take the conservation actions.
An example of this would be you do a utility bill clean up. You do a baseline to understand the usage of energy in an office. Then your office decides we want to conserve energy so we’re going to replace windows. We might improve insulation but we don’t actually know what those savings are going to add up to be. So we will look at the bills after the action is taken and our energy use before the action’s taken and try to use some sort of normalized calculation to understand what those savings are.
Another method, which is the bottom arrow, which would be using accepted calculators that estimate cost savings, would be to go through the same baseline process. Then use calculators to estimate your savings and use that information to support your action. There are two different calculation methods. Our team wants to look at both to see what works best for the Forest Service in certain situations. That all adds up to resources that are saved; that’s time, that’s money that can be re-invested back into the local unit which is really important. Next slide.
In the bottom arrow we thought that we wanted to look at tools and calculators that already exist. The part of this our team wants to really
080713-412064-Usda-SustainableOperations21 (Completed 08/10/13)
2 of 25

understand the existing tools in the Forest Service and outside of the Forest Service that we can use to help incentivize cost savings.
The first tool we want to look at is the Climate Change Scorecard. The reason why this is important is that the Climate Change Scorecard is set up to help the Forest Service reduce its environmental footprint as an agency. An example of why this is important is they have questions. They’re like, “Does your unit use environmentally friendly landscaping around most offices?” This might be a way for us to track and identify actions that can save resources for the Forest Service.
The next tool we want to look at is LISO, or Leadership in Sustainable Operations, which is a tool that builds from the Climate Change Scorecard and then looks more intensely at each action to understand the end task that the action has for the savings. Also the effort that it takes to accomplish that action. So they might have more questions like, “Did you install high-efficiency hand dryers in the bathroom?” which is quite specific. Or they might have a complex problem or question like, “Has at least 10% of the total energy consumed on your unit come from renewable energy?” That definitely takes a lot more effort to do because you have to understand your baseline and accomplish those goals.
The next tool we would like to look at is greenhouse gas inventory processes. The greater Yellowstone area did a study of greenhouse gas-reducing actions. They came up with tools such as powered smart calculators or lighting upgrade calculators or calculators for computers on or off and their impact on our energy use. Additionally the Greenhouse Gas Tracking Team pilots through the Sustainable Operations Program. It is putting together tools that we would like to look at as well.
The next tool in our tool box is Sustainable Operations Top 10 Calculations. This came out in fiscal year 2012 as a recommendation. At the time, all the actions for sustainability were looked at and a list of 10 actions were prioritized, based on having relatively low effort with high impact. Their first action was having a utility bill clean up done. Then identify your top energy and water-using facilities. Their second was install at least two energy-efficient technologies in at least 75% of all your buildings. Both these actions can have significant impact to your energy use on your unit when completed.
We also want to look at other tools that might exist. For example, a utility company might give your unit a rebate for energy conservation measures. They determine what your rebate would be because they
080713-412064-Usda-SustainableOperations21 (Completed 08/10/13)
3 of 25

have extensive calculators that say, “If you do this action, this is the energy saved. If you do that action here’s how much you’re going to save.” So that would be if you upgraded your lighting from T12 bulbs to T8 and you reduce the number of light bulbs, they would tell you exactly how much energy you will probably save each year and base the rebate on that. That’s a tool that we could also look at. Next slide please.
This year our team got off the ground a little bit slow. So we have a lot of great and fun work to do next year. Our team member diversity I think is going to be really important to the success of building a method for incentivizing cost savings in the Forest Service. Right now we have four engineers. So we definitely lack some diversity. We want to look for some folks with leadership experience and communication. We definitely need help from the budget side of the agency to really make sure that we’re using the existing budget protocol as a part of how we build this tool.
Once we have the right team mix, next year we’re going to kick off with a Team Learning Peers on Existing Tools. We’re going to ask guest speakers from each of the tools we discussed on the previous slide, to come in and teach us about the nuts and bolts and the hard work that went in behind the tools so we can understand those processes.
We also are going to get training on budget allocation processes. I think this really will help us understand how to not only get the money back to each unit but let each unit know that that money is coming back to them through this cost-incentivizing process.
Finally, we’re going to take all of that information and use it to help with a pilot project using existing forest data. That would be like doing a utility bill clean up and looking at that data-based process to understand our cost savings. That’s where we actually look at utility bills and actions and see what happened. Then hopefully we’ll end up with a process guide that we can go to the chief office and work with the national budget and finance office to implement the savings process so that units can start getting funds back for their hard work.
That is what we’re working on. If you are interested in participating in the team, there will be a 2014 sustainable operations call letter. It would be best to respond to that and let them know that you want to participate. I want to thank everyone for your time. I’ll hand this back to Laura.
080713-412064-Usda-SustainableOperations21 (Completed 08/10/13)
4 of 25

Laura: Great. Thank you so much for that presentation Heather. That really plants the seed for the types of opportunities that are coming out of the collective FY ‘14. We will be taking questions after each individual speaker today. So this would be a great time to gather your questions for Heather. We’ll also be re-opening the line at the very end of today’s webinar for questions to all speakers if anything pops into your mind later. Now Emily, would you take questions for Heather?
Emily: Sure thing. Once again, if you’d like to ask a question you can dial *1 on your phone to put yourself into the queue. You’ll hear a notification when your line is un-muted at which point you can state your name and your question. You can also send a note to “presenters” and we’ll post these questions for the benefit of the entire group. Right at the moment there are no questions on the line. I’m not seeing any notes yet either.
Laura: Okay, if there are still no questions …
Emily: No.
Laura: Okay. Let’s move on to Laurie Yeager. Laurie is a facilities engineer on the Arapaho and Roosevelt National Forest and Pawnee National Grasslands. She’ll be speaking to us today about a Bike-to-Work Worksite Challenge. This was an excellent example of community engagement to promote sustainable operations. With that, I’ll hand it over to Laurie.
Laurie: I am also the lead for the green team here in our supervisor’s office. Also climate change coordinator for Element 10. Next slide Laura.
Here in Fort Collins we’re lucky to have our supervisor’s office and our Canyon Lakes ranger district located in one of only four platinum bicycle-friendly communities. Recently Fort Collins earned this platinum designation. That’s something that is a real big attraction for the Fort Collins area. It’s also something that is celebrated a lot here. The Bike-to-Work Worksite Challenge was created by the city to encourage the Fort Collins community to spend more time on their bikes.
What the worksite challenge is is a friendly competition between local businesses to see who can get the most employees to ride their bikes to work each Wednesday from June through September. Companies are separated into different size classes so that you’re competing against a company that is of similar size as your company. For example, there are four size categories. They range from like one to 29 employees, 30 to 99 employees, 100 to 299 employees and 300+ employees. Since we’re a
080713-412064-Usda-SustainableOperations21 (Completed 08/10/13)
5 of 25

combined SO and district, we’re in that third category. We have roughly 150 employees in this building.
They use what they call an effort index, which is a formula to compensate for your company’s size. It’s not scored on a straight percentage basis, because it’s much easier for a company of five employees to have 100% participation than a company of 50 to hit that same percentage. What they found is on average the participation decreases with the square root of the company size. So the separate index is the number of employee participants divided by the square root of two times the total number of employees. That’s how they gauge the effort of your company.
At the end of September, then the worksite with the highest overall effort index throughout the summer wins some bike-related prizes. They are also tracking the total number of round trips and the mileage. Next slide Laura.
We have our SO and our Canyon Lake ranger district and we also have an administrative site here in town that is all participating in this challenge. We had our deputy forest supervisor send out an e-mail kicking off the challenge. This photo here is our forest supervisor with Smokey and our Bike-to-Work Worksite Challenge coordinator on Bike-to-Work Day. We had that on our home page for awhile. It was really helpful to have support at the leadership level.
As a green team, we decided to join this challenge. Then we also wanted to enhance it a little bit. So we added a second challenge that is every day from June through September, whereas the city’s challenge is only on Wednesdays. We have one of our green team members that serves as the worksite coordinator. He puts spreadsheets around the building and at the ad site. Folks just log their own miles and their number of trips. Then he collects that data monthly and sends it into the Fort Collins bike coordinator.
Then at our monthly safety/family meeting, as a green team we give out water bottles to these monthly awards. We do most days ridden for the month, the highest total mileage for the month and then we have just a random drawing for anyone that is participating. At the end of the challenge we’ll be having some grand prizes as well. Next slide Laura.
As you can see, they’re still compiling the end of July results. We are in the tandem category in that 100 to 299 employees. As you can see from these results, we’re not a clear front runner but we’re kind of holding our
080713-412064-Usda-SustainableOperations21 (Completed 08/10/13)
6 of 25

own there in third place. These results show only our effort in mileage on Wednesdays. Roughly the last check was a little over 30 participants. In June they had commuted over 200 days and over 1,000 miles. Next slide Laura.
As a green team we had been talking about what kind of competitions or challenges did we want to promote? This one was available to us as a member of the local business community. We are also members of a local program here in Fort Collins called Climate Wide. So it was very easy for us to jump on board this one because it was already available. All we had to do was just sign up and kind of track our progress in this challenge. We’ve also talked about where do we want to go with this? Or what would be some possibilities for next year? We had talked about maybe expanding it to all districts to get more forest-wide participation.
We had also discussed about incorporating alternative commuting into the challenge such as carpooling, public transportation or walking. It could be something that maybe there could be a friendly competition between forest and/or regions that somehow allow for seasonal variations. In some communities it’s probably not as desirable to be commuting in the heat of the summer on your bike.
Those are some possibilities that we had talked about. I guess I just wanted to take the opportunity to talk about established competitions and challenges may be available in your local community so there’s no need to develop your own. You can join those or maybe tweak to fit your needs and circumstances. Next slide and I am open for questions.
Emily: Once again you can dial *1 on your phone or send a note to “presenters.” Laura, I am not seeing any questions yet.
Laura: Okay, thank you Emily. We will have a chance to address questions to all speakers at the very end of today’s webinar. If something does pop into your mind, please just jot it down and we’ll have an opportunity to direct that to Laurie leader. Thank you so much Laurie. That was an excellent model of how to piggyback off of a community program and make it meaningful at the local level. Thank you for providing us with that case study.
Next we have a tag team presentation by Corri Apodaca who works for the Digital Visions Enterprise Unit and is based in Albuquerque, New Mexico and Ted Etter, an electronics engineer based in Missoula, Montana. They are going to be providing us with an expressed version as
080713-412064-Usda-SustainableOperations21 (Completed 08/10/13)
7 of 25

best they can of the advanced metering portal known as Web Reporter. They will be showcasing a variety of reports that you can pull directly from the system for those with advanced meters. So with that, Corri and Ted the stage is yours.
Corri: Hello everyone and welcome. I’m very excited to be a part of this webinar today. My name again is Corri Apodaca. I work with Digital Visions Enterprise Unit. I’ve had the pleasure of working on the Advanced Metering Project for about a year-and-a-half now.
So what is advanced metering and what is this project about? Quite some time ago, advanced meters were being placed in the larger of the Forest Service buildings to monitor energy and power usage. While meters themselves do not save money, there needed to be a way for us to extract the data the meter is pulling.
After some research on different software packages, ION Enterprise was chosen and installed into the Forest Service network. Part of the ION Enterprise package is Web Reporter which allows us to run reports on the data collected by the advanced meters. Today we will be showing you how to run these reports and what we can learn from this data. My co-presenter, who has been absolutely wonderful to work with, is Ted Etter. Ted?
Ted: Good, I’ll bypass the speaker phone. The handset sounds better anyway. Okay. After that rocky introduction, yes I’m Ted Etter, the electronics engineer at Missoula Technology and Development Center. Advanced metering was added to my list of projects about six years ago. It’s taken almost that long to decide which meters to install in our buildings, what kind of reports we need to be able to present and what parameters other than electricity we would like to be able to bring to your desktops and help you view.
Today’s presentation is a quick overview of the kinds of information we can get from the meters and a preview of coming attractions, because we are just starting to get out of the strictly electrical energy business and look at gas, water, steam and other parameters.
We’re also working with a fairly basic reporting software package. We’ve been trying to generate the reports that we thought people would be interested in but we haven’t had a lot of feedback. So this is perhaps a starting point for people to tell us if we’re providing useful information or
080713-412064-Usda-SustainableOperations21 (Completed 08/10/13)
8 of 25

if we need additional software. We will show you what we have so far and what’s going to be available in the near future. Back to Corri.
Corri: All right. So some highlights to mention before we get started, we do offer an hour session which usually turns out to be about an hour-and-a-half on Web Reporter, which we highly recommend taking. The next full webinar is scheduled for August 15th. The session as well as future sessions are posted on the advanced metering SharePoint site. We will be sharing this URL at the end of the presentation. All right, next slide please. Thank you.
Here we are looking at the home page of the advanced metering SharePoint site. We are showing a bit of this today because we found it to be a wonderful tool for running the reports. Note the links at the top. We have the WO Advanced Metering homepage which is maintained by WO Engineering. It has a lot of great information on it. We also have the link to the Web Reporter application which is where we actually run the reports, which we will be showing you here in a minute.
We also have a link to the training calendar which I mentioned earlier. We have a link to a page that provides helpful documents and other information for commissioning meters and we have a report parameter list. This list shows which parameters are available for reporting on our meters.
Now if you take a look at the “Quick Launch,” which is the list on the left hand side of the page, we have some other useful tools and information there as well. The one I want to talk about now is the meter data. If we were to click on the “Meters by Region” link under meter data, it’s going to take us to the list of meters installed on the Forest Service Network. Okay. Next slide please.
Okay. If you look at the first column we see the names of the meters as they are in the ION database. The second column noted there with the arrow displays the names of the 6,200 meters or submeters as they appear in Web Reporter. There’s also contact information and the physical address of the meters here as well.
The second to the last column has a link to the web page for the meter. So if we were to click on any of these links … Okay, next slide … We would see the current data for the meter selected. This screen shot here is the main meter at the Region One Fire Cache showing current data.
080713-412064-Usda-SustainableOperations21 (Completed 08/10/13)
9 of 25

If you look on the left, you will see another list. All entries under “Trending and Forecasting” are the 6,200 or submeters that are daisy chained off the main meter. So on this particular page here, if we were to select one of the links for the submeters, we would be able to view their current data as well. All right. Let’s go ahead and take a look at Web Reporter. Next slide.
Here’s the log in page for Web Reporter. We do have a generic user name and password which is available on the SharePoint site or you can request access through me as well. All right. Next slide.
Once in Web Reporter we see the “Report Area” page. This page includes the report selection pane on the left which allows you to select a report to generate and view. It also has the report parameter input area which allows you to select specific meters and measurements. It has the “Report Display” pane which is where the report will appear once all inputs are selected and the “Generate Report” button is clicked. Okay. Let’s move to the next slide.
All right. Here we are looking at the windows that we select from when the “Select Sources and Select Measurements” buttons are clicked. The window on the bottom left shows what loads when we click the “Select Sources” button. These are the names of the meters as they appear in Web Reporter. Now only the 7550 or main meters will pull data in this area. By looking at the SharePoint site again, we are able to figure out which meter belongs to which site.
In this case, we’re going to select the “Main Meter at the Region One Fire Cache.” Now the “Select Measurements” button loads the window there on the bottom right. This is the list of parameters that can be run on the meters. Again, it’s very important to note that all of the parameters do not work for each meter. We kind of found this out as we were working through Web Reporter. This is outlined on the SharePoint site as well. In this particular report here, we will be selecting the kilowatt hours delivered. All right. Let’s move on to the next slide.
Here we are back at the “Report Selection” pane. We’ve got our selections made and now we can select “Generate Report.” All right. Next slide please. Thank you.
Okay. Here’s the graph for the kilowatt hours delivered at the Region One Fire Cache for a seven-day period. If you note at the top left of the graft, there is 16 pages total in this report; the first page being the graph
080713-412064-Usda-SustainableOperations21 (Completed 08/10/13)
10 of 25

that we see here and all the other pages containing tabular data. You’re also able to select the format so you can export this data to pdf, Excel or other formats as well. Ted?
Ted: Thank you. Could we actually back up for just a moment? Thank you. This is a running total of the number of kilowatt hours this building has consumed. At the start of that last week of June from the time we flipped the switch, the meter says we had consumed 218,000, about 700 kilowatt hours. A week later we were up over 221,000 kilowatt hours. If you want to compare that with what the utility company is charging you for, you would have to do the math to figure out how many kilowatt hours did this change over the week. You could try to get that number eyeballing the graph, but it’s easier if we go to the tabular data on the pages below. Now if we could go to the next page.
All of the information that went into making that graph up are contained in several pages of spreadsheet information listing the time at which the measurements were taken and the values. At the start of that week, that building had consumed 218,820 … Almost 23 kilowatt hours. At the end of that week it was up to 221,055 kilowatt hours. That’s a lot of kilowatt hours but again, the utility company is going to charge you for the difference. So if you do get our your calculator or your pencil and figure out what the difference is, it’s going to wind up being, if I can find my appropriate page, on the order of about 2-1/2 thousand kilowatt hours. That’s the number you can compare with what the utility is charging you for.
This report was for one week’s data. It is possible to pick specific starting and ending dates, so that you can align the report with the billing interval for the utility company. Then you can compare our measured kilowatt hours against theirs. If there are minor differences, that’s okay. Our accuracy is within a couple of percent. If there are big differences in kilowatt hours between what we record and what the utility is charging us for, it’s time to go investigating. I did find my notes. That was 2,232 kilowatt hours over the last week. Next slide please.
Corri: All right. Here we’re looking at the kilowatt total mean on the main meter again at the Region One Fire Cache. Ted?
Ted: Okay. Now instead of measuring kilowatt hours, which is energy, we’re measuring kilowatts, which is power. The value in this graph is finding out how is our power consumption changing during the time of day?
080713-412064-Usda-SustainableOperations21 (Completed 08/10/13)
11 of 25

Again, judging by the calendar dates, we started on a Wednesday. In the course of the evening and the early morning hours the power consumption was fluctuating around 10 kilowatts. As people came into the building around 7 or 8 in the morning and turned on lights and computers, the power consumption went up to 25 kilowatts, peaked around 30 kilowatts early afternoon. Then as people left and turned off lights and computers, the cleaning crew came and went around 9 or 10 o’clock at night, we were back down in our 10-kilowatt average.
The pattern repeated the next day. It kind of looks like the heating and air conditioning turned on and off during the night a few times. As people came in, we again wrapped up between 25 and 30 kilowatts in the middle of the day. When people left, it dropped back down to 10 kilowatts at night.
Friday was similar, a little less frenetic. Then Friday night everyone went home. Most of the lights were out and the building consumed a little less than 10 kilowatts on the average through Saturday. Sunday, maybe someone came in and turned on some lights but not much happened Sunday. Then Monday again you can see a pretty clear distinction of when people showed up and turned everyone on and started doing business. It looked like people left for lunch en mass. There was quite a dip around noon. Then when they came back from lunch everything fired up and they were active again.
Here’s a chance to analyze the behavior of people and equipment in the facility, decide whether you’ve got too many lights on, if the air conditioning is working overtime, if people are leaving computers on overnight or over the weekend and maybe you can start changing some behaviors or deciding that some of the equipment needs to be upgraded so you can reduce this power consumption. Corri?
Corri: All right. Next slide please. All right, if we want to run a report on the 6,200 meters or the submeters, when we click the “Sources” button we will want to look under the “Other” option. So in the screen shot on the top left, this is what loads when we click “Select Sources.” Note the first option is “Other.” This is where you’ll find all 6,200 meters for reporting purposes. The bottom right is just other expanded showing the list of meters. Again, all these names can be found on the SharePoint site. Let’s take a look at a report for the 6,200 meters. Next slide.
All right, here we are looking at kilowatt total for the Fire Cache Dormitory and the Fire Cache Coordination Center. These are both 6,200
080713-412064-Usda-SustainableOperations21 (Completed 08/10/13)
12 of 25

meters. We will also see the measurement of kilowatt total next to the “Measurement” button up at the top left. Once all the inputs are in I can select “Generate Report” which will bring up the reports shown there on the bottom left. Ted?
Ted: Thank you. Once again we’ve got a power consumption display which shows us how power is being consumed from one 15-minute interval to the next as the days and weeks go by. Again, it’s good for looking at the behavior of users of the building, the air conditioning, the lights and various motors and devices inside that consume electricity.
The Fire Cache Dormitory, where our smoke choppers sleep, tends to get a little more activity early in the morning and late in the day. That’s the kind of brown or all of green graph a little lower on the screen. There tends to be a little more activity in the morning and late in the day for these guys. The middle of the day there’s not too much activity.
The Coordination Center however, where we bring people in for briefings and we have communications dealing with fire fighting, does tend to be active in the middle of the day. So you do see a definite pick up in activity as the early morning arrivals occur and people start communicating with the field and making plans. There’s a real peak in activity around 12 or 1 in the afternoon. Then as the day winds down people take off and the Coordination Center gets pretty quiet. So it’s a pretty regular pattern. I’m not sure what happened on that particular Friday where there was a big spike in the afternoon. I couldn’t tell you if that was the air conditioning because it was a particularly hot day or if there was a big meeting and a lot of people came in and plugged their computers into the wall to get charged.
This again tends to give you some kind of behavioral indication of how people are using their time. It dropped down a little bit on Saturday but Sunday there was some activity later in the day. Fire fighting was in full swing in some areas so the Coordination Center was fairly busy.
Again, take this information back and see if you can get people to turn their computers off when they aren’t using them or turn their lights out when they leave the rooms. Corri?
Corri: All right. Let’s look at some more reports. Let’s jump to the next slide. Here we have the kilowatt hours delivered at the Region One Fire Cache Coordination Center, again a 6200 meter. Ted?
080713-412064-Usda-SustainableOperations21 (Completed 08/10/13)
13 of 25

Ted: Yes. Again this is our cumulative graph. You could try to read the kilowatt hour totals on the left side of the graph and then do the math to figure out how many kilowatt hours we used over the week. Or if we go to the next slide, you can pull up the tabular data and get the information a little more accurately and make it a little easier to do the math. I did get out my pen and practiced my arithmetic and found over the course of this week, this building consumed 1,722 kilowatt hours. Again, I could’ve chosen a different interval that would match up with the utility company’s billing cycle, gone through the math and seen if this building matched what they were charging us. Corri?
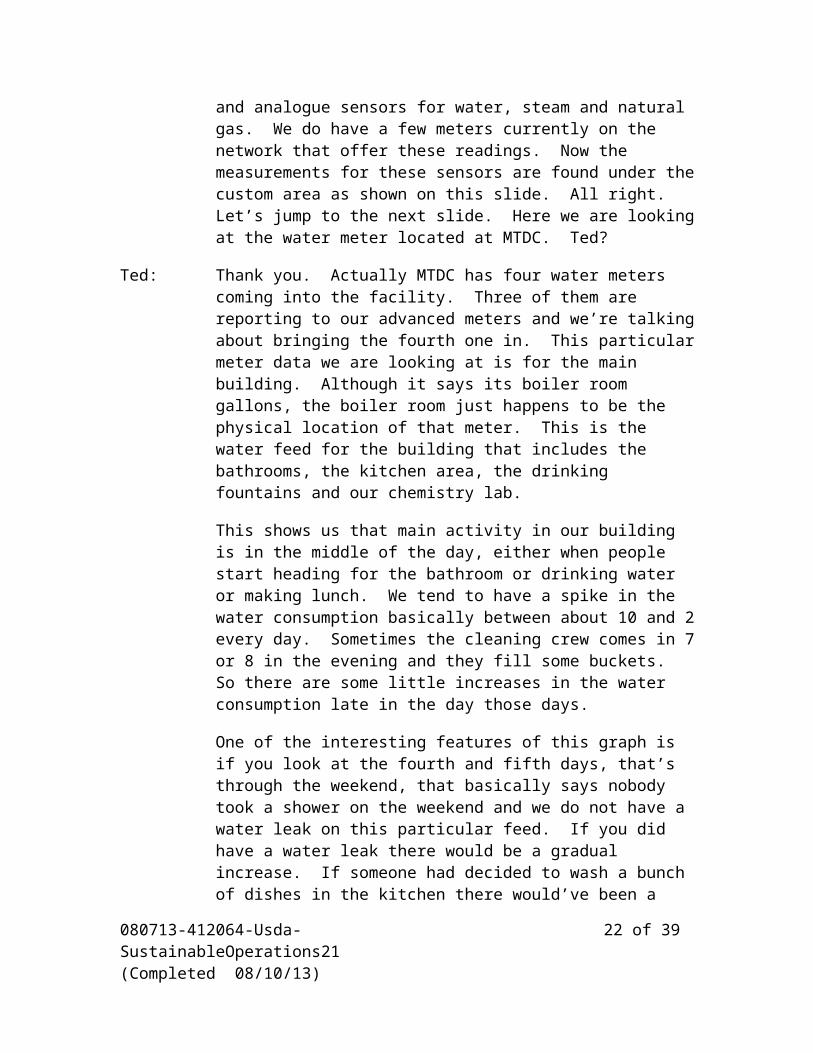
Corri: Okay. Let’s jump to the next slide. All right, Web Reporter reports are not just for electricity. The 7550 meters or the main meters have digital and analogue sensors for water, steam and natural gas. We do have a few meters currently on the network that offer these readings. Now the measurements for these sensors are found under the custom area as shown on this slide. All right. Let’s jump to the next slide. Here we are looking at the water meter located at MTDC. Ted?
Ted: Thank you. Actually MTDC has four water meters coming into the facility. Three of them are reporting to our advanced meters and we’re talking about bringing the fourth one in. This particular meter data we are looking at is for the main building. Although it says its boiler room gallons, the boiler room just happens to be the physical location of that meter. This is the water feed for the building that includes the bathrooms, the kitchen area, the drinking fountains and our chemistry lab.
This shows us that main activity in our building is in the middle of the day, either when people start heading for the bathroom or drinking water or making lunch. We tend to have a spike in the water consumption basically between about 10 and 2 every day. Sometimes the cleaning crew comes in 7 or 8 in the evening and they fill some buckets. So there are some little increases in the water consumption late in the day those days.
One of the interesting features of this graph is if you look at the fourth and fifth days, that’s through the weekend, that basically says nobody took a shower on the weekend and we do not have a water leak on this particular feed. If you did have a water leak there would be a gradual increase. If someone had decided to wash a bunch of dishes in the kitchen there would’ve been a little increase too. There was little activity or no activity that was measurable over the weekend. That’s part of the
080713-412064-Usda-SustainableOperations21 (Completed 08/10/13)
14 of 25
value of this particular graph, is to make sure you don’t have a toilet that’s stuck running or somebody didn’t leave a sink on. Or there isn’t a leak somewhere and we’re losing water. Corri?
Corri: All right. The next slide please which again shows the tabular data for this particular report.
Ted: Right and we could do the math and figure out how many gallons we consumed over a week or over a month and compare that with the utility bill. Corri?
Corri: Next slide please. All right. Here is the natural gas meter located again at MTDC. Ted?
Ted: Yes. This isn’t too exciting for summer. Frankly I’m surprised that this is showing any activity at all. We must just generate a little bit of hot water during the day but we aren’t doing anything to keep the building warm. If we went back and looked at natural gas consumption in December or January, this would look a little different. Again, it’s a cumulative reading. We can go to the tabular data and figure out how many cubic feet of natural gas we consumed over the course of a week or a month and compare that to the utility bill. Right now we are recording in cubic feet. The meter will allow us to convert that into therms or dekatherms or BTUs so that we can match our gas reporting with whatever energy reporting the utility is using.
This is something that we’re in the early phases of considering. As we install more gas meters across the Forest Service, we need to get a consensus about whether we do want to report cubic feet or dekatherms or BTUs so that we get the same reports on all of the meters. Corri?
Corri: All right. Next slide. Finally, here’s the PV array located in San Dimas.
Ted: Okay. This is our poster child for a Forest Service facility being an energy-generating site instead of an energy-consuming site. The San Dimas Technology and Development Center has a 300-kilowatt PV array that makes them a net producer of electricity instead of a net consumer. Of course it only produces power during the day. What this graph shows is that overnight if it was extremely dark out, the building when nobody’s inside consumes about 20 kilowatts.
As people arrive and turn on lights and computers it goes up to about 50 kilowatts. As the sun comes up and the panels get eliminated, we quickly turn that around. We go from buying 50 kilowatts from the utility to
080713-412064-Usda-SustainableOperations21 (Completed 08/10/13)
15 of 25

pushing over 100 kilowatts back to them. As the sun goes down, we maintain a little bit of power consumption from the utility and again overnight it’s about 20 kilowatts.
This is a pretty repeated pattern, although you can see clouds moving across the PV array with some of the rough areas where we are trying to generate electricity, which shows up as negative numbers when we’re in the black on electricity production. When nobody’s in the building on the weekends, we can produce close to 200 kilowatts in the middle of the day. Again, overnight it’s about 20 kilowatts, but you don’t see people coming in and turning on lights and computers early in the morning or late in the day on weekends.
It looked like on that Sunday there was some scattered clouds. Monday it took awhile for the sun to come out. There were obviously some clouds. The consumers in San Dimas took close to 100 kilowatts of power before the sun came out. We turned it around and started pushing over 100 kilowatts back into the grid.
This is a unique arrangement. There had to be some special agreements made with the local utility company in order to be able to put that kind of energy back into the grid. The end result is San Dimas gets wholesale rate for the electricity they produce above and beyond their consumption. That credit reduces the energy bill for the Angeles National Forest supervisor’s office. This is something we could conceivably do in other places either with wind or solar. Corri?
Corri: Okay, next slide please. All right. This concludes our mini Web Reporter session. Here is the link to the Advanced Meter and SharePoint site along with our contact information as well. Are there any questions?
Emily: Once again you can dial *1 or you can send a note to “presenters.” I’m not seeing any questions.
Laura: Corri and Ted, you must’ve wowed everyone with the information. I will say if any of you do work with other energy managers, please let them know about this SharePoint site and the upcoming full length training to make sure as many people as possible are familiar with the Web Reporter tool. Thank you Corri and Ted for that overview.
Ted: You’re welcome.
Laura: Last but certainly not least is Sarah Baker. She is the Region Three Environmental Management System Program Manager based in
080713-412064-Usda-SustainableOperations21 (Completed 08/10/13)
16 of 25

Albuquerque, New Mexico in the Region Three regional office. Today she’s going to speak about utility bill clean up, Ameresco’s access update and the Bills-To-Buildings effort that connects these two efforts. With that, take it away Sarah.
Sarah: Thank you Laura. I appreciate that. My background again, I think you’ve heard this a couple times today, is in engineering. What I’m talking to you about is something that connects up across engineering budget, sustainable ops, all kinds of different staff area. So it’s really a cross-cutting issue. Next slide please.
I want to talk about three specific efforts that are going on but really how these all connect and what we’re trying to do with them. The utility bill clean up efforts have been ongoing for quite awhile but utility system changes are something that are relatively new. We’ll look at what these area. Understand that in sustainable operations we’re really focused on getting good baseline energy and water data and on providing a feel with easy access to that data. That’s really the key of what we’re doing. So a lot of things we’ve talked about today come into play here. Next slide please Laura.
The utility bill clean up efforts, and we have one of the champions in fact on the call today in Laurie Yeager, had been focused on looking at our account information and figuring out how much energy we’re using, getting really good data. The reason this is an effort is because originally our utility bills came to the Forest and we would be able to look right through them there. The facilities engineers and the budget officers on the Forest kind of knew what we were looking at. We knew what the bills were for.
When we centralized our BNF process, the bills started going to ASC. The only problem there is that the people at ASC are looking at the bills within a certain set of parameters. So if a bill is really high it will set off alarms. If not, they will be paying the bill and the people in the Forest wouldn’t see what they were paying. The flip side of that is that the people on the Forest had no idea how much they were spending for utilities quite often, at least not in specific terms.
We really wanted to find out what each building we’re pay for, what we’re actually paying for in utilities. We want to check the rates that are being charged because what we found is that some utility providers are charging us rates that aren’t appropriate. We’re a government agency. In some cases we don’t pay tax on certain building utilities. We wanted
080713-412064-Usda-SustainableOperations21 (Completed 08/10/13)
17 of 25

to be able to check those and see what we’re getting charged the right rates. Make sure that we’re actually being charged for accounts that are live. In some cases we’ve discovered accounts to utilities that we’ve been cut off for quite awhile but we’re still paying a monthly fee because nobody notified ASC to tell them to quit paying those. We’re not pointing fingers at anybody. This is just the way the system is set up. We’re really working on fixing this system.
The reason again for this is the baseline. We need the baseline data. We also need to know how much we’re using. This will actually help us save money besides saving energy. We’ve discovered through these efforts that everybody almost I think who’s done this so far has found some cost savings embedded in the system. That’s the utility bill clean up efforts. That’s what we’re working on that has been going on for awhile. Next slide please.
The second thing that’s happening right now, a piece I want to connect up is the utility system updates. Those of you who were on the phone who were involved with TUMS or the budget shop at all know that this is happening but the others of you may not. TUMS, we all remember TUMS is the Telecommunications Utilities Maintenance System we’ve been using for years to pay our bills. TUMS is going away. The two new systems that will be taking over are MedTel for our telephone bills and Ameresco for all of our other utility bills. They’re splitting into two. This is going to give us some challenges but it’s also going to give us some opportunity. Next slide please.
If you’re wondering why this is a big deal right now and you’ve probably heard some people talking about it, our utilities system change affects something like almost 13,000 accounts in this agency. We’re the biggest part of the USDA. This is happening USDA wide. It’s not a Forest Service initiative. It’s an update to a system because we have a new contractor. The really cool part about this is sustainable operations had the opportunity to help in choosing the contractor based on performance so that we could access the data. The tough part is, we’re looking at almost 13,000 accounts rolling into this new system. Okay. Next slide Laura.
What I’m providing to you right now is some of the information that NFC provided to us, to the agency. This is sort of how we’re doing the update. Ameresco is the big company that’s taking the utility data. They’re looking at this in an implementation plan that will help roll in the information one chunk at a time. I’ll talk about this a little bit but if you’ll look on the next slide you can see how this is being done. We’re
080713-412064-Usda-SustainableOperations21 (Completed 08/10/13)
18 of 25

approaching it from … The next slide Laura. Sorry. We’re approaching it from the east coast and rolling out to the west. Now the live dates that were presented to us originally may change a bit. You can see the live date on the very bottom of this slide.
One of the things that’s happening is as the utility rolls in, Ameresco takes over paying the bills, they have to issue a letter to each one of the utility providers. That’s what that LOA is is the letter of authorization they’re issuing saying that we are now authorized to pay these bills. This is going to be an interesting situation because a lot of companies are getting these letters. Some of them will probably listen to the letter and some of them will probably have some time lag before they start billing correctly. We may see some issues popping up. I’m hoping it’s going to go really well.
The next slide will give us the migration timeline. You see what’s happening right now is that every agency and subagency is having to go through and verify their data. That’s what we are working on at this very moment. We have a list of accounts and we’re having to look at them and say, “Yes, this account’s good. No, this account should be closed. You’re missing this account,” and having to make sure that the list is correct to give to Ameresco so that they can roll it all in.
We’ll then be looking at how the implementation goes across the USDA and hopefully by about November, December we will go live as they’re calling it with Ameresco. At least by the beginning of the calendar year we will see the access which is the software that Ameresco is providing online, access for employees so that we can see what we’re using for energy.
Finally in January and February, UTVN, TUMS … All that will be going away. There’s no point in holding onto the system. It’s going away just so you know. Okay, next slide please.
Some of the issues that are possible here as I mentioned the letters of authorization may or may not be real effective right off the bat. It may take a little while to make the adjustment. We’re going to see some delays we know because our verification data from our agency was actually due on August 2nd. We’ve had to negotiate a delay because we had some issues getting that information out to the field. Our verification data is not actually due until August 23rd now. That’s a good thing. We have a few extra weeks. We’ll see what happens.
080713-412064-Usda-SustainableOperations21 (Completed 08/10/13)
19 of 25

We have heard some rumors of people that have reported utilities are not getting paid. They’re not being entered into NFC but I don’t know what the issue is yet. VNF is working on that. The timing here is not really great either. Of course no timing for changing a system ever is but VNF is also really, really busy working on FEMI. As we all know, that hasn’t rolled out as well as we’d hoped. You may have to be patient with people in VNF. They’re working a lot of stuff at the same time. Next slide please.
What we’re talking about when we talked about the data and verifying the data, we also get this opportunity to put in some location information. This is really exciting for those of us in sustainable ops. Of course some things we get really excited about easily. We have four levels of location information for each one of our accounts. The first one is the USDA. The second one is the Forest Service. Level three is the one we’re entering right now because that did not automatically roll in for anything. We don’t have this data already hooked to the accounts. What this is is the location information down to a district office.
What we’re using to put this in is a template. The format for putting this information in for everybody in the agency is the six-digit region forest district number or the equivalent for the research stations. Then the closest to the ground level unit name. In this case, the example is 03. That’s Region Three, Forest 10, District Three, the [inaudible 01:58:57] Ranger Distract on the Santa Fe National Forest. We don’t have to write Santa Fe National Forest because that forest 10 tells us this. We’re writing him as ranger district because some people accessing the system won’t understand the numbers. Some of the people paying the bills, they need to be able to look up quickly where this is. That’s the level three data. It has to be put in for every account in order to roll them into Ameresco. Next slide please.
One of the opportunities we have if you’ve done a Bills-to-Building tie and that’s through the utility bill clean up process we talked about, this is where you get to put in the exact information of what building actually this account serves. You’ll only know this if you’ve done this clean up and you’ve made all the connections between the account and the building and you found the meter number in the account and the meter number on the building and they link together. Then you can update this level four data.
So for instance right now what’s rolling into the system it says [inaudible 01:00:00] Ranger District. That doesn’t really tell us anything. We have a
080713-412064-Usda-SustainableOperations21 (Completed 08/10/13)
20 of 25

lot of accounts there. If we update it and say [inaudible 01:00:07] dwelling number 52 which is the infra building name, we can now tie this directly to the building when the data rolls in. I also showed this with a number in front of it. That number is a building number out of infra. There is no standard format yet for level four data entry because it’s not happening in most places. I’m suggesting that you might think about how you’re going to tie it to your infra data so your facilities engineer can use this data as well. So an infra number might work. Okay, next slide please.
More will be happening as the data is updated and verified. One of the big things is Ameresco is going to provide us an online tool, the access software that I mentioned, to view our data. So the more information we put into the system for Ameresco the better data we get to view and it makes sense. They have an opportunity for us to put in the gross square feet of buildings for each account. If we have that, then they will display the energy intensity. We are being required by executive order to reduce our energy intensity so we get to see the actual number for a building. That’s going to be really exciting.
We also have the opportunity to put in things like the set points for the heating and cooling systems. Then we can see those displayed when we’re looking at how much energy we’re using. If we change then, we can see how it effects the energy use. There’s going to be training coming up to make this all understandable. We don’t know exactly what that’s going to look like yet but we’ll see it. Ameresco has done some demonstrations for us to show us what the website looks like. It’s very simple. It looks like it’s very intuitive to get the information out of it. The big thing will be you can’t get the information out if you haven’t put it in. If you haven’t put in a specific location yet, we’re going to have to wait and update that after the Ameresco system rolls out. So that will be an important thing to keep your ears open for is when can we update the data and put in the actual building? This tie that we’re talking about, this Bills-to-Building tie is what’s happening as a result of the utility bill clean up and is showing up now in Ameresco. This is our dream situation that we’ve been waiting for for years. It’ll be very exciting for those of us in engineering to be able to pull up a single building just like you saw Ted and Corri talking about. You don’t have to have this advanced meter on the building. Just a regular meter you’ll be able to see how much energy you’re using hopefully at least daily. That’s going to be very exciting.
Also something we’re going to work on is tying this system, the Ameresco system, directly into the portfolio manager which is the EPA system we’re
080713-412064-Usda-SustainableOperations21 (Completed 08/10/13)
21 of 25
using online to show the information about our covered buildings and our high-performance sustainable buildings. We have to report annual energy use for those buildings. Right now we’re having to punch that in by hand for every building. Hopefully when we get this tied in in the future we won’t have to do that anymore. It’ll put it in there for us. That’s another real exciting piece for us. Next slide Laura. I think that’s all of my slides. So I’m opening it for questions also.
Emily: We do have one question in the notes. Who will have the ability to change the level four data?
Sarah: That’s a wonderful question. Right now the ability lies with the TUMS coordinators as they update the data to roll it into Ameresco. I’m hoping to get people who have worked on their utility bill clean up to go find their TUMS coordinator on their forest and say, “Here’s what I have for information that we can change.” You can do it right now by simply updating the spreadsheet that’s been sent out to everybody so it’s the perfect time. Once the 23rd passes and we’ve given these spreadsheets in to NSC, we won’t be able to update that again until January we think. At that time we will have to get access from Ameresco for the people that will be updating the data. It’ll more than likely be the TUMS coordinators again. You’ll have to work with the TUMS coordinators or your budget person who is updating data now in TUMS to update it in Ameresco.
Emily: We have one more question in the notes from the same person. “Who were the spreadsheets sent to?”
Sarah: The spreadsheets should’ve been sent to every regional and forest TUMS coordinator. If you are one of those people and have not seen your spreadsheet, please call your regional office and find out where it is. We don’t want this to show up on your desk the day before it’s due which is kind of what happened the first time around. If you have any questions specifically, you haven’t seen the spreadsheet, you can contact me. I’m Sarah Baker. Here’s my address. I will send you what I have. I’ll be glad to send that to you or to get you in touch with the right person to get it to you. Please feel free to do that.
Emily: One more time, if you would like to ask a question you can dial *1 on your phone or send a note to “presenters.”
Laura: Emily, this is Laura. I have a question that came directly to me. I’ll go ahead and read it for Sarah. The question is, “Does it go live in the first
080713-412064-Usda-SustainableOperations21 (Completed 08/10/13)
22 of 25

quarter of the fiscal year ’14 or calendar year ’14. One slide showed calendar. The other showed fiscal.
Sarah: That’s a wonderful question. They’re telling us that it’s going to be going live across the country 1/3 of the country at a time. That it will start happening at the beginning … Sort of the beginning of the fiscal year and it won’t be finished until close to the beginning of the calendar year. So my answer is I don’t really know. I’m not too sure that anybody really knows how it’s going to work. Ideally by the beginning of the calendar year, everyone will be on Ameresco and they’ll be paying every bill. I don’t want to say that I’m sure that will happen because we’ve seen what happens when systems change. It’s always tougher than we think it’ll be. That’s the goal right now is that by the beginning of the calendar year we will be live everywhere.
Emily: We do have one question on the phone.
Female: Where can we get a copy of the Power Point presentation?
Sarah: Are you talking about the one we saw today?
Female: Yes, the one for today. The whole presentation.
Sarah: Laura, you want to answer that?
Laura: Sure thing. A copy of this presentation will be posted on the Sustainable Operations Collective SharePoint site. After we get a list of the presenters from today’s webinar, you’ll be able to follow up with a direct link to that site. If you want immediate access you can go ahead and e-mail me at [email protected] and I can send you a direct link.
Female: All right. Thank you.
Emily: Laura, I am not seeing any further questions.
Laura: Neither am I Emily. Let’s move on to our final slide. Just as a head’s up we always like to inform folks that upcoming sus ops learning opportunities. Our 22nd Peer Learning Webinar will be on Wednesday, September 4th. Again at 10 a.m. Pacific, 1 p.m. Eastern. The topic will be fleet and transportation part two. This is a follow up from an earlier presentation that happened a few months ago on fleet and transportation.
080713-412064-Usda-SustainableOperations21 (Completed 08/10/13)
23 of 25

The topics will include updates from the Equal Oriented Fleet and Driver’s Team, an overview of the Electronic Fleet Reservation Tool and Office of the Future Tool Kit and CIO paperless office training. So three very interesting topics; two of them specifically linked to fleet, one very relevant to any office, but in time particularly relevant to the shift from Rosland to Yates as they move into an office of the future and paperless office environment. You can access the peer learning schedule for the rest of FY ’13 at this link listed here. This is the same site that I just mentioned where the slides and leader recording will be housed. With that Emily if we could ask for any final questions to any of the speakers we have about 10 minutes remaining in our webinar period.
Emily: Just a reminder, *1 or note to “all presenters.”
Sarah: I see one hand raised but I’m not quite sure how to access that Emily.
Emily: That is actually the person who asked a question earlier.
Sarah: Oh excellent. Okay. Thank you.
Laura: Any questions Emily?
Emily: We just had another hand go up. Go ahead Holly.
Holly: Thank you. This is for Sarah Baker. I was just curious. The Ameresco system is it also going to be entered into the EMC data base as well? Will we be able to pull bills off of that?
Sarah: From what I understand the bills will go directly to Ameresco so that we’ll be replacing that system. Now that’s what I’ve been told. Since I’m not a budget coordinator I really don’t know for sure but that’s what I understand is that we’ll actually access the bills directly from Ameresco. If that’s not right I apologize but it’s the best info I have.
Holly: That’s okay. We’ll find out as it goes along here. I know that the data base is quite helpful for pulling quite a few of the utility bills.
Sarah: Yes. Yes, and if I have the information correct, if I’m really right about this, it’ll even be easier to access than it has been through ECM. So we’ll be able to log on through the Ameresco site and just click the bills and open them right there. I think it will be good.
Holly: The training that is going to be set up, will notification go out to the sustainable ops people as well?
080713-412064-Usda-SustainableOperations21 (Completed 08/10/13)
24 of 25

Sarah: We will do our best to make sure that anything we hear at all in the way of training we share with everyone so yes, I hope so.
Holly: Thank you.
Sarah: I remain hopeful.
Holly: That’s all we have. Thanks.
Sarah: Yeah, sure.
Emily: Laura, I am not seeing any further questions at this time.
Laura: Neither am I in the notes panel. Thank you to our five wonderful speakers today. I realize that we’ve all digested quite a bit of information over the past hour-and-a-half. Thank you to us because for making it so easy to understand. Again I will be following up with an e-mail to all participants with a link to where the slides will be housed and then later the recordings of the webinar. That information is also posted albeit with some lag time on our public sustainable operations. So with that, thank you for participating. Thank you Emily for facilitating and have a great day.
080713-412064-Usda-SustainableOperations21 (Completed 08/10/13)
25 of 25