Embed Size (px)
Citation preview

SPE SPE-115222-PPSPE
X-O-T TECHNOLOGY FOR THE TREATMENT OF CRUDE OIL EMULSIONS
David G. Nahmad, SPE, Isabela Kmiec / Eco-Logic Environmental Engineering Inc.; Awalludin Nasir / Scomi Group SDN. BHD; Isrom Udau / Petronas Carigali MCOT SDN. BHD
Copyright 2008, Society of Petroleum Engineers
This paper was prepared for presentation at the 2008 SPE Asia Pacific Oil & Gas Conference and Exhibition held in Perth, Australia, 20–22 October 2008.
This paper was selected for presentation by an SPE program committee following review of information contained in an abstract submitted by the author(s). Contents of the paper have not been reviewed by the Society of Petroleum Engineers and are subject to correction by the author(s). The material does not necessarily reflect any position of the Society of Petroleum Engineers, its officers, or members. Electronic reproduction, distribution, or storage of any part of this paper without the written consent of the Society of Petroleum Engineers is prohibited. Permission to reproduce in print is restricted to an abstract of not more than 300 words; illustrations may not be copied. The abstract must contain conspicuous acknowledgment of SPE copyright.
Abstract
SCOMI Energy in cooperation with PETRONAS Carigali Miri Crude Oil Terminal (MCOT) implemented
a pilot project to demonstrate the effectiveness, technical and economical, of the emulsion treatment technology
known as X-O-T for emulsion resolution and crude oil recovery.
A typical emulsion was drawn in batches from Emulsion Storage Tank into Scomi's system. This
emulsion was processed on a continuous flow basis through a custom designed system in order to break
"resolve" the emulsion and separate its constituents for further disposal or storage of the oil as "dry oil".
X-O-T is a proprietary process utilized to break emulsions of hydrocarbons/water/solids. The process is
based on a series of chemical reactions that interact with other reagents releasing heat and neutralizing the non-
covalent forces that form the bonds between the substrate and the wetting agents making it feasible to separate
the components of an emulsified mixture of minerals, water and hydrocarbons.
A mechanical process for separating the emulsion constituents is needed.
The results of the processing of this emulsion were very promising. All solids contained in the initial
emulsion were removed from the mixture; some of small particles in the colloidal size range were transferred
directly to the recovered water.
The emulsion was resolved up to 92% to 98% leaving a small tough invert emulsion that contained no
solids and a high concentration of heavy hydrocarbons. Recovered solids were "dry" and had hydrocarbon
content around 15%. Recovered water was treated using ionic polymer. The result rendered clean water.
This technology can prove to be very economical not only for oil recovery, but also as preventative
maintenance. The removal of all solids from this stream can strongly impact the tank farm operations budget by
reducing downtime, increasing storage capacity and removing expenses such as tank cleaning and sludge
processing.

2 SPE SPE-115222-PP[Paper Number]
Introduction
MCOT of Petronas Carigali is located by the ocean shore north of Miri City in the State of Sarawak (see
Fig. 1). The terminal receives the daily production from off shore wells located on the great Sarawak basin (Fig.
2) which contains several tectono-stratigraphic
provinces principally the Balingian, Luconia
and the Baram Delta provinces. These are late
Oligocene to mid Miocene deltaic strata
formations. From early Miocene to present,
these marine environments became more
established with predominant deposition of
mixed clastic facies and carbonates.
During offshore oil extraction in East
Malaysia’s South China Sea, a continuous
flow of crude oil, water, and fine solids is
extracted from the wells. Production in this
area can reach 200,000 bbl/D with up to 50-
60% free water content and 2-5% emulsion
content. This mixture is sent to MCOT for further dehydrating, storing and export1.
The formation of water in oil emulsions in the production oil has been well documented 2 3 4, as well as the
problems associated with its handling, storage, transport and refining.
This interfacial emulsion forms upon cooling
of the oil water mixture in combination by using a
significant amount of agitation and pressure
differentials from the formation to the oil Terminal. The
chemicals contained in crude oil and water also
intervine in the formation of emulsions. These
chemicals in the oil can vary from long chain straight
hydrocarbons (paraffinic) to complex hetero-atomic
polycyclic and bi-polar molecules mostly carboxylic
acids and naphthenic acids. Sandstone formations
where the crude oil is extracted from provide an
excellent base for emulsions. Fine silicon/oxygen
(silicates) compounds form anionic crystallites which
have a high affinity for water (through hydrogen
bonding), oil tends to surround these structures forming an emulsion.
When the crude oil is being extracted, the pressure decreases, this leads to degassing of carbon dioxide
from the formation water and, hence an increase in the pH. Dissolved metals and bicarbonate in the water
intervene in the complexation of the carboxylic and naphthenic acids which become surface/interfacially active
stabilizing colloidal structures.
Figure 1
Figure 2
SPE SPE-115222-PP[Paper Number] 3
Typical values for this waxy emulsion are in the range of: ~40-70 wt% branched and straight
hydrocarbons in the range of C8-C28; approximately ~8-18 wt% consists of C28-C30 carboxylate salts, <5 wt% is
inorganic minerals and the balance is water5.
Background
Current emulsion resolution practices include chemical treatment using acid based emulsion breakers
and heat to promote viscosity reduction and separation. Electrostatic separation and mechanical methods like
centrifugation have also been used with a certain degree of success. Though, a fraction of the emulsion remains
unresolved generating problems associated with it, most likely sludge formation. The extensive use of furnaces in
combination with heat exchangers is one of the most used techniques to break emulsions; furnaces pose a risk in
a highly flammable environment and also generate large amounts of green house gases. The use of this
technology can also bring extra benefits to the operator in the form of carbon credits for process substitution and
the associated safety increase by removing open flames in such areas as the tank farms.
In Miri, (Fig. 3) the daily field production is sent to MCOT using underwater pipelines. The heavily water
loaded fluid is sent to the Free Water Knock Out (FWKO) vessels (V-124, V-125 and V-126)1, residence time here
is approximately 24 min. After an initial separation, the fluid is then transferred to the Wet Crude Storage Tanks
where it is enabled to settle under quiescent conditions permitting more of the free water to sink once again.
Using decanting techniques the dry oil is sent to the Dry Crude Storage Tanks for further shipping.
The water collected through separation is sent to the Water Buffer Tank TK-68 and then it is processed
throughout the effluent treatment plant and discharged back to the South China Sea.
The emulsion, which can reach up to 10,000 bbl/D is then sent to the emulsion storage tank T-41. The
emulsion stored in T-41 is continuously pumped through the Emulsion and Wax Treatment Plant (EWTP) using 2
centrifugal pumps (P-100/P-101). Upstream of these pumps an inline dosing system adds an emulsion breaker.
Heat is then applied to raise the temperature to ~70oC using furnaces and heat exchangers. After this process the
fluid mixture is sent back to the wet tanks for decanting separation. The EWTP also uses electrostatic
precipitators to help in the emulsion resolution; these are out of use because of the high water content1. MCOT
does not have specific provisions for solids removal; unless they can leave with the separated water. These solids
accumulate in the system and a continuous maintenance plan for tank cleaning and sludge processing (using bio-
remediation) has being implemented.
There is a fraction of this emulsion which is difficult to processing and stays unresolved and the solids
never leave the system until they form tank bottom sludge and tank cleaning takes place. Up to 1,000 bbl/D of
unresolved emulsion can accumulate inside storage tanks at MCOT, with time the heavier fractions of the
emulsion (rich in solids, water and heavy hydrocarbons) can settle down to form sludge in the storage tanks. The
removed “tank bottoms” are sent to the slop farm for further treatment and disposal; these materials can contain
up to 80% hydrocarbons which is not recovered under current practices.

4 SPE SPE-115222-PP[Paper Number]
Emulsion Characterization
A total of 180 bbl were treated during the Pilot Project. Two batches
of 90bbl each were drawn from the T41 tank, processed at different flow
rates to derive enough data for the optimization of the process. These two
samples contained little or no free water and the emulsion breaker dosing
pumps were stopped a few minutes before taking the samples to avoid
chemical contamination. The emulsion looked as a brown greenish paste
which settles right between the free water layer and the dry oil (Fig. 3).
Utilizing method API-13B-2 in the laboratory, the composition of the emulsion from the 1st batch was typified as follows: - Crude oil 54% 48.60 bbl - Water 42% 37.80 bbl - Solids 4% 3.60 bbl
The composition of the emulsion from the 2nd batch was typified as follows: - Crude Oil 60% 54.00 bbl - Water 37% 33.30 bbl - Solids 3% 2.70 bbl
A particle size analysis (utilizing Hydro2000 SM(A)) was performed on this emulsion. Figure 4 shows the
Particle Size Distribution for the raw emulsion before treatment.
The graph in Figure 4 shows a considerable amount of solids in the range 10 to 100 micron, there is also
a fraction of larger particles >100 micron and some in the smaller range <10 micron. Suspension size particles
form the majority of the solids contained in the emulsion.
Laboratory bench tests were conducted to determine chemical dosage, and qualitative emulsion
resolution using the XOT process to recover oil and separate the water and solids. The best results showed
complete emulsion resolution with clean solids and water layers (Fig. 5). These tests also helped determine the
scale up parameters (residence times, operating temperatures, agitation energy, etc) to design the basic Process
and Instrumentation Diagram.
Figure 3
Figure 4
SPE SPE-115222-PP[Paper Number] 5
Technology Description
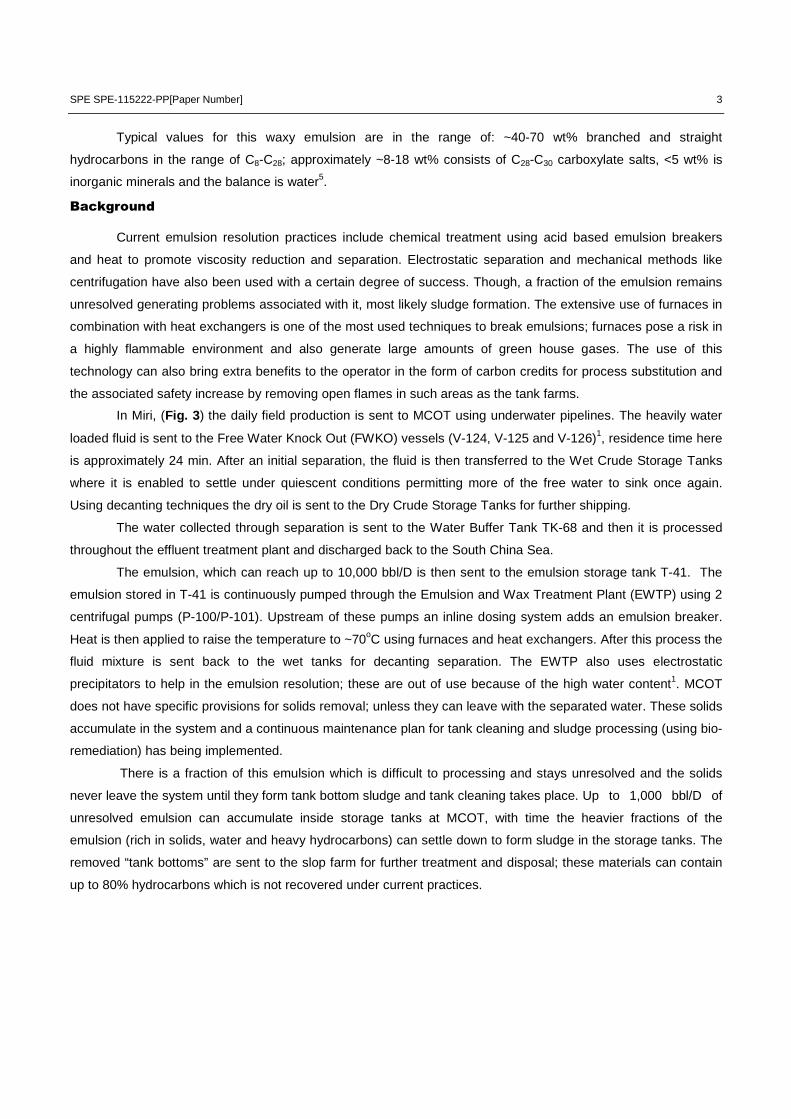
XOT is a proprietary process utilized for emulsion resolution. The process is
based on a series of physical processes and chemical reactions involving amphiphilic
surfactants (aionic and ionic) which interact as structural analogs disrupting the three
layer surface of the emulsion micelles; the presence of other reactants which release
heat and independently neutralize the Van der Waals ionic and induction of non-
covalent forces including the dipole-dipole hydrogen bonds, the instantaneous dipole
induction forces known as London forces and the long range induction forces known as
Hamaker forces. These interactions form the bonds between the substrate and the
wetting agents making the emulsion stable.
The exothermic reaction that evolves during the process does not change the chemical
structure of the aliphatic hydrocarbons and is mainly a reaction among the specific
reactants added. The byproducts of the reactions are inorganic salts, water and carbon
dioxide that form tiny bubbles which promote oil flotation and solids separation.
Solvation of the inorganic salts by the released water is also promoted while viscosity is
reduced by means of the temperature increase resulting from the reaction. The reaction
is not pH dependent and does not change the initial pH of the emulsion throughout the
process. Once the emulsion is unstable, it is now possible to separate its constituents
by specific gravity differential into minerals, water and hydrocarbons.
A mechanical process for separating the emulsion constituents is needed following the reaction; in this
case the use of a centrifuge is essential to achieve a fast and accurate separation.
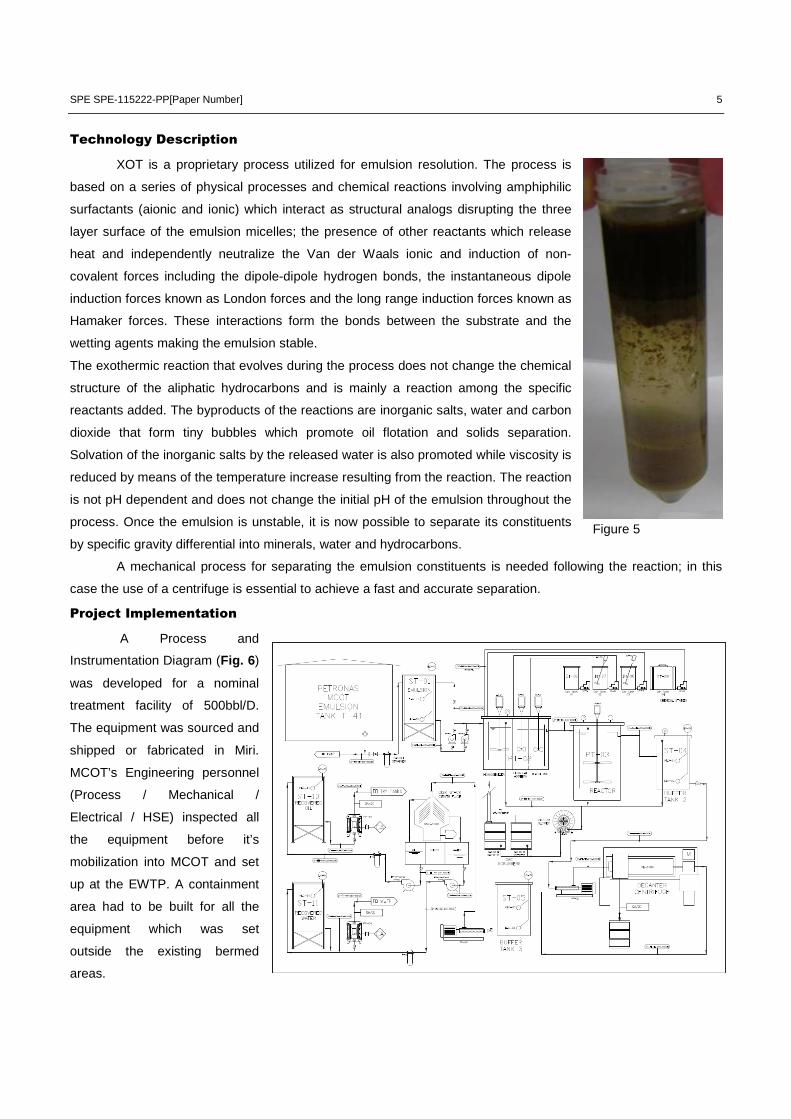
Project Implementation
A Process and
Instrumentation Diagram (Fig. 6)
was developed for a nominal
treatment facility of 500bbl/D.
The equipment was sourced and
shipped or fabricated in Miri.
MCOT’s Engineering personnel
(Process / Mechanical /
Electrical / HSE) inspected all
the equipment before it’s
mobilization into MCOT and set
up at the EWTP. A containment
area had to be built for all the
equipment which was set
outside the existing bermed
areas.
Figure 5

6 SPE SPE-115222-PP[Paper Number]
A complete list of the equipment used is shown on the equipment schedule chart below (Table 1):
MCOT 500bbl/D CONTINUOUS FLOW PROCESS EQUIPMENT SCHEDULE.
Additional Equip Item No. Description
ID ID Description
1 BUFFER TANK 1 ST-01 Pump
FP-01 & FP-02 Centrifugal Pump, open impeller
2 HOMOGENIZER TANK PT-02 Agitator AG-01 Direct drive Agitator
3 CHEMICAL ADDITION TANK PT-02 Agitator AG-02 Direct drive Agitator
4 FLASH MIX TANK PT-02 Agitator AG-03 Direct drive Agitator
5 REACTOR TANK PT-03 Agitator
AG-04 Variable frequency drive
6 BUFFER TANK 2 ST-04 Level Controllers
LC-01, LC-02
7 BUFFER TANK 3 ST-05 Level Controllers
LC-03, LC-04
8 DECANTER DE 1000 CENTRIFUGE DC-1000 Pump MP-01 PROGRESSIVE
CAVITY PUMP
DSC-1000 Pump MP-02 PROGRESSIVE CAVITY PUMP
Pump PP-01, PP-02 Centrifugal Pumps 9 DISK STACK CENTRIFUGE
Bag Filters F-01, F-02 Bag Filter Housings ASME coded size # 2
10 WATER-SOLIDS TANK ST-11 Pumps PP-04 Pneumatic Pump 11 REC. OIL TANK ST-10 Pump PP-03 Pneumatic Pump
12 DAY TANK #01 DT-06 Pump CP-01 Diaphragm metering pump, Max.Flow 24 GPH
DT-07 Pump CP-02 Diaphragm metering pump, Max.Flow 24 GPH 13 DAY TANK #02
Agitator AG-05 Pneumatic Agitator
DT-08 Pump CP-03 Diaphragm metering pump, Max.Flow 24 GPH 14 DAY TANK #03
Agitator AG-06 Pneumatic Agitator 15
DAY TANK #04 DT-09 Pump CP-04 Diaphragm metering pump, Max.Flow 24 GPH
The equipment was set inside the EWTP area close to pumps P-100 and P-101 (Fig. 7). A draw off line
was flange attached to the sampling port line of the suction line from the outlet of T-41.
Table 1

SPE SPE-115222-PP[Paper Number] 7
The emulsion was pumped from upstream of MCOT’s pumps P-100 and P-101 into tank ST-01 where
batches were accounted for volume (two batches of 90bbl each) and quality, process speed (flow rate) was
monitored by timing level sights. Initial temperature for the emulsion was 30-32ºC. The emulsion was pumped into
the homogenizer using a centrifugal pump with a fixed output (20l/min, 32l/min and 44l/min), the same pump was
used for recirculation to keep the sample homogeneous; two chemicals were added in the homogenizer tank
using chemical metering pumps with a variable output. Thorough mixing was kept in this tank where a series of
baffles prevented the flow from short circuiting the tank. The flow moved into the Chemical Addition Tank in PT-02
where a catalyst is added and mixed. Finally inside the Flash mix tank the last chemical was added to start the
exothermic reaction. Both tanks were also continuously agitated. The exothermic reaction took place inside the
reactor PT-03, micro gas bubbles were released and the temperature increased see Table 2 for residence times
and operating temperature.
Operating Parameters: FLOW RATE REACTION RESIDENCE TIME REACTION TEMPERATURE
20 l/min 118 min 50 ºC
32 l/min 74 min 52 ºC
44 l/min 53 min 54 ºC
Table 2 All process tanks were covered and kept under negative pressure (~1.5 in H2O) the recovered gases
were directed into the scrubbing system and sent into the atmosphere through a discharge exhaust tower 8m
Figure 7
8 SPE SPE-115222-PP[Paper Number]
high. These gases were continuously monitored using 3M™ Multi-Gas Detector 740 Series. The gases
monitored were:
• Carbon Monoxide CO. Alarm set 35ppm
• Hydrogen Sulfide H2S Alarm set 10ppm
• Combustible Gases LEL Alarm set 10%
• Oxygen O2 Alarm set 19.5% Low & 23.0% High
During all the trial tests none of the alarm conditions were reached.
The reacted mixture was then gravity fed into the Buffer Tank 2, ST-04 where the last of the gas bubbles
surfaced and the mixture was now ready for phase separation. A couple of level sensors controlled the
Progressive Cavity Pump which feed directly into the decanter centrifuge where separation of the large solids
(>10micron) took place. These solids were collected at the bottom of the centrifuge and tested for hydrocarbon
content.
The centrade of the centrifuge was then directed into Buffer Tank 3, ST-05 where level sensors controlled
the activity of the Progressive Cavity Pump which fed the Disk Stack Centrifuge where a three phase separation
took place.
The lighter phase (crude oil) was forced into the upper outlet and into the reservoir tank under the
centrifuge. The water and colloidal solids were discharged into the second reservoir tank under the centrifuge.
The solids were intermittently discharged into the collection tank under the centrifuge; these solids were
processed again through the decanter centrifuge for drying.
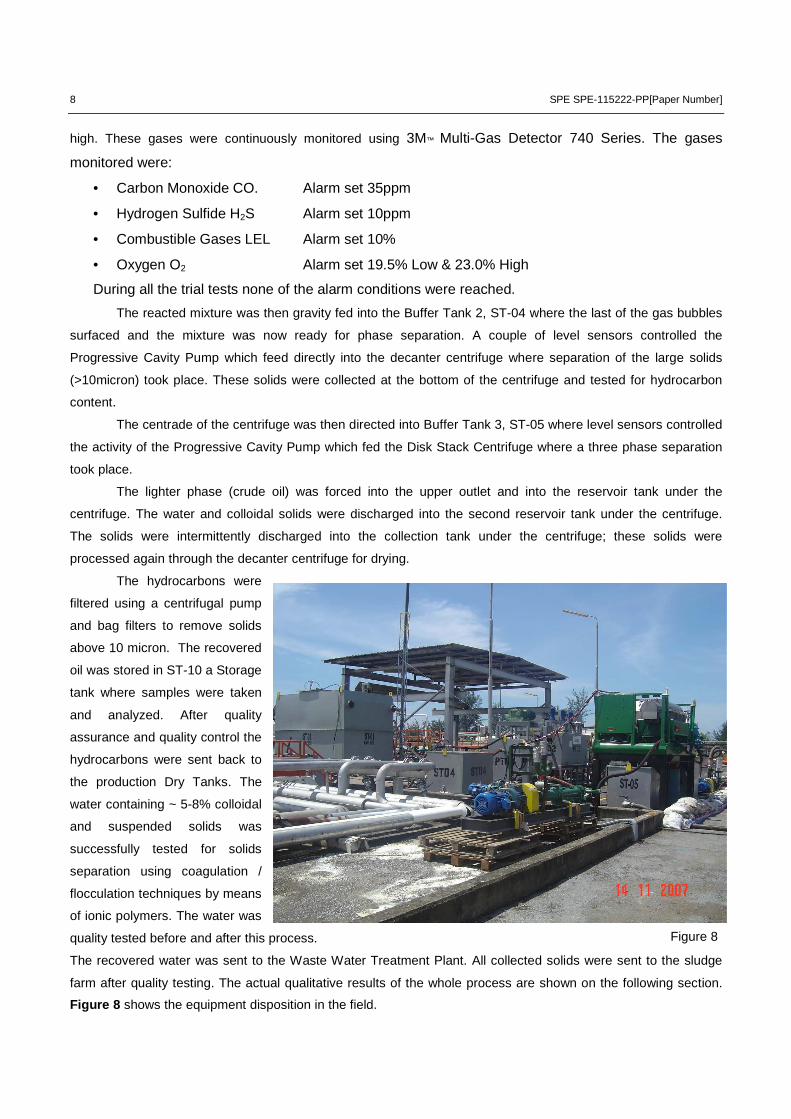
The hydrocarbons were
filtered using a centrifugal pump
and bag filters to remove solids
above 10 micron. The recovered
oil was stored in ST-10 a Storage
tank where samples were taken
and analyzed. After quality
assurance and quality control the
hydrocarbons were sent back to
the production Dry Tanks. The
water containing ~ 5-8% colloidal
and suspended solids was
successfully tested for solids
separation using coagulation /
flocculation techniques by means
of ionic polymers. The water was
quality tested before and after this process.
The recovered water was sent to the Waste Water Treatment Plant. All collected solids were sent to the sludge
farm after quality testing. The actual qualitative results of the whole process are shown on the following section.
Figure 8 shows the equipment disposition in the field.
Figure 8

SPE SPE-115222-PP[Paper Number] 9
Results
The first 45 bbl were treated at a flow rate of 20 l/min. Then the second part of the first batch, a total of 45
bbl was treated at 32l/min. The process was followed by taking samples at the points of separation of the phases.
The first point was the decanter centrifuge; here a sample of the solids was taken and analyzed in the laboratory
for composition and particle size.
The retort showed a composition of: - Oil 15% - Water 40% - Solids 45%
This is an important result; it shows that an
actual volume reduction on the solids production can be
achieved by removing the bulk oil and water from the
solids particularly the long chain hydrocarbons. Figure 9
shows the sample fractions after the retort.
The particle size analysis for the recovered solids from the decanter centrifuge is shown on Figure 10.
As expected, the decanter centrifuge is capable of removing the solids larger than 10 micron.
From the decanter centrifuge the fluid was pumped into the disk stack centrifuge, three streams were collected
here: Oil, water and solids. Several adjustments were needed to control the cutting point of the interface oil/water
to achieve a good separation. The sample had to be “polished” to remove the water to minimum levels (~0.3%).
Figure 9
Figure 10

10 SPE SPE-115222-PP[Paper Number]
Solids were completely removed to 0% (see Fig. 11).
Without polishing, a light yellowish interface composed mostly by heavy hydrocarbons (paraffinic) and
water was clearly observed. Figure 12 shows a typical result of the BS&W test of the recovered oil from the disk
stack centrifuge
without polishing. This interface will vary from 2% to 4%. To separate this yellowish interface, samples were
cooled to 4.4oC where the interface solidified (see Fig. 13), with the oil still liquid it was easy to decant it.
This fraction was also analyzed using the retort and a Varian Gas Chromatograph to determine the
hydrocarbon distribution.
Figure 11
Figure 12 Figure 13
SPE SPE-115222-PP[Paper Number] 11
The results of the retort showed:
- Oil 86%
- Water 14%
- Solids 0%
Figure 14 shows the retort distillates (paraffin hangs from the walls
of the graduated tube).
It is important to remark that complete emulsion resolution was
achieved only by polishing the recovered oil.
The yellowish fraction still contains water in the form of an invert
emulsion with ~14% water, remarkably, there are no solids in this
emulsion which can have a great impact on the overall production.
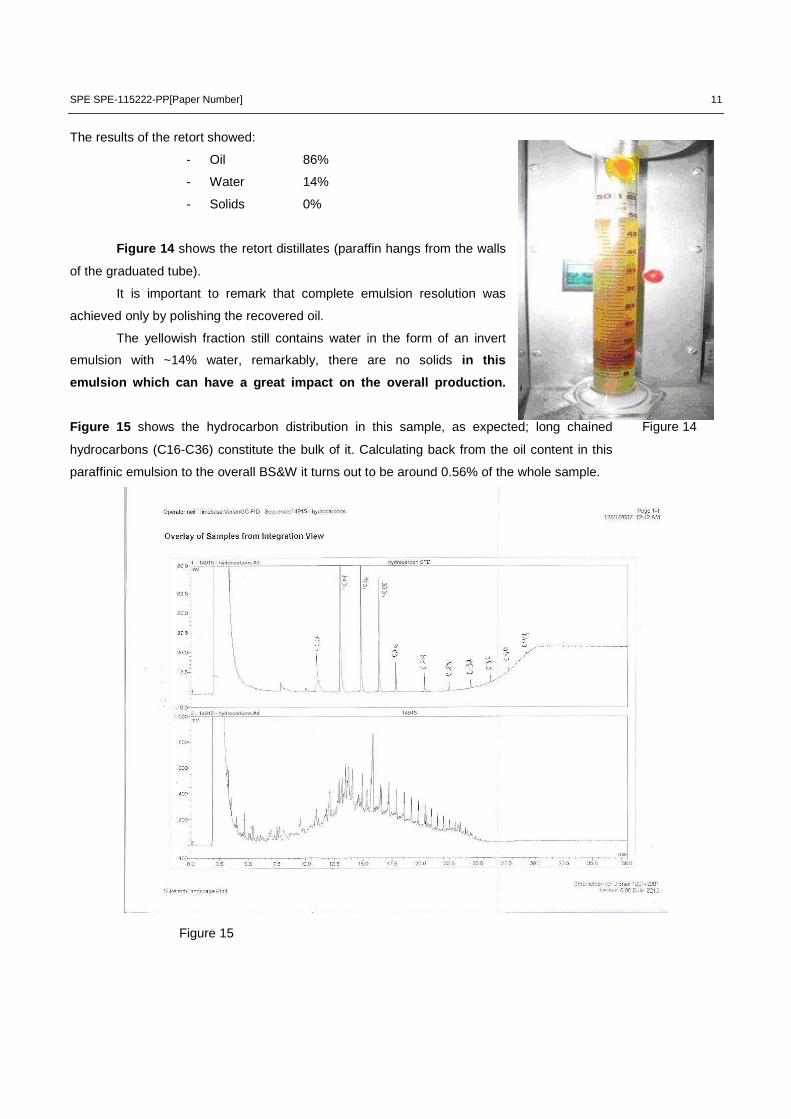
Figure 15 shows the hydrocarbon distribution in this sample, as expected; long chained
hydrocarbons (C16-C36) constitute the bulk of it. Calculating back from the oil content in this
paraffinic emulsion to the overall BS&W it turns out to be around 0.56% of the whole sample.
Figure 15
Figure 14

12 SPE SPE-115222-PP[Paper Number]
The recovered solids from the disk stack centrifuge were analyzed for particle size distribution (see Fig. 16).
The results on Figure 16 show that the disk stack centrifuge is capable of removing the small solids (>1
micron) leaving the water and the oil almost solids free.
The recovered water showed a dark black color and high turbidity, this water was filtered using a 10
micron bag and still retained the same color. Samples were taken and analyzed for particle size, Figure 17 shows
the distribution. A lab centrifuge was used to see if it was possible to clean it; the results were negative. Both tests
consistently show that the suspended solids were colloidal or near colloidal in nature.
Figure 16
Figure 17

SPE SPE-115222-PP[Paper Number] 13
A coagulation/flocculation technique using ionic polymers was implemented with excellent results. Figure
18 shows a sample of the recovered water from ST-11 and the same sample after coagulation, flocculation and
sedimentation using a centrifuge at 700 g’s.
Analytical results from the treated sample performed by MCOT’s laboratory
personnel showed:
- COD 196 mg/l - TSS 0.0093 mg/l - pH 8.1 - Oil / Grease 20.9 mg/l All these parameters are less than the limits for water discharge.
The results of the processing of this emulsion can be summarized as:
- Oil 102.58 bbl with a BS&W of 0.0 to 0.4 - Water 71.00 bbl - Solids 6.47 bbl
Conclusions
The main objectives contemplated at the beginning of the pilot test were achieved. Though complete
emulsion resolution was not achieved at 100% in the first pass, the results from the production point of view are
excellent. The minimum content of water in oil emulsion left would not in any way impact the quality needed for
exporting the crude.
The solids were completely removed from the emulsion and the volume and mass reduced drastically;
furthermore, the concentrations of oil and water in these solids show them as an excellent candidate for rapid
photodecomposition and biodegradation.
Water was removed above 98% of the emulsion and the recovered water can be easily treated for safe
disposal. These results can be summarized as:
1. All solids contained in the initial emulsion were removed from the mixture (this includes
particulate as small as 1 micron) some of these small particles in the colloidal or suspended size
range were transferred directly to the recovered water.
2. The emulsion was resolved up to 92%-98% leaving a small tough invert emulsion which
contained no solids and a high concentration of heavy hydrocarbons (C14-C36) well in the range of
the paraffinic hydrocarbons. This small percentage of unresolved emulsion was later resolved in
the laboratory, these results show a good potential for economic scale up and field
implementation.
3. The recovered solids were minimized and had hydrocarbon content around 15%.
4. The recovered water was treated using an ionic polymer to promote flocculation followed by
coagulation. The result rendered a clean water with the following parameters:
- COD 196 mg/l - TSS 0.0093 mg/l - pH 8.1 - Oil/Grease 20.9mg/l
These results also show that scaling up of the process is just a matter of proper equipment sizing and,
that the equipment footprint would not impact actual facilities space.
Figure 18

14 SPE SPE-115222-PP[Paper Number]
At a time when crude oil prices have reached historical highs this technique can prove to be very
economical not only for oil recovery, but also as preventative maintenance. The main benefits of utilizing this
process can be listed as:
1. Bottom line production increase.
2. Complete solids removal from the system.
3. Increased storage capacity.
4. Reduction of the water stored in tanks.
5. Minimization of tank cleaning and sludge processing.
6. The substitution of heat sources (furnaces and boilers) that burn fossil fuels by this technology
can also bring to the operator the upside addition of carbon credits improving the overall
environmental impact of the industry.
Acknowledgments
We thank Petronas Carigali management for permission to perform the Pilot Project at Miri Crude Oil Terminal
and for giving us there support in the filed. Specifically Norazeman B. Abu Bakar and Shamsawi Ahmad.
We also want to thank Wan Norkhairiyah Wan Montil and Benjamin Leong Wye Hoong of Scomi Group for
facilitating all aspects on the implementation of this project.
1 Lee, J.,Frankiewicz, T., Ismail, M. Z., Anwar, M.L., Abdul Samad, M. S., 2006: “In-Field Emulsion Treatability Test with the Electrostatic Susceptability Tester”. SPE102221. 2 Becker, J.R., 1997: “Crude Oil Waxes, Emulsions and Asphaltenes”. PennWell Publishing. ISBN 0-87814-737-3. 3 Gallup, D.L., Star, J., 2004: “Soap Sludges: Aggravating Factors and Mitigation Measures”. SPE 87471. 4 Havre, T. E., 2002: “Formation of Calcium Naphtenate in Water/Oil Systems, Naphtenic Acid Chemistry and Emulsion Stability”. Doctoral Thesis. Department of Chemical Engineering. Norwegian University of Science and Technology. 5 Gallup, D.L., Smith, P. C., Chpponeri, J., Abuyazid, A., and Mulyono, D., 2002: “Formation and Mitigation of Metallic Soap Sludge, Serang, Indonesia Field”. SPE 73960.