Embed Size (px)
Citation preview

SPE DISTINGUISHED LECTURER SERIESis funded principally
through a grant of thethrough a grant of the
SPE FOUNDATIONThe Society gratefully acknowledges
those companies that support the programby allowing their professionals
to participate as Lecturers.
And special thanks to The American Institute of Mining, Metallurgical,
1
p g gand Petroleum Engineers (AIME) for their contribution to the program.

SPE DISTINGUISHED LECTURER SERIESBridging over Uncertainty: dg g o e U ce ta ty
Past Performance into Forecasting
Dr. Sameh MacaryChevron-Australia
2
(previously, with IPR Group of Comp.)

“Th i k d t t“There are risks and costs to a program of actions. But they are far l th th l i k dless than the long-range risks and costs of comfortable inaction”.
J h F K dJohn F. Kennedy
“You want a valve that doesn’t leak and you try everything possible to develop one. But the real world provides you with a leaky valve. You’ve to determine how much leaking you can tolerate’
3
you can tolerate .
NASA Scientist-Colombia Project
O tliOutline• Risk vs uncertainty• Probabilistic approach• Different toolsDifferent tools• What’s past?• What’s forecasting?
4

Simple Definition: Uncertainty vs Risk?Simple Definition: Uncertainty vs Risk?
Uncertainty: range of Risk: potential gains or possibleevents
losses associated withparticular events
5

Probabilistic ApproachProbabilistic ApproachComplexity of The SystemComplexity of The System
Probabilistic ApproachProbabilistic ApproachComplexity of The System(incomplete Understanding)Complexity of The System(incomplete Understanding)
“Achievement is largely the“Achievement is largely the product of steadily raising one's levels of aspiration and expectation” Jack Nicklaus American Golfer
6
expectation . Jack Nicklaus, American Golfer
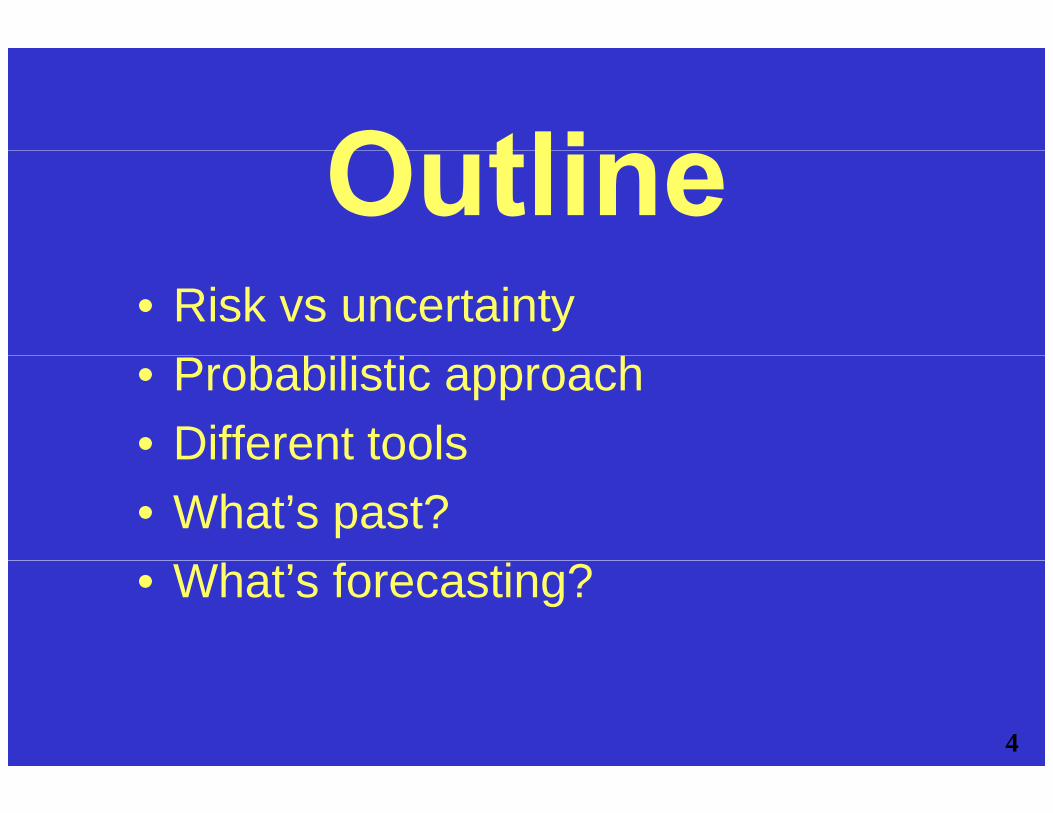
Please Bring Probabilistic ApproachTo The “P” Part of E&P Industry!To The P Part of E&P Industry!
• Engineers: data is constraining!!!
M i & ff l !
• Geoscientists: data-departure point!!!
• More time, money & effort to get closer!– Conservative estimates;– Frequent surprises;– False precision
“The more an E&P Co. integrates its workflow and the more probabilistic its approach in decision making, the better the Co will perform”
7
better the Co. will perform”
Schroeder Bank, Prudential Financial Research
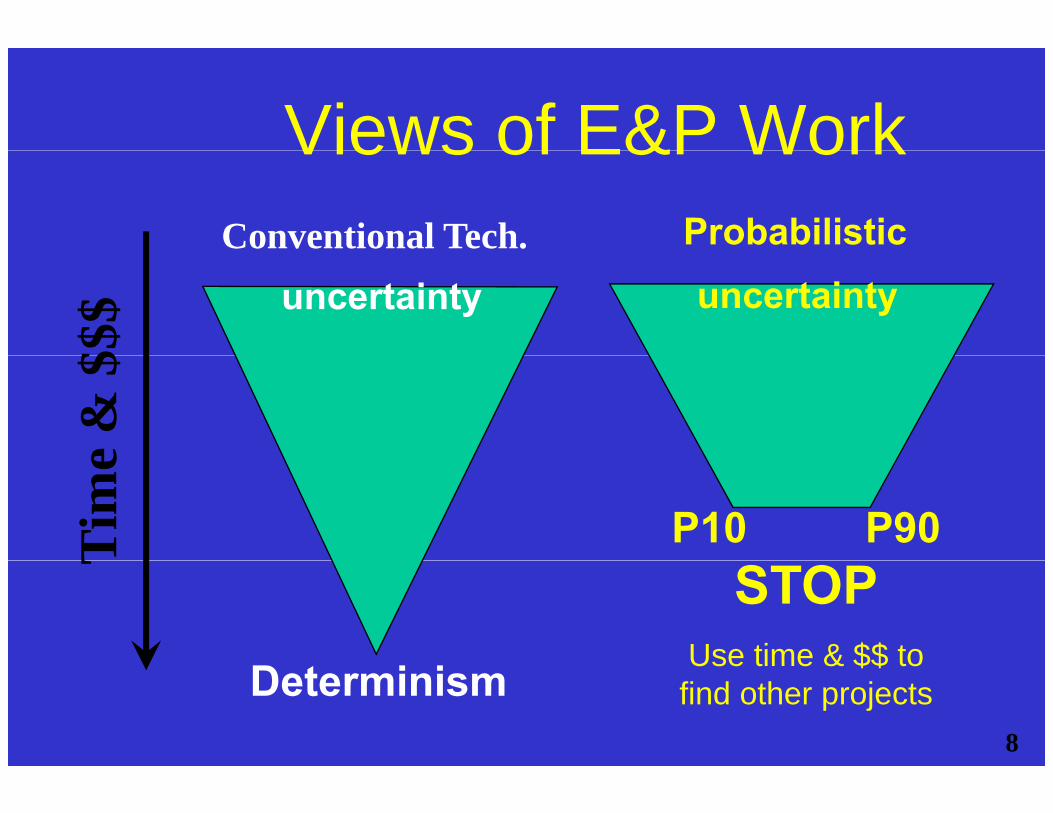
Views of E&P WorkViews of E&P WorkConventional Tech. Probabilistic
$$$ uncertainty uncertainty
e &
$Ti
me
P10 P90 T
STOPUse time & $$ to
8
DeterminismUse time & $$ to find other projects

Monte Carlo Simulation
Variable 1Variable 2
Variable 3
Variable 4
Variable 3
Variable 6Variable 5
9

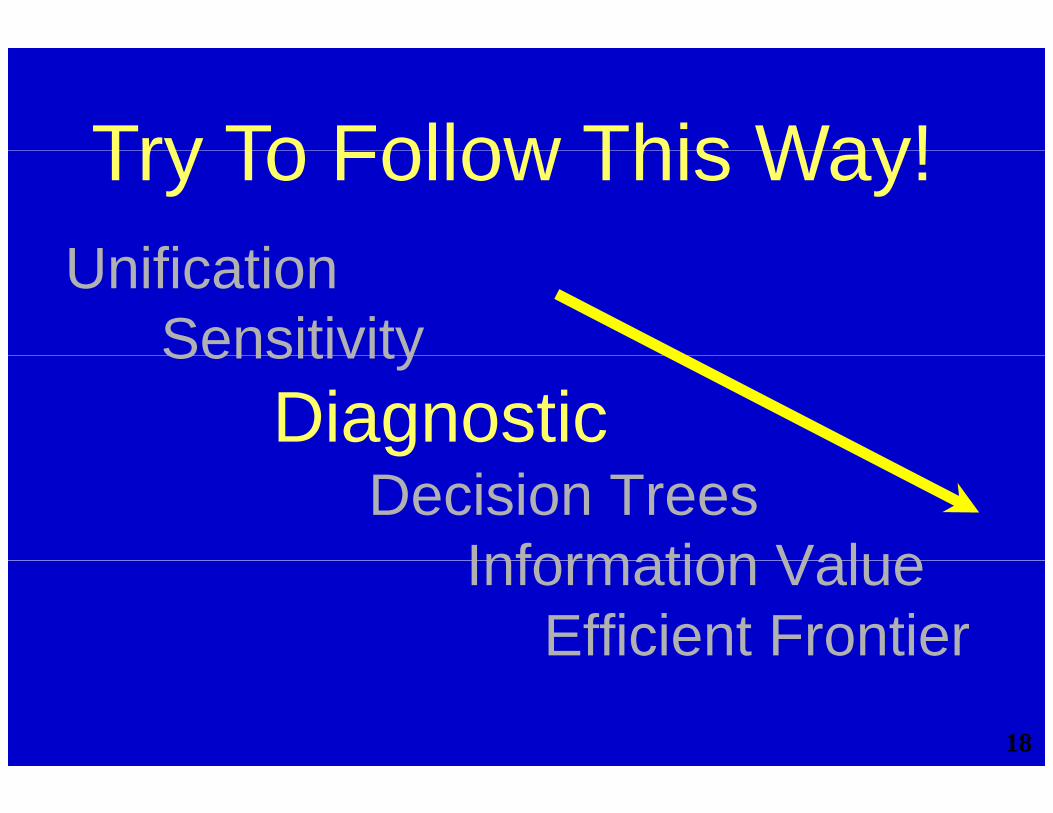
Try To Follow This Way!Try To Follow This Way!Unification
SensitivitySensitivityDiagnostic
Decision TreesInformation ValueInformation Value
Efficient Frontier
10

Cumulative and Reverse Cumulative ChartsUnification
1 00CumulativeReverse Cumulative
.75
1.00
.50
or P
90
or P
90
M 23 02
. P10
P10
.25
Mean = 23.02Mean = 23.02.00
10.00 16.88 23.75 30.63 37.50
11
Certainty is 80% from 17 to 30

Unification (Cont.) SPE # 68588, 2001
D illi C t $K 425 I iti l R t 100 BOPDDrilling Cost $K 425; Initial Rate 100 BOPD;Effective Decline Rate 50 %/yr, Exp. Decline;Price $ 17 5/bbl escalated 3 %/yr; OpExp $K 2/mo
12
Price $ 17.5/bbl, escalated 3 %/yr; OpExp $K 2/mo,escalated 3%/yr; Severance + Ad Valorem Tax total = 10%

Try To Follow This Way!U ifi ti
Try To Follow This Way!Unification
SensitivitySensitivityDiagnostic
Decision TreesInformation ValueInformation Value
Efficient Frontier13

K – ф Plot: Possible Example of Dependency Misleading
Sensitivity/Dependencies
ф p p y gm
Dea
bilit
y, m
Perm
e
14
Porosity, fraction

Sensitivity/Dependencies (Cont.)
Real Experiment Could Put an End to a Story!0.20
hm-m
0.10stiv
ity, o
hte
r Res
is
Sand B
S d A0.00
0 50 100M d W t I i (%)
Wat Sand A
Mud Water Invasion (%)
Resistivity of spun-out water from fresh core samples t k i S d A & B Th ff t f d t i i i
15
taken in Sand A & B. The effect of mud water invasion is evident from Tritium content in the water samples.

6510
0.0 0.5
Porosity
6510 0.0
Water SaturationWater Saturation
3810
0.01.0
Porosity
3810
0.00.5
Sensitivity/Dependencies (Cont.)Porosity Water Saturation
66006600
38503850
Sand A (unconsolidated) Sand B (tight)
16
Good match between core Sw and the new log derived Sw incorporating Rw obtained from spun-out water.
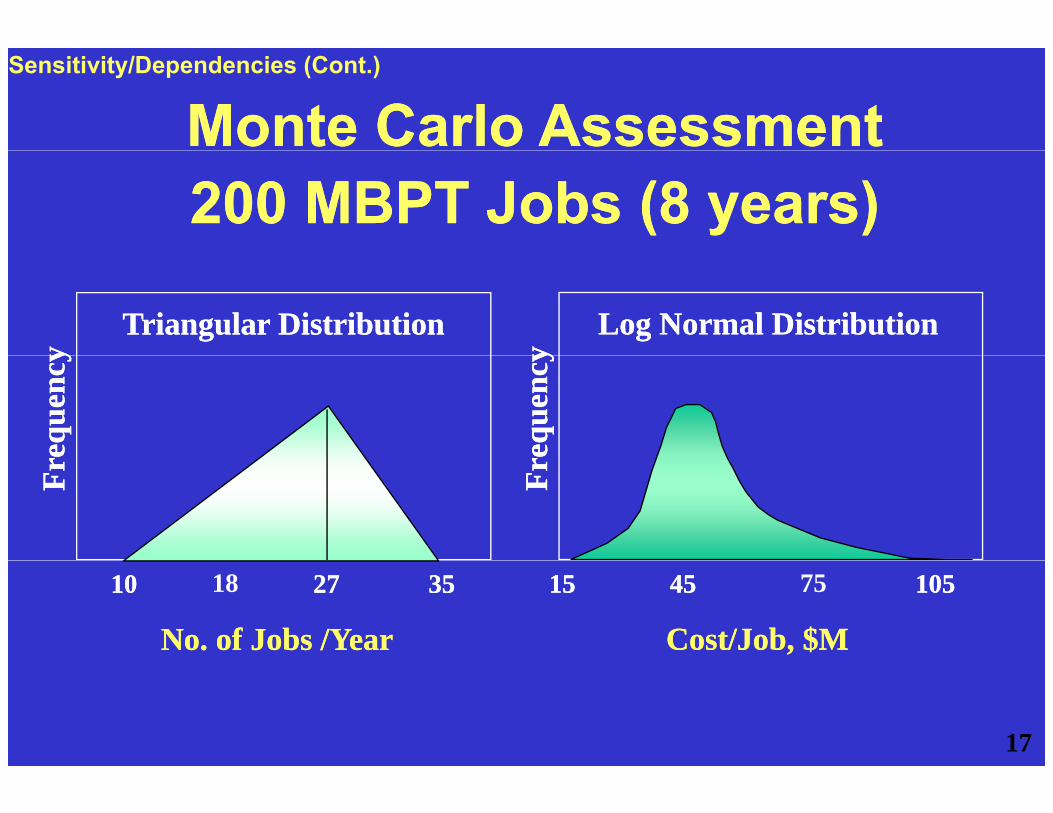
Monte Carlo AssessmentMonte Carlo AssessmentSensitivity/Dependencies (Cont.)
200 MBPT Jobs (8 years)200 MBPT Jobs (8 years)
Log Normal DistributionLog Normal Distribution
yy
Triangular DistributionTriangular Distribution
yy
requ
ency
requ
ency
requ
ency
requ
ency
FrFrFrFr
Cost/Job, $MCost/Job, $M
1515 4545 10510575
No. of Jobs /YearNo. of Jobs /Year
1010 2727 353518
17
Try To Follow This Way!U ifi ti
Try To Follow This Way!Unification
SensitivitySensitivityDiagnostic
Decision TreesInformation ValueInformation Value
Efficient Frontier18

reFailure Patterns!!! What Actions To Improve???
Diagnostic Plots
Source 2 1 0 1 0 4 50%
Migration 3 5 3 0 2 13 38%or F
ailu
re
13
Reservoir 2 7 8 6 5 28 29%
easo
n fo
Closure 1 0 3 6 1 11 55%
Seal 1 1 2 0 17 21 81%ctua
l Re
Seal 1 1 2 0 17 21 81%
Source Migration Reservoir Closure Seal Total Prob.
Ac
Pre-Drill Critical Risk
“If we all worked on the assumption that what is accepted as
19
p ptrue is really true, there would be little hope of advance”.
Orville Wright, 1871-1948, American Co-Inventor of the first practical airplane

Diagnostic Plots (Cont.)
25
75 90 45
100
60
65 40
60
475460 520 455
20

Rank Your Wells by Their RatesDiagnostic Plots (Cont.)
Ln Rank
Field gets mature21
Field gets mature1st Production Phase 2nd Phase 3rd Phase

Try To Follow This Way!U ifi ti
Try To Follow This Way!Unification
SensitivitySe s t tyDiagnostic
D i i TDecision TreesInformation ValueInformation Value
Efficient Frontier22
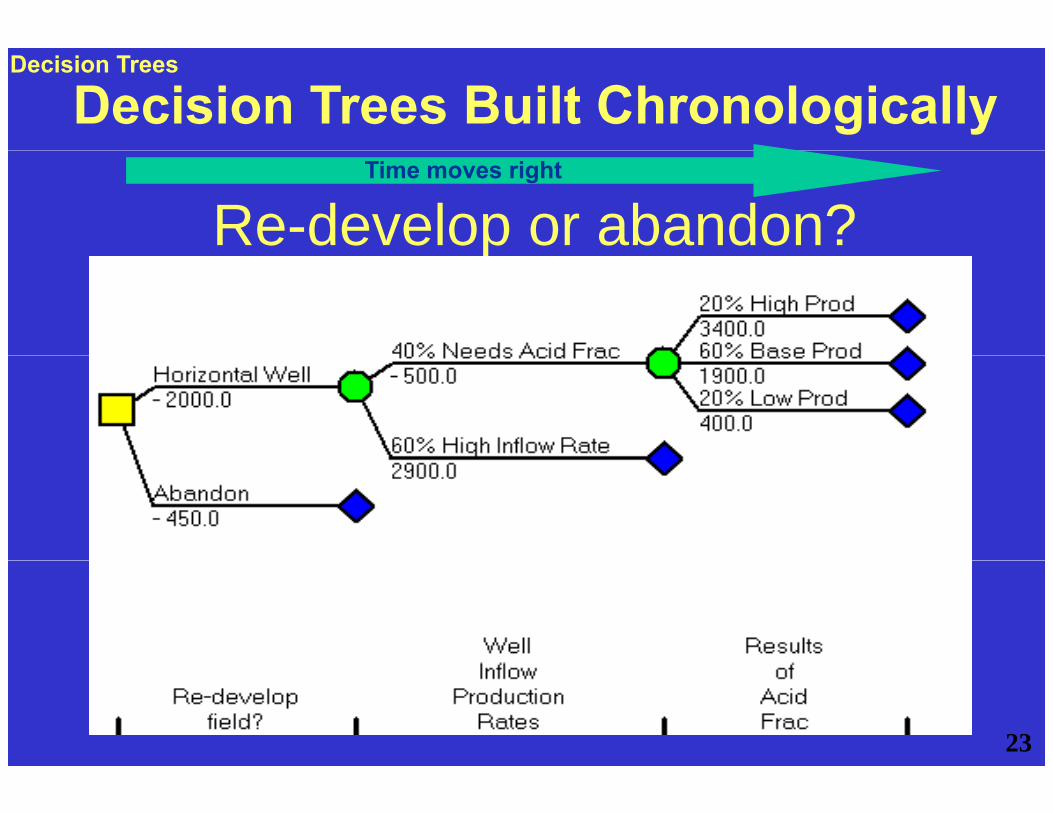
Decision Trees Built ChronologicallyDecision Trees
Re-develop or abandon?Time moves right
p
23

Re-develop DT CalculationsDecision Trees (Cont.)
p
24

Acid Stimulation-Decision TreeAcid Stimulation-Decision TreeDecision Trees (Cont.)
SuccessSuccessYesYes
CostCostContractorContractor
0.600.60
0.400.400 670 67
YesYes
YesYesNoNo0.40.4
< $ 21 M< $ 21 M
> $ 21 M> $ 21 M0.3100.310
1st1st0.670.67
0.330.330.770.77
YesYes
NoNo
NN
0.60.6
0 50 5
> $ 21 M> $ 21 M
< $ 18 M< $ 18 M
0.0740.0740.3100.310
0.230.230.750.75
0 250 25
YesYes
NoNo
NoNo
0.50.5
0.50.5> $ 18 M> $ 18 M0.1740.1740.4510.451
2nd2ndDecision
0.250.250.330.33
0.670.67
YesYes
NoNo
YesYes
0.60.6< $ 20 M< $ 20 M
3rd3rd
25
0.750.75
0.250.25
YesYes
NoNo0.40.4> $ 20 M> $ 20 M0.0470.047
0.2390.2393rd3rd

Try To Follow This Way!U ifi ti
Try To Follow This Way!Unification
SensitivitySensitivityDiagnostic
D i i TDecision TreesInformation ValueInformation Value
Efficient Frontier26

Efficient FrontierEfficient Frontier
The Efficient Frontier contains those portfolios for which there is: > No higher value for the same risk; and/or > No lower risk for the same value.
d
Increase Value
Rew
ard
Reduce Risk
R
27Risk
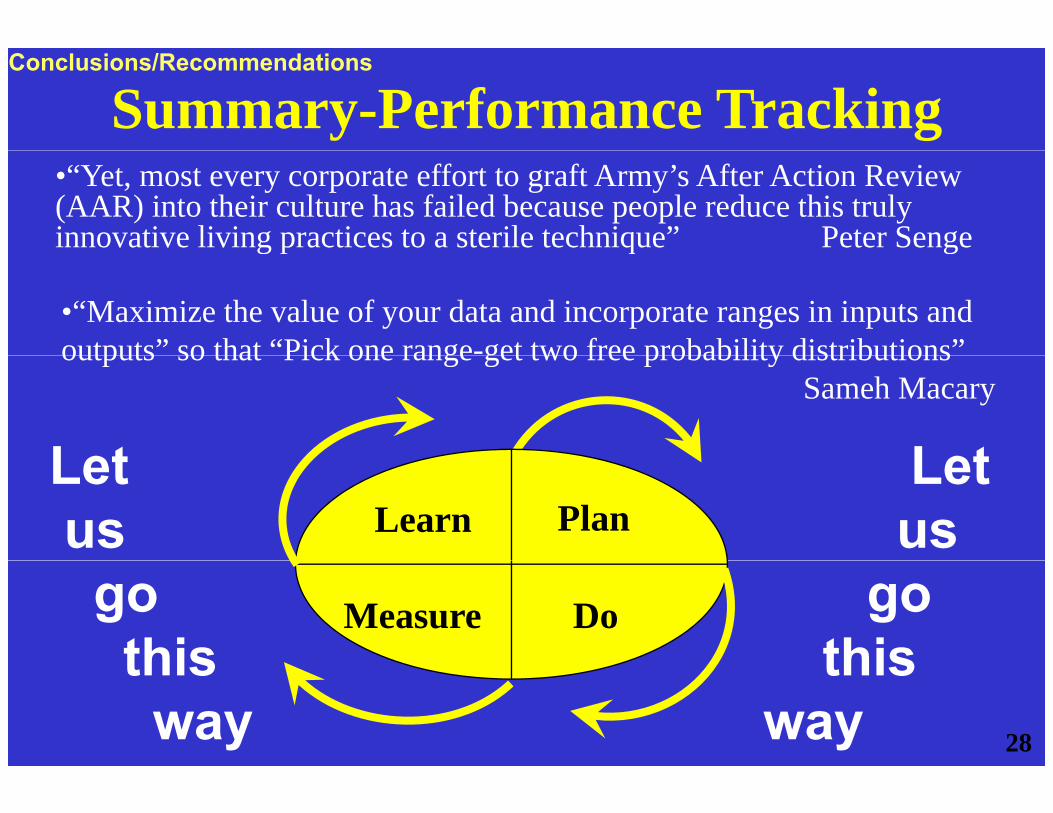
Summary-Performance TrackingConclusions/Recommendations
•“Yet, most every corporate effort to graft Army’s After Action Review (AAR) into their culture has failed because people reduce this truly innovative living practices to a sterile technique” Peter Sengeg p q g
•“Maximize the value of your data and incorporate ranges in inputs and outputs” so that “Pick one range-get two free probability distributions”outputs so that Pick one range get two free probability distributions
Sameh Macary
Let LetLearn Plan
Let us
Let us
DoMeasurego this
go this
28
this way
this way