Embed Size (px)
Citation preview

SPC XL 2010 for Microsoft Excel
Use the links below to explore the examples
Control Chart Examples
Analysis Diagrams Examples
Box PlotPareto ChartDot PlotSummary Statistics
Measurement System Analysis
MSA Graphical Analysis
Analysis Tools
Distribution Calculators
Miscellaneous
Cusum Chart (cumulative sum)
For more information visit us at www.SigmaZone.com
Individuals Moving Range Chart (IMR)XbarR ChartXbarS Chartp Chart (proportions)np Chartc Chart (count)u Chart
Histogram For more information visit us at www.SigmaZone.com
MSA Template (data entry)MSA ANOVA Analysis
Correlation Coefficientst TestPaired t-TestF Test1 Way ANOVA
Discrete DistributionsContinuous DistributionsInverse Distributions
Unstack Column Example
Main Effects Plot
1/1/200
1
1/2/200
1
1/3/200
1
1/4/200
1
1/5/200
1
1/6/200
1
1/7/200
1
1/8/200
1
1/9/200
1
1/10/2
001
1/11/2
001
1/12/2
001
1/13/2
001
1/14/2
001
1/15/2
001
1/16/2
001
1/17/20
01
1/18/2
001
1/19/2
001
1/20/2
001
1/21/2
001
1/22/2
001
1/23/2
001
1/24/2
001
1/25/2
001
1/26/2
001
1/27/2
001
1/28/2
001
1/29/2
001
1/30/2
001
1/31/2
001
2/1/200
1
2/2/200
1
2/3/200
1
2/4/200
1
2/5/200
1
2/6/200
1
2/7/200
1
2/8/200
1
2/9/200
1
2/10/20
01
2/11/2
001
2/12/2
001
2/13/2
001
2/14/20
01
2/15/2
001
2/16/2
001
2/17/2
001
2/18/2
001
2/19/2
001
2/20/2
001
2/21/2
001
2/22/2
001
2/23/2
001
2/24/2
001
2/25/2
001
2/26/2
001
2/27/2
001
2/28/2
001
3/1/200
1
3/2/200
1
3/3/200
1
3/4/200
1
3/5/200
1
3/6/200
1
3/7/200
1
3/8/200
1
3/9/200
1
3/10/2
001
3/11/2
001
0
5
10
15
20
25
1/1/2001
1/1/2001
1/1/2001
2/20/2001
2/20/2001
2/20/2001
Individuals ChartSheet1ctrl
1/1/200
1
1/2/200
1
1/3/200
1
1/4/200
1
1/5/200
1
1/6/200
1
1/7/200
1
1/8/200
1
1/9/200
1
1/10/2
001
1/11/2
001
1/12/2
001
1/13/2
001
1/14/2
001
1/15/2
001
1/16/2
001
1/17/20
01
1/18/2
001
1/19/2
001
1/20/2
001
1/21/20
01
1/22/2
001
1/23/2
001
1/24/2
001
1/25/2
001
1/26/2
001
1/27/2
001
1/28/2
001
1/29/2
001
1/30/2
001
1/31/2
001
2/1/200
1
2/2/200
1
2/3/200
1
2/4/200
1
2/5/200
1
2/6/200
1
2/7/200
1
2/8/200
1
2/9/200
1
2/10/2
001
2/11/2
001
2/12/2
001
2/13/2
001
2/14/2
001
2/15/2
001
2/16/2
001
2/17/2
001
2/18/2
001
2/19/2
001
2/20/2
001
2/21/2
001
2/22/2
001
2/23/2
001
2/24/2
001
2/25/2
001
2/26/2
001
2/27/2
001
2/28/2
001
3/1/200
1
3/2/200
1
3/3/200
1
3/4/200
1
3/5/200
1
3/6/200
1
3/7/200
1
3/8/200
1
3/9/200
1
3/10/2
001
3/11/2
001
-2
0
2
4
6
8
10
1/1/2001
1/1/2001
1/1/2001
2/20/2001
2/20/2001
2/20/2001
Moving R Chart
Sheet2
ctrl

1/1/200
1
1/3/200
1
1/5/200
1
1/7/200
1
1/9/200
1
1/11/2
001
1/13/2
001
1/15/2
001
1/17/2
001
1/19/2
001
1/21/2
001
1/23/20
01
1/25/2
001
1/27/2
001
1/29/2
001
1/31/2
001
2/2/200
1
2/4/200
1
2/6/200
1
2/8/200
1
2/10/2
001
2/12/2
001
2/14/2
001
2/16/2
001
2/18/2
001
2/20/2
001
2/22/2
001
2/24/2
001
2/26/2
001
2/28/2
001
3/2/200
1
3/4/200
1
3/6/200
1
3/8/200
1
3/10/2
001
0
2
4
6
8
10
12
14
16
18
20
1/1/2001
1/1/2001
1/1/2001
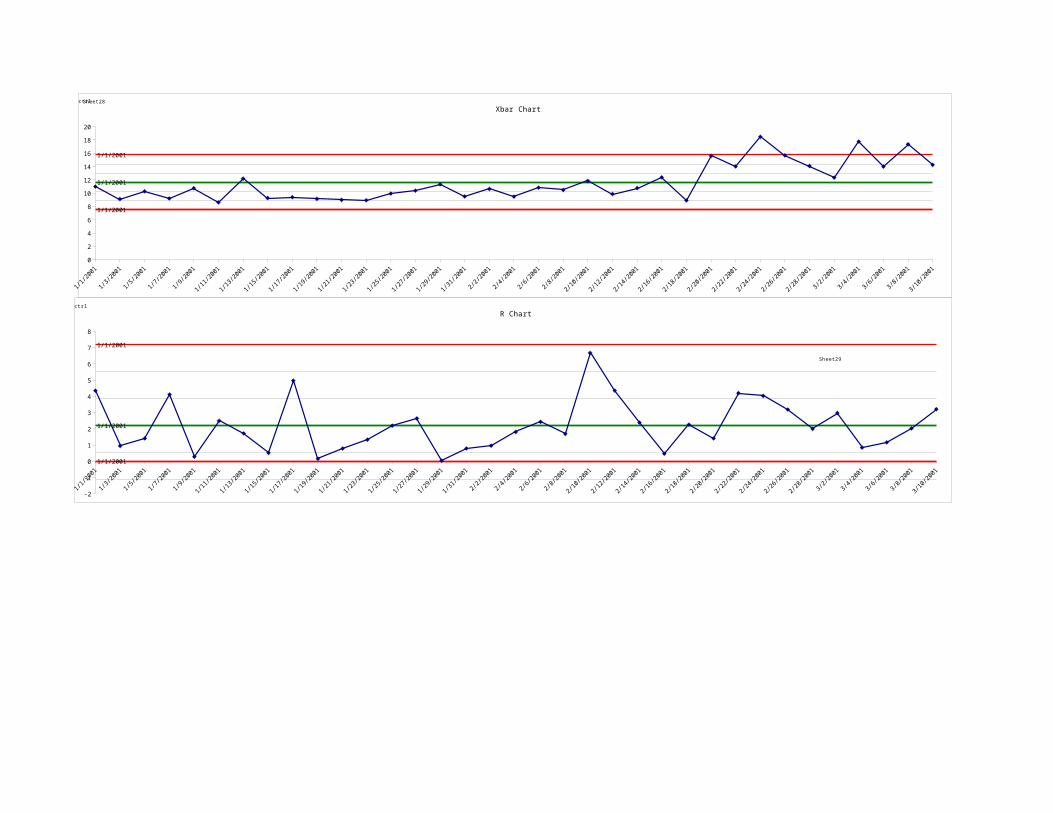
Xbar ChartSheet28ctrl
1/1/200
1
1/3/200
1
1/5/200
1
1/7/200
1
1/9/200
1
1/11/2
001
1/13/2
001
1/15/2
001
1/17/2
001
1/19/2
001
1/21/2
001
1/23/20
01
1/25/2
001
1/27/2
001
1/29/2
001
1/31/2
001
2/2/200
1
2/4/200
1
2/6/200
1
2/8/200
1
2/10/2
001
2/12/2
001
2/14/2
001
2/16/2
001
2/18/2
001
2/20/2
001
2/22/2
001
2/24/2
001
2/26/2
001
2/28/2
001
3/2/200
1
3/4/200
1
3/6/200
1
3/8/200
1
3/10/2
001
-2
-1
0
1
2
3
4
5
6
7
8
1/1/2001
1/1/2001
1/1/2001
R Chart
Sheet29
ctrl
1/1/2001 1/5/2001 1/9/2001 1/13/2001 1/17/2001 1/21/2001 1/25/2001 1/29/2001 2/2/2001 2/6/2001 2/10/2001 2/14/2001 2/18/2001 2/22/2001 2/26/2001 3/2/2001 3/6/2001 3/10/20010
2
4
6
8
10
12
14
16
18
1/1/2001
1/1/2001
1/1/2001
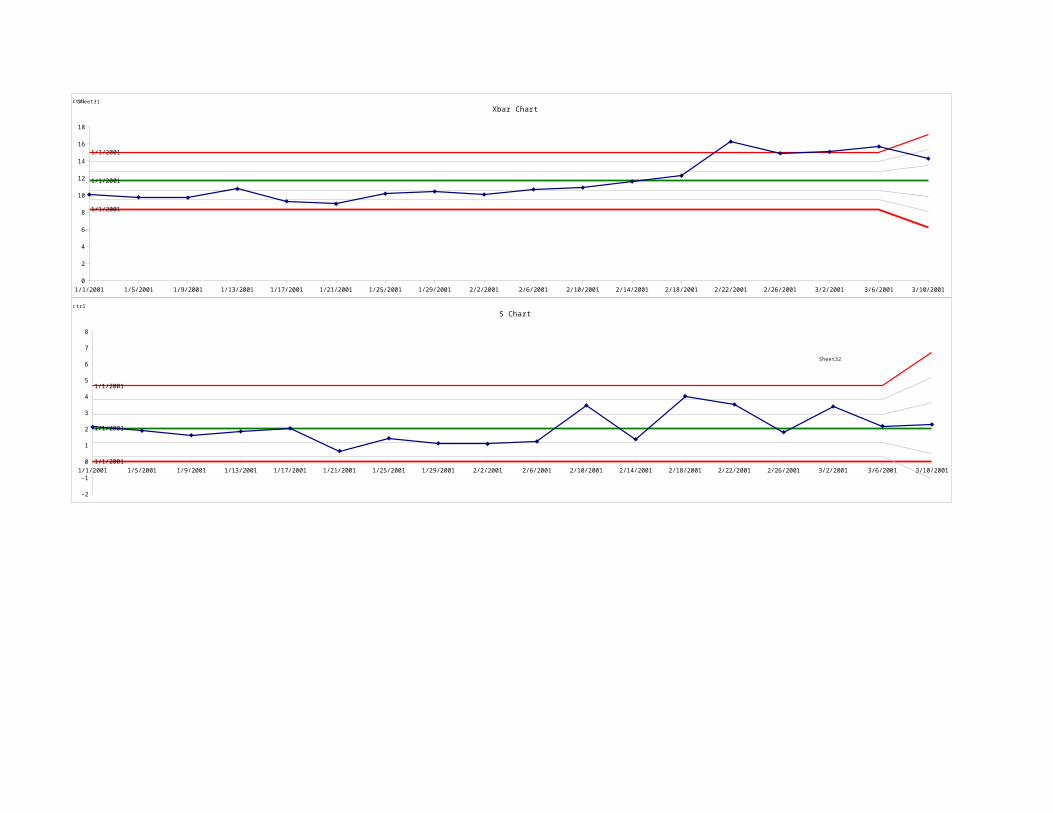
Xbar ChartSheet31ctrl
1/1/2001 1/5/2001 1/9/2001 1/13/2001 1/17/2001 1/21/2001 1/25/2001 1/29/2001 2/2/2001 2/6/2001 2/10/2001 2/14/2001 2/18/2001 2/22/2001 2/26/2001 3/2/2001 3/6/2001 3/10/2001
-2
-1
0
1
2
3
4
5
6
7
8
1/1/2001
1/1/2001
1/1/2001
S Chart
Sheet32
ctrl
1 2 3 4 5 6 7 8 9 10 11 12 13 14 15 16 17 18 19 20 21 22
-0.05
0
0.05
0.1
0.15
0.2
1
1
1
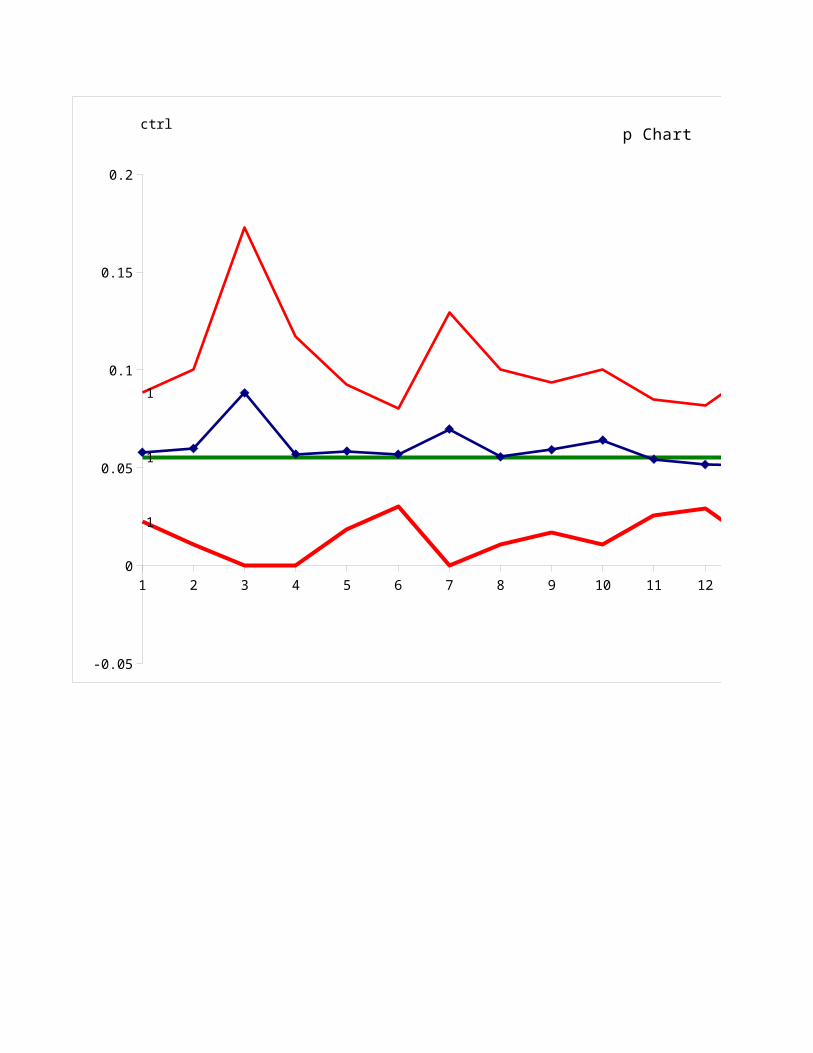
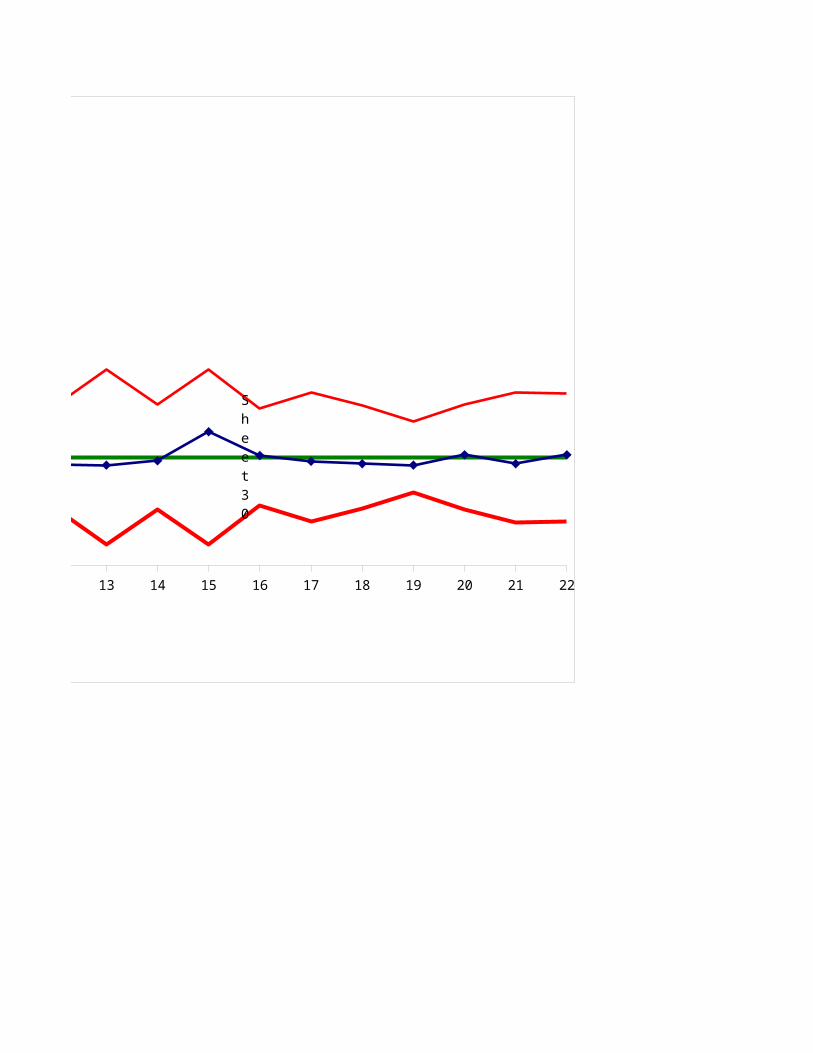
p Chart
Sheet30
ctrl
1 2 3 4 5 6 7 8 9 10 11 12 13 14 15 16 17 18 19 20 21 22
-0.05
0
0.05
0.1
0.15
0.2
1
1
1
p Chart
Sheet30
ctrl
1 2 3 4 5 6 7 8 9 10 11 12 13 14 15 16 17 18 19 20 21 220
10
20
30
40
50
60
70
80
1
1
1
np Chartctrl

1 2 3 4 5 6 7 8 9 10 11 12 13 14 15 16 17 18 19 20 21 220
10
20
30
40
50
60
70
80
1
1
1
np Chartctrl

1 2 3 4 5 6 7 8 9 10 11 12 13 14 15 16 17 18 19 20 21 220
200
400
600
800
1000
1200
1400
1600
1
11
c Chartctrl

1 2 3 4 5 6 7 8 9 10 11 12 13 14 15 16 17 18 19 20 21 220
200
400
600
800
1000
1200
1400
1600
1
11
c Chartctrl

1 2 3 4 5 6 7 8 9 10 11 12 13 14 15 16 17 18 19 20 21 22
-0.05
0
0.05
0.1
0.15
0.2
1
1
1
u Cha rt
Sh ee t3 4
ct rl

1 2 3 4 5 6 7 8 9 10 11 12 13 14 15 16 17 18 19 20 21 22
-0.05
0
0.05
0.1
0.15
0.2
1
1
1
u Cha rt
Sh ee t3 4
ct rl
2.61
5108
6819
5017
3.03
5338
8286
0976
3.45
5568
9752
6936
3.87
5799
1219
2895
4.29
6029
2685
8854
4.71
6259
4152
4813
5.13
6489
5619
0772
5.55
6719
7085
6731
5.97
6949
8552
269
6.39
7180
0018
8649
6.81
7410
1485
4608
7.23
7640
2952
0568
7.65
7870
4418
6527
8.07
8100
5885
2486
8.49
8330
7351
8445
8.91
8560
8818
4404
9.33
8791
0285
0363
9.75
9021
1751
6322
10.1
7925
1321
8228
10.5
9948
1468
4824
11.0
1971
1615
142
11.4
3994
1761
8016
11.8
6017
1908
4612
12.2
8040
2055
1208
12.7
0063
2201
7804
13.1
2086
2348
4413
.541
0924
9509
9513
.961
3226
4175
9114
.381
5527
8841
8714
.801
7829
3507
8315
.222
0130
8173
7915
.642
2432
2839
7516
.062
4733
7505
7116
.482
7035
2171
6716
.902
9336
6837
6317
.323
1638
1503
5917
.743
3939
6169
5518
.163
6241
0835
518
.583
8542
5501
4619
.004
0844
0167
4219
.424
3145
4833
3819
.844
5446
9499
3420
.264
7748
4165
3
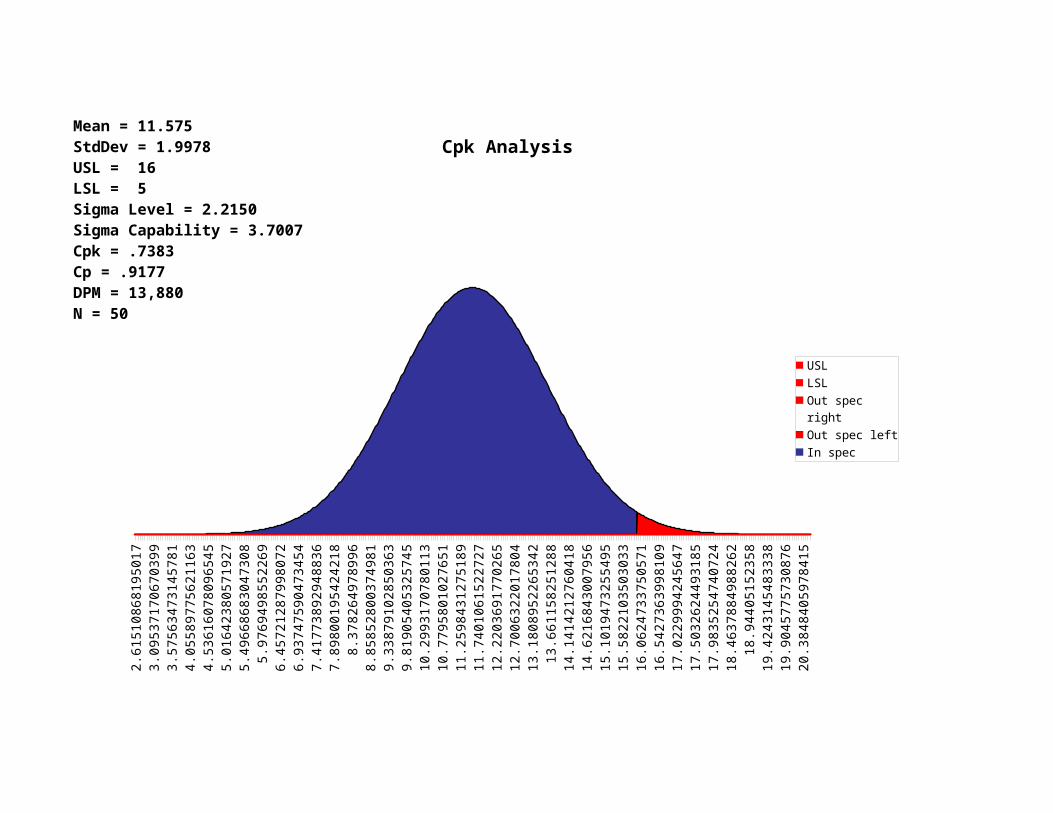
Cpk Analysis
USL
LSL
Out spec right
Out spec left
In spec
Mean = 11.575StdDev = 1.9978USL = 16LSL = 5Sigma Level = 2.2150Sigma Capability = 3.7007Cpk = .7383Cp = .9177DPM = 13,880N = 50
SPC XL Creates Analysis Diagrams full screen. Click on the tabs at the bottom of the worksheet to navigate to the different diagrams. They are just to the right of this sheet.

7.81 to <=
8.87
8.87 to <= 9.93
9.93 to <= 11.0
11.0 to <= 12.06
12.06 to <= 13.12
13.12 to <= 14.19
14.19 to <= 15.25
15.25 to <= 16.31
0
2
4
6
8
10
12
14
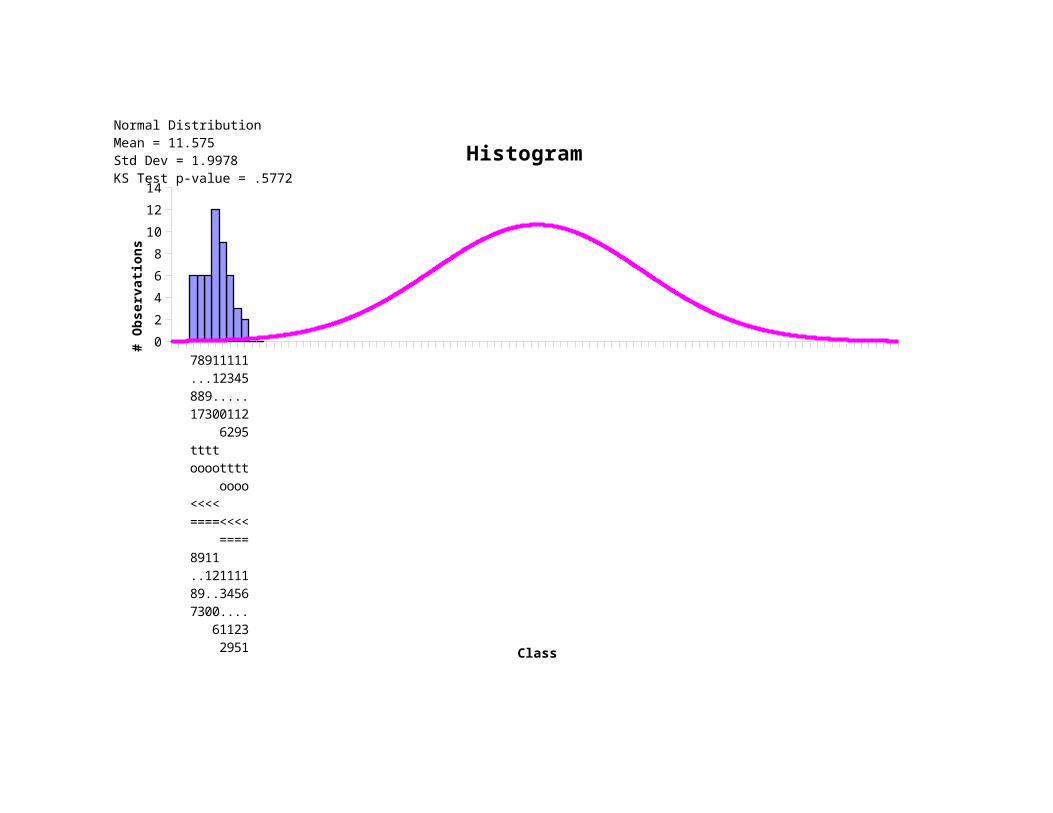
Histogram
Class
# O
bser
vatio
nsNormal Distribution Mean = 11.575Std Dev = 1.9978KS Test p-value = .5772
Operator 1 Operator 2 Operator 30
5
10
15
20
25
30
Box Plot Titles
Q1
Min
Median
Max
Q3

Code E Code C Code A Code F Code B Code D0
20
40
60
80
100
120
140
0
0.1
0.2
0.3
0.4
0.5
0.6
0.7
0.8
0.9
1
Pareto Chart
Group
# O
bser
vatio
ns

0 5 10 15 20 25 30
Dot Plot
Operator 1Operator 2Operator 3

Operator 1 Operator 2 Operator 3Count 10 10 10Mean 9.338139631 11.027195436 9.2880266856Median 8.932412255 10.99156035 6.791276985ModeMax 15.16294569 13.46541875 25.97187072Min 6.849924621 8.343265272 0.285952908Range 8.313021069 5.122153478 25.685917812Std Dev (Pop) 2.192379181 1.6051422378 7.9706220807Std Dev (Sample) 2.310970569 1.69196848 8.4017733811Variance (Pop) 4.806526472 2.5764816036 63.530816353Variance (Sample) 5.340584969 2.8627573373 70.589795948Skewness 1.970543772 -0.065852532 0.8094078244Kurtosis 4.879161549 -1.004591107 -0.072093034
95% Conf. Interval for MeanUpper Limit 10.99130965 12.237557696 15.298297877Lower Limit 7.684969615 9.816833177 3.2777554943
99% Conf. Interval for MeanUpper Limit 11.71310223 12.766015444 17.92244974Lower Limit 6.963177031 9.288375429 0.6536036308

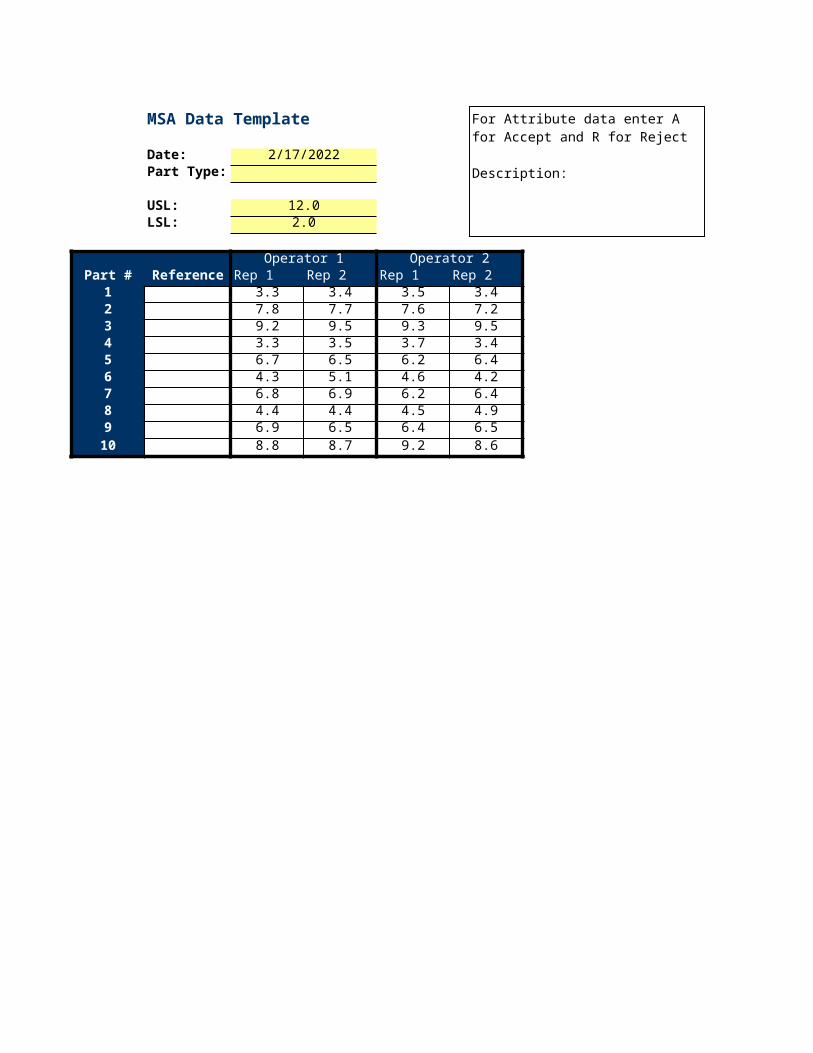
MSA Data Template
Date: 5/9/2023Part Type:
USL: 12.0LSL: 2.0
Operator 1 Operator 2Part # Reference Rep 1 Rep 2 Rep 1 Rep 2
1 3.3 3.4 3.5 3.42 7.8 7.7 7.6 7.23 9.2 9.5 9.3 9.54 3.3 3.5 3.7 3.45 6.7 6.5 6.2 6.46 4.3 5.1 4.6 4.27 6.8 6.9 6.2 6.48 4.4 4.4 4.5 4.99 6.9 6.5 6.4 6.510 8.8 8.7 9.2 8.6
For Attribute data enter A for Accept and R for Reject
Description:
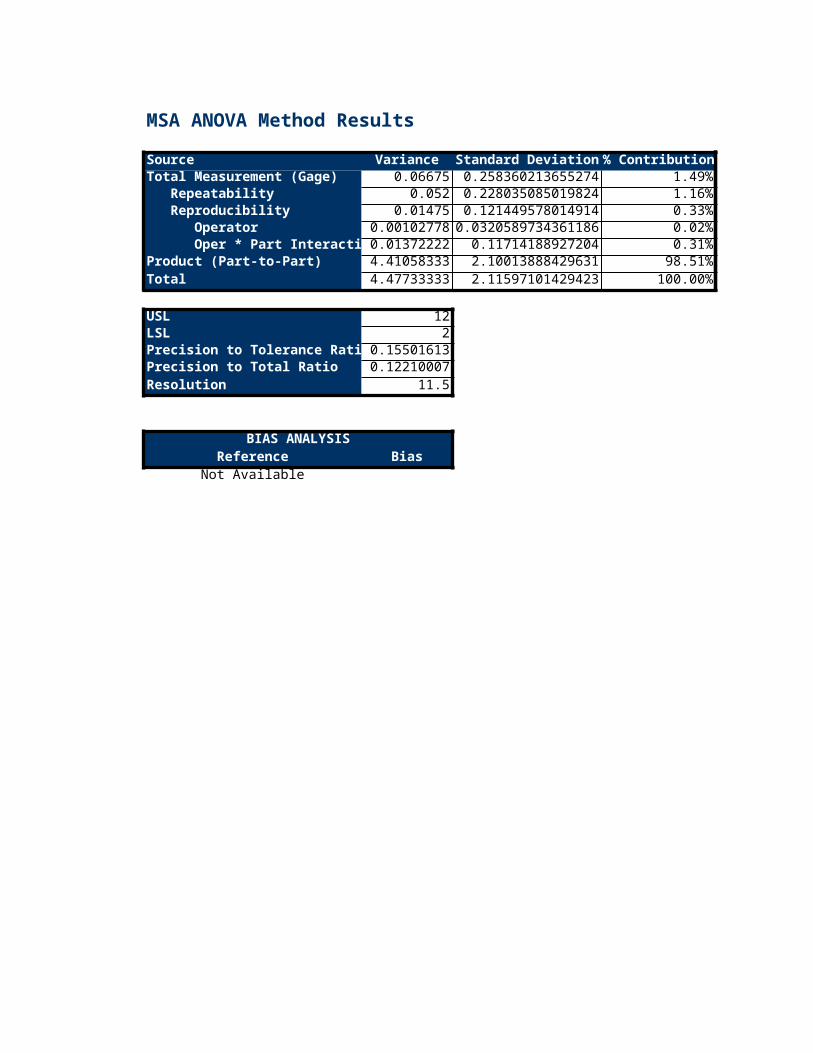
MSA ANOVA Method Results
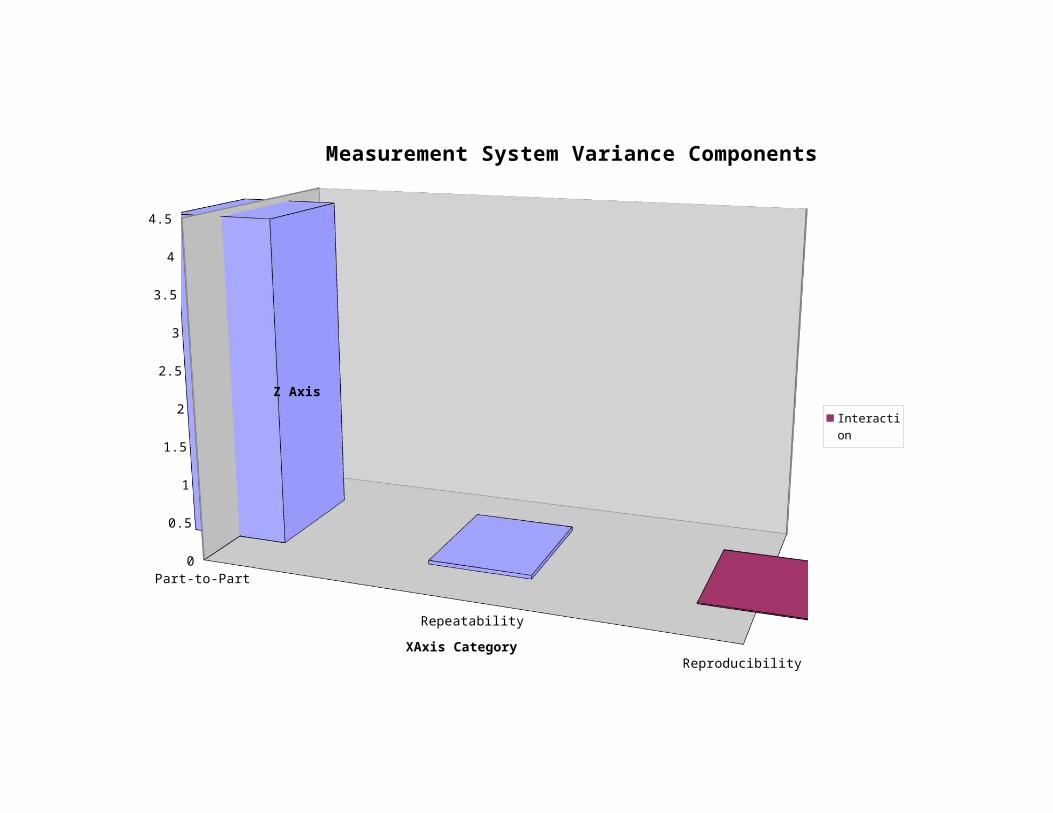
Source Variance Standard Deviation % ContributionTotal Measurement (Gage) 0.06675 0.258360213655274 1.49% Repeatability 0.052 0.228035085019824 1.16% Reproducibility 0.01475 0.121449578014914 0.33% Operator 0.001027778 0.0320589734361186 0.02% Oper * Part Interaction 0.013722222 0.11714188927204 0.31%Product (Part-to-Part) 4.410583333 2.10013888429631 98.51%Total 4.477333333 2.11597101429423 100.00%
USL 12LSL 2Precision to Tolerance Ratio 0.155016128Precision to Total Ratio 0.122100072Resolution 11.5
BIAS ANALYSISReference Bias
Not Available
p Value
0.2053

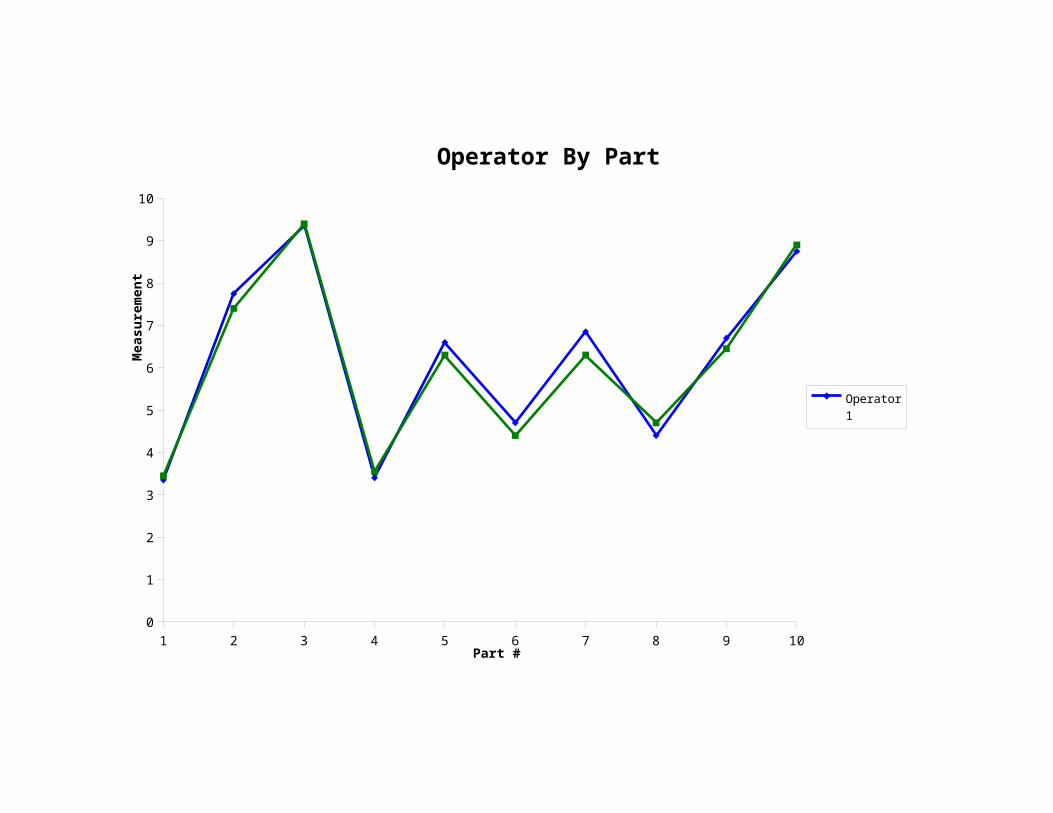
1 2 3 4 5 6 7 8 9 100
1
2
3
4
5
6
7
8
9
10
Operator By Part
Operator 1Operator 2
Part #
Mea
sure
men
t
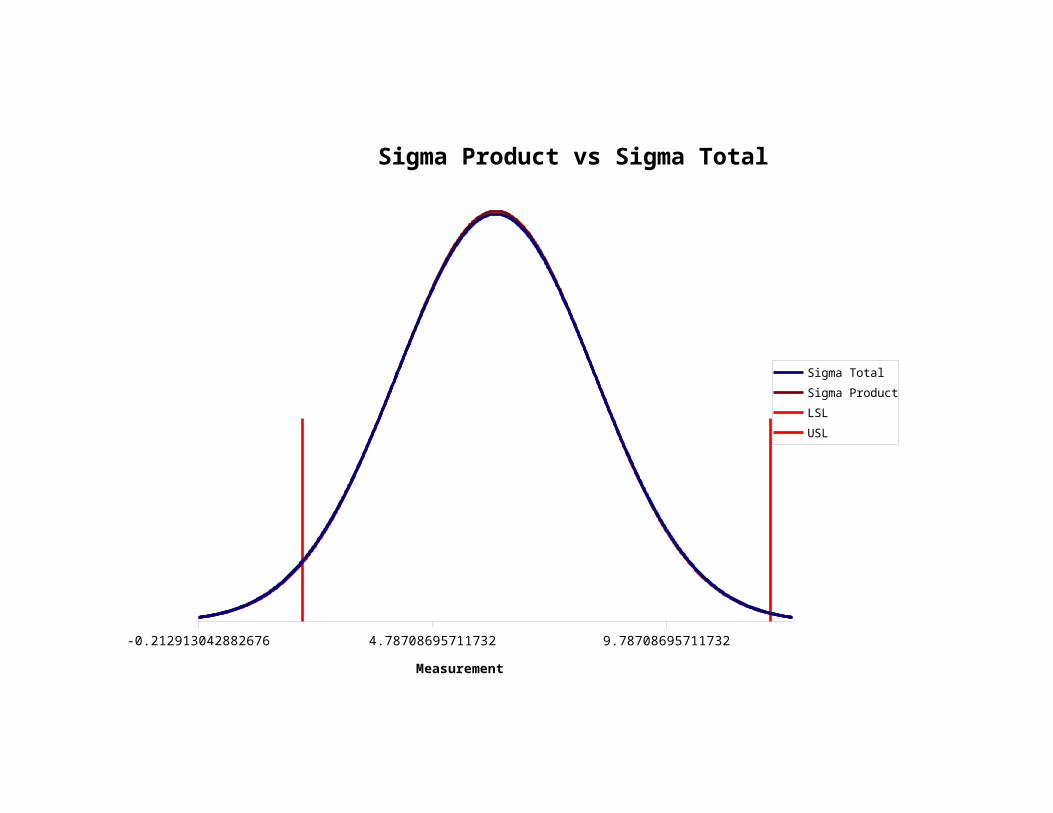
-0.212913042882676 4.78708695711732 9.78708695711732
Sigma Product vs Sigma Total
Sigma Total
Sigma Product
LSL
USL
Measurement
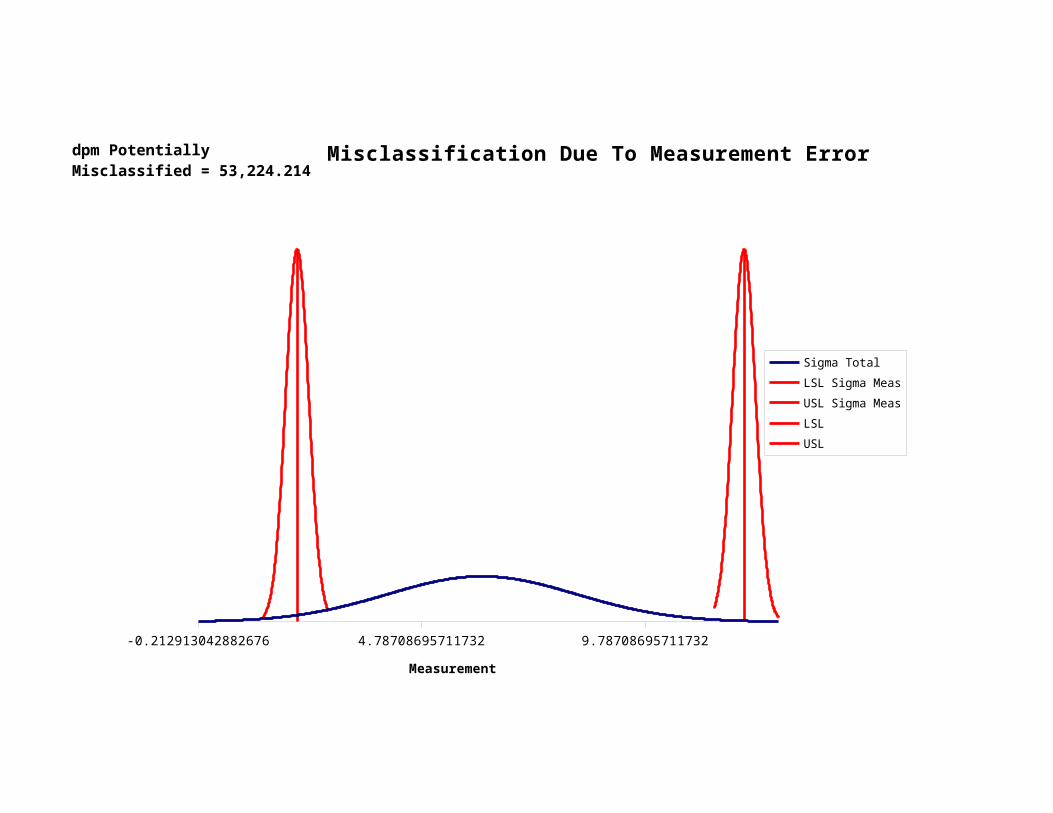
-0.212913042882676 4.78708695711732 9.78708695711732
Misclassification Due To Measurement Error
Sigma Total
LSL Sigma Meas
USL Sigma Meas
LSL
USL
Measurement
dpm Potentially Misclassified = 53,224.214
Part-to-Part
Repeatability
Reproducibility
0
0.5
1
1.5
2
2.5
3
3.5
4
4.5
Measurement System Variance Components
InteractionOperator
XAxis Category
Z Axis
1 2 3 4 5 6 7 8 9 10 1 2 3 4 5 6 7 8 9 100
1
2
3
4
5
6
7
8
9
10
MSA- Xbar Chart
Operator 1
Operator 2
UCL = 6.624
Center = 6.135
LCL = 5.646
Part Number
Part
Aver
age

1 2 3 4 5 6 7 8 9 10 1 2 3 4 5 6 7 8 9 100
0.1
0.2
0.3
0.4
0.5
0.6
0.7
0.8
0.9
MSA- Range Chart
Operator 1
Operator 2
UCL = .849
Center = .26
LCL = .
Part Number
Part
Rang
e

Regression outputFactor Coef p ValueConstant 2.071 0.000Temp 2.002 0.000Rate 3.003 0.000Flow 5.003 0.000Press 2.19965172 6.679429E-45
Adj R Sq 1.000Std Error 0.054

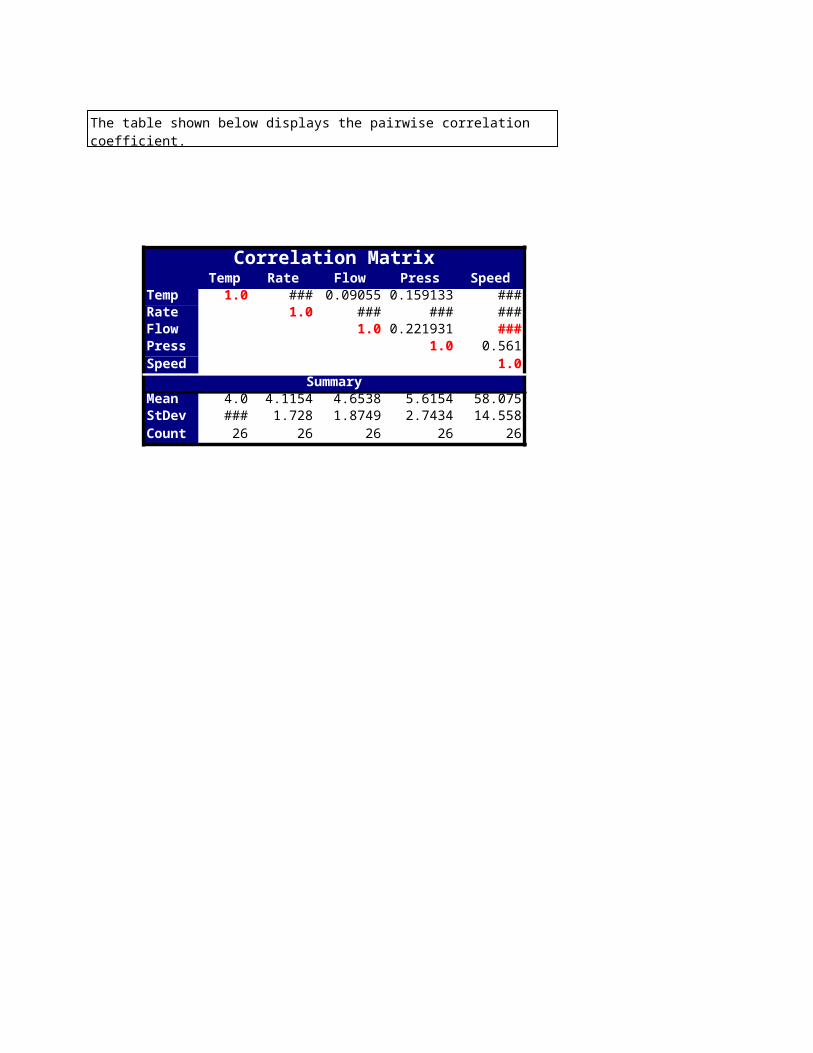
Correlation MatrixTemp Rate Flow Press Speed
Temp 1.0 -0.02807 0.09055 0.159133 0.341069Rate 1.0 0.198007 -0.091515 0.439827Flow 1.0 0.221931 0.827545Press 1.0 0.561Speed 1.0
SummaryMean 4.0 4.1154 4.6538 5.6154 58.075StDev 1.6492 1.728 1.8749 2.7434 14.558Count 26 26 26 26 26
The table shown below displays the pairwise correlation coefficient.
t Test Analysis (Mean)Temp Rate Flow Press Speed
Temp 1.0 0.806459 0.187874 0.013088 0.0Rate 1.0 0.28674 0.022272 0.0Flow 1.0 0.146349 0.0Press 1.0 0.0Speed 1.0
SummaryMean 4.0 4.1154 4.6538 5.6154 58.075StDev 1.6492 1.728 1.8749 2.7434 14.558Count 26 26 26 26 26
The results below represent the p-values from a two sample, 2-tailed t-test. This means that the probability of falsely concluding the alternative hypothesis is the value shown (where the alternate hypothesis is that the means are not equal). Another way of interpreting this result is that you can have (1-pvalue)*100% confidence that the means are not equal.

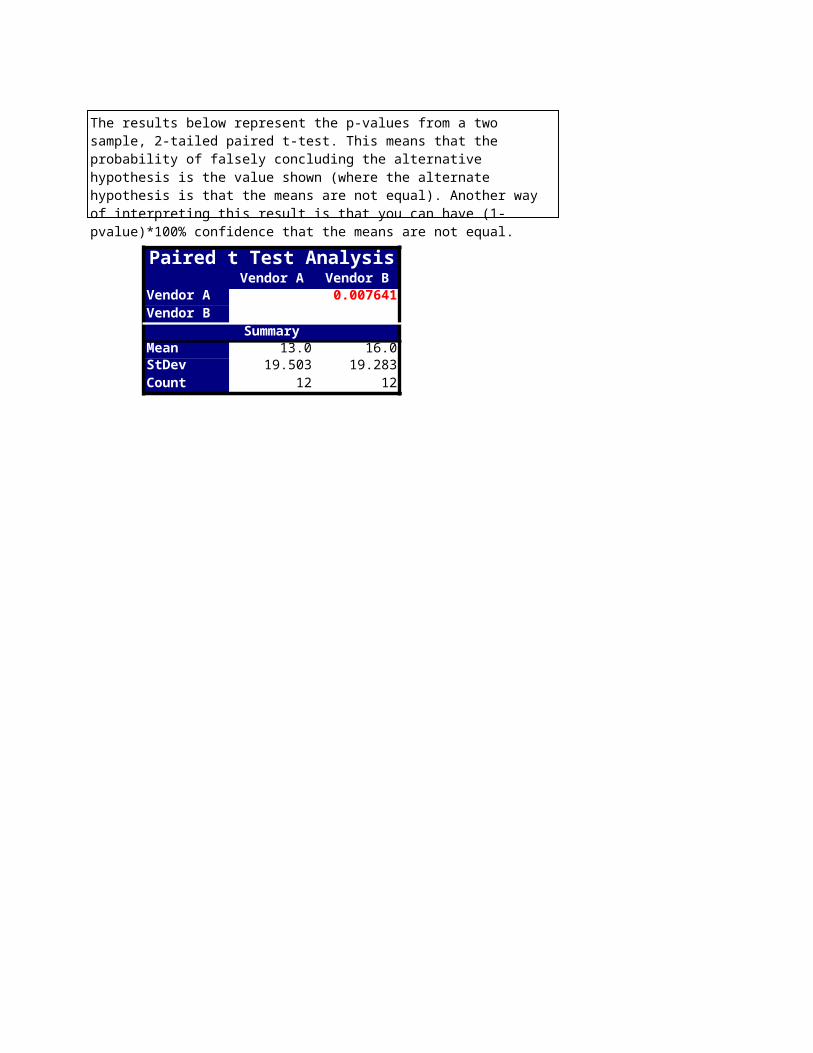
Paired t Test AnalysisVendor A Vendor B
Vendor A 0.007641Vendor B
SummaryMean 13.0 16.0StDev 19.503 19.283Count 12 12
The results below represent the p-values from a two sample, 2-tailed paired t-test. This means that the probability of falsely concluding the alternative hypothesis is the value shown (where the alternate hypothesis is that the means are not equal). Another way of interpreting this result is that you can have (1-pvalue)*100% confidence that the means are not equal.
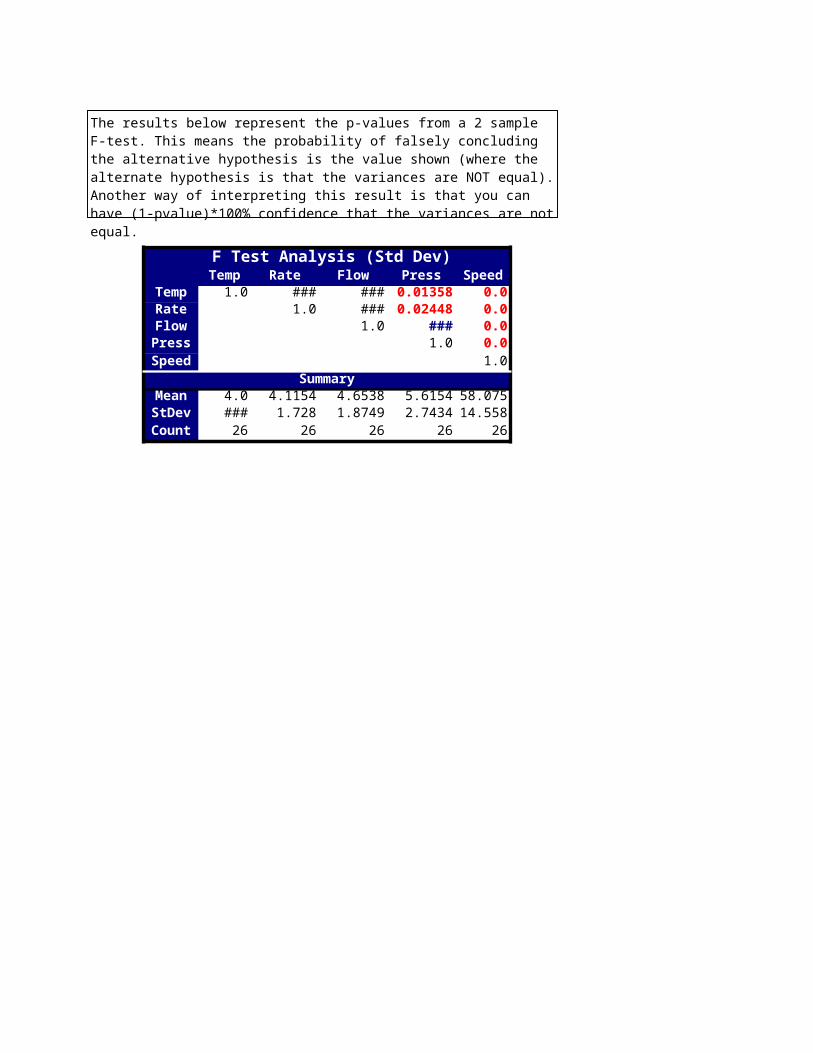
F Test Analysis (Std Dev)Temp Rate Flow Press Speed
Temp 1.0 0.817297 0.526045 0.01358 0.0Rate 1.0 0.686486 0.02448 0.0Flow 1.0 0.062554 0.0Press 1.0 0.0Speed 1.0
SummaryMean 4.0 4.1154 4.6538 5.6154 58.075StDev 1.6492 1.728 1.8749 2.7434 14.558Count 26 26 26 26 26
The results below represent the p-values from a 2 sample F-test. This means the probability of falsely concluding the alternative hypothesis is the value shown (where the alternate hypothesis is that the variances are NOT equal). Another way of interpreting this result is that you can have (1-pvalue)*100% confidence that the variances are not equal.
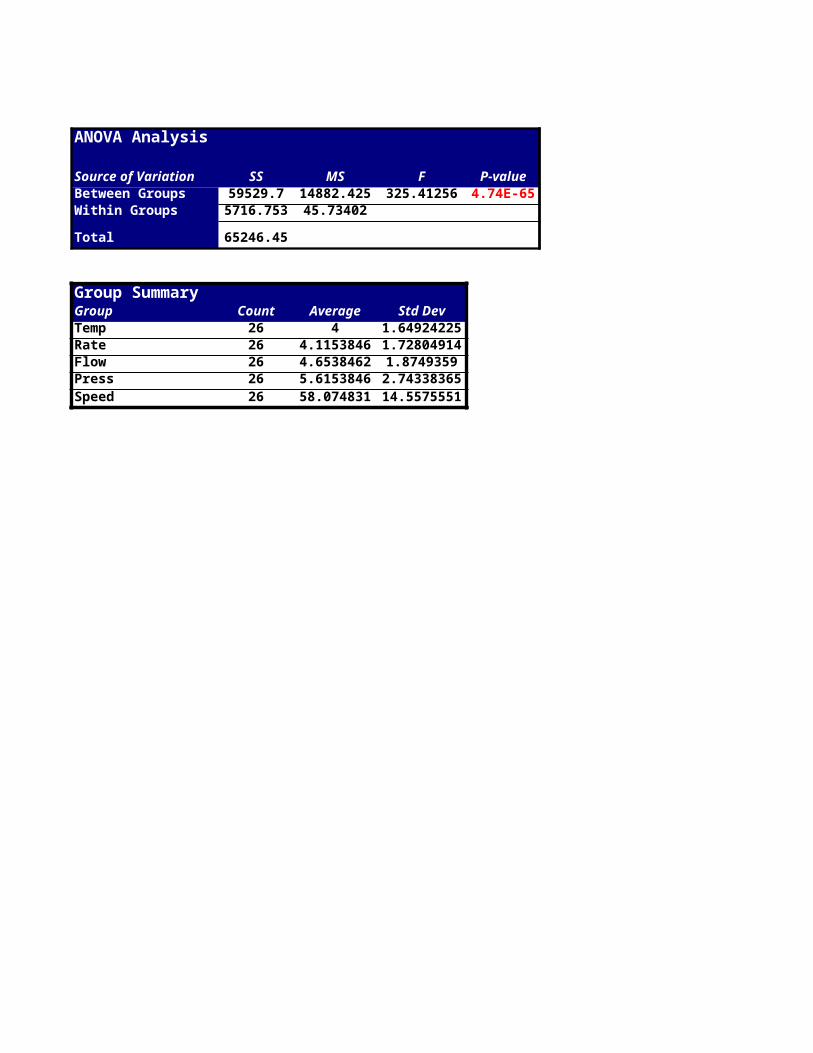
ANOVA Analysis
Source of Variation SS MS F P-valueBetween Groups 59529.698 14882.4246 325.41256 4.738E-65Within Groups 5716.7525 45.7340203
Total 65246.451
Group SummaryGroup Count Average Std DevTemp 26 4 1.64924225Rate 26 4.11538462 1.72804914Flow 26 4.65384615 1.8749359Press 26 5.61538462 2.74338365Speed 26 58.0748305 14.5575551
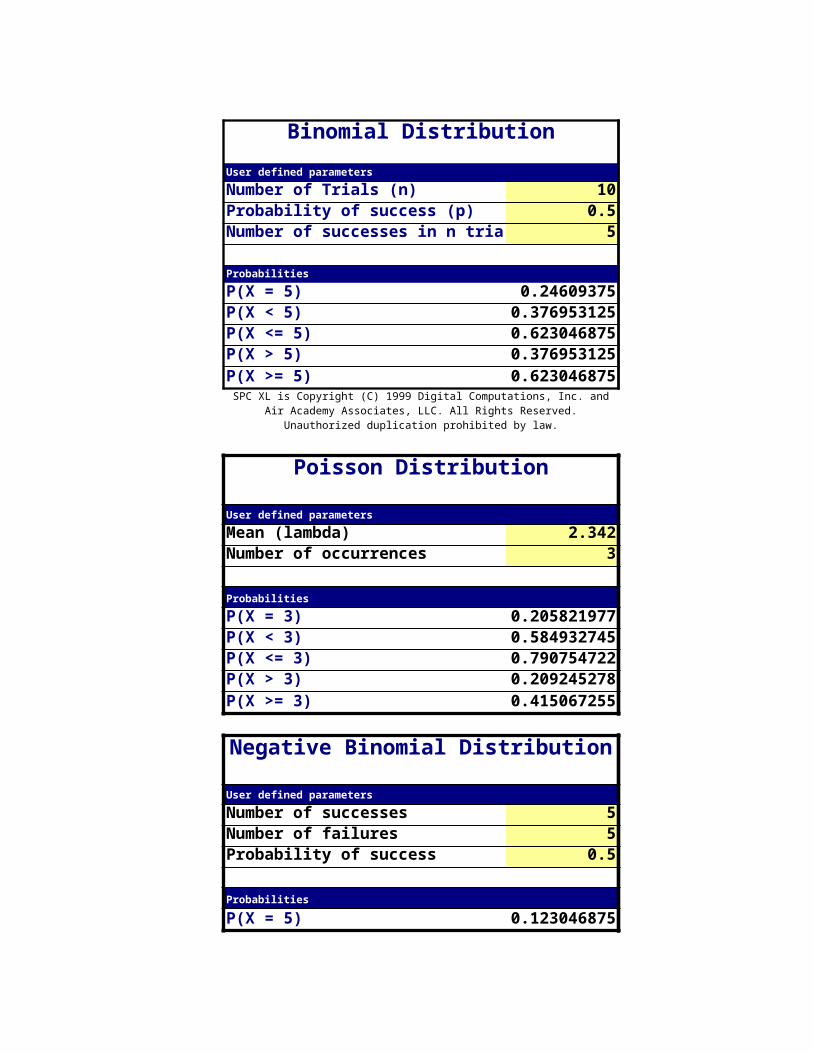
Binomial DistributionUser defined parameters
Number of Trials (n) 10Probability of success (p) 0.5Number of successes in n trials 5
Probabilities
P(X = 5) 0.24609375P(X < 5) 0.376953125P(X <= 5) 0.623046875P(X > 5) 0.376953125P(X >= 5) 0.623046875
Poisson Distribution
User defined parameters
Mean (lambda) 2.342Number of occurrences 3
Probabilities
P(X = 3) 0.205821977P(X < 3) 0.584932745P(X <= 3) 0.790754722P(X > 3) 0.209245278P(X >= 3) 0.415067255
Negative Binomial Distribution
User defined parameters
Number of successes 5Number of failures 5Probability of success 0.5
Probabilities
P(X = 5) 0.123046875
SPC XL is Copyright (C) 1999 Digital Computations, Inc. and Air Academy Associates, LLC. All Rights Reserved. Unauthorized duplication prohibited
by law.
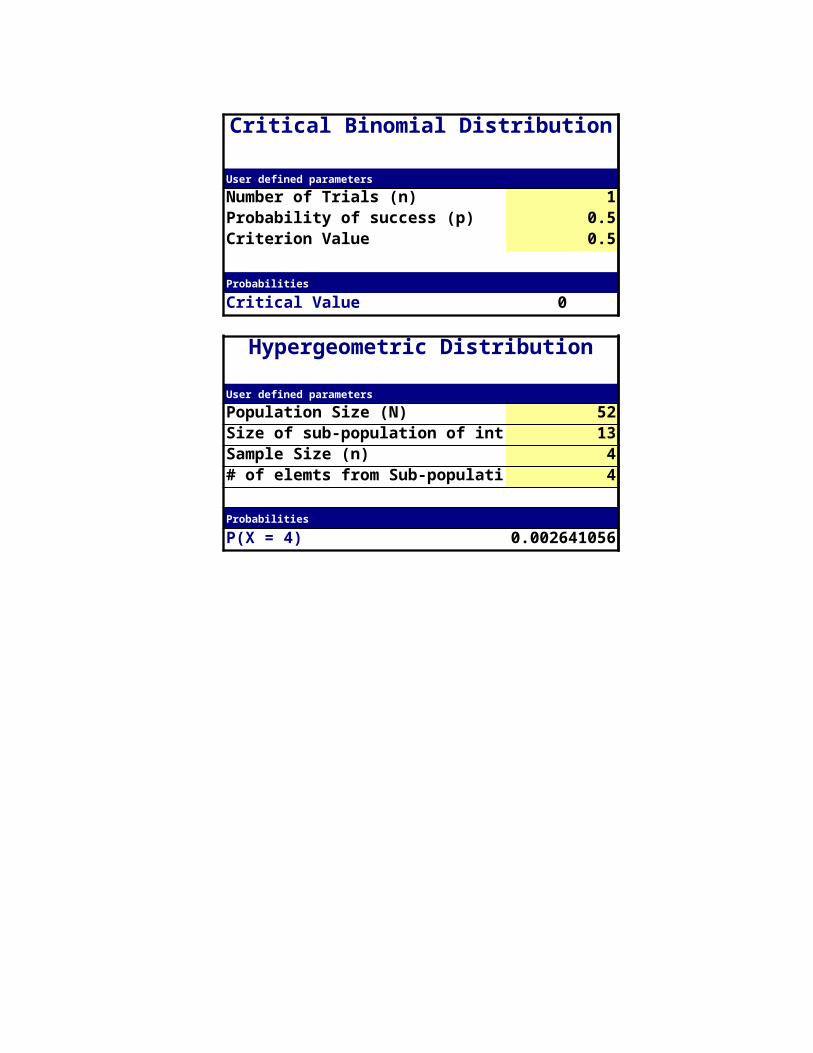
Critical Binomial Distribution
User defined parameters
Number of Trials (n) 1Probability of success (p) 0.5Criterion Value 0.5
Probabilities
Critical Value 0
Hypergeometric Distribution
User defined parameters
Population Size (N) 52Size of sub-population of interest 13Sample Size (n) 4# of elemts from Sub-population of 4
Probabilities
P(X = 4) 0.002641056
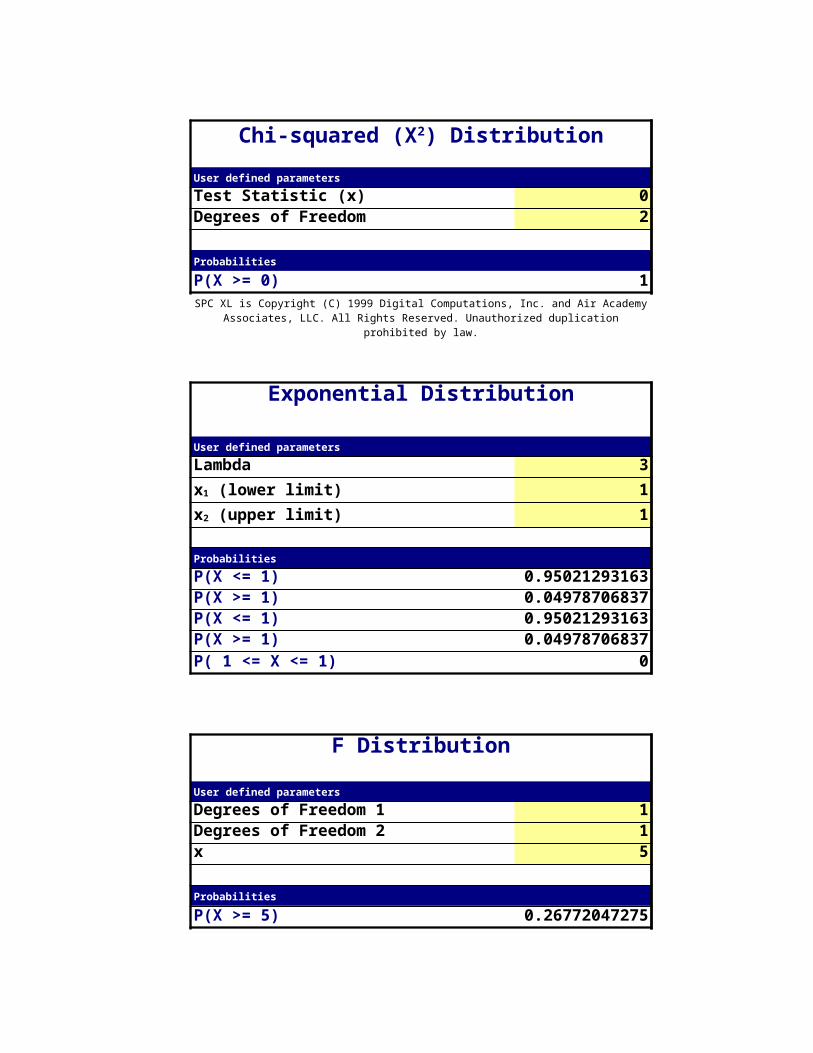
User defined parameters
Test Statistic (x) 0Degrees of Freedom 2
Probabilities
P(X >= 0) 1
Exponential Distribution
User defined parameters
Lambda 311
Probabilities
P(X <= 1) 0.950212931632P(X >= 1) 0.049787068368P(X <= 1) 0.950212931632P(X >= 1) 0.049787068368P( 1 <= X <= 1) 0
F Distribution
User defined parameters
Degrees of Freedom 1 1Degrees of Freedom 2 1x 5
Probabilities
P(X >= 5) 0.267720472748
Chi-squared (X2) Distribution
SPC XL is Copyright (C) 1999 Digital Computations, Inc. and Air Academy Associates, LLC. All Rights Reserved. Unauthorized duplication prohibited by law.
x1 (lower limit) x2 (upper limit)
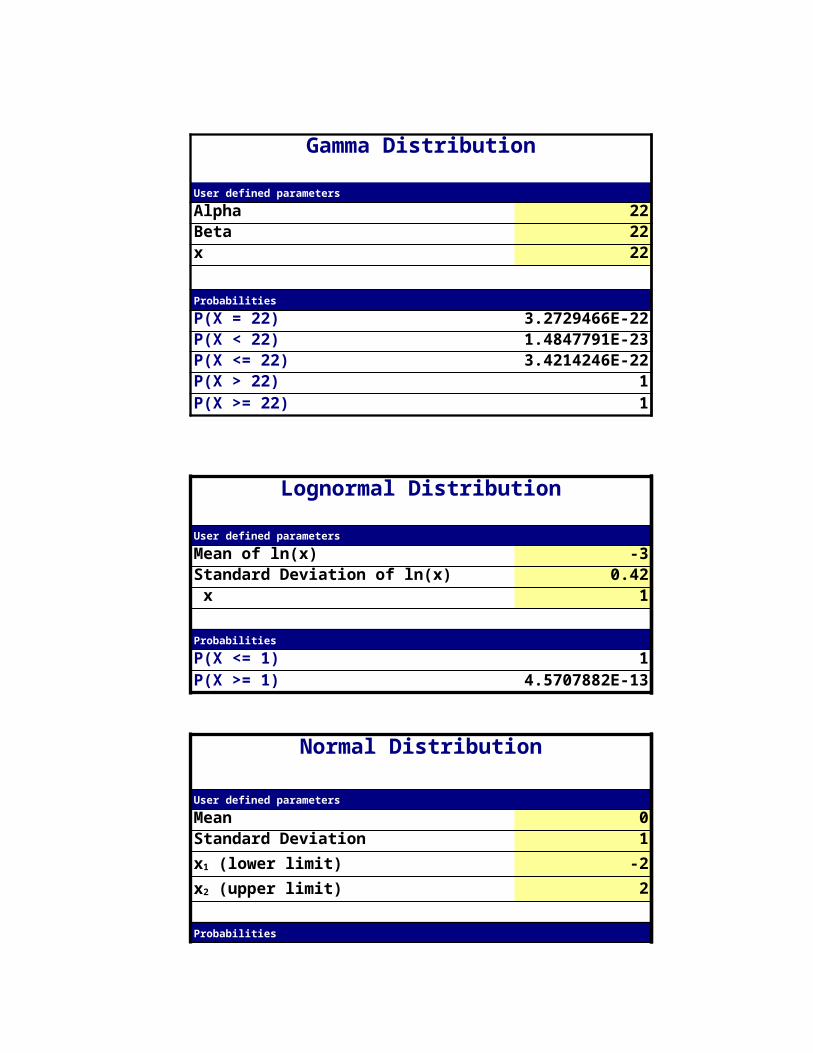
Gamma Distribution
User defined parameters
Alpha 22Beta 22x 22
Probabilities
P(X = 22) 3.27294665E-22P(X < 22) 1.48477909E-23P(X <= 22) 3.42142456E-22P(X > 22) 1P(X >= 22) 1
Lognormal Distribution
User defined parameters
Mean of ln(x) -3Standard Deviation of ln(x) 0.42 x 1
Probabilities
P(X <= 1) 1P(X >= 1) 4.57078819E-13
Normal Distribution
User defined parameters
Mean 0Standard Deviation 1
-22
Probabilities
x1 (lower limit)x2 (upper limit)
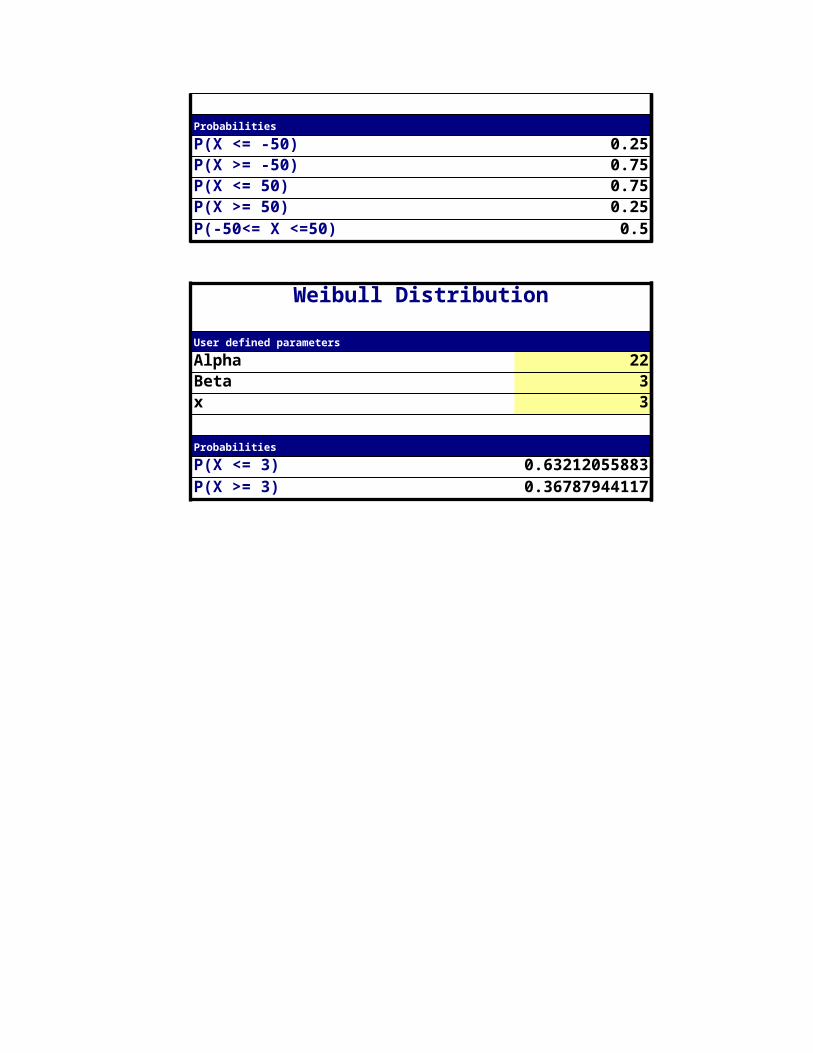
P(X <= -2) 0.022750131948P(X >= -2) 0.977249868052P(X <= 2) 0.977249868052P(X >= 2) 0.022750131948P( -2 <= X <= 2) 0.954499736104
Standard Normal Distribution
User defined parameters
z 1
Probabilities
P(X > 1) 0.158655253931P(X < 1) 0.841344746069
Student's t Distribution
User defined parameters
Degrees of Freedom 3x 1
Probabilities
P(X > 1) 0.195501109235P(X < 1) 0.804498890765P(X > 1) 0.39100221847
Continuous Uniform Distribution
User defined parameters
Distribution Lower Limit -100Distribution Upper Limit 100x1 (lower) -50x2 (upper) 50

Probabilities
P(X <= -50) 0.25P(X >= -50) 0.75P(X <= 50) 0.75P(X >= 50) 0.25P(-50<= X <=50) 0.5
Weibull Distribution
User defined parameters
Alpha 22Beta 3x 3
Probabilities
P(X <= 3) 0.632120558829P(X >= 3) 0.367879441171
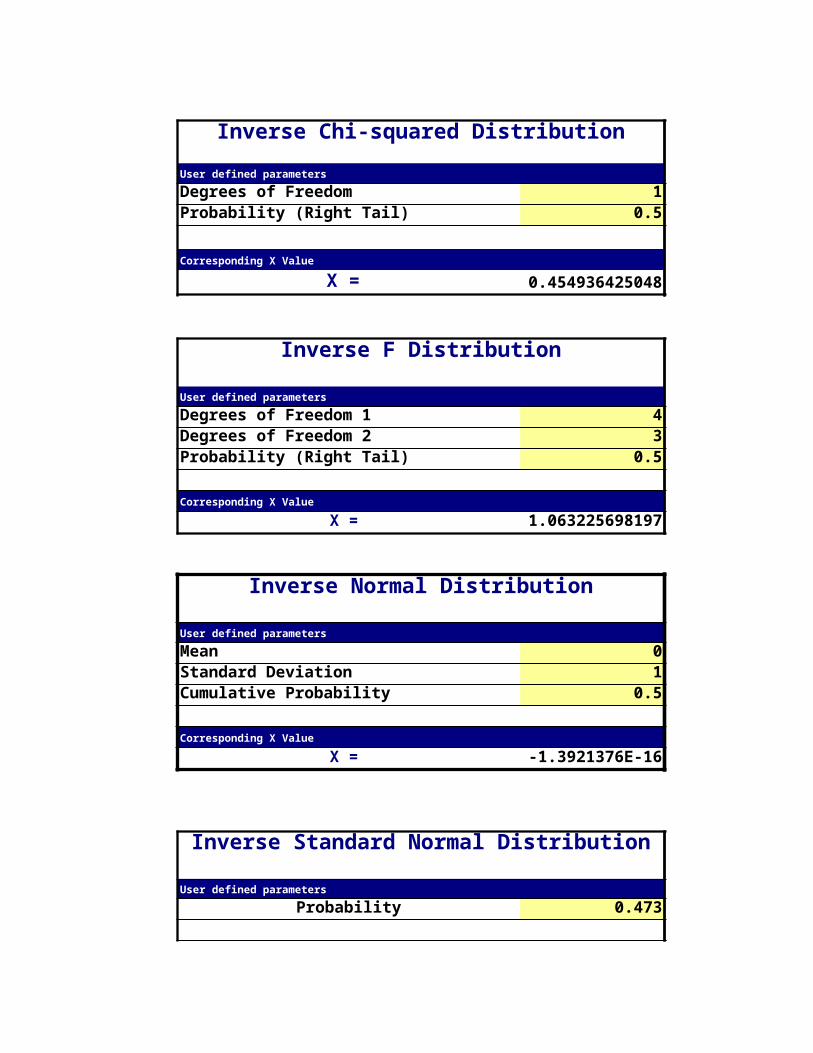
Inverse Chi-squared Distribution
User defined parameters
Degrees of Freedom 1Probability (Right Tail) 0.5
Corresponding X Value
X = 0.454936425048
Inverse F Distribution
User defined parameters
Degrees of Freedom 1 4Degrees of Freedom 2 3Probability (Right Tail) 0.5
Corresponding X Value
X = 1.063225698197
Inverse Normal Distribution
User defined parameters
Mean 0Standard Deviation 1Cumulative Probability 0.5
Corresponding X Value
X = -1.39213764E-16
Inverse Standard Normal Distribution
User defined parameters
Probability 0.473
Corresponding X Value
z = -0.067730713004
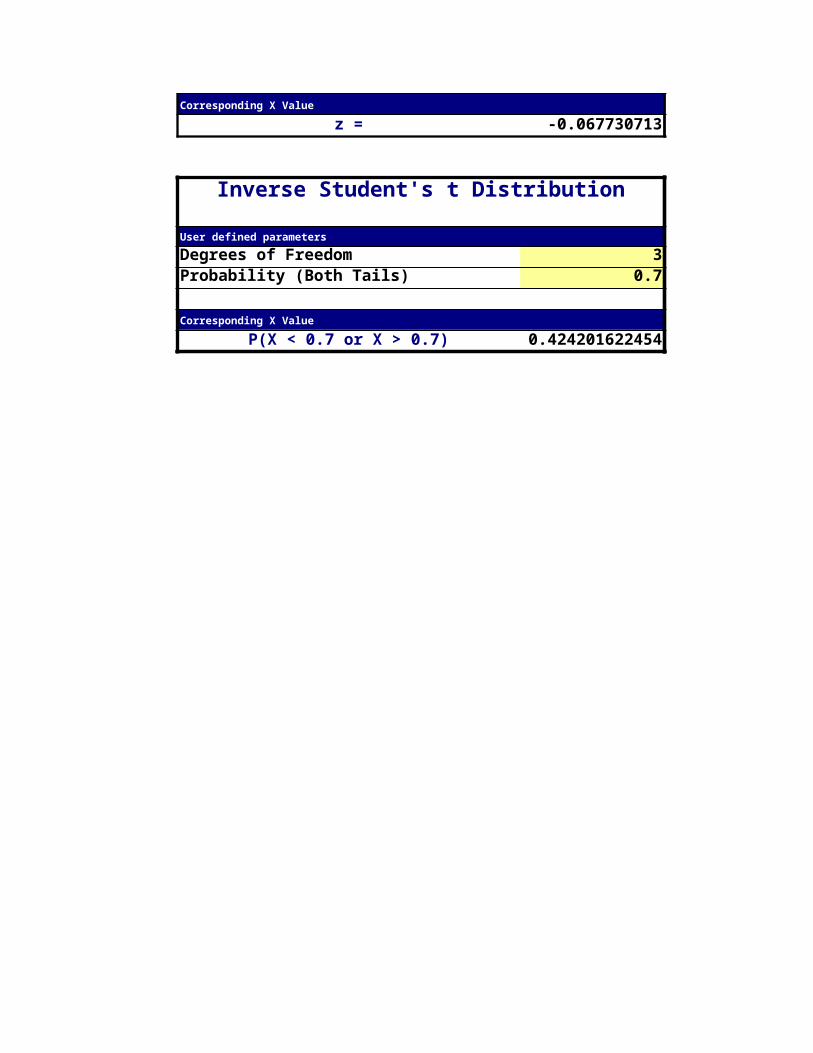
Inverse Student's t Distribution
User defined parameters
Degrees of Freedom 3Probability (Both Tails) 0.7
Corresponding X Value
P(X < 0.7 or X > 0.7) 0.424201622454
Region Sales RegionNE 7 SalesSW 3NW 3NW 4NW 3SW 3NE 6SE 12SE 8SE 13NE 8NW 1NE 6NE 7NW 1NE 8NE 7SE 9SW 4SW 6SE 9SW 5SE 12NE 9NW 2NE 8SW 4NE 8SW 3SW 5SW 3SE 8NW 3SE 22NW 2SE 9NE 8NW 1NW 2SE 12SE 7SE 12NE 7NE 6NE 6SW 6NW 2NE 7
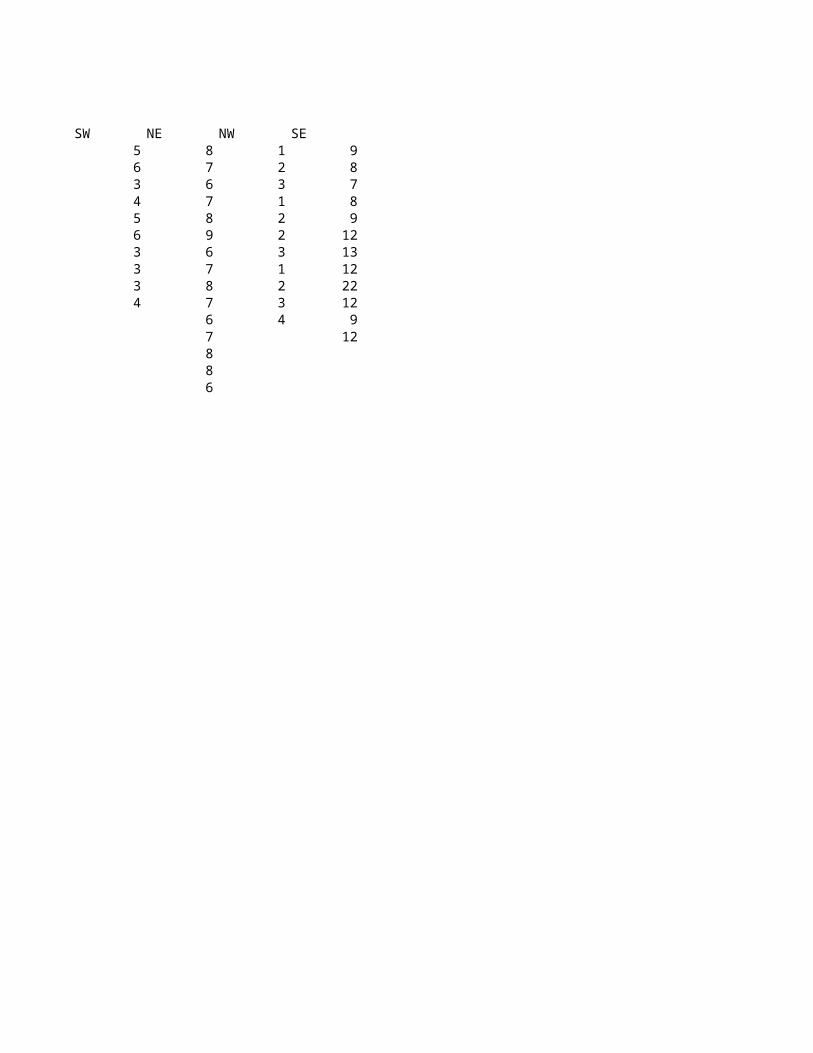
The data on the left "Unstacks" into the data on the right

SW NE NW SE5 8 1 96 7 2 83 6 3 74 7 1 85 8 2 96 9 2 123 6 3 133 7 1 123 8 2 224 7 3 12
6 4 97 12886
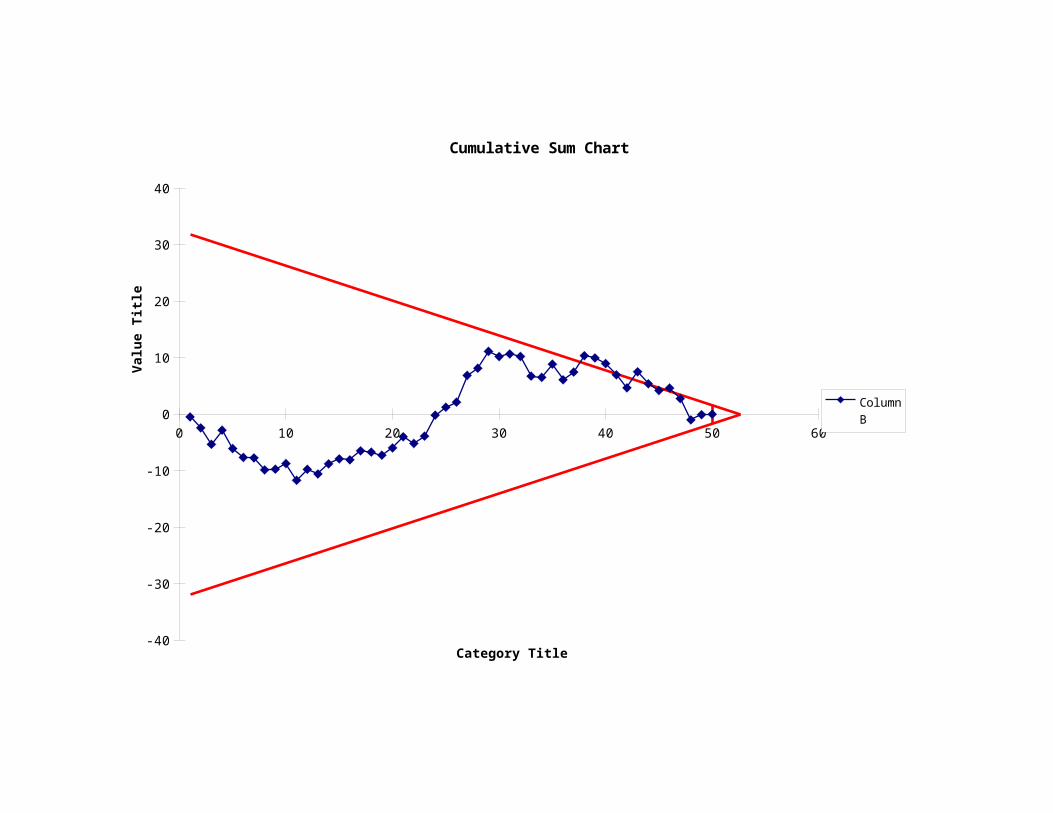
0 10 20 30 40 50 60
-40
-30
-20
-10
0
10
20
30
40
Cumulative Sum Chart
Column B
Category Title
Valu
e Ti
tle
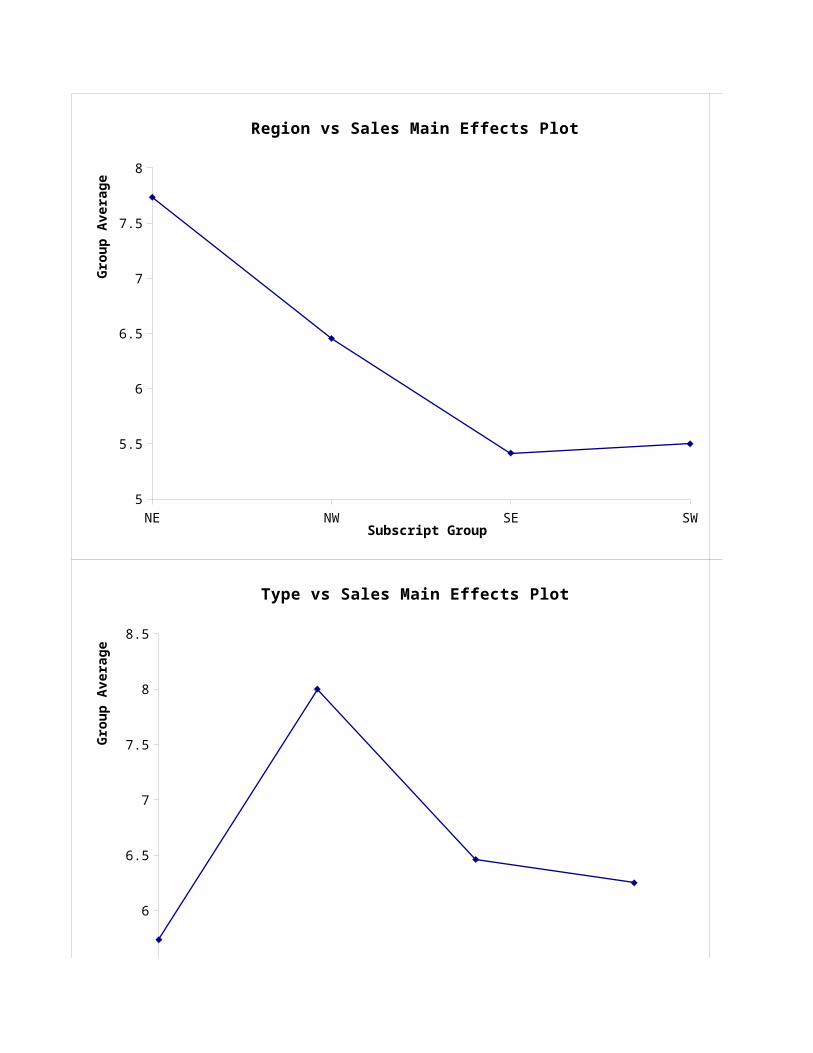
NE NW SE SW5
5.5
6
6.5
7
7.5
8
Region vs Sales Main Effects Plot
Subscript Group
Gro
up A
vera
ge
NE NW SE SW3.5
4
4.5
5
5.5
Region vs Profit Main Effects Plot
Subscript Group
Gro
up A
vera
ge
Value Line Extreme Entry Level High Performance5.5
6
6.5
7
7.5
8
8.5
Type vs Sales Main Effects Plot
Subscript Group
Gro
up A
vera
ge
Value Line Extreme Entry Level High Performance4.3
4.4
4.5
4.6
4.7
4.8
4.9
Type vs Profit Main Effects Plot
Subscript Group
Gro
up A
vera
ge
Value Line Extreme Entry Level High Performance5.5
6
6.5
7
7.5
8
8.5
Type vs Sales Main Effects Plot
Subscript GroupG
roup
Ave
rage
Value Line Extreme Entry Level High Performance4.3
4.4
4.5
4.6
4.7
4.8
4.9
Type vs Profit Main Effects Plot
Subscript Group
Gro
up A
vera
ge
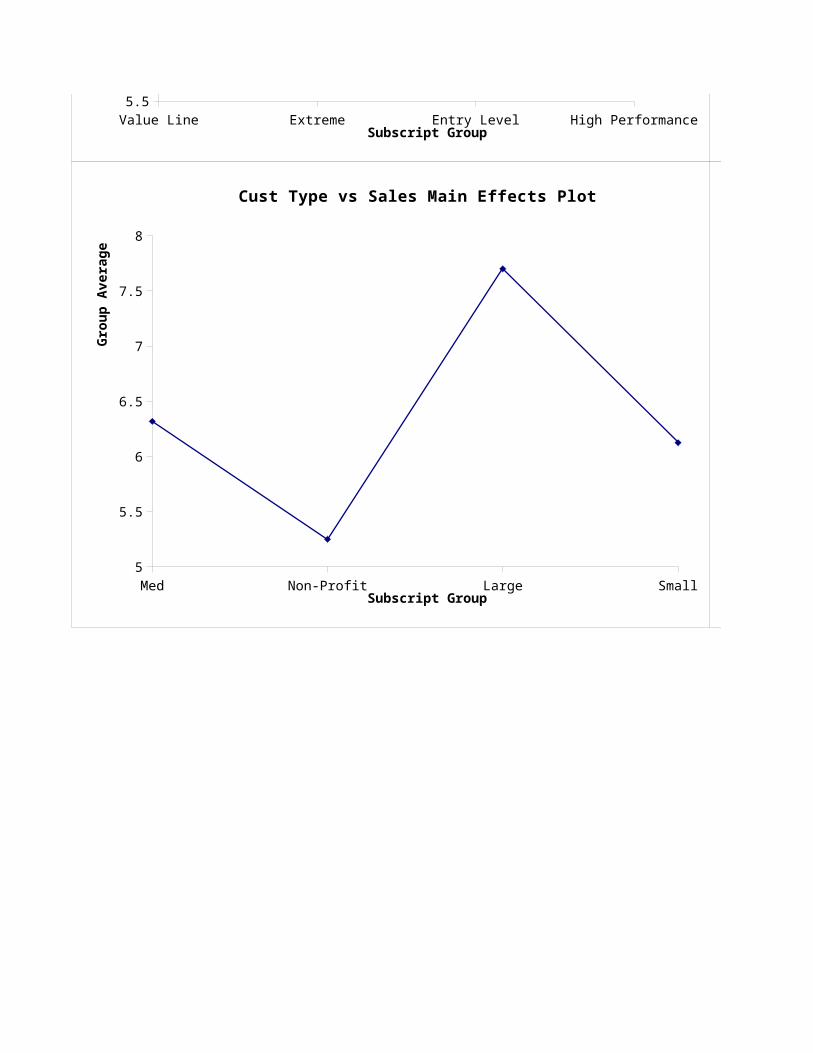
Med Non-Profit Large Small5
5.5
6
6.5
7
7.5
8
Cust Type vs Sales Main Effects Plot
Subscript Group
Gro
up A
vera
ge
Med Non-Profit Large Small3.75
3.95
4.15
4.35
4.55
4.75
4.95
Cust Type vs Profit Main Effects Plot
Subscript Group
Gro
up A
vera
ge
NE NW SE SW3.5
4
4.5
5
5.5
Region vs Profit Main Effects Plot
Subscript Group
Gro
up A
vera
ge
Value Line Extreme Entry Level High Performance4.3
4.4
4.5
4.6
4.7
4.8
4.9
Type vs Profit Main Effects Plot
Subscript Group
Gro
up A
vera
ge

Value Line Extreme Entry Level High Performance4.3
4.4
4.5
4.6
4.7
4.8
4.9
Type vs Profit Main Effects Plot
Subscript GroupG
roup
Ave
rage
Med Non-Profit Large Small3.75
3.95
4.15
4.35
4.55
4.75
4.95
Cust Type vs Profit Main Effects Plot
Subscript Group
Gro
up A
vera
ge

11.092379.638078
Box Plot Data 8.66416Operator 1 Operator 2 Operator 3 14.08279.072357687 13.46541875 14.35044031 8.31952310.53550978 10.58448998 4.225760583 10.0125415.16294569 11.25409478 0.726696466 11.479228.092194208 9.487310806 7.660731853 9.4560077.644143331 13.03382292 0.285952908 11.704418.792466822 10.72902592 5.921822117 12.56928.093973935 12.58298265 16.60786434 8.6177149.752108837 9.241570385 25.97187072 13.512386.849924621 11.5499729 14.99740889 10.749439.385771399 8.343265272 2.131718669 13.36687
12.4593411.4053713.1639411.3535111.0290212.85756
13.556110.3887712.8677415.2908612.9732212.4768116.3132712.8394314.5635110.6541512.0353911.131418.09672411.3569113.909898.80677612.9480214.4758211.1684310.576379.5906849.26689614.418899.45748910.3865512.007459.6996937.80617912.4962711.65775

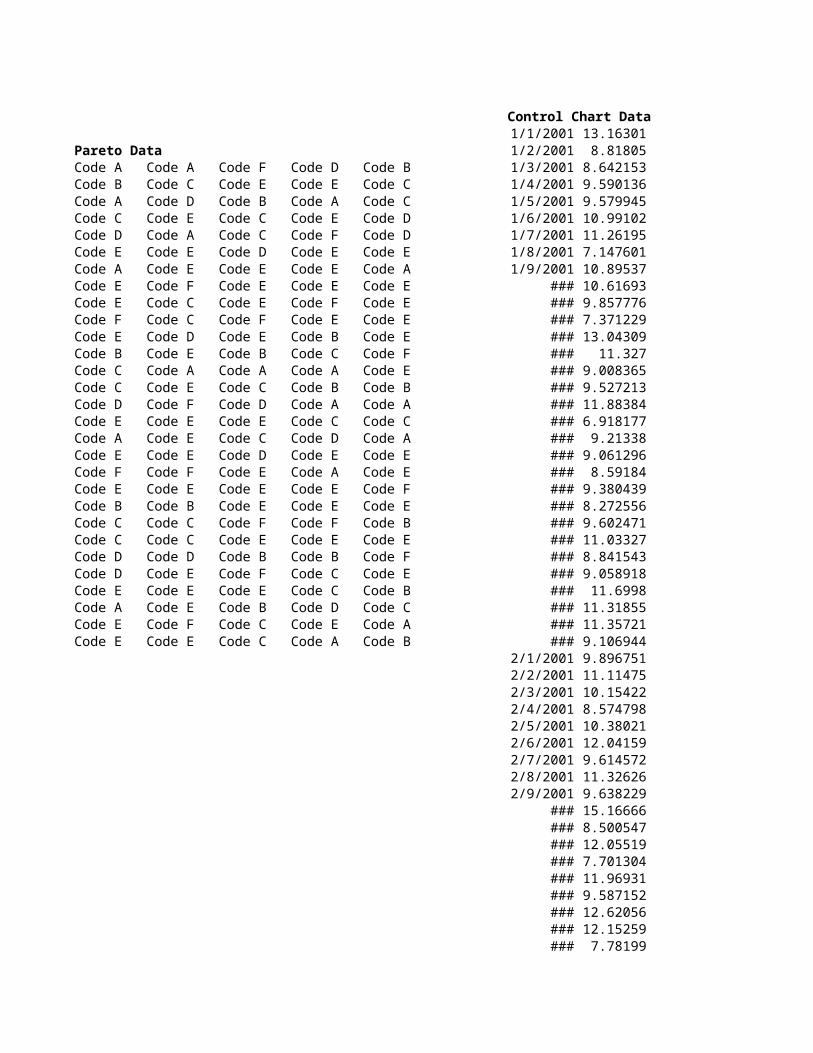
Control Chart Data1/1/2001 13.16301
Pareto Data 1/2/2001 8.81805Code A Code A Code F Code D Code B 1/3/2001 8.642153Code B Code C Code E Code E Code C 1/4/2001 9.590136Code A Code D Code B Code A Code C 1/5/2001 9.579945Code C Code E Code C Code E Code D 1/6/2001 10.99102Code D Code A Code C Code F Code D 1/7/2001 11.26195Code E Code E Code D Code E Code E 1/8/2001 7.147601Code A Code E Code E Code E Code A 1/9/2001 10.89537Code E Code F Code E Code E Code E 1/10/2001 10.61693Code E Code C Code E Code F Code E 1/11/2001 9.857776Code F Code C Code F Code E Code E 1/12/2001 7.371229Code E Code D Code E Code B Code E 1/13/2001 13.04309Code B Code E Code B Code C Code F 1/14/2001 11.327Code C Code A Code A Code A Code E 1/15/2001 9.008365Code C Code E Code C Code B Code B 1/16/2001 9.527213Code D Code F Code D Code A Code A 1/17/2001 11.88384Code E Code E Code E Code C Code C 1/18/2001 6.918177Code A Code E Code C Code D Code A 1/19/2001 9.21338Code E Code E Code D Code E Code E 1/20/2001 9.061296Code F Code F Code E Code A Code E 1/21/2001 8.59184Code E Code E Code E Code E Code F 1/22/2001 9.380439Code B Code B Code E Code E Code E 1/23/2001 8.272556Code C Code C Code F Code F Code B 1/24/2001 9.602471Code C Code C Code E Code E Code E 1/25/2001 11.03327Code D Code D Code B Code B Code F 1/26/2001 8.841543Code D Code E Code F Code C Code E 1/27/2001 9.058918Code E Code E Code E Code C Code B 1/28/2001 11.6998Code A Code E Code B Code D Code C 1/29/2001 11.31855Code E Code F Code C Code E Code A 1/30/2001 11.35721Code E Code E Code C Code A Code B 1/31/2001 9.106944
2/1/2001 9.8967512/2/2001 11.114752/3/2001 10.154222/4/2001 8.5747982/5/2001 10.380212/6/2001 12.041592/7/2001 9.6145722/8/2001 11.326262/9/2001 9.638229
2/10/2001 15.166662/11/2001 8.5005472/12/2001 12.055192/13/2001 7.7013042/14/2001 11.969312/15/2001 9.5871522/16/2001 12.620562/17/2001 12.152592/18/2001 7.781992/19/2001 10.035972/20/2001 16.303552/21/2001 14.89313
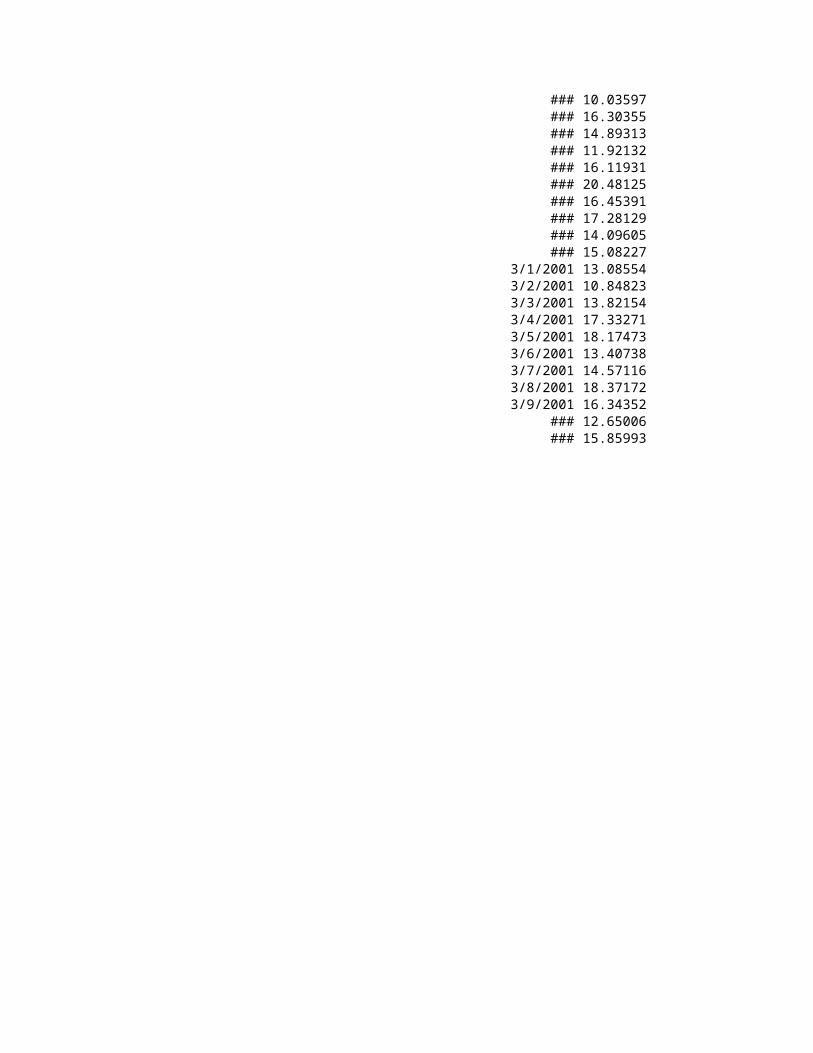
2/22/2001 11.921322/23/2001 16.119312/24/2001 20.481252/25/2001 16.453912/26/2001 17.281292/27/2001 14.096052/28/2001 15.08227
3/1/2001 13.085543/2/2001 10.848233/3/2001 13.821543/4/2001 17.332713/5/2001 18.174733/6/2001 13.407383/7/2001 14.571163/8/2001 18.371723/9/2001 16.34352
3/10/2001 12.650063/11/2001 15.85993
Multiple Regression Data Region Type Cust TypeTemp Rate Flow Press Speed NE Value Line Med
4 5 5 8 67.72888 NW Extreme Med5 6 4 3 56.73513 SE Value Line Non-Profit3 4 3 5 46.18162 SW Entry LevelLarge2 6 6 4 62.96195 SW Extreme Med5 2 4 5 49.10009 NE Value Line Small2 3 3 7 45.51231 NW Value Line Non-Profit4 6 6 8 75.77076 NE Entry LevelSmall6 2 4 9 59.84111 SW Value Line Med2 3 5 11 64.25299 SW High Perfo Med3 4 3 2 39.50884 NE Entry LevelLarge5 6 5 3 61.79789 NE Value Line Non-Profit2 1 1 1 16.28045 NW Entry LevelMed3 6 7 5 72.1684 SW Extreme Med4 3 9 7 79.57046 NE Value Line Non-Profit6 4 4 3 52.65665 SW Value Line Non-Profit3 4 3 9 54.91209 SE Value Line Large4 7 6 2 65.41173 SW High Perfo Med5 5 5 6 65.26972 NE Entry LevelMed2 3 3 4 38.86958 NW Value Line Med3 7 6 8 76.62869 SE High Perfo Large4 2 8 7 71.47959 NW Entry LevelMed5 3 3 3 42.70664 SE Entry LevelNon-Profit2 4 5 2 47.44601 NE Value Line Large7 6 2 8 61.70804 NW Extreme Med8 2 7 7 74.5295 NW Value Line Med5 3 4 9 60.91648 SE High Perfo Small
SW Value Line MedSW Value Line MedNW Entry LevelMedNE Entry LevelNon-ProfitSE Entry LevelSmallSE Value Line MedNE Extreme Non-ProfitSE High Perfo SmallNE Extreme MedNE Value Line LargeNW Entry LevelLargeSE High Perfo LargeSE Value Line SmallSE Value Line LargeNE High Perfo SmallNW Entry LevelMedSW Extreme LargeNE Extreme MedNW Value Line SmallSE High Perfo MedNE Entry LevelMed

Sales Profit Sample Si Defects Vendor A Vendor B5 6 432 25 4 66 2 234 14 8 123 4 34 3 1 24 5 123 7 4 55 5 342 20 7 126 4 756 43 2 53 3 86 6 1 33 6 234 13 4 93 3 321 19 66 674 4 234 15 34 328 5 534 29 2 57 6 678 35 23 346 2 234 127 3 654 358 4 234 169 4 765 436 9 432 237 3 673 358 7 1423 737 8 654 376 5 423 227 6 442 258 18 26 41 32 43 51 22 32 43 71 82 43 54 69 38 27 118 39 4
12 113 212 322 812 79 6
12 7