Embed Size (px)
Citation preview

- 224-
Journal of Agricultural Meteorology 77(4): 224-234, 2021Full Paper
Spatiotemporal distribution of the potential risk of frost damage in tea fields from 1981-2020: A modeling approach considering phenology and meteorology
Kensuke KIMURAa,†, Ken KUDOb and Atsushi MARUYAMAa
a National Agriculture and Food Research Organization (NARO), Institute for Agro-Environmental Sciences, 3-1-3 Kannondai, Tsukuba, 305-8604, Japan
b Saitama Tea Research Institute, 244-2 Kamiyaganuki, Iruma, 358-0042, Japan
Abstract Climate change may induce severe frost damage to crops, and thus a reasonable assessment of frost risk, considering both crop phenology and meteorology, is required. Here, we introduced a new index of potential frost risk (Frisk) using thermal time (minimum air temperature below the threshold value) weighted by the percentage of budburst (Pbud). Moreover, we evaluated the spatiotemporal distributions of Frisk in tea fields within a 60 km×60 km area in east Japan from 1981-2020, using 1 km2-gridded meteorological data and a newly developed model of Pbud. The Pbud model considered three phenological phases (endodormancy, ecodormancy, and progress of budburst) and successfully represented changes in the Pbud of the tea buds for 15 years, with root mean square errors of 8.5 percentage points. The spatiotemporal distributions of Frisk over the past 40 years showed that potential frost risk significantly increased at elevations ranging from 50 m to 300 m because the budburst advanced at a faster rate than the temperature warming. These elevations corresponded to areas where tea plants were mainly cultivated, which indicates that tea cultivation is becoming vulnerable to frost, and the risk of economic losses due to the frost is increasing. The proposed assessment of frost risk could contribute to predicting frost damage and developing more reliable strategies for the operation of frost protection under the effects of future climate change. Key words: Budburst, Camellia sinensis, Cold stress, Mathematical model, Minimum temperature
��
��
1. Introduction
Frost often damages crops and induces huge economic losses in agriculture (Snyder et al., 2005). In recent years, tremendous frost damage has been reported in fruit orchards in the United States (112 million USD in 2007; Gu et al., 2008) and in tea fields in China (268 million USD in 2010; China Tea Marketing Association, 2010) and Japan (45 million USD in 2010; Matsuo et al., 2010). Owing to recent climate warming, the risk of such frost damage may be expected to decrease in the future because of advances in the date of the last spring frost (Schwartz et al., 2006). However, climate warming has also caused advances in phenological events such as budburst, leafout, and flowering in spring (Parmesan and Yohe, 2003), reducing the cold hardiness of plants. These advances in spring phenology and extreme temperature events, such as sudden cold spells in future climates, may increase the risk of frost damage (Augspurger, 2013; Ma et al., 2019).
Many investigations into frost risk have been performed based on trends in observed minimum temperatures, which give the dates of freezing events and the resulting length of the growing season. By analyzing data of daily minimum temperatures observed at ~1,000 meteorological stations, Easterling (2002)
found that the number of frost days decreased in the United States from 1948-1999. Robeson (2002) used data from a longer observation of minimum temperature in Illinois from 1906-1997 and found trends of the earlier spring freezing events. Some investigations have considered plant phenology as well as minimum temperature trends. To quantify the potential frost risk, a false spring index (FSI; Marino et al., 2011) is defined as the difference between the date of the last spring freeze and the date of phenological events such as budburst, leafout, and flowering, and positive values of FSI indicate risk situations.
Vitasse et al. (2018) evaluated the FSI of tree species in Switzerland and revealed that the frost risk increased at higher elevations and remained the same at lower elevations from 1975-2016. The use of FSI is a reasonable approach that accounts for both meteorological and phenological aspects. However, FSI depends on the date when a certain percentage of a population reaches the stage of budburst, leafout, and flowering, and thus ignores temporal changes in the percentage of phenological events in the population. As the percentage increases with time (i.e., the number of buds, leaves, and flowers that have lost cold hardiness increases), the potential frost risk and resulting agricultural losses probably increase. Thus, considering the changes in the percentage of phenological events can lead to a more reliable assessment of frost risk.
Phenological events are often estimated using an empirical model because of limited data on observed phenology, and many models have been developed to estimate phenological development in crops (e.g., Horie and Nakagawa, 1990, Nakagawa and Horie, 1995 and Yin et al., 1997 in rice; Weir et al., 1984, Maruyama et al., 2010 and Kawakita et al., 2020 in wheat; Williams et al., 1985, Caffarra
OpenAccess
Received; February 2, 2021 Accepted; June 7, 2021 †Corresponding author: [email protected] DOI: 10.2480/agrmet.D-21-00011
© Author (s) 2021.This is an open access article under the CC BY 4.0 license.

- 225-
K. Kimura et al. : Spatiotemporal distribution of frost risk
and Eccel, 2010 and Sugiura et al., 2019 in grapes). Conventional phenological models of budburst, leafout, and flowering, which are required for the assessment of frost risk, are mainly divided into two types: one-phase models (e.g., Cannell and Smith, 1983; Chuine and Cour, 1999), considering the ecodormancy processes affected by forcing temperatures in spring, and two-phase models (e.g., Richardson et al., 1974; Chuine, 2000), which consider endodormancy processes affected by chilling temperatures from autumn to winter as well as the ecodormancy processes. These models generally predict the dates of phenological events (not the percentages), and require some modification to evaluate the changes in the percentage of phenological events.
Tea plants (Camellia sinensis (L.) O. Kuntze), one of the most important economic crops around the world, have been seriously damaged by recent frost, leading to huge economic losses as mentioned above. Given the critical importance of assessing frost risk under current warming climate trends, some researchers have considered minimum temperatures in their investigation of the frost risk in tea fields (e.g., Li et al., 2018), and a model to predict phenology of tea buds (cold acclimation and deacclimation) has been developed (Kimura et al., 2021). However, frost risk in terms of both meteorology and phenology, remains unclear in tea plants. Tea plants are cultivated in a wide range of regions, from plains to mountains, and frost risks vary in space and time at different scales in different species (Bennie et al., 2010; Vitasse et al., 2018). Thus, the spatial variability of frost risk should be assessed in terms of reasonable strategies for the application of frost protection (e.g., frost protective fan, Kimura et al., 2017; and sprinkler, Suzuki et al., 1993) across a wide range of regions and for a long period under future warming climate.
The objectives of this study were 1) to develop a new index for the potential frost risk based on changes in the percentage of phenological events and in daily minimum temperature, 2) to model the changes in percentage of the phenological event (in this study, budburst in tea plants), and 3) to assess the spatiotemporal distribution of the potential frost risk in tea fields using the developed index and the model over the period 1981-2020 on a regional scale.
2. Materials and methods
2.1 Study areaA 60 km×60 km area located in east Japan from 35.78°
to 36.25°N latitude and 138.92° to 139.63°E longitude was selected (Fig. 1a, b) to assess the spatiotemporal distribution of the potential frost risk. In this area, elevation ranges from 0 to 1,300 m (Fig. 1b), and tea plants are widely cultivated from plains to mountains (Omata, 2008). Representative points (P1-P4 in Fig. 1b) near automated meteorological data acquisition systems (AMEDAS) were selected to compare long-term trends in the potential frost risk at different elevations. The study area is the northern limit of economical tea production in Japan and has a humid subtropical climate. According to averaged records of AMEDAS stations within the area (17 stations) from 1981-2019, an annual mean temperature of 14.2 °C and an annual mean precipitation of 1,427 mm have been recorded in the area.
2.2 Evaluating potential frost riskWe developed a new index for the potential frost risk during
the growing season (Frisk) under the assumption that a higher percentage of a phenological event in a population results in a larger risk of frost damage under the same temperature. This assumption was based on the finding that cold hardiness tended to decrease gradually during bud development in tea plants (Yanase, 1972) and other tree species (Lenz et al., 2013). Using this assumption, Frisk can be defined as the accumulation of frost risk at a given date t (Frisk,t), which is expressed by thermal time (the daily minimum air temperature [Tmin,t] below the threshold value [Tfrost]) weighted by the percentage of budburst (Pbud,t).
De
Frisk = ∑ Frisk,t (1) t = Ds
Frisk,t = (Tfrost-Tmin,t)×Pbud,t /100 (Tmin,t<Tfrost)(2)
Frisk,t = 0 (Tmin,t ≥ Tfrost)
Fig. 1. (a) Schematics of the geographic location of the study area (b) and map of the digital elevation model (DEM) of the study area. The representative points (P1-P4) near the automatic weather stations and the observation point of budburst (Saitama Tea Research Institute) are indicated on the DEM map.

Journal of Agricultural Meteorology 77 (4), 2021
- 226-
The Frisk,t shows positive values (i.e., risk situations) only if Tmin,t is below Tfrost and Pbud,t is above 0% (i.e., budburst conditions). The calculation of Eq. (1) began when budburst definitely did not occur (Ds = 1 in day of year) within the study area and continued until Tmin was definitely not below Tfrost (De = 150 in day of year) within the study area. In this study, Tfrost was set at 3 °C, where frost protection (e.g., frost protective fans) is conventionally required in tea fields (Araki et al., 2010).
2.3 Modeling percentage of budburstFor modeling Pbud, the phenological cycle for tea budburst is
divided into three phases: endodormancy from autumn to winter, ecodormancy from winter to spring, and initial budburst and subsequent increase of Pbud (Fig. 2).
Endodormancy, which coincides with the cold acclimation of buds, was assumed to be induced by decreasing temperature and released by fulfilling the chilling requirement or increasing the photoperiod (Charrier et al., 2011; Laube et al., 2014; Du et al., 2019). Chilling requirement at a given date t (CRt) was based on the cold acclimation model imitating cold stress memory in plants (Kimura et al., 2021), which was expressed as accumulation of thermal time (daily average air temperature [Tave] below the threshold value [Tac] corresponding to the temperature when endodormancy starts in autumn) weighted by a forgetting curve:
t kCRt = ∑ (Tave,n-Tac)× (3) n = endo {log (t-n+1)}c+k
where k and c are the parameters of the forgetting curve, and endo is the date when endodormancy starts. The forgetting curve shows
values from 0 to 1, and the values are highest on the latest day, decreasing gradually as the number of days decreases (Fig. 2). Thus, Eq. (3) shows that the thermal time in the latter days (n close to t) strongly contributes to cold acclimation and that in the former days (n close to endo), it does not (Kimura et al., 2021). The calculation of Eq. (3) began when Tave first fell below Tac in autumn within the study area. When CRt reached the critical value (CRcrit), endodormancy was released and the ecodormancy phase started. If the chilling requirement did not reach CRcrit, the critical daylength (DLcrit) offset insufficient chilling, and the ecodormancy phase started (Kimura et al., 2021).
Ecodormancy, which coincides with cold deacclimation of buds, was assumed to be driven by competition between chilling and forcing requirements (Chuine, 2000) at a given date t (CFt) as modeled by (Kimura et al., 2021):
CFt = CRt + FRt (4)
t
FRt = ∑ (Tave,n-Tde) (5) n = eco
where FRt is the forcing requirement at a given date t, which was calculated by the thermal time above the threshold temperature (Tde), and eco is the date when ecodormancy starts. The calculation of Eq. (5) began when the ecodormancy phase started. Ecodormancy was released when CFt reached the critical value (CFcrit), and when the initial budburst occurred (i.e., Pbud was first above 0%).
After the initial budburst, Pbud increased in response to warm temperatures, so that the daily change in Pbud was modeled by:
Fig. 2. Modeling of the percentage of budburst (Pbud), divided into three phases: endodormancy, ecodormancy, and increase in Pbud. Details of equations and model parameters are described in section 2.3 and Table 1.

- 227-
K. Kimura et al. : Spatiotemporal distribution of frost risk
1Pbud,t = Pbud,t-1+ (6) 1+exp{a (Tave,t-T50)}
where a is the parameter of the temperature response curve for Pbud, and T50 is the temperature where Pbud increased by 50 percentage points (pp.) in a day. The calculation of Eq. (6) continued until Pbud reached 100% and Pbud remained constant at 100%.
2.4 Model parameterization and validationFor parameterization and validation of the model, Pbud was
observed in a tea field located in Saitama, Japan (Saitama Tea Research Institute; 35°4829″N, 139°2052″E, 148 m a.m.s.l., Fig. 1b). The observation was conducted for the cultivar Yabukita, which is widely cultivated in Japan, from mid-April to late-May for 15 years (2006-2020), at intervals of ~5 d. Budburst was defined as when the length of the new bud enveloped by leaves was twice as long as these leaves (The annual scientific conference of tea, 1986), and Pbud was calculated as the ratio between the number of budbursts and the number of non-bursting buds (n = ~100 leaves).
The model parameters were assessed by minimization of the root mean square error (RMSE) between the estimated and observed values of Pbud for 15 years. For the parameterization, the differential evolution algorithm was applied using the ‘DEoptim’ R package (version 2.2-5), as proposed by Mullen et al. (2011). A two-fold cross validation was conducted. The dataset for 15 years was randomly partitioned into two sets (d1 for 8 years and d2 for 7 years), then the model was parameterized on d1 and validated on d2, followed by parameterizing on d2 and validating on d1.
To reduce model complexity, three parameters (Tac, Tde, and c) were fixed at the values established by Kimura et al. (2021) from 10 years of observed cold-hardiness data from the same cultivar Yabukita. These fixed parameters were determined on the basis of the Akaike information criterion (AIC; Akaike, 1974), which can consider both model accuracy and complexity. Among various combinations of fixed and fitted parameters, the combination was chosen wherein AIC showed the smallest value (i.e., the combination in which Tac, Tde, and c were fixed, and other parameters were fitted). The optimized parameters were determined using all data for 15 years (Table 1).
To calculate Pbud and Frisk, meteorological data of Tmin and Tave during 1981-2020 within the study area were obtained from the Agrometeorological Grid Square Data (AMGSD; Ohno et al., 2016). The AMGSD provides 1 km2-gridded data of Tmin and
Tave using spatial interpolation among the observed values at AMEDAS located at intervals of ~20 km in Japan and corrects for the differences in temperature due to elevation. These data were used to study the effects of climate change on crops (e.g., Nakano et al., 2017; Fukui et al., 2019). Photoperiods were calculated using the day of the year, sun position, and latitude in each grid.
2.5 Spatiotemporal analysis of potential frost riskThe values of Pbud, ΣTmin (accumulated Tmin below Tfrost
[3 °C] after initial budburst), and Frisk from 1981-2020 were assessed in each grid of AMGSD within the study area. The significance of trends in Pbud, ΣTmin, and Frisk from 1981-2020 were determined using non-parametric Mann-Kendall tests at 5% significance level (Kendall, 1975), and then Sen’s slope (Sen, 1968), which represents the degree of trends, was assessed in the grids wherein significant trends were found. The grids wherein Tmin was below -15 °C in winter were removed from the trend analysis because the maximum cold tolerance in Yabukita is around -15 °C in midwinter (Kimura et al., 2021).
3. Results
3.1 Model validationSeasonal changes in Tave, which is the input variable of the
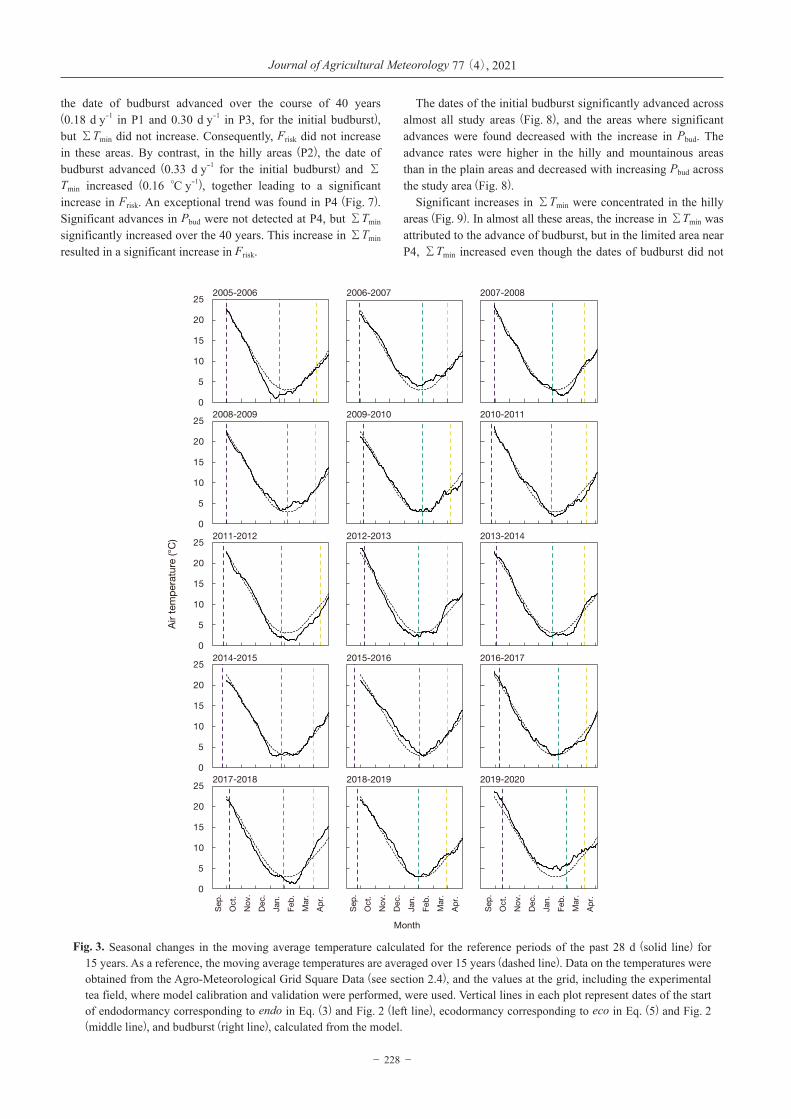
model of Pbud, showed different patterns over 15 years (Fig. 3). In 2011-2012, Tave represented the coldest winter and spring, and, in contrast, 2019-2020 represented the warmest winter and spring. In 2012-2013 and 2017-2018, the changes in Tave showed an alternative pattern, that is, colder autumn-winter and warmer spring.
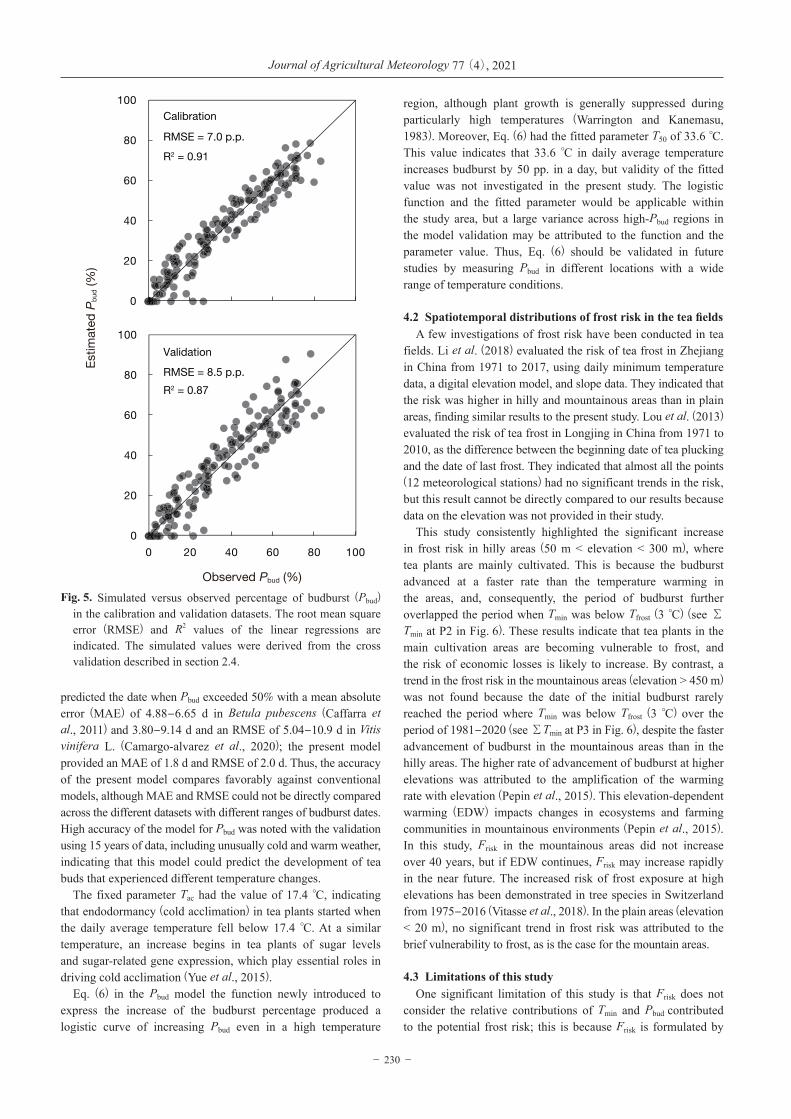
These different changes in Tave resulted in different durations of endodormancy and ecodormancy (Fig. 3) and large variations of Pbud (Fig. 4) in the model simulation. Except for the initial budburst in 2007, the present model of Pbud successfully captured the observed variations of Pbud for 15 years (Fig. 4), even when tea buds were exposed to both colder and warmer climates. The error variance in the validation dataset was higher in the high Pbud region. Overall, the observed variation of Pbud explained 91% and 87% of the predicted variation of Pbud for the calibration and validation datasets, respectively, and the accuracy of the model was less than 10%. (root mean square error [RMSE] = 7.0 pp. in calibration and 8.5 pp. in validation) (Fig. 5).
3.2 Spatiotemporal distributions of budburst, minimum temperature, and potential frost risk
Trends in Pbud, ΣTmin, and Frisk were divided into two types of patterns (Fig. 6). In the plain (P1) and mountain (P3) areas,
Table 1. Parameters used to model the percentage of budburst.Parameter Description Value Unit Source
Tac Threshold temperature effective to endodormancy (cold acclimation) 17.4 °C Fixed (Kimura et al., 2021)k Parameter of the forgetting curve 6.0 Dimensionless Fitting (this study)c Parameter of the forgetting curve 3.4 Dimensionless Fixed (Kimura et al., 2021)Tde Threshold temperature effective to ecodormancy (deacclimation) -4.0 °C Fixed (Kimura et al., 2021)CRcrit Critical chilling requirement that tea buds are ready for ecodormancy -472.5 °C day Fitting (this study)DLcrit Critical daylength in which ecodormancy starts 11.3 hour Fitting (this study)CFcrit Critical thermal time that budburst starts -46.0 °C day Fitting (this study)a Parameter of temperature response curve for percentage of budburst -0.15 Dimensionless Fitting (this study)T50 Temperature where percentage of budburst increases by 50 pp. in a day 33.6 °C Fitting (this study)
Journal of Agricultural Meteorology 77 (4), 2021
- 228-
the date of budburst advanced over the course of 40 years (0.18 d y-1 in P1 and 0.30 d y-1 in P3, for the initial budburst), but ΣTmin did not increase. Consequently, Frisk did not increase in these areas. By contrast, in the hilly areas (P2), the date of budburst advanced (0.33 d y-1 for the initial budburst) and ΣTmin increased (0.16 °C y-1), together leading to a significant increase in Frisk. An exceptional trend was found in P4 (Fig. 7). Significant advances in Pbud were not detected at P4, but ΣTmin significantly increased over the 40 years. This increase in ΣTmin resulted in a significant increase in Frisk.
The dates of the initial budburst significantly advanced across almost all study areas (Fig. 8), and the areas where significant advances were found decreased with the increase in Pbud. The advance rates were higher in the hilly and mountainous areas than in the plain areas and decreased with increasing Pbud across the study area (Fig. 8).
Significant increases in ΣTmin were concentrated in the hilly areas (Fig. 9). In almost all these areas, the increase in ΣTmin was attributed to the advance of budburst, but in the limited area near P4, ΣTmin increased even though the dates of budburst did not
Fig. 3. Seasonal changes in the moving average temperature calculated for the reference periods of the past 28 d (solid line) for 15 years. As a reference, the moving average temperatures are averaged over 15 years (dashed line). Data on the temperatures were obtained from the Agro-Meteorological Grid Square Data (see section 2.4), and the values at the grid, including the experimental tea field, where model calibration and validation were performed, were used. Vertical lines in each plot represent dates of the start of endodormancy corresponding to endo in Eq. (3) and Fig. 2 (left line), ecodormancy corresponding to eco in Eq. (5) and Fig. 2 (middle line), and budburst (right line), calculated from the model.

- 229-
K. Kimura et al. : Spatiotemporal distribution of frost risk
advance. The spatial distribution of the trend in Frisk approximated that of ΣTmin (Fig. 8), with slight differences because ΣTmin was biased by Pbud for evaluating Frisk. Overall, the significant increase in Frisk was concentrated at elevations ranging from 50 m to 300 m within the study area (Table 2). These elevations corresponded to hilly areas where tea plants were mainly cultivated.
4. Discussion
4.1 Evaluation of Frisk and Pbud modelTo date, potential frost risk has often been evaluated by
comparing dates between the last freeze and budburst (Marino et al., 2011), as mentioned earlier. However, to assess frost risk, the period between initial budburst and full leafout (the period of vulnerability to frost) should be considered as well as the date of
budburst (Chamberlain et al., 2019). Thus, Frisk was formulated in this study by introducing the thermal time (Tmin below Tfrost) weighted by Pbud. To our knowledge, this study is the first to consider the impact of the changes in budburst percentage on frost risk. The Frisk calculation assumed that higher Pbud in a population has a larger frost risk; this assumption could be suitable because cold hardiness tends to decrease gradually during bud development in tea plants (Yanase, 1972) and in the other tree species (Lenz et al., 2013).
There have been many models for predicting the dates of phenological events (e.g., Chuine, 2000; Caffarra et al., 2011); however, to our knowledge, there is no published model for predicting Pbud with consideration to endodormancy and ecodormancy phases. Conventional models of budburst have
Fig. 4. Time courses in the percentage of budburst (Pbud) over 15 years in the experimental tea field. Observed values are shown as black circles, and simulated values are shown as broken (calibration dataset) and solid (validation dataset) lines, which were derived from the cross validation described in section 2.4.
Journal of Agricultural Meteorology 77 (4), 2021
- 230-
predicted the date when Pbud exceeded 50% with a mean absolute error (MAE) of 4.88-6.65 d in Betula pubescens (Caffarra et al., 2011) and 3.80-9.14 d and an RMSE of 5.04-10.9 d in Vitis vinifera L. (Camargo-alvarez et al., 2020); the present model provided an MAE of 1.8 d and RMSE of 2.0 d. Thus, the accuracy of the present model compares favorably against conventional models, although MAE and RMSE could not be directly compared across the different datasets with different ranges of budburst dates. High accuracy of the model for Pbud was noted with the validation using 15 years of data, including unusually cold and warm weather, indicating that this model could predict the development of tea buds that experienced different temperature changes.
The fixed parameter Tac had the value of 17.4 °C, indicating that endodormancy (cold acclimation) in tea plants started when the daily average temperature fell below 17.4 °C. At a similar temperature, an increase begins in tea plants of sugar levels and sugar-related gene expression, which play essential roles in driving cold acclimation (Yue et al., 2015).
Eq. (6) in the Pbud model the function newly introduced to express the increase of the budburst percentage produced a logistic curve of increasing Pbud even in a high temperature
region, although plant growth is generally suppressed during particularly high temperatures (Warrington and Kanemasu, 1983). Moreover, Eq. (6) had the fitted parameter T50 of 33.6 °C. This value indicates that 33.6 °C in daily average temperature increases budburst by 50 pp. in a day, but validity of the fitted value was not investigated in the present study. The logistic function and the fitted parameter would be applicable within the study area, but a large variance across high-Pbud regions in the model validation may be attributed to the function and the parameter value. Thus, Eq. (6) should be validated in future studies by measuring Pbud in different locations with a wide range of temperature conditions.
4.2 Spatiotemporal distributions of frost risk in the tea fieldsA few investigations of frost risk have been conducted in tea
fields. Li et al. (2018) evaluated the risk of tea frost in Zhejiang in China from 1971 to 2017, using daily minimum temperature data, a digital elevation model, and slope data. They indicated that the risk was higher in hilly and mountainous areas than in plain areas, finding similar results to the present study. Lou et al. (2013) evaluated the risk of tea frost in Longjing in China from 1971 to 2010, as the difference between the beginning date of tea plucking and the date of last frost. They indicated that almost all the points (12 meteorological stations) had no significant trends in the risk, but this result cannot be directly compared to our results because data on the elevation was not provided in their study.
This study consistently highlighted the significant increase in frost risk in hilly areas (50 m < elevation < 300 m), where tea plants are mainly cultivated. This is because the budburst advanced at a faster rate than the temperature warming in the areas, and, consequently, the period of budburst further overlapped the period when Tmin was below Tfrost (3 °C) (see ΣTmin at P2 in Fig. 6). These results indicate that tea plants in the main cultivation areas are becoming vulnerable to frost, and the risk of economic losses is likely to increase. By contrast, a trend in the frost risk in the mountainous areas (elevation > 450 m) was not found because the date of the initial budburst rarely reached the period where Tmin was below Tfrost (3 °C) over the period of 1981-2020 (see ΣTmin at P3 in Fig. 6), despite the faster advancement of budburst in the mountainous areas than in the hilly areas. The higher rate of advancement of budburst at higher elevations was attributed to the amplification of the warming rate with elevation (Pepin et al., 2015). This elevation-dependent warming (EDW) impacts changes in ecosystems and farming communities in mountainous environments (Pepin et al., 2015). In this study, Frisk in the mountainous areas did not increase over 40 years, but if EDW continues, Frisk may increase rapidly in the near future. The increased risk of frost exposure at high elevations has been demonstrated in tree species in Switzerland from 1975-2016 (Vitasse et al., 2018). In the plain areas (elevation < 20 m), no significant trend in frost risk was attributed to the brief vulnerability to frost, as is the case for the mountain areas.
4.3 Limitations of this studyOne significant limitation of this study is that Frisk does not
consider the relative contributions of Tmin and Pbud contributed to the potential frost risk; this is because Frisk is formulated by
Fig. 5. Simulated versus observed percentage of budburst (Pbud) in the calibration and validation datasets. The root mean square error (RMSE) and R2 values of the linear regressions are indicated. The simulated values were derived from the cross validation described in section 2.4.

- 231-
K. Kimura et al. : Spatiotemporal distribution of frost risk
simple multiplication (Eq. 2). For a more reliable assessment of frost risk, the contribution of Tmin and Pbud should be explicitly quantified by measuring the actual frost damage.
In tea fields, frost protective fans are usually operated to prevent frost damage (Kimura et al, 2017). The frost protective fan mitigates temperature inversion on radiative frost nights and increases the surface temperature of tea plants, probably leading to some temperature difference between a meteorological station and an actual tea field. For more accurate evaluation of the spatiotemporal distributions of Frisk and Pbud, the temperatures in the actual tea field should be used. However, this is hampered by the necessity for sensor networks consisted of numerous accurately corrected thermometers.
The applicability of the bud model to different cultivars and other climate zones was unclear. Particularly, CRcrit and CFcrit, which are temperature requirements determining the transition of the phenological phases in the model, may vary with latitude even in the same species (McKown et al., 2018), under the influence of such other factors as precipitation and the resultant changes in soil moisture. To develop a more robust model and apply the model to wider regions, a set of data on the Pbud observed for different cultivars and in other climate zones is required.
The exceptional trend near P4 indicates that the period of vulnerability to frost increased despite the absence of a significant advance of budburst; that is, the minimum temperature decreased over the past few decades. This may perhaps be caused by changes in the local geographical effects of urbanization; land use near P4 has tended to urbanize over the past 15 years, according to the National Land Numerical Information provided by the Japanese Ministry of Land, Infrastructure, Transport, and Tourism.
Finer spatial resolutions of temperature are needed to more
Fig. 7. Trends in day of year (DOY) in which percentage of budburst (Pbud) exceeded 0% (initial budburst) and 50% and reached 100%, accumulated daily minimum temperature below 3 °C after the initial budburst (ΣTmin), and potential frost risk (Frisk) from 1981-2020 at the representative points P4. The location of P4 is described in Fig. 1. Linear lines represent Sen’s slopes with Mann-Kendall tests at 5% significance level, and data without lines show no trends at 5% significance level.
Fig. 6. Trends in day of year (DOY) in which percentage of budburst (Pbud) exceeded 0% (initial budburst) and 50% and reached 100%, accumulated daily minimum temperature below 3 °C after the initial budburst (ΣTmin), and potential frost risk (Frisk) from 1981-2020 at the representative points P1, P2, and P3. The locations of P1-P3 are described in Fig. 1. Linear lines represent Sen’s slopes with Mann-Kendall tests at 5% significance level, and data without lines show no trends at 5% significance level.

Journal of Agricultural Meteorology 77 (4), 2021
- 232-
meaningfully assess distributions of Frisk and Pbud. In the hilly and mountainous areas where the tea plants are usually cultivated, significant differences in temperature occur within a 1 km2 grid section, mainly due to cold air drainage on radiative frost nights (Chung et al., 2006), leading to a bias of Pbud within the grid. Chung et al. (2006) developed a minimum-temperature prediction model which considered cold air drainage and temperature inversion strength in complex terrain, using a digital elevation model. Moreover, Maclean et al. (2019) provided a method and an
R program to assess the spatially fine distribution of air temperature (resolution < 30 m), considering the local effects of cold air drainage and other microclimate conditions. These methods were
Fig. 8. Spatial distributions of Sen’s slope (degree of trend) of the day of year (DOY) in which percentage of budburst (Pbud) exceeds 0% (initial budburst) and 50% and reaches 100% from 1981-2020. Blank areas show no trends at 5% significance level using Mann-Kendall tests. The representative points (P1-P4) are indicated on the map.
Table 2. Sen’s slope (degree of trend) of potential frost risk (Frisk) during the period 1981-2020 at different elevations (50 m intervals). Standard deviation, SD.
Elevation (m) Sen’s slope of Frisk SD
0-49 1.6 0.6850-99 2.5 1.38
100-149 2.4 1.48150-199 3.0 1.10200-249 3.1 0.70250-299 2.3 0.57300-349 1.4 0.51350-399 0.6 0.24400-449 0.2 0.10
Fig. 9. Spatial distributions of Sen’s slope (degree of trend) of accumulated daily minimum temperature below 3 °C after the initial budburst (ΣTmin) and potential frost risk (Frisk), from 1981-2020. Blank areas show no trends at 5% significance level using Mann-Kendall tests. The representative points (P1-P4) are indicated on the map.

- 233-
K. Kimura et al. : Spatiotemporal distribution of frost risk
based on the calculation of airflow direction and accumulation within a study area, allowing the assessment of where cold air converges. The integration of these methods with the bud model could provide more meaningful assessments of frost risk.
Nevertheless, we believe that the new index of potential frost risk and the model of budburst percentage proposed in this study could improve the conventional assessment of frost risk and contribute to the development of reliable strategies for the application of frost protection under the effects of future climate change.
5. Concluding Remarks
A new index for potential frost risk, considering phenology and meteorology, was proposed using thermal time (minimum air temperature below the threshold value) weighted by the proportion of budburst. The proportion of budburst in tea plants was modeled, by formulating endodormancy, ecodormancy, and the subsequent increase of the number of budbursts. This model successfully predicted the proportion of budburst in tea plants over 15 years, with root mean square errors of 8.5 percentage points. Using the proposed index and the model, spatiotemporal distribution of frost risk in tea plants was evaluated in east Japan from 1981-2020. The distribution showed that frost risk increased over that period in hilly areas where tea plants are mainly cultivated. This result suggests an urgent need for improved frost protection in tea fields.
Acknowledgments
Data for percentage of budburst were observed and provided by the Saitama Tea Research Institute. This study was partly supported by the Japan Society for the Promotion of Science (JSPS) KAKENHI under grant number JP20K22605.
References
Akaike H, 1974: A new look at the statistical model identification. IEEE transactions on automatic control 19, 716-723. https://doi.org/10.1109/TAC.1974.1100705
Araki T, Matsuo K, Sumikawa O, 2010: Effects of use of frost protective fan on frost injury to tea plants in March 2010 at Makinohara, Shizuoka. Tea Research Journal (in Japanese) 110, 1-8. https://doi.org/10.5979/cha.2010.110_1
Augspurger CK, 2013: Reconstructing patterns of temperature, phenology, and frost damage over 124 years: Spring damage risk is increasing. Ecology 94, 41-50. https://doi.org/10.1890/12-0200.1
Bennie J, Kubin E, Wiltshire A et al., 2010: Predicting spatial and temporal patterns of bud-burst and spring frost risk in north-west Europe: The implications of local adaptation to climate. Global Change Biology 16, 1503-1514. https://doi.org/10.1111/j.1365-2486.2009.02095.x
Caffarra A, Eccel E, 2010: Increasing the robustness of phenological models for Vitis vinifera cv. Chardonnay. International Journal of Biometeorology 54, 255-267. https://doi.org/10.1007/s00484-009-0277-5
Caffarra A, Donnelly A, Chuine I, 2011: Modelling the timing of Betula pubescens budburst. II. Integrating complex effects of photoperiod into process-based models. Climate Research 46, 159-170. https://doi.org/10.3354/cr00983
Camargo-alvarez H, Salazar-gutiérrez M, Keller M et al., 2020: Modeling the effect of temperature on bud dormancy
of grapevines. Agricultural and Forest Meteorology 280, 107782. https://doi.org/10.1016/j.agrformet.2019.107782
Cannell MGR, Smith RI, 1983: Thermal time, chill days and prediction of budburst in Picea sitchensis. Journal of applied ecology 20, 951-963. https://doi.org/10.2307/2403139
Chamberlain CJ, Cook BI, García de Cortázar-Atauri I et al., 2019: Rethinking false spring risk. Global Change Biology 25, 2209-2220. https://doi.org/10.1111/gcb.14642
Charrier G, Bonhomme M, Lacointe A. et al., 2011: Are budburst dates, dormancy and cold acclimation in walnut trees (Juglans regia L.) under mainly genotypic or environmental control? International Journal of Biometeorology 55, 763-774. https://doi.org/10.1007/s00484-011-0470-1
China Tea Marketing Association, 2010: Production and sales analysis of China spring tea in 2010. China Tea 40, 6-7 (in Chinese).
Chuine I, Cour P, 1999: Climatic determinants of budburst seasonality in four temperate-zone tree species. New Phytologist 143, 339-349. https://doi.org/10.1046/j.1469-8137.1999.00445.x
Chuine I, 2000: A unified model for budburst of trees. Journal of Theoretical Biology 207, 337-347. https://doi.org/10.1006/jtbi.2000.2178
Chung U, Seo HH, Hwang KH et al., 2006. Minimum temperature mapping over complex terrain by estimating cold air accumulation potential. Agricultural and Forest Meteorology 137, 15-24. https://doi.org/10.1016/j.agrformet.2005.12.011
Du Y, Pan Y, Ma K, 2019: Moderate chilling requirement controls budburst for subtropical species in China. Agricultural and Forest Meteorology 278, 107693. https://doi.org/10.1016/j.agrformet.2019.107693
Easterling D, 2002: Recent Changes in Frost Days and the Frost-Free Season in the United States. Bulletin of the American Meteorological Society 83, 1327-1332. https://doi.org/10.1175/1520-0477-83.9.1327
Fukui S, Nishihara Y, Tamaki E et al., 2019: Estimating first-grade rice production due to high temperature after heading date utilizing the statistical data. Journal of Agricultural Meteorology 75, 217-224.
Gu L, Hanson PJ, Mac Post W et al., 2008: The 2007 eastern US spring freeze: increased cold damage in a warming world. BioScience 58, 253-262. https://doi.org/10.1641/B580311
Horie T, Nakagawa H, 1990: Modelling and prediction of developmental process in rice: I. Structure and method of parameter estimation of a model for simulating developmental process toward heading. Japanese Journal of Crop Science 59, 687-695 (in Japanese). https://doi.org/10.1626/jcs.59.687
Kawakita S, Ishikawa N, Takahashi H et al., 2020: Winter wheat phenological development model with a vernalization function using sigmoidal and exponential functions. Journal of Agricultural Meteorology 76, 81-88. https://doi.org/10.2480/agrmet.D-19-00042
Kendall M, 1975: Rank Correlation Methods, Charles Griffin, London.
Kimura K, Yasutake D, Nakazono K et al., 2017: Dynamic distribution of thermal effects of an oscillating frost protective fan in a tea field. Biosystems Engineering 164, 98-109. https://doi.org/10.1016/j.biosystemseng.2017.09.010
Kimura K, Yasutake D, Oki T et al., 2021: Dynamic modeling of cold hardiness in tea buds by imitating past temperature memory. Annals of Botany 127, 317-326. https://doi.org/10.1093/aob/mcaa197
Laube J, Sparks TH, Estrella N et al., 2014: Chilling outweighs

Journal of Agricultural Meteorology 77 (4), 2021
- 234-
photoperiod in preventing precocious spring development. Global Change Biology 20, 170-182. https://doi.org/10.1111/gcb.12360
Lenz A, Hoch G, Vitasse Y et al., 2013: European deciduous trees exhibit similar safety margins against damage by spring freeze events along elevational gradients. New Phytologist 200, 1166-1175. https://doi.org/10.1111/nph.12452
Li S, Wang Z, Huang J, 2018: Evaluation of tea frost risk in Zhejiang province based on GIS. In 7th International Conference on Agro‑geoinformatics. pp. 1-4. IEEE.
Lou W, Sun K, Sun S et al., 2013: Changes in pick beginning date and frost damage risk of tea tree in Longjing tea-producing area. Theoretical and applied climatology 114, 115-123. https://doi.org/10.1007/s00704-012-0825-5
Ma Q, Huang JG, Hänninen H et al., 2019: Divergent trends in the risk of spring frost damage to trees in Europe with recent warming. Global Change Biology 25, 351-360. https://doi.org/10.1111/gcb.14479
Maclean IMD, Mosedale JR, Bennie JJ, 2019. Microclima: An r package for modelling meso- and microclimate. Methods in Ecology and Evolution 10, 280-290. https://doi.org/10.1111/2041-210X.13093
Marino GP, Kaiser DP, Gu L et al., 2011: Reconstruction of false spring occurrences over the southeastern United States, 1901-2007: An increasing risk of spring freeze damage? Environmental Research Letters 6. https://doi.org/10.1088/1748-9326/6/2/024015
Maruyama A, Kurose Y, Ohba K, 2010: Modeling of phenological development in winter wheat to estimate the timing of heading and maturity based on daily mean air temperature and photoperiod. Journal of Agricultural Meteorology 66, 41-50. https://doi.org/10.2480/agrmet.66.1.7
Matsuo K, Araki T, Okamoto T, 2010: Field survey of tea bush surface temperature and typical cases in severe frost damage on March 30, 2010 on the Makinohara plateau in Shizuoka prefecture. Tea Research Journal (in Japanese) 110, 65-73. https://doi.org/10.5979/cha.2010.110_65
McKown AD, Klápště J, Guy RD et al., 2018: Ecological genomics of variation in bud-break phenology and mechanisms of response to climate warming in Populus trichocarpa. New Phytologist 220, 300-316. https://doi.org/10.1111/nph.15273
Mullen K, Ardia D, Gil DL et al., 2011: DEoptim: An R package for global optimization by differential evolution. Journal of Statistical Software 40, 18926. https://doi.org/10.18637/jss.v040.i06
Nakagawa H, Horie T, 1995: Modelling and prediction of developmental process in rice: II. A model for simulating panicle development based on daily photoperiod and temperature. Japanese Journal of Crop Science 64, 33-42 (in Japanese). https://doi.org/10.1626/jcs.64.33
Nakano S, Ohno H, Shimada S, 2017: Estimation of the drought vulnerability of soybeans by using a phenological development model and gridded meteorological data in Japan. Climate in Biosphere 17, 55-63. https://doi.org/10.2480/cib.J-17-035
Ohno H, Sasaki K, Ohara G et al., 2016: Development of grid square air temperature and precipitation data compiled from observed, forecasted, and climatic normal data. Climate in Biosphere 16, 71-79 (in Japanese with English abstract). https://doi.org/10.2480/cib.J-16-028
Omata R, 2008: On-site demonstration of tea IPM system in Saitama Prefecture. Syokubutsu Boueki [Plant protection] (in Japanese) 62, 26-30.
Parmesan C, Yohe G, 2003. A globally coherent fingerprint of
climate change impacts across natural systems. Nature 421, 37-42. https://doi.org/10.1038/nature01286
Pepin N, Bradley RS, Diaz HF et al., 2015: Elevation-dependent warming in mountain regions of the world. Nature Climate Change 5, 424-430. https://doi.org/10.1038/nclimate2563
Richardson EA, Seeley SD, Walker DR, 1974: A model for estimating the completion of rest for ‘Redhaven’ and ‘Elberta’ peach trees. HortScience 9, 331-332.
Robeson SM, 2002: Increasing growing-season length in Illinois during the 20th century. Climatic Change 52, 219-238. https://doi.org/10.1023/A:1013088011223
Schwartz MD, Ahas R, Aasa A, 2006: Onset of spring starting earlier across the Northern Hemisphere. Global Change Biology 12, 343-351. https://doi.org/10.1111/j.1365-2486.2005.01097.x
Sen PK, 1968: Estimates of the regression coefficient based on Kendall's tau. Journal of the American Statistical Association 63, 1379-1389. https://doi.org/10.1080/01621459.1968.10480934
Snyder RL, de Melo-Abreu JP, Matulich S, 2005: Frost protection: fundamentals, practice and economics. Volume 2. Environment and Natural Resources Series̶Food and Agriculture Organization of the United Nations, No. 10. Roma: FAO.
Sugiura T, Shiraishi M, Konno S et al., 2019: Assessment of deterioration in skin color of table grape berries due to climate change and effects of two adaptation measures. Journal of Agricultural Meteorology 75, 67-75. https://doi.org/10.2480/agrmet.D-18-00032
Suzuki Y, Hayakawa S, Hiiragi H, 1993: Agro-meteorological analysis and methods of protection against frost damage. Journal of Agricultural Meteorology 48, 671-674. https://doi.org/10.2480/agrmet.48.671
The annual scientific conference of tea, 1986: Method of survey and terminology used in tea culture investigations (revised edition). Tea Research Journal 64, 55-80 (in Japanese). https://doi.org/10.5979/cha.1986.64_55
Vitasse Y, Schneider L, Rixen C et al., 2018: Increase in the risk of exposure of forest and fruit trees to spring frosts at higher elevations in Switzerland over the last four decades. Agricultural and Forest Meteorology 248, 60-69. https://doi.org/10.1016/j.agrformet.2017.09.005
Warrington IJ, Kanemasu ET, 1983: Corn Growth Response to Temperature and Photoperiod I. Seedling Emergence, Tassel Initiation, and Anthesis. Agronomy journal 75, 749-754. https://doi.org/10.2134/agronj1983.00021962007500050008x
Weir AH, Bragg PL, Porter JR et al., 1984: A winter-wheat crop simulation-model without water or nutrient limitations. The Journal of Agricultural Science 102, 371-382. https://doi.org/10.1017/S0021859600042702
Williams DW, Andris HL, Beede RH et al., 1985: Validation of a model for the growth and development of the Thompson Seedless grapevine. II. Phenology. American Journal of Enology and Viticulture 36, 283-289.
Yanase Y, 1972: Dormancy and cold stress tolerance of tea shoots in winter time, Proceeding of Japanese Society of Plant Physiologist 13, 96-97.
Yin X, Kropff MJ, Horie T et al., 1997: A model for photothermal responses of flowering in rice I. Model description and parameterization. Field Crops Research 51, 189-200. https://doi.org/10.1016/S0378-4290(96)03456-9
Yue C, Cao HL, Wang L et al., 2015: Effects of cold acclimation on sugar metabolism and sugar-related gene expression in tea plant during the winter season. Plant Molecular Biology 88, 591-608. https://doi.org/10.1007/s11103-015-0345-7