Embed Size (px)
Citation preview

574 J. Opt. Soc. Am. B/Vol. 19, No. 3 /March 2002 Cambournac et al.
Spatiotemporal behavior of periodic arrays ofspatial solitons in a planar
waveguide with relaxing Kerr nonlinearity
Cyril Cambournac, Herve Maillotte, Eric Lantz, John M. Dudley, and Mathieu Chauvet
Laboratoire d’Optique P. M. Duffieux, Unite Mixte 6603, Centre National de Recherche Scientifique/Universite deFranche-Comte, Institut des Microtechniques de Franche-Comte, 16, Route de Gray, 25030 Besancon Cedex,
France
Received May 25, 2001; revised manuscript received September 7, 2001
We report picosecond pulsed experiments and numerical simulations of spatially induced modulational insta-bility, which we used to form stable periodic arrays of bright soliton beams in a planar Kerr-like CS2 wave-guide. We have found that the generation stage of these arrays is accurately described by the usual nonlinearSchrodinger wave equation, whereas the temporal dynamics of the nonlinearity is beneficial for subsequentstable propagation of the soliton arrays. In the picosecond regime the finite molecular relaxation time of thereorientational nonlinear index inhibits the Fermi–Pasta–Ulam recurrence predicted for an instantaneousKerr nonlinearity. Moreover, the inhibition is associated with a novel spatiotemporal dynamics confirmed bynumeric and streak-camera recordings. © 2002 Optical Society of America
OCIS codes: 190.3270, 190.4420, 190.5530, 190.3100.
1. INTRODUCTIONExtensive theoretical and experimental research on thepropagation of single spatial solitons, soliton-inducedwaveguides, and twin-soliton interactions in bulk orguided configurations with different kinds of nonlinearitywas performed in the past decade. For example, numer-ous studies were performed with planar waveguides andoptical Kerr nonlinearity,1,2 as it is well known that Kerrsolitons can be stable only in a (1 1 1)-D geometry.3,4 Ina Kerr medium the nonlinear Schrodinger equation(NLSE) governs the propagation of spatial and temporalsolitons as well as modulational instability (MI),5–7 i.e.,the parametric amplification of weak spatial (temporal)transverse perturbations (e.g., from noise) or periodicmodulations of an intense homogeneous plane (monochro-matic) wave in a nonlinear diffractive (dispersive) me-dium. In bulk nonsaturating Kerr media, MI is respon-sible for random filamentation of beams8 and solitonstripes9 unless interferometric control10–13 or spatialdecoherence14 is used to reduce the spatial dimensionalityof the propagation or to avoid MI. Conversely, MI be-comes controllable along space or time in a (1 1 1)-Dpropagating geometry (i.e., a single-mode slab waveguideor an optical fiber). The exponential growth of spatial ortemporal frequency sidebands may lead to the spontane-ous breakup of the input field along the transverse homo-geneous free coordinate into periodic arrays of solitonlikebeams or solitonlike pulse trains.6 This property has en-couraged intensive research with fibers,15–17 including fi-ber resonators for which the soliton trains are found to bestable,18–21 to implement ultrahigh-repetition-ratesources for high-capacity optical communication systems.In the spatial domain, however, only a few experimentswith noise-driven or induced MI-generating quasi-solitonarrays have been performed to date; they used bulk
0740-3224/2002/030574-12$15.00 ©
Kerr11,12 and photorefractive22,23 media, cascading nonlin-earities in quadratic crystals,24 or planar waveguides.25
By 1985 Akhmediev et al. had found an analytical solu-tion to the MI of a (1 1 1)-D plane wave (in space ortime) in a cavityless Kerr medium.26,27 After a givenpropagation length, a sinusoidally modulated input fieldevolves toward a periodic array of bright peaks (for posi-tive nonlinear index) whose individual transverse inten-sity profiles are quasi-sech2. Nevertheless, the presenceof remaining nonzero background intensity and a phasechirp across each peak makes the further propagatingquasi-soliton array evolve back almost to the initial sinu-soidally modulated field. This periodic phenomenon,known as the Fermi–Pasta–Ulam (FPU) recurrence inother fields of physics, is obviously detrimental to the sta-bility of high-repetition-rate solitonlike pulse trains in thesingle-pass regime or in light-guiding-light applicationsutilizing MI-induced multiple soliton waveguides.
In the specific case of a fully sinusoidally modulated in-put field (i.e., with maximum contrast), similar periodicreshaping of the pulse envelope into an array of dark soli-tonlike pulses28 or periodic evolution of sideband power29
was experimentally demonstrated for nonlinear propaga-tion in a fiber. It was also shown that in such an excita-tion condition the periodic disappearance of the soliton ar-rays could be overcome through adiabatic amplification ordispersion during propagation.30,31 Similarly in the spa-tial domain, though their stability during propagation hasnot been clearly demonstrated, periodic arrays of clean,unchirped dark spatial solitons were generated throughreshaping of a fully sinusoidally modulated input patternin a defocusing Kerr-like medium in a regime of adiabaticamplification during propagation.32 But, owing to theunity contrast of the initial modulation, conditions for MIwere not met in these dual-frequency experiments. In
2002 Optical Society of America

Cambournac et al. Vol. 19, No. 3 /March 2002/J. Opt. Soc. Am. B 575
nonlinear optics it was only recently that FPU recurrencewas demonstrated experimentally by Van Simaeys et al.in an optical fiber in a quasi-steady-state MI regime.33
An experimental demonstration of FPU recurrence re-mains to be made in the spatial domain. Previously citedexperiments11,12,22–25 in the spatial domain did not showwhether the MI-generated solitonlike arrays are stableduring propagation (except in Ref. 12, where the observedabsence of periodic recurrence was incompletely ex-plained).
This paper is devoted to a numerical and experimentalstudy of the spatiotemporal dynamics of (1 1 1)-D spa-tially induced MI in a positive Kerr-type planar CS2waveguide under picosecond excitation. After brieflysummarizing the well-known basic properties of MI in a(1 1 1)-D ideal Kerr medium under cw excitation, wepresent the first experimental demonstration, to the bestof our knowledge, of an extended periodic array of brightsoliton beams in a planar waveguide. Then, accountingfor the peculiarities of the excitation geometry and thepulsed regime, we describe numerical simulations of theNLSE in an ideal Kerr medium and show that the gen-eration step of the array is in good quantitative agree-ment with our experiments. After it has been formed,however, such an array experiences stable propagation inthe picosecond regime, in apparent contradiction of thepredictions of the NLSE. We show that the periodic re-currence is inhibited, as a result of the finite molecular re-laxation time of the reorientational Kerr response in CS2that couples successive temporal slices of the pulse enve-lope. Moreover, time-integrated images at powers abovethe soliton array formation threshold reveal an unusualspatial-frequency doubling behavior that is associatedwith a novel spatiotemporal dynamics, as evidenced nu-merically and by streak-camera recordings.
2. MODULATIONAL INSTABILITY IN APLANAR KERR WAVEGUIDEWe briefly review in this Section the basic features of (11 1)-D steady-state MI (i.e., quasi-cw excitation with re-spect to the material response and relaxation times) in astep-index planar waveguide that exhibits ideal (local andinstantaneous) Kerr nonlinearity. The material is as-sumed to be dispersionless and lossless, as the propaga-tion distances are typically a few centimeters. Theintensity-dependent refractive index of the guiding layeris defined by
n~x, y ! 5 n0~ y ! 1 n2I~x, y !, (1)
where n0( y) is the linear refractive-index profile, n2 isthe nonlinear Kerr index, and I(x, y) 5 (1/2)ce0n0uEu2 isthe local power density in watts per square meter. As-suming that the nonlinearity is weak (n2I ! n0 5 1.64for CS2 at l0 5 0.532 mm) and hence that nonlinear modecoupling is negligible enables us to separate the scalartransverse field c (x, y) into two distinct fields, such thatE(x, y, z, t) 5 cL( y)cNL(x, z)exp(ibz 2 ivt). cL is aproperly normalized profile of the linear TE0 guided modewith propagation constant b, whereas cNL is the field infree transverse dimension x, subject to both diffractionand the optical Kerr effect.34 Propagation of the slowly
varying field cNL [ c (x, z) is thus well approximated bythe usual (1 1 1)-D NLSE:
i]c
]z1
1
2b
]2c
]x2 11
2ce0n0gu cu2c 5 0, (2)
where g is the nonlinear coefficient along x. Given thelinear modal properties of our waveguide (effective index,neff ' n0 ; effective thickness, deff ' d, i.e., the thicknessof the waveguide) described in Section 3 below, we takeb ' 2pn0 /l0 and g 5 2pn2 /l0 . 4.1 3 10211 m/W,with l0 5 0.532 mm and assuming that n2 5 13.53 10218 m2/W for CS2 .
The linear stability analysis of the perturbationr0 exp@2i(Vx 2 Kz)# of a spatially homogeneous inputfield c0 5 c (x, 0) (u c0u @ ur0u) yields the well-known MIgrowth rate5
d [ iK 5 ImFVS V2
4b2 2n2I0
n0D 1/2G (3)
for the spatial frequencies 0 , uVu , Vc5 2b(n2I0 /n0)1/2 with a maximum spatial growth ratedmax 5 bn2I0 /n0 at Vmax 5 6b(2n2I0 /n0)
1/2 5 6Vc /A2,where I0 5 (1/2)ce0n0u c0u2 is the input mean power den-sity (or intensity), Vc is the cutoff frequency, and K is thewave vector of the perturbation. This modulational in-stability implies that, in the first-generation step of theMI process, a weakly noisy modulated quasi-plane wavewill experience exponential growth of spatial-frequencysidebands with an intensity-dependent period pmax5 2p/Vmax along transverse dimension x (spontaneousMI).7 Conversely, a weak initial modulation with spatialfrequency V within the MI gain band experiences expo-nential growth, leading to the generation of an array ofsolitonlike beams with fixed period p 5 2p/V (inducedMI).6,15 Extending the theory to the long-term evolutionof MI, Akhmediev et al. found a two-parameter family ofexact steady-state solutions of the modulational instabil-ity of the (1 1 1)-D plane wave.26,27 The solutions takethe dimensionless form
w~X, Z !
5~1 2 4a !cosh~DZ/2! 1 A2a cos~GX ! 1 iD sinh~DZ/2!
A2@cosh~DZ/2! 2 A2a cos~GX !#
3 exp~iZ/2!. (4)
Equation (4) is the analytical solution of Eq. (2) in di-mensionless units, where D/2 5 @2a(1 2 2a)#1/2 is the di-mensionless growth rate of the instability for the dimen-sionless modulation frequency G 5 @2(1 2 2a)#1/2 and Gand D are linked by parameter a (0 < a < 1/2). Equa-tion (4) was obtained with the following changes of vari-ables:
Z 5 ~q2/l0!z, X 5 q~b/l0!1/2x,
w 51
q S 1
2ce0n0l0g D 1/2
c, (5)
where q is a normalization parameter that links the sig-nal amplitude and the spatial changes of the field in the

576 J. Opt. Soc. Am. B/Vol. 19, No. 3 /March 2002 Cambournac et al.
waveguide. Equation (4) gives the full evolution of themodulationally unstable (1 1 1)-D plane wave (viewedas a pump in the spatial frequency domain) breaking into
Fig. 1. Analytical results. (a) Unstable evolution [from Eq. (4)]of a (1 1 1)-D plane wave modulated with period p5 125 mm, with C0 5 20% initial contrast and where I05 130 MW/cm2. (b) Evolution of the spatial Fourier spectrum,showing periodic energy exchange between the pump and the6nV harmonics (three are displayed here). (c) Intensity versusphase, showing the periodic backevolution to the initially modu-lated wave (FPU recurrence). Filled arrows, the evolution of aminimum of the initial sine modulation; open arrows, that of amaximum. For a non-plane-wave initial condition (here C05 20%), a cumulative phase shift is introduced after each recur-
rence period in z (two are displayed here).
a periodic array of soliton profiles and includes subse-quent periodic FPU-like recurrence with propagation.Figure 1, obtained analytically from Eq. (4), illustratesthe typical behavior of such an unstable field once a 20%modulation contrast has been reached, fixing a 125-mmmodulation period and 130-MW/cm2 initial mean inten-sity. Only two longitudinal recurrence periods LR , de-fined as twice the theoretical formation length for inputintensity I0 , are represented. The maximum peak inten-sity that corresponds to the array generation in Fig. 1(a)is near 1 GW/cm2, thus supporting the assumption ofweak nonlinearity. Figure 1(b) shows the correspondingevolution of the Fourier spatial spectrum. Equation (4)shows that the modulation growth rate saturates withstrong pump depletion at the maximum growth of thesidebands, and a periodic energy exchange between thepump and the multiple higher-order harmonics 6nV ofthe array then occurs. Figure 1(c) shows the relationshipof intensity to phase, with the typically exhibited FPU re-currence behavior. Note that this calculation was madewith the experimental parameters of Subsection 4.A be-low within their determined error range. Purposely, in-put mean intensity I0 does not exactly correspond to theintensity that gives the maximum growth rate dmax in Eq.(3) for the imposed 125-mm period. Calculation at dmaxwith the same initial contrast shows almost the sameoverall dynamics but a shorter formation length (51 in-stead of 58 mm) and hence a smaller recurrence period ofthe array.
Although Eq. (4) is valid for an initial plane wave thatdevelops higher-order harmonics, Fig. 1 correctly approxi-mates the evolution of an extended cw guided homoge-neous wave symmetrically modulated by a weak dual-frequency input signal along x, as soon as the energycontained in the nth harmonics (n . 1) remains negli-gible. In practice this situation corresponds to that of aMI induced from a modulation of the same initial contrastas that at z 5 0 in Fig. 1(a). Hence, maintaining the ini-tial contrast typically below 25% is an important experi-mental criterion for ensuring a situation that satisfies aMI process with a sinusoidal input pattern.26 Note that,with the weak energy contained in the nth harmonics(n . 1), the equivalence of MI to small-signal parametricamplification by four-wave mixing stands in the spectraldomain (with d the parametric gain), with a degeneratepump and only 61 input sidebands taken into consider-ation. However, when initial contrast becomes large (r0of the order of c0), the MI approach [Eq. (4)] no longer de-scribes the evolution of the spectral bands, and, further-more, higher-order harmonics must be included in thefour-wave mixing formalism.29,35,36
3. EXPERIMENT
The experiment depicted schematically in Fig. 2 is aimedat implementing (1 1 1)-D induced MI in spatial condi-tions close to those of the theory by launching, along thetransverse free x dimension of a planar wave-

Cambournac et al. Vol. 19, No. 3 /March 2002/J. Opt. Soc. Am. B 577
Fig. 2. Simplified experimental schematic of picosecond spatially induced MI.
guide, the widest possible homogeneous plane wave uponwhich a weak periodic one-dimensional sine modulation issuperimposed. The waveguide is a 10-mm-thick(d # deff) nonlinear layer (liquid carbon disulfide, CS2)sandwiched between two SK5 linear glass blocks of lowerlinear refractive index (Dn 5 20.05). Two differentpropagation lengths (L 5 3, 7 cm) permit a study of thedynamics of the generation and propagation of the soli-tonlike array with a large range of input intensity, modu-lation contrast, and period values. A 10-Hz, Q-switched,mode locked and frequency doubled Nd:YAG laser deliv-ers 38-ps (FWHM) Gaussian pulses at 532 nm. The in-cident energy is adjusted by means of a half-wave plateand a Glan polarizer at the entrance of the experimentalsetup. A thin focal line that is homogeneous at an;1.5-mm width along x is smoothed from the nearlyTEM00 laser beam by a spatial-frequency filter (not repre-sented) and shaped by sphero–cylindrical optics. To in-duce MI we split the latter quasi-plane wave into twothrough a Wollaston biprism; one beam is then polariza-tion rotated with a half-wave plate. The two beams in-terfere symmetrically with respect to the propagation axisof the waveguide. The interference angle can be adjustedto permit the modulation period to be tuned from 60 to130 mm with contrast kept below 25%. To ensure linearTE input polarization, a polarizer oriented along x is in-troduced before injection. Waveguide end-face couplingis provided by a cylindrical lens whose focal length is cho-sen to excite the TE0 guided mode selectively. With ourexperimental beam diameter and waveguide thickness(d 5 10 mm), f 8 5 150 mm gives a focus line of greaterwidth than d, and selection of the TE0 mode is ensured.At the waveguide output, two synchronized single-shotCCD cameras acquire the time-integrated output face im-age and its corresponding spatial Fourier spectrum (in a20-ms temporal window) for the same single laser pulse.The energy at the waveguide input is measured with acalibrated energymeter (losses through the windows ofthe CS2 waveguide are taken into account). From nu-merical fittings of the input focal line envelope and theoutput TE0 mode profile in the linear regime one can es-timate the mean intensity at the beginning of the propa-
gation from the energy effectively coupled into the wave-guide. Owing to imprecise knowledge of the actuallaunching conditions and matching efficiency between theincident focal line and the TE0 mode, it is, however, diffi-cult to make a precise determination of the injected meanintensity, for which we estimate 610% uncertainty. Astreak camera of 4-ps resolution, synchronized with theoutput pulse by means of a 9-m optical delay line, pro-vides additional time-resolved measurements.
Note, however, that the experimental conditions differfrom the theoretical conditions described in Section 2 inthat the former have the following three properties: (i)an asymmetric spatial-frequency input distribution for in-duced MI, as the weakly contrasted modulation is com-posed only of two-beam interference; (ii) picosecondpulsed excitation; and (iii) a noninstantaneous Kerr-likemedium that exhibits relaxing molecular reorientation inthe picosecond range. As is described in what follows,properties (i) and (ii) bring some additional peculiaritiesto the generation of MI-induced solitonlike arrays,whereas property (iii) has quite a strong influence ontheir propagation.
4. GENERATION OF A PERIODIC ARRAYOF SOLITON BEAMSA. General FeaturesDepending on propagation length L, the chosen modula-tion frequency that fixes the array period is adjustedabout frequency Vmax of maximum MI gain by an appro-priate choice of mean input intensity and modulation con-trast to form a solitonlike array at the waveguide output.Figure 3 shows the generation of a clean, extended arrayof solitonlike beams from a periodic sine modulation withp 5 125 6 3 mm and C0 5 20 6 1% initial intensity con-trast for I0 5 135 6 14 MW/cm2 input mean intensity af-ter propagation on the 7-cm-length of the waveguide.Figure 3(a) represents the output face’s image at low in-put intensity, and Figs. 3(b) and 3(c) correspond to thenonlinear regime in which the array is generated at the

578 J. Opt. Soc. Am. B/Vol. 19, No. 3 /March 2002 Cambournac et al.
waveguide output. Note the presence of an asymmetricnonzero background between the soliton peaks, which weshall discuss in Subsection 4.B. Figure 3(d) shows thecorresponding spatial-frequency spectra, which exhibitthe simultaneous growth, up to the third order, of positiveand negative spectral harmonics characterizing the peri-odicity of the bright peaks generated with a soliton enve-lope sech2 profile at the waveguide output. The resultsfor a 3-cm propagation length are not shown here, as theyare qualitatively the same; the main difference is thesmaller initially imposed modulation period (70 mm). In-deed, the shorter propagation length requires a higher MIgain, which means larger values of the spatial-frequencydetuning and the corresponding input intensity than forthe 7-cm-long waveguide.
For comparison, Figs. 3(e)–3(g) show the results of a cwnumerical simulation of the (1 1 1)DNLSE [Eq. (2)]based on the split-step Fourier-transform (SSF) algorithm
that is described in Subsection 5.B below. The param-eters are the same as those of Fig. 1. The agreementwith the analytical results of Section 2 is good. The onlydifference is a slightly longer formation length of the soli-tonlike array (62 instead of 58 mm), which is due to theimposed input dual-frequency signal sine modulation in-stead of a plane wave developing higher-order harmonics.Comparing these results with the experimental resultsfor the 7-cm-long waveguide, for the chosen intensityvalue I0 5 130 MW/cm2 within our experimental errorrange, we can see that the cw simulation satisfactorilypredicts the formation length [Figs. 3(e) and 3(g)] and theoverall shape of the array [Fig. 3(f)]. However, the ex-perimental output profiles and spectra [Figs. 3(c) and3(d)] exhibit two main differences from the stationary the-oretical predictions, which are due to the actual asymmet-ric launching condition and the picosecond pulse regime.To take these differences into account, in Fig. 4 wepresent the results of SSF simulation in the pulsed casefor MI induced by a single-frequency input signal.
Fig. 3. Experimental observation of the formation of a solitonlike periodic array after 7 cm of propagation with a 125-mm modulationperiod and 20% initial contrast: (a) linear regime with a sinusoidal output pattern, (b) nonlinear regime for I0 ' 135 MW/cm2, (c)nonlinear output profile exhibiting the solitonlike array, (d) corresponding output linear and nonlinear intensity spatial spectra obtainedin the Fourier domain. (e)–(g) Comparison of a cw one-dimensional SSF numerical simulation with the above experimental spatialparameters and I0 5 130 MW/cm2. (e) Top view of the propagation in the waveguide with (f) corresponding input (dotted curve) andoutput (solid curve) profiles and (g) evolution of the Fourier spectrum.

Cambournac et al. Vol. 19, No. 3 /March 2002/J. Opt. Soc. Am. B 579
B. Asymmetry of the Initial ConditionsBecause of the two-beam interference, we indeed induceMI with a single, weak, angularly detuned signal wavevector on one side of the pump plane-wave wave vector.This geometry leads to the slight global asymmetry of theobserved output profile and spectrum because the sym-metric first spectral harmonics (61) undergo the same MIgain but do not have the same spectral intensity at thebeginning of the MI process, as in Fig. 1 and in Figs. 3(e)–3(g). This asymmetry is clearly exhibited in Fig. 4(b) andcorresponds to a bending of the array during propagationin the direction of the mean incident energy, as shown inFig. 4(a). This bending is confirmed by the experimentalprofiles [Figs. 3(a) and 3(b)], where the maxima in linearand nonlinear regimes do not coincide along x. Further-more, note that varying the initial modulation contrastleads to a variation of the bending angle that we experi-mentally observed. Interestingly, this variation couldpermit continuous routing of the array in a desired direc-tion.
C. Characteristics of the Pulsed ExcitationA weak background superimposed upon the array appearsin Fig. 3(c). Experimentally, estimated mean input in-
Fig. 4. Pulsed SSF simulation of spatially induced MI with onlythe 1V sideband at the beginning of the process. The spatialparameters are the same as in Fig. 3, and the initial Gaussiantemporal envelope lasts for 38 ps (FWHM). (a)–(c) Time-integrated patterns showing (a) the top view of the propagation,(b) input sinusoidal modulation (dotted curve) and output profileat the maximum amplification stage (solid curve) at 6.2 cm ofpropagation and (c) the corresponding Fourier intensity spatialspectra. Bending of the whole array and asymmetric back-ground intensity in the output profiles can be seen.
tensity I0 actually corresponds to the peak of the picosec-ond pulse, where the array is first formed. Meanwhile,the low-intensity rear and front tails of the pulse are alsotime integrated by the CCD cameras both in direct spaceand in the Fourier domain. As confirmed by Fig. 4(b) inthe pulsed simulation, such a contribution from thepulse’s tails leads to a decrease of the output contrast ofthe soliton peaks37 even at the maximum amplificationpredicted by the cw simulation. Furthermore, the strongpump depletion that occurs in the central part of thepulse [in the cw simulation; Fig. 3(g)] is also hidden bythe tails. Thus, through time integration, these tails alsomodify the spectral output energy distribution [Fig. 4(c)],which is now in good accord with the experimental spec-trum of Fig. 3(d).
At this stage of the study, in which only the formationstep of the solitonlike array has been considered, it ap-pears that a proper account of the actual excitation con-ditions produces a quantitative agreement betweentheory and experiments. For our given initial period, in-cident intensity, and initial contrast, the formationlength, the shape of the array, and the growth of the har-monic sidebands are accurately predicted by the NLSEsimulation.
In what follows, we study the propagation features ofthe array, using symmetric launching in our numericalsimulations for simplicity. That leads only to nonbend-ing of the solitonlike array while keeping the other fea-tures of the array unchanged. Indeed, except for the ini-tial imbalance between the first spectral harmonics (61)in asymmetric launching, the MI process governs thesame energy exchange between the pump and the dis-crete spectral harmonics as in symmetric launching withboth (61) input sidebands.
D. Temporal Splitting of the Spatial ArrayThe pulsed excitation reveals another feature that mayinfluence the recurrent behavior of the solitonlike array.Equation (3) in the steady-state case indicates that theMI growth of parametric sidebands is intrinsically due tothe local power density. As a consequence, in inducedMI, a fixed-period spatial modulation undergoes a differ-ent parametric gain d for each local time t of the Gaussiantemporal envelope.33 This peculiarity leads to successivegeneration of periodic arrays of solitonlike beams of thesame period p at each time t with specific formationlengths. Thus the recurrent behavior of spatially in-duced MI causes the pulse envelope to split into multiplepeaks when propagation length is longer, or, equivalently,when the incident intensity is higher than that which cor-responds to the array formation threshold at the end ofthe waveguide. The simulated space–time pattern andtemporal profile of Fig. 5 show such a temporal split of thespatial array, with experimental input parameters asgiven in Section 5 below. When temporal integration bya CCD camera is accounted for, pulse splitting hence con-tributes to hiding the recurrence, even if it still occurs foreach local time, in addition to the influence of the low-intensity tails of the pulse. Figure 6 illustrates this be-havior by displaying the output contrast of the modula-tion (with p 5 125 mm and C0 5 20%) versus incidentintensity for a fixed 7-cm propagation length. The recur-

580 J. Opt. Soc. Am. B/Vol. 19, No. 3 /March 2002 Cambournac et al.
rence in the Gaussian pulsed case has less but still sig-nificant contrast excursion than in the cw case (;33%instead of 100%).38 Note that, according to the theory,39
we have limited the increase of intensity to twice the in-put mean intensity theoretically required for spontaneousgeneration of an array at chosen modulation period p.
Fig. 5. SSF simulation of splitting of the 38-ps soliton arraytemporal envelope owing to spatially induced MI (spatial param-eters are p 5 110 mm and C0 5 15%). (a) Space–time patternafter propagation for L 5 7 cm with I0 5 400 MW/cm2 (twicethat necessary for spontaneous generation at period p). (b) Pulseenvelope profiles: solid curve, a maximum of the initial spatialsine modulation, dashed curve, a minimum.
Fig. 6. Computed output contrast of the spatial MI-induced pe-riodic array ( p 5 125 mm,C0 5 20%) versus the input mean in-tensity I0 with a fixed propagation length (L 5 7 cm.) Compari-son of the steady-state spatially sine-modulated cw plane wave(filled stars) and the pulsed wave (the same spatial distributionsupported by a 38-ps Gaussian pulse) with (open circles) andwithout (open stars) relaxation of the nonlinearity. In thepulsed cases, we calculate modulation contrast by accounting fortime integration by the CCD camera.
For greater intensities, the 62 harmonics of the spatial-frequency spectrum will indeed be in the MI gain band,leading to a MI process with two pairs of sidebands, con-sideration of which is beyond the scope of this paper.
Once the array is formed, however, as we shall see inSection 5, temporal splitting is not sufficient to explainthe observed long-term propagation dynamics. In fact,the noninstantaneous relaxing nonlinearity in CS2 affectsthe propagation of the array both spatially and tempo-rally.
5. PROPAGATION OF THE SOLITONARRAYA. Stable Propagation of the Soliton ArrayThe induced-MI process maintains the initial modulationperiod when input intensity I0 is varied. Hence, for afixed waveguide length, increasing the input intensity isequivalent to increasing the dimensionless propagationlength (in units of recurrence length LR) and allows one tostudy propagation of the array after its generation.40 Asis shown in Fig. 6, periodic recurrence should be manifestas a significant decrease in the output modulation con-trast when input intensity is increased. For both wave-guide lengths, however, further increase in the input in-tensity beyond the soliton array formation threshold doesnot lead to experimental observation of the periodic recur-rence. As shown in Fig. 7, the solitonlike array first gen-erated at the end of the 7-cm waveguide [Fig. 7(a), withI0 5 184 6 19 MW/cm2, p 5 110 mm, and C0 5 15%]keeps a maximum contrast when the input intensity in-creases. Meanwhile, each bright peak has an increasedmaximum intensity, along with a reduced individualwidth. Unexpectedly, a secondary array grows progres-sively between the main first-formed solitons [Fig. 7(b),with I0 ' 400 MW/cm2]. With the help of Eqs. (5), weevaluate the corresponding increase in dimensionlesspropagation length from approximately L 5 0.5LR toL 5 1.6LR . This nonrecurrent spatial dynamics con-trasts with the predictions of the NLSE in a pure nonsat-urating instantaneous Kerr medium. For intensitieshigher than '450 MW/cm2, dislocation takes place in ourexperimental conditions, where the waveguide is multi-mode.
Fig. 7. Experimental output images with 110-mm period and15% initial contrast: (a) generation of a periodic array atI0 ' 184 MW/cm2, (b) spatial-frequency doubling with increas-ing intensity (I0 ' 400 MW/cm2), (c) corresponding profilesshowing the array formation threshold (dashed curve) andspatial-frequency doubling at higher intensity (solid curve).

Cambournac et al. Vol. 19, No. 3 /March 2002/J. Opt. Soc. Am. B 581
B. Dynamics in the Picosecond Regime with a RelaxingNonlinearityWith sub-100-fs pulse excitation, the noninstantaneousKerr nonlinearity in polar liquids such as CS2 has beentime resolved and shown to originate from the addition ofthree distinct inertial intermolecular nuclearmotions.41,42 These three responses of similar amplitudeare due to librational motion of the molecules, molecular-interaction-induced anisotropy, and slow diffusive mo-lecular reorientation, which relax with 140-fs, 450-fs, and1.61-ps time constants, respectively, in CS2 .42 It is usu-ally believed that these nuclear motions dominate thenonlinear index dynamics in CS2 in the picosecond rangein the absence of stimulated Raman scattering (intramo-lecular vibrations), as the weight of the purely electronicultrafast contribution is at least 1 order of magnitudelower.41,43 Although a complete inertial theory should beimplemented, we show here with a simple model that fi-nite picosecond relaxation cannot be neglected with re-spect to the 38 ps-duration of our experimental Gaussianpulse9 and plays a prominent role in the spatiotemporaldynamics of our induced-MI experiment. Indeed, therelative weights of the different contributions can be esti-mated from the integral of their impulse response when itis applied to a pulse whose duration is much longer than
the greatest relaxation time. We thus retain only theslow molecular reorientation in CS2 as responsible for therelaxation of the Kerr nonlinearity on the scale of thepulse duration. We approximate this response by aDebye-type function, assuming an instantaneous risetime and a typical decay time of 2 ps. We have verifiedthat including the 450-fs response, which has a similaramplitude, has a negligible effect on the results obtainedfrom the numerical simulations developed below. Hencemolecular relaxation acts as an inertial term in the tem-poral dynamics of the soliton array, leading to couplingbetween the successive temporal slices of the pulse enve-lope. To include relaxation in the NLSE, we modify Eq.(2) to yield a pair of equations that takes the dimension-less form9,44
iS ]w
]t1 u
]w
]z D 11
2
]2w
]x2 1 Pw 5 0, AP 5 u wu2.
(6)
A is a linear operator that accounts for the dynamics ofthe nonlinear response. A 5 1 when u wu2 is time inde-pendent, and, with a Debye-type response,9,44,45 A satis-fies
Db 51
2
52
AP 5 t]P
]t1 P 5 u wu2, (7)
where t is the relaxation time of the nonlinearity. P isequivalent to a polarization term that leads to a time- andintensity-dependent refractive index. It brings a nonlin-ear contribution to the propagation constant not only atlocal time t but also for the subsequent times of the pulse,as determined by Eq. (7). The impulse response of Eq.(7) is a decreasing exponential function defined from 0 to1` with a 2-ps duration (1/e width) in our case. To in-clude the effects of relaxation in our numerical simula-tion, we changed the nonlinear operator of the SSF algo-rithm by convoluting this exponential function with thetemporal envelope when we calculated the nonlinearrefractive-index change. The computation is as follows:
cS x, z 1Dz
2, t D 1
5 cS x, z 1Dz
2, t D 2
exp~iDbDz !,
(8)
where Dz is the sampling size of the decomposition alongthe propagation length and Db is the wave-vector mis-match introduced by the inertial nonlinearity, expressedby
The principle of the SSF method is to separate linearand nonlinear actions on the one-dimensional electricfield during step-by-step propagation (see Ref. 46 for de-tails). Equation (8) states the general form of the nonlin-ear operation that is applied once at the middle of thepropagation step (at z 5 z 1 Dz/2), and Eq. (9) corre-sponds specifically to a decaying exponential-type nonlin-earity. Convolution between the temporal envelope (ap-proximated by the mean intensity between beginning andthe end of propagation step Dz) and the nonlinear re-sponse function ensures that the dynamics of the Kerr ef-fect is accounted for in the calculation of the nonlinear in-dex change [in the case of an instantaneous Kerrresponse, the exponential functions in Eq. (9) are obvi-ously replaced by the Dirac functions d (t 2 t8) and d (t8),as was done for the numerical results of Section 4]. Withthis change in the NLSE, we simulate the propagation ofan array with p 5 125 mm, C0 5 20%, and L 5 7 cmand for an increasing range of input mean intensity. Theresult for the output contrast of the array is illustratedin Fig. 6.
Contrary to what is expected (i.e., recurrent behavior)in the instantaneous case, the relaxation stabilizes thetime-integrated output pattern: The maximum excur-
E2`
t
@I~x, z, t8! 1 I~x, z 1 Dz, t8!#exp@2~t 2 t8!/t#dt8
E0
1`
exp@2t8/t#dt8
2`
t
@I~x, z, t8! 1 I~x, z 1 Dz, t8!#exp@2~t 2 t8!/t#dt8. (9)
g
g
tE

582 J. Opt. Soc. Am. B/Vol. 19, No. 3 /March 2002 Cambournac et al.
Fig. 8. Pulsed SSF simulations of the generation and propagation of a solitonlike array with p 5 110 mm, C0 5 15%, a 38-ps Gaussianpulse, and I0 5 400 MW/cm2. The profiles are given at the z coordinate that corresponds to the second maximum amplification distanceat ;6.5 cm. Time-integrated transverse profiles and top views for (a) instantaneous nonlinearity, for which the expected periodic re-current behavior is partially hidden because of the pulsed excitation, (b) with a 2-ps relaxation time of the nonlinearity, for which thereare inhibition of the recurrence and spatial-frequency doubling.
sion contrast of the soliton array falls to 8%, and then thecontrast seems to increase asymptotically. Such a tem-poral inertial effect contributes to nearly inhibiting theFPU recurrence, as shown experimentally in Fig. 7. Toillustrate the propagation features of the soliton arraythat correspond to the experimental result of Fig. 7, weshow in Fig. 8(b) the results of a pulsed NLSE simulationin the presence of relaxation with L 5 7 cm, p5 110 mm, and C0 5 15% for a fixed input intensity
I0 5 400 MW/cm2. Once the time-integrated soliton ar-ray is formed, its propagation appears stable [Fig. 8(b)]instead of undergoing approximately a one and a one-halfrecurrence period as in the instantaneous Kerr case [Fig.8(a)]. The maxima of the array exhibit a little vanishingoscillation of low contrast (as was already shown in Fig.6), with related stabilization of the width of the brightpeaks as a manifestation of soliton propagation. Fur-thermore, the progressive growth of a secondary spatialarray from 4 cm is also apparent. Output profiles at 6.5cm clearly exhibit the significant growth of these second-ary peaks with relaxing nonlinearity, in good agreementwith the experimental observations. Figure 9 shows thecalculated intensity versus phase for local time t that cor-responds to the peak of the initial Gaussian pulse at twospecific transverse coordinates (a maximum and a mini-mum of the sinusoidal input pattern) for both instanta-neous and relaxing nonlinearity. Whereas recurrence isshown in Fig. 9(a), Fig. 9(b) shows asymptotic behavior to-ward small-amplitude oscillation of the maxima and atendency of the minima to decrease near zero intensity.Hence the inertial effect of relaxation inhibits recurrencenot only in the time-integrated patterns but also for thepower density at this local time t. Furthermore, whenother local times are chosen, the same calculation shows
that asymptotic stabilization appears on the main frontpart of the pulse where the pulse splitting behavior dis-cussed in Subsection 4.D disappears.
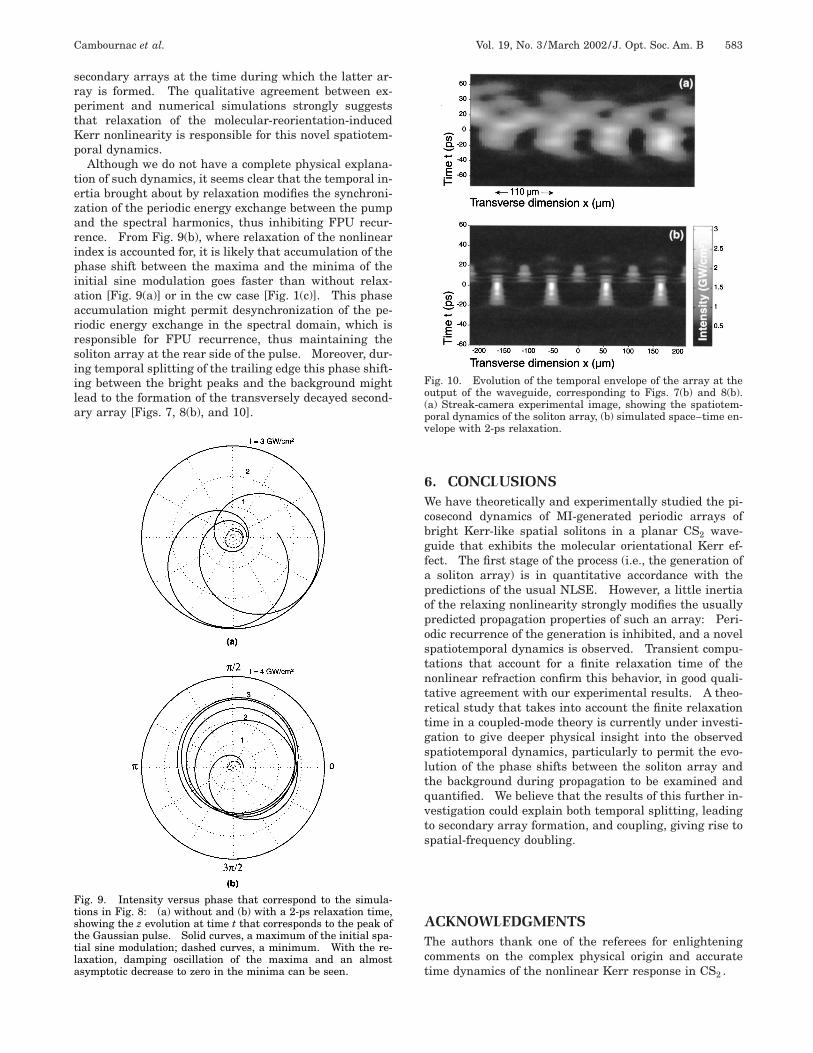
The decrease in intensity for the position of a spatialminimum of the initial sine modulation in Fig. 9(b) doesnot show the experimentally observed growth of the sec-ondary array [Fig. 7(b)]. This result reveals the new spa-tiotemporal dynamics shown in Fig. 10 that yields thetime-integrated spatial frequency doubling of Figs. 7 and8(b). Figure 10(a) is an experimental recording of theoutput space–time pattern corresponding to Fig. 7(b) ob-tained with the streak camera. It shows that spatial-frequency doubling indeed does result from a successionof two arrays with the same transverse period during thepulse duration. The main soliton array is formed at themain front part of the pulse, whereas the secondary arrayis time shifted to the rear side of the pulse and spaceshifted by half a period p in the transverse x dimension.Note that this experimental picture was numerically fil-tered with a flat-top low-pass function to smooth the im-portant noise level introduced into the initial recording bythe 9-m optical delay line and the electronic gain of thestreak camera.
Figure 10(b) is the simulated space–time envelope thatcorresponds to Fig. 8(b) at 6.5 cm; it qualitatively con-firms the streak camera’s experimental image. Temporalsplitting at the leading edge of the pulse is almost absent,whereas splitting in addition to the transverse spatialshift of the secondary array occurs on the trailing edge.This fine temporal dynamics could not be verified experi-mentally owing to the finite 4-ps resolution of the streakcamera. Nevertheless, Figs. 10(a) and 10(b) exhibit thesame low-frequency modulations along t. These two fig-ures clearly show the coupling between the main and the
Cambournac et al. Vol. 19, No. 3 /March 2002/J. Opt. Soc. Am. B 583
secondary arrays at the time during which the latter ar-ray is formed. The qualitative agreement between ex-periment and numerical simulations strongly suggeststhat relaxation of the molecular-reorientation-inducedKerr nonlinearity is responsible for this novel spatiotem-poral dynamics.
Although we do not have a complete physical explana-tion of such dynamics, it seems clear that the temporal in-ertia brought about by relaxation modifies the synchroni-zation of the periodic energy exchange between the pumpand the spectral harmonics, thus inhibiting FPU recur-rence. From Fig. 9(b), where relaxation of the nonlinearindex is accounted for, it is likely that accumulation of thephase shift between the maxima and the minima of theinitial sine modulation goes faster than without relax-ation [Fig. 9(a)] or in the cw case [Fig. 1(c)]. This phaseaccumulation might permit desynchronization of the pe-riodic energy exchange in the spectral domain, which isresponsible for FPU recurrence, thus maintaining thesoliton array at the rear side of the pulse. Moreover, dur-ing temporal splitting of the trailing edge this phase shift-ing between the bright peaks and the background mightlead to the formation of the transversely decayed second-ary array [Figs. 7, 8(b), and 10].
Fig. 9. Intensity versus phase that correspond to the simula-tions in Fig. 8: (a) without and (b) with a 2-ps relaxation time,showing the z evolution at time t that corresponds to the peak ofthe Gaussian pulse. Solid curves, a maximum of the initial spa-tial sine modulation; dashed curves, a minimum. With the re-laxation, damping oscillation of the maxima and an almostasymptotic decrease to zero in the minima can be seen.
6. CONCLUSIONSWe have theoretically and experimentally studied the pi-cosecond dynamics of MI-generated periodic arrays ofbright Kerr-like spatial solitons in a planar CS2 wave-guide that exhibits the molecular orientational Kerr ef-fect. The first stage of the process (i.e., the generation ofa soliton array) is in quantitative accordance with thepredictions of the usual NLSE. However, a little inertiaof the relaxing nonlinearity strongly modifies the usuallypredicted propagation properties of such an array: Peri-odic recurrence of the generation is inhibited, and a novelspatiotemporal dynamics is observed. Transient compu-tations that account for a finite relaxation time of thenonlinear refraction confirm this behavior, in good quali-tative agreement with our experimental results. A theo-retical study that takes into account the finite relaxationtime in a coupled-mode theory is currently under investi-gation to give deeper physical insight into the observedspatiotemporal dynamics, particularly to permit the evo-lution of the phase shifts between the soliton array andthe background during propagation to be examined andquantified. We believe that the results of this further in-vestigation could explain both temporal splitting, leadingto secondary array formation, and coupling, giving rise tospatial-frequency doubling.
ACKNOWLEDGMENTSThe authors thank one of the referees for enlighteningcomments on the complex physical origin and accuratetime dynamics of the nonlinear Kerr response in CS2 .
Fig. 10. Evolution of the temporal envelope of the array at theoutput of the waveguide, corresponding to Figs. 7(b) and 8(b).(a) Streak-camera experimental image, showing the spatiotem-poral dynamics of the soliton array, (b) simulated space–time en-velope with 2-ps relaxation.

584 J. Opt. Soc. Am. B/Vol. 19, No. 3 /March 2002 Cambournac et al.
This study has been supported in part by the EuropeanUnion under the QUANTIM program (contract IST-2000-26019).
C. Cambournac’s e-mail address is [email protected].
REFERENCES AND NOTES1. N. N. Akhmediev, ‘‘Spatial solitons in Kerr and Kerr-like
media,’’ Opt. Quantum Electron. 30, 535–569 (1998).2. G. I. Stegeman and M. Segev, ‘‘Optical spatial solitons and
their interactions: universality and diversity,’’ Science286, 1518–1523 (1999).
3. E. Garmire, R. Y. Chiao, and C. H. Townes, ‘‘Dynamics andcharacteristics of the self-trapping of intense light beams,’’Phys. Rev. Lett. 19, 347–349 (1966).
4. V. E. Zakharov and A. B. Shabat, ‘‘Exact theory of two-dimensional self-focusing and one-dimensional self-modulation of waves in nonlinear media,’’ Sov. Phys. JETP34, 62–69 (1972).
5. A. Hasegawa and W. F. Brinkman, ‘‘Tunable coherent IRand FIR sources utilizing modulational instability,’’ IEEE J.Quantum Electron. QE-16, 694–697 (1980).
6. A. Hasegawa, ‘‘Generation of a train of soliton pulses by in-duced modulational instability in optical fibers,’’ Opt. Lett.9, 288–290 (1984).
7. K. Tai, A. Hasegawa, and A. Tomita, ‘‘Observation of modu-lational instability in optical fibers,’’ Phys. Rev. Lett. 56,135–138 (1986).
8. V. I. Bespalov and V. I. Talanov, ‘‘Filamentary structure oflight beams in nonlinear liquids,’’ JETP Lett. 3, 307–310(1966).
9. V. E. Zakharov and A. M. Rubenchik, ‘‘Instability ofwaveguides and solitons in nonlinear media,’’ Sov. Phys.JETP 38, 494–500 (1974).
10. A. Barthelemy, S. Maneuf, and C. Froehly, ‘‘Propagationsoliton et auto-confinement de faisceaux laser par non lin-earite optique de Kerr,’’ Opt. Commun. 55, 201–206 (1985).
11. H. Maillotte, J. Monneret, A. Barthelemy, and C. Froehly,‘‘Laser beam self-splitting into solitons by optical Kerr non-linearity,’’ Opt. Commun. 109, 265–271 (1994).
12. H. Maillotte and R. Grasser, ‘‘Generation and propagationof stable periodic arrays of soliton stripes in a bulk Kerr liq-uid,’’ in Nonlinear Guided Waves and Their Applications,Vol. 5 of 1998 OSA Technical Digest Series (Optical Societyof America, Washington, D.C., 1998), pp. 167–169.
13. M. Soljacic, S. Sears, and M. Segev, ‘‘Self-trapping of neck-lace beams in self-focusing Kerr media,’’ Phys. Rev. Lett. 81,4851–4854 (1998).
14. C. Anastassiou, M. Soljacic, M. Segev, E. D. Eugenieva, D.N. Christodoulides, D. Kip, Z. H. Musslimani, and J. P.Torres, ‘‘Eliminating the transverse instabilities of Kerrsolitons,’’ Phys. Rev. Lett. 85, 4888–4891 (2000).
15. K. Tai, A. Tomita, J. L. Jewell, and A. Hasegawa, ‘‘Genera-tion of subpicosecond solitonlike optical pulses at 0.3 THzrepetition rate by induced modulational instability,’’ Appl.Phys. Lett. 49, 236–238 (1986).
16. G. Millot, E. Seve, S. Wabnitz, and M. Haelterman, ‘‘Obser-vation of induced modulation polarization instabilities andpulse-train generation in the normal-dispersion regime of abirefringent optical fiber,’’ J. Opt. Soc. Am. B 15, 1266–1277(1998).
17. E. Seve, G. Millot, S. Wabnitz, T. Sylvestre, and H. Maillo-tte, ‘‘Generation of vector dark-soliton trains by inducedmodulation instability in a highly birefringent fiber,’’ J. Opt.Soc. Am. B 16, 1642–1650 (1999).
18. M. Nakazawa, A. Suzuki, and H. A. Haus, ‘‘The modula-tional instability laser. I. Experiment,’’ IEEE J. Quan-tum Electron. 25, 2036–2044 (1989).
19. M. Nakazawa, A. Suzuki, H. Kubota, and H. A. Haus, ‘‘Themodulational instability laser. II. Theory,’’ IEEE J.Quantum Electron. 25, 2045–2052 (1989).
20. S. Coen and M. Haelterman, ‘‘Impedance-matched modula-tional instability laser for background-free pulse train gen-eration in the THz range,’’ Opt. Commun. 146, 339–346(1998).
21. S. Coen and M. Haelterman, ‘‘Continuous-wave ultrahigh-repetition-rate pulse train generation through modula-tional instability in a passive fiber cavity,’’ Opt. Lett. 26,39–41 (2001).
22. A. V. Mamaev, M. Saffman, and A. A. Zozulya, ‘‘Break-upof two-dimensional bright spatial solitons due to trans-verse modulation instability,’’ Europhys. Lett. 35, 25–30(1996).
23. A. V. Mamaev, M. Saffman, D. Z. Anderson, and A. A. Zozu-lya, ‘‘Propagation of light beams in anisotropic nonlinearmedia: from symmetry breaking to spatial turbulence,’’Phys. Rev. A 54, 870–879 (1996).
24. R. A. Fuerst, D.-M. Baboiu, B. Lawrence, W. E. Torruellas,G. I. Stegeman, S. Trillo, and S. Wabnitz, ‘‘Spatial modula-tional instability and multisolitonlike generation in a qua-dratically nonlinear optical medium,’’ Phys. Rev. Lett. 78,2756–2759 (1997).
25. H. Fang, R. Malendevich, R. Schiek, and G. I. Stegeman,‘‘Spatial modulational instability in one-dimensionallithium niobate slab waveguides,’’ Opt. Lett. 25, 1786–1788(2000).
26. N. N. Akhmediev, V. M. Eleonskii, and N. E. Kulagin, ‘‘Gen-eration of periodic trains of picosecond pulses in optical fi-ber: exact solutions,’’ Sov. Phys. JETP 62, 894–899 (1985).
27. N. N. Akhmediev and A. Ankiewicz, Solitons: NonlinearPulses and Beams (Chapman & Hall, London, 1997), pp.27–76.
28. P. V. Mamyshev, P. G. Wigley, J. Wilson, C. Bosshard, and G.I. Stegeman, ‘‘Restoration of dual frequency signals withnonlinear propagation in fibers with positive group velocitydispersion,’’ Appl. Phys. Lett. 64, 3374–3376 (1994).
29. D. L. Hart, A. F. Judy, R. Roy, and J. W. Beletic, ‘‘Dynamicalevolution of multiple four-wave-mixing processes in an op-tical fiber,’’ Phys. Rev. E 57, 4757–4774 (1998).
30. E. M. Dianov, P. V. Mamyshev, A. M. Prokhorov, and S. V.Chernikov, ‘‘Generation of a train of fundamental solitonsat a high repetition rate in optical fibers,’’ Opt. Lett. 14,1008–1010 (1989).
31. P. V. Mamyshev, S. V. Chernikov, and E. M. Dianov, ‘‘Gen-eration of fundamental soliton trains for high-bit-rate opti-cal fiber communication lines,’’ IEEE J. Quantum Electron.27, 2347–2355 (1991).
32. P. V. Mamyshev, C. Bosshard, and G. I. Stegeman, ‘‘Genera-tion of a periodic array of dark spatial solitons in the regimeof effective amplification,’’ J. Opt. Soc. Am. B 11, 1254–1260(1994).
33. G. Van Simaeys, P. Emplit, and M. Haelterman, ‘‘Experi-mental demonstration of the Fermi–Pasta–Ulam recur-rence in a modulationally unstable optical wave,’’ Phys.Rev. Lett. 87, 033902 (2001).
34. R. A. Sammut, C. Pask, and Q. Y. Li, ‘‘Theoretical study ofspatial solitons in planar waveguides,’’ J. Opt. Soc. Am. B10, 485–491 (1993).
35. S. Trillo and S. Wabnitz, ‘‘Dynamics of the nonlinear modu-lation instability in optical fibers,’’ Opt. Lett. 16, 986–988(1991).
36. S. Trillo, S. Wabnitz, and T. A. B. Kennedy, ‘‘Nonlinear dy-namics of dual-frequency-pumped multiwave mixing in op-tical fibers,’’ Phys. Rev. A 50, 1732–1747 (1994).
37. S. Maneuf and F. Reynaud, ‘‘Quasi-steady state self-trapping of first, second and third order sub-nanosecondsoliton beams,’’ Opt. Commun. 66, 325–328 (1988).
38. In fact, in Ref. 33 the recurrence was experimentally dem-onstrated by induction of MI with square-shaped pulses ina fiber. In this way, MI was negligibly influenced by eitherthe rear or the front side of the pulse.
39. N. N. Akhmediev, V. I. Korneev, and N. V. Mitskevich, ‘‘N-modulation signals in a single-mode optical waveguide un-der nonlinear conditions,’’ Sov. Phys. JETP 67, 89–95(1988).
40. Note that, rigorously, frequency detuning should be in-

Cambournac et al. Vol. 19, No. 3 /March 2002/J. Opt. Soc. Am. B 585
creased when I0 increases, in accordance with the change ofvariables of Eqs. (5), to keep the same dimensionless formof Eq. (4). Nevertheless, this is not strictly necessarywhen one is attempting to determine whether the MI-generated solitonlike arrays are recurrent.
41. J.-M. Halbout and C. L. Tang, ‘‘Femtosecond interferometryfor nonlinear optics,’’ Appl. Phys. Lett. 40, 765–767 (1982).
42. D. McMorrow, W. T. Lotshaw, and G. A. Kenney-Wallace,‘‘Femtosecond optical Kerr studies on the origin of the non-linear responses in simple liquids,’’ IEEE J. Quantum Elec-tron. 24, 443–454 (1988).
43. R. W. Boyd, Nonlinear Optics (Academic, San Diego, Calif.,1992), pp. 159–190.
44. E. A. Kuznetsov, A. M. Rubenchik, and V. E. Zakharov,‘‘Soliton stability in plasmas and hydrodynamics,’’ Phys.Rep. 142, 103–165 (1986).
45. S. Trillo, S. Wabnitz, G. I. Stegeman, and E. M. Wright,‘‘Parametric amplification and modulational instabilities indispersive nonlinear directional couplers with relaxing non-linearity,’’ J. Opt. Soc. Am. B 6, 889–900 (1989).
46. G. P. Agrawal, Nonlinear Fiber Optics (Academic, San Di-ego, Calif., 1995), pp. 50–55.


![arXiv:1302.1831v2 [nlin.PS] 27 Sep 2013 · 2018-06-06 · Spatiotemporal two-dimensional solitons in the complex Ginzburg-Landau equation Florent B erard Department of Mathematics,](https://img.pdfslide.us/doc/110x75/5e6ecd3670478e47ac07486a/arxiv13021831v2-nlinps-27-sep-2013-2018-06-06-spatiotemporal-two-dimensional.jpg)