Embed Size (px)
Citation preview
lable at ScienceDirect
Atmospheric Environment 45 (2011) 6802e6811
Contents lists avai
Atmospheric Environment
journal homepage: www.elsevier .com/locate/atmosenv
Spatio-temporal variation trends of satellite-based aerosol optical depth in Chinaduring 1980e2008
Jian-Ping Guo a,*, Xiao-Ye Zhang a, Ye-Rong Wu b,c, Yangzong Zhaxi d, Hui-Zheng Che a, Ba La d,Wei Wang d, Xiao-Wen Li b,c
aCentre for Atmosphere Watch and Services, Chinese Academy of Meteorological Sciences, 46, Zhongguancun South Avenue, Haidian District, Beijing 100081, Chinab School of Geography, Beijing Normal University, Beijing 100875, Chinac State Key Laboratory of Remote Sensing Science1, Institute of Remote Sensing Applications, Chinese Academy of Sciences, PO Box 9718, Beijing 100101, Chinad Tibet Institute of Plateau Atmospheric and Environmental Science Research, Lhasa 850001, Tibet, China
a r t i c l e i n f o
Article history:Received 6 January 2011Received in revised form27 March 2011Accepted 29 March 2011
Keywords:AODTrendTOMSMODIS
* Corresponding author. Tel.: þ86 10 58993189; faxE-mail address: [email protected] (J.-P. Guo
1 Jointly Sponsored by the Institute of Remote SenAcademy of Sciences and Beijing Normal University.
1352-2310/$ e see front matter � 2011 Elsevier Ltd.doi:10.1016/j.atmosenv.2011.03.068
a b s t r a c t
This paper analyzes TOMS AOD at 500 nm (1980e2001), along with MODIS data (2000e2008) at 550 nmto investigate variations at one-degree grid over eight typical regions in China and the trends in AODs,temporally and spatially. In contrast to recently reported global decrease in AOD over global oceanbeginning around 1990, we find there virtually exists no apparent AOD transition in China for that: firstlyno notable upward tendencies in AOD during 1980e1992 for the relative low value (þ0.001/decade),then during 1996e2001 a discernible ascending tendency with larger magnitude at 0.01/decade, andfinally, since 2000, a weak upward trend with þ0.004/decade. The large increases during 1996e2001 arepresumably consequences of large increases in industrial activities and bear a strong resemblance to thelong-term decreasing observations of incident solar radiation and cloud cover in China. Specifically, inlate 1990’s, only in Taklimakan Desert a negative trend with a maximum magnitude of �0.04/decade isdetected. However, over regions such as Jingjinji and Pearl River Delta influenced by industrial activities,positive tendencies at þ0.01/decade are observed.
Seasonal patterns in the AOD regional long-term trend are evident. AODs exhibit generally similarseasonality and the summer dominates higher AOD value than the autumn. In particular, during theperiod 1980e2001, all the eight regions except Taklimakan Desert witness the maximum aerosols inwinter while there is not such seasonality during the period 2000e2008. Geographically, we alsodocument spatial patterns of AOD variations over China. Results reveal that no apparent upward trendsin AOD (about 15% per decade) are observed in 1980’s, while beginning 1990 till 2008, both data (TOMSand MODIS) are indicative of a significant AOD increase across China, especially in 1990’s it is indeed thecase, roughly in accordance with the overall trends at regional scale.
� 2011 Elsevier Ltd. All rights reserved.
1. Introduction
The aerosols have two effects on the climate by scattering andabsorbing both solar and terrestrial radiation and as well asmodifying the distribution of clouds and their radiative properties:one is direct effect by reflecting solar radiation back to the atmo-sphere, and another refers to the indirect effect, which, in principle,affects the Earth’s radiation budget through clouds. The latter hasreceived the most attention recently in that the increase of cloud
: þ86 10 62176414.).sing Applications of Chinese
All rights reserved.
droplet concentration and a decrease in cloud droplet size fora cloud will increase the reflection of solar radiation (called firstindirect aerosol effect, Twomey, 1977) by assuming a fixed liquidwater content. At the same time, the reduction in droplet sizereduces the precipitation efficiency, thereby increasing the cloudliquid water content, cloud lifetime (called second indirect aerosoleffect, Albrecht, 1989) and cloud geometrical and optical thickness(Pincus and Baker, 1994). In addition, absorption by aerosols heatsthe atmosphere locally, which results in the evaporation of clouddroplets (Ackerman et al., 2000; Hansen et al., 1997; Koren et al.,2004), and changes in the atmospheric lapse rate and horizontaladvection patterns, affecting cloud formation and precipitationefficiency on regional or global scale (Rosenfeld, 2000).
Due to the sparse surface network, increasing attention has beenpaid to satellite-based aerosols retrievals. As such, numerous global
J.-P. Guo et al. / Atmospheric Environment 45 (2011) 6802e6811 6803
satellite aerosol products have been generated for both environ-mental monitoring and climate studies from the following satelliteplatforms: AVHRR, MODIS, MISR, TOMS/OMI, SeaWiFS, GOMS,AATSR, etc. spanning the period late 1970s to the present. Thereexists, however, thesubstantial discrepancies between them.Advantages of individual products are retained due in large part tothe lack of integrated products generated which reconcile theirdifferences (Kinne et al., 2006; Kinne, 2009). Several inter-comparison studies (King et al., 1999; Lee et al., 2009), fortu-nately, were conducted and some insights were gained on thecauses of the discrepancies (Jeong and Li, 2005; Kahn et al., 2007;Kokhanovsky et al., 2007; Mishchenko et al., 2009). Despite thatthe discrepancies still present in the currently available aerosolproducts and its corresponding possible causes that are not thetopic of this paper, long-term continuous aerosol observations havebecome indispensable for use in various assessments of climate andclimate change. A host of researches concerning the long-termaerosol trend analysis have been performed mainly from space-borne aerosol products on account of the merits of wide coverageby satellite-based remote sensing.
Based on 14.5 years (1979e1993) of TOMS aerosol data, globalobservations of the 5 typical major sources of UV-absorbing aero-sols from biomass burning and desert dust showed that lateOctobereNovember dominated the minimum aerosol loadingwhile the period JuneeJuly dominates the maximum (Hermanet al., 1997). Using TOMS observations from 1979 to 2000, theresearch conducted by Massie et al. (2004) suggested that aerosolincreased by 17% per decade during winter over the China coastalplain using TOMS observations from1979 to 2000. Meanwhile, overthe Indian sub-continent (land) upward trend in AODwas observedin TOMS observations as well.
The prevailing view is that it has been increasing over the sea(Ramanathan et al., 2005) as a consequence of the increasinganthropogenic emissions and that it also undergoes episodicchanges due to volcanic eruptions or forest fires as well as due toweather anomalies of different scales. However recent worksrelevant to this problem indicate a possible reduction of AOD andan increase in solar radiation reaching the ground over large partsof the globe, noticeable from the beginning of 1990s (Mishchenkoand Geogdzhaev, 2007; Mishchenko et al., 2007a,b; Stern, 2006;Wild et al., 2005; George et al., 2008).
Ramanathan et al. (2005) reported an extensive study ofregional trends in India including decreasing trends in measuredand predicted solar radiation. A general decrease in solar radiationin many Indian cities since 1990 has been found in a recent paper(Porch et al., 2007), which is in agreement with an increasing trendin AOD from total ozone mapping spectrometer (TOMS) measure-ments. As a result of residue trend analysis made by De Graaf et al.(2010), a small decreasing trend of �0.029 per year from 1995 to2000 was found across Africa.
Using amethod developed by Qiu (1998), 750 nm aerosol opticaldepths at 47 solar stations from 1961 to 1990 were retrieved.Furthermore, the results of AOD variation over China in recent 30years indicated that AOD increased obviously over China from 1961to 1990 (Luo et al., 2000, 2001). But it is based on in-situ ground-based measurements, which cannot be used to determine theaerosol variation on large spatial scale.
On global scale, both MODIS and MISR AODs seem to fully agreethat there may have been a weak upward tendency over the landand no apparent long-term tendency over the oceans (Mishchenkoet al., 2009). Without doubt, the newer instruments, taking MISRand MODIS as examples, can be expected to provide more accurateand robust aerosol retrievals, while the older instruments, espe-cially the Advanced Very High Resolution Radiometer (AVHRR) andthe Total Ozone Mapping Spectrometer (TOMS) can be used to
assess potential long-term trends (Mishchenko et al., 2007a) due toits advantage of long duration.
The long-term trend of aerosol optical thickness over the globaloceans has been studied by using a nearly 25-year aerosol productfrom the AVHRR PATMOS-x data (Zhao et al., 2008). This negativetendency is even more evident for globally and annually averagedAOD with the magnitude of �0.03/decade. The decreasingtendency in global AOD is consistent with that from the GACP dataset (Geogdzhayev et al., 2005; Mishchenko and Geogdzhaev, 2007).
Zhang and Reid (2010), however, studied both regional andglobal aerosol trends over oceans using the ten-year (2000e2009)MODIS andMISR aerosol products, found that on global scale, thereexists a statistically negligible global trend of�0.003/decade for thepast 10 years, which does not agree with a decreasing trend(�0.014/decade) as reported by Mishchenko et al. (2007b) usingthe AVHRR data for the years of 1991e2005. While, AODs over theIndian Bay of Bengal, east coast of Asia, and Arabian Sea showascending trends of 0.07, 0.06, and 0.06 per decade for MODIS,respectively. Negative AOD trends, low in confidence levels, arefound off Central America, the east coast of North America, and thewest coast of Africa.
Negative trends in AOD derived from MODIS, MISR, combinedwith AERONET over Europe and North America for the period2000e2009 were observed, which appeared to be statisticallysignificant, whereas over South and East Asia they are mostlypositive (De Meij et al., 2010), in qualitative agreement with theresults of previous studies by Zhang and Reid (2010), Lu et al.(2010), Remer et al. (2008) and Chylek et al. (2007).
By instituting the reform and opening-up policies since late1970’s, China has made remarkable achievements in economicdevelopment. As a consequence, the emissions of greenhouse gasesand aerosols have also been increased during past decades, therebydramatically affecting regional climate in China (Menon et al.,2002). As a result, China has become one of the world’s mostdense aerosol regions (Li et al., 2007; Duncan et al., 2003), whereinurban regions over eastern China contain large volumes of aerosols,owing to both human activities (construction, traffic, etc.) andremote biomass burning or dust storms transported to the urbanregions (Jin and Shepherd, 2005; Zhao and Li, 2007).
Accounting for the fact that China is one of the heavily pollutedareas with higher concentration of sulfate, dust and carbonaceousaerosols as well. In addition, the mineral aerosol, which is derivedfrom Northwest China especially in spring season, can transferalong with wind to the downstream far away and impact theenvironment and climate of East China. In fact, the aerosol directobservations in China are much scarce except for a limited numberof observation sites. Till now, an understanding about the spatialand temporal variation of aerosols over China is limited due tosparse network of observations. Hence, it is the primary problem toobtain the spatio-temporal distribution of aerosols over China.
Notwithstanding the considerable work devoting to the topic ofAOD retrieval and long-term trend analysis, overall the currentknowledge of the global distribution of the AOD and, especially,aerosol microphysical characteristics remain limited (Mishchenkoet al., 2009). The level of scientific understanding of aerosoleffects on climate system is medium-low and the uncertainty inestimates can be very large (IPCC, 2007). Understanding long-termchanges and trend in AOD on the Earth, especially in the developingcountries like China, becomes increasingly essential for accuratelyassessing the radiative forcing, as well as better constraining theclimate models.
Considering the severe impacts on the climate andhumanhealthcaused by aerosols, attention recently has been paid to aerosolswhether there is or not a clear increasing/decreasing regional orglobal trend of aerosol loading through satellite observations. In
J.-P. Guo et al. / Atmospheric Environment 45 (2011) 6802e68116804
particular, based on long-term uninterrupted record of global AODestimates from AVHRR, Mishchenko et al. (2007b) found a globalaveragedAODdiscontinuity over the oceans beginning around1991,which is in good agreement with the fact of a recovery from theprevious decline known as global “dimming” (Wild et al., 2005),with the” brightening” beginning around 1990 (Pinker et al., 2005).To our knowledge, no work has been reported about the disconti-nuity in the long-term changes in AOD across China during theperiod 1980e2008. In this study, we will present the long-termtrend analysis of aerosol loading in eight typical regions of Chinaand attempt to find out the discontinuity by combining TOMS andMODIS aerosol data, which will provide a detailed insight intospatio-temporal variation of aerosol load and the possible causes forit as well.
\A short overview of the contents of this paper is given below.Introduced in Section 2 are the data andmethods employed. Resultsconcerning the relatively comprehensive aerosol variation in Chinaare given in Section 3, and the discussion in relation to the resultsalso is made here. Finally, conclusions are drawn in Section 4.
2. Data and methods
2.1. Study area
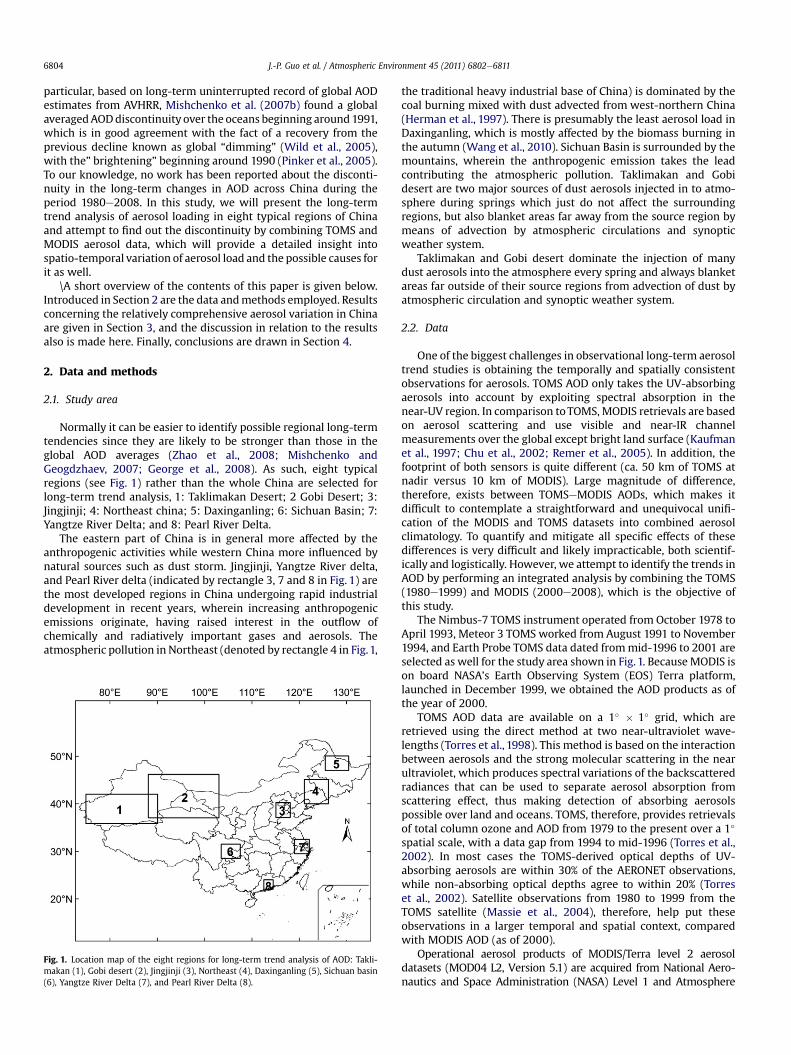
Normally it can be easier to identify possible regional long-termtendencies since they are likely to be stronger than those in theglobal AOD averages (Zhao et al., 2008; Mishchenko andGeogdzhaev, 2007; George et al., 2008). As such, eight typicalregions (see Fig. 1) rather than the whole China are selected forlong-term trend analysis, 1: Taklimakan Desert; 2 Gobi Desert; 3:Jingjinji; 4: Northeast china; 5: Daxinganling; 6: Sichuan Basin; 7:Yangtze River Delta; and 8: Pearl River Delta.
The eastern part of China is in general more affected by theanthropogenic activities while western China more influenced bynatural sources such as dust storm. Jingjinji, Yangtze River delta,and Pearl River delta (indicated by rectangle 3, 7 and 8 in Fig. 1) arethe most developed regions in China undergoing rapid industrialdevelopment in recent years, wherein increasing anthropogenicemissions originate, having raised interest in the outflow ofchemically and radiatively important gases and aerosols. Theatmospheric pollution in Northeast (denoted by rectangle 4 in Fig.1,
Fig. 1. Location map of the eight regions for long-term trend analysis of AOD: Takli-makan (1), Gobi desert (2), Jingjinji (3), Northeast (4), Daxinganling (5), Sichuan basin(6), Yangtze River Delta (7), and Pearl River Delta (8).
the traditional heavy industrial base of China) is dominated by thecoal burning mixed with dust advected from west-northern China(Herman et al., 1997). There is presumably the least aerosol load inDaxinganling, which is mostly affected by the biomass burning inthe autumn (Wang et al., 2010). Sichuan Basin is surrounded by themountains, wherein the anthropogenic emission takes the leadcontributing the atmospheric pollution. Taklimakan and Gobidesert are two major sources of dust aerosols injected in to atmo-sphere during springs which just do not affect the surroundingregions, but also blanket areas far away from the source region bymeans of advection by atmospheric circulations and synopticweather system.
Taklimakan and Gobi desert dominate the injection of manydust aerosols into the atmosphere every spring and always blanketareas far outside of their source regions from advection of dust byatmospheric circulation and synoptic weather system.
2.2. Data
One of the biggest challenges in observational long-term aerosoltrend studies is obtaining the temporally and spatially consistentobservations for aerosols. TOMS AOD only takes the UV-absorbingaerosols into account by exploiting spectral absorption in thenear-UV region. In comparison toTOMS,MODIS retrievals are basedon aerosol scattering and use visible and near-IR channelmeasurements over the global except bright land surface (Kaufmanet al., 1997; Chu et al., 2002; Remer et al., 2005). In addition, thefootprint of both sensors is quite different (ca. 50 km of TOMS atnadir versus 10 km of MODIS). Large magnitude of difference,therefore, exists between TOMSeMODIS AODs, which makes itdifficult to contemplate a straightforward and unequivocal unifi-cation of the MODIS and TOMS datasets into combined aerosolclimatology. To quantify and mitigate all specific effects of thesedifferences is very difficult and likely impracticable, both scientif-ically and logistically. However, we attempt to identify the trends inAOD by performing an integrated analysis by combining the TOMS(1980e1999) and MODIS (2000e2008), which is the objective ofthis study.
The Nimbus-7 TOMS instrument operated from October 1978 toApril 1993, Meteor 3 TOMS worked from August 1991 to November1994, and Earth Probe TOMS data dated frommid-1996 to 2001 areselected as well for the study area shown in Fig. 1. Because MODIS ison board NASA’s Earth Observing System (EOS) Terra platform,launched in December 1999, we obtained the AOD products as ofthe year of 2000.
TOMS AOD data are available on a 1� � 1� grid, which areretrieved using the direct method at two near-ultraviolet wave-lengths (Torres et al., 1998). This method is based on the interactionbetween aerosols and the strong molecular scattering in the nearultraviolet, which produces spectral variations of the backscatteredradiances that can be used to separate aerosol absorption fromscattering effect, thus making detection of absorbing aerosolspossible over land and oceans. TOMS, therefore, provides retrievalsof total column ozone and AOD from 1979 to the present over a 1�
spatial scale, with a data gap from 1994 to mid-1996 (Torres et al.,2002). In most cases the TOMS-derived optical depths of UV-absorbing aerosols are within 30% of the AERONET observations,while non-absorbing optical depths agree to within 20% (Torreset al., 2002). Satellite observations from 1980 to 1999 from theTOMS satellite (Massie et al., 2004), therefore, help put theseobservations in a larger temporal and spatial context, comparedwith MODIS AOD (as of 2000).
Operational aerosol products of MODIS/Terra level 2 aerosoldatasets (MOD04 L2, Version 5.1) are acquired from National Aero-nautics and Space Administration (NASA) Level 1 and Atmosphere
J.-P. Guo et al. / Atmospheric Environment 45 (2011) 6802e6811 6805
Archive and Distribution System (LAADS) (http://ladsweb.nascom.nasa.gov/data/), which are retrieved using the dark target algorithm,which is originally developed by Kaufman et al. (1997) and thenrefined and parameterized by Levy et al. (2007). The MOD04 data hasnumerous aerosol physical and optical parameters at 10 � 10 km2
spatial resolution. We choose to aggregate the 10 km pixels into 1�
spatial scale to accommodate both MODIS and TOMS AOD products.The MODIS AOD (s) has been widely validated with ground-
based sun photometer AOD around the world by a spatio-temporal approach (Ichoku et al., 2002). The accuracy has beenclaimed that the MODIS aerosol retrievals over land surface, exceptin coastal zones, are foundwithin retrieval errorsDs¼�0.05� 0.15s(Chu et al., 2002; Remer et al., 2005).
2.3. Analysis methods
The accuracy and reliability of each 1� � 1� average throughaggregation ofMOD04 (at 10 kmpixel level) depends on the numberof individual values contributing to the average. In addition, given
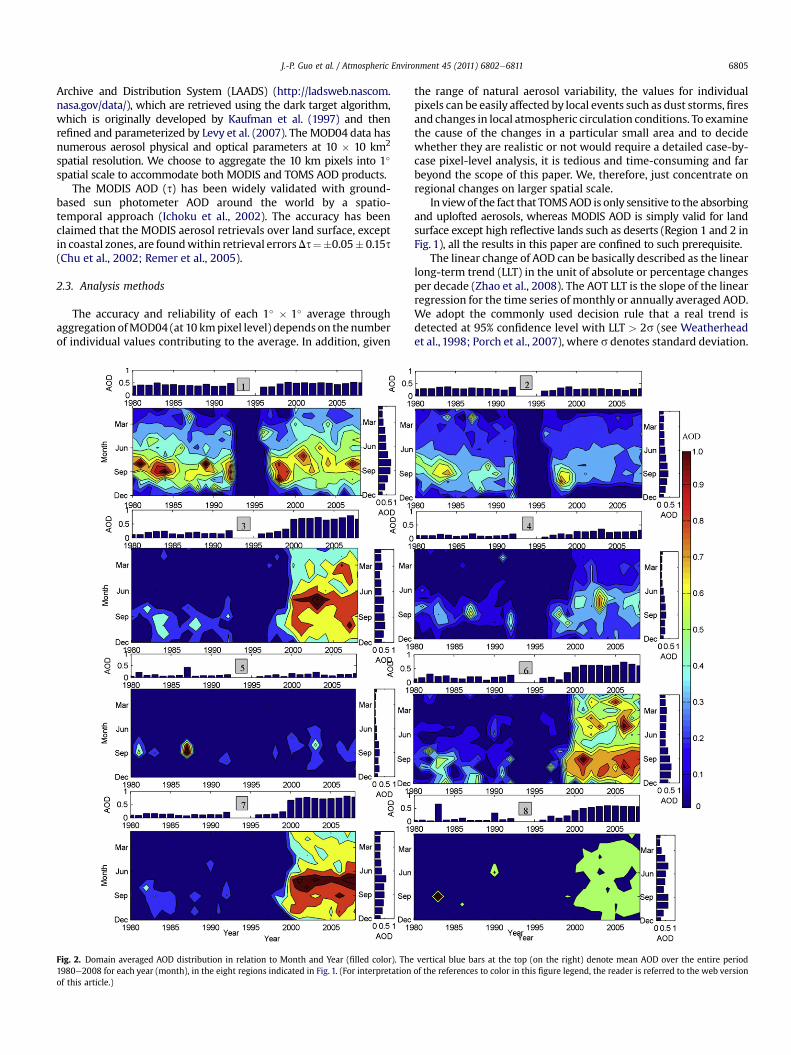
Fig. 2. Domain averaged AOD distribution in relation to Month and Year (filled color). The1980e2008 for each year (month), in the eight regions indicated in Fig. 1. (For interpretationof this article.)
the range of natural aerosol variability, the values for individualpixels can be easily affected by local events such as dust storms,firesand changes in local atmospheric circulation conditions. To examinethe cause of the changes in a particular small area and to decidewhether they are realistic or not would require a detailed case-by-case pixel-level analysis, it is tedious and time-consuming and farbeyond the scope of this paper. We, therefore, just concentrate onregional changes on larger spatial scale.
In viewof the fact that TOMSAOD is only sensitive to the absorbingand uplofted aerosols, whereas MODIS AOD is simply valid for landsurface except high reflective lands such as deserts (Region 1 and 2 inFig. 1), all the results in this paper are confined to such prerequisite.
The linear change of AOD can be basically described as the linearlong-term trend (LLT) in the unit of absolute or percentage changesper decade (Zhao et al., 2008). The AOT LLT is the slope of the linearregression for the time series of monthly or annually averaged AOD.We adopt the commonly used decision rule that a real trend isdetected at 95% confidence level with LLT > 2s (see Weatherheadet al., 1998; Porch et al., 2007), where s denotes standard deviation.
vertical blue bars at the top (on the right) denote mean AOD over the entire periodof the references to color in this figure legend, the reader is referred to the web version
J.-P. Guo et al. / Atmospheric Environment 45 (2011) 6802e68116806
3. Results and discussion
3.1. Domain-averaged temporal AOD trend analysis
Illustrated in Fig. 2 are the detailed temporal variations ofaerosol contents, both monthly and yearly, from January 1980through December 2008. Owing to the two different sources ofaerosol products using here, both the inter-monthly and inter-annual variation analysis of AOD in the entire eight regionsshown in Fig. 1 will be conducted separately, i.e. pre-2000 (TOMS)and post-2000 (MODIS).
TOMSAOD contains little information of non-absorbing aerosolssuch as sulfate aerosols in the boundary layer. This limitation
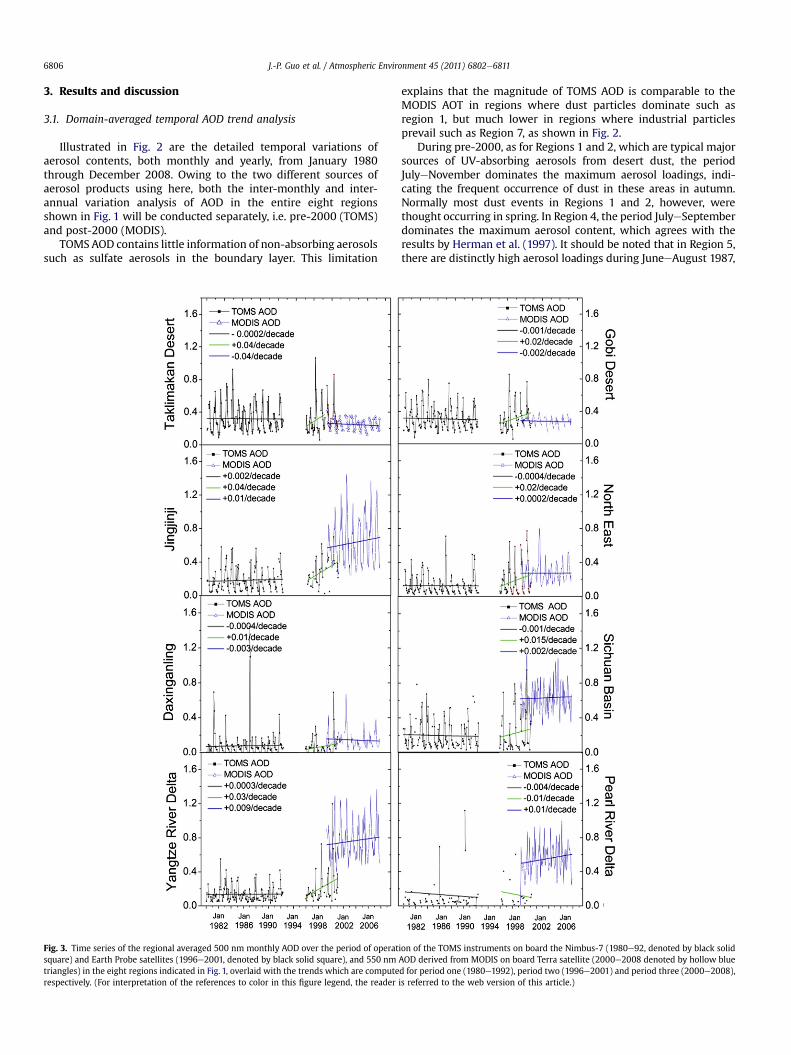
Fig. 3. Time series of the regional averaged 500 nm monthly AOD over the period of operatsquare) and Earth Probe satellites (1996e2001, denoted by black solid square), and 550 nmtriangles) in the eight regions indicated in Fig. 1, overlaid with the trends which are computerespectively. (For interpretation of the references to color in this figure legend, the reader
explains that the magnitude of TOMS AOD is comparable to theMODIS AOT in regions where dust particles dominate such asregion 1, but much lower in regions where industrial particlesprevail such as Region 7, as shown in Fig. 2.
During pre-2000, as for Regions 1 and 2, which are typical majorsources of UV-absorbing aerosols from desert dust, the periodJulyeNovember dominates the maximum aerosol loadings, indi-cating the frequent occurrence of dust in these areas in autumn.Normally most dust events in Regions 1 and 2, however, werethought occurring in spring. In Region 4, the period JulyeSeptemberdominates the maximum aerosol content, which agrees with theresults by Herman et al. (1997). It should be noted that in Region 5,there are distinctly high aerosol loadings during JuneeAugust 1987,
ion of the TOMS instruments on board the Nimbus-7 (1980e92, denoted by black solidAOD derived from MODIS on board Terra satellite (2000e2008 denoted by hollow blued for period one (1980e1992), period two (1996e2001) and period three (2000e2008),is referred to the web version of this article.)
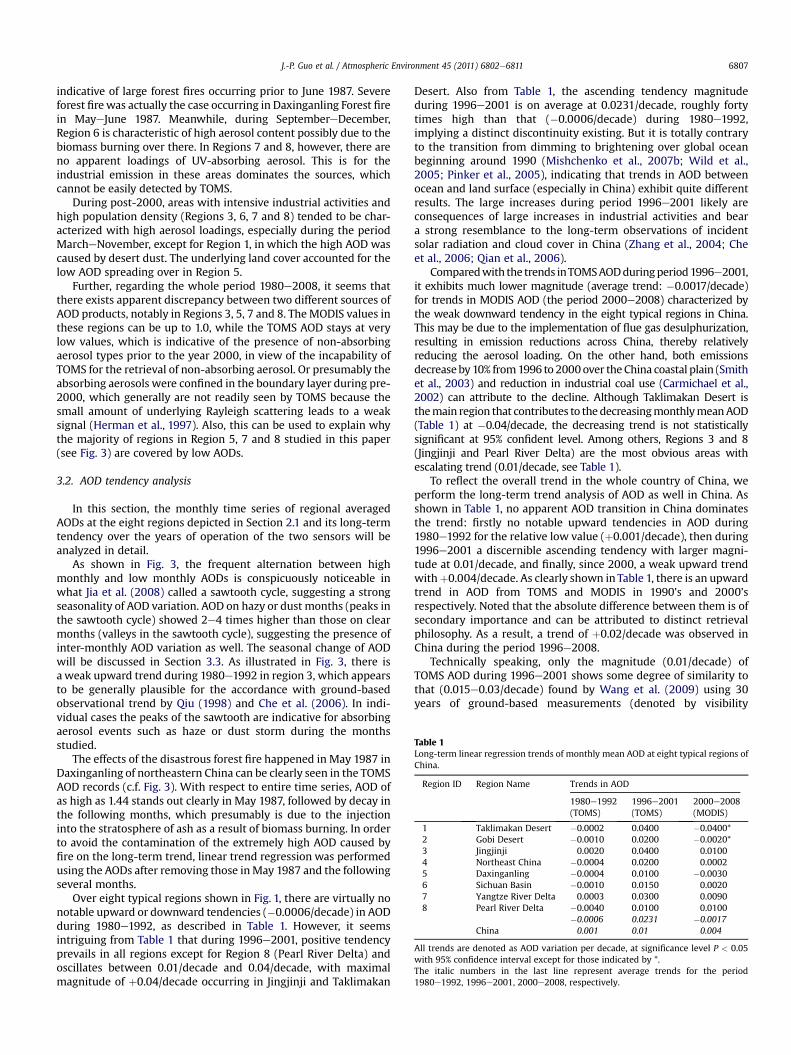
Table 1Long-term linear regression trends of monthly mean AOD at eight typical regions ofChina.
Region ID Region Name Trends in AOD
1980e1992(TOMS)
1996e2001(TOMS)
2000e2008(MODIS)
1 Taklimakan Desert �0.0002 0.0400 �0.0400*2 Gobi Desert �0.0010 0.0200 �0.0020*3 Jingjinji 0.0020 0.0400 0.01004 Northeast China �0.0004 0.0200 0.00025 Daxinganling �0.0004 0.0100 �0.00306 Sichuan Basin �0.0010 0.0150 0.00207 Yangtze River Delta 0.0003 0.0300 0.00908 Pearl River Delta �0.0040 0.0100 0.0100
�0.0006 0.0231 �0.0017China 0.001 0.01 0.004
All trends are denoted as AOD variation per decade, at significance level P < 0.05with 95% confidence interval except for those indicated by *.The italic numbers in the last line represent average trends for the period1980e1992, 1996e2001, 2000e2008, respectively.
J.-P. Guo et al. / Atmospheric Environment 45 (2011) 6802e6811 6807
indicative of large forest fires occurring prior to June 1987. Severeforest fire was actually the case occurring in Daxinganling Forest firein MayeJune 1987. Meanwhile, during SeptembereDecember,Region 6 is characteristic of high aerosol content possibly due to thebiomass burning over there. In Regions 7 and 8, however, there areno apparent loadings of UV-absorbing aerosol. This is for theindustrial emission in these areas dominates the sources, whichcannot be easily detected by TOMS.
During post-2000, areas with intensive industrial activities andhigh population density (Regions 3, 6, 7 and 8) tended to be char-acterized with high aerosol loadings, especially during the periodMarcheNovember, except for Region 1, in which the high AOD wascaused by desert dust. The underlying land cover accounted for thelow AOD spreading over in Region 5.
Further, regarding the whole period 1980e2008, it seems thatthere exists apparent discrepancy between two different sources ofAOD products, notably in Regions 3, 5, 7 and 8. TheMODIS values inthese regions can be up to 1.0, while the TOMS AOD stays at verylow values, which is indicative of the presence of non-absorbingaerosol types prior to the year 2000, in view of the incapability ofTOMS for the retrieval of non-absorbing aerosol. Or presumably theabsorbing aerosols were confined in the boundary layer during pre-2000, which generally are not readily seen by TOMS because thesmall amount of underlying Rayleigh scattering leads to a weaksignal (Herman et al., 1997). Also, this can be used to explain whythe majority of regions in Region 5, 7 and 8 studied in this paper(see Fig. 3) are covered by low AODs.
3.2. AOD tendency analysis
In this section, the monthly time series of regional averagedAODs at the eight regions depicted in Section 2.1 and its long-termtendency over the years of operation of the two sensors will beanalyzed in detail.
As shown in Fig. 3, the frequent alternation between highmonthly and low monthly AODs is conspicuously noticeable inwhat Jia et al. (2008) called a sawtooth cycle, suggesting a strongseasonality of AOD variation. AOD on hazy or dust months (peaks inthe sawtooth cycle) showed 2e4 times higher than those on clearmonths (valleys in the sawtooth cycle), suggesting the presence ofinter-monthly AOD variation as well. The seasonal change of AODwill be discussed in Section 3.3. As illustrated in Fig. 3, there isa weak upward trend during 1980e1992 in region 3, which appearsto be generally plausible for the accordance with ground-basedobservational trend by Qiu (1998) and Che et al. (2006). In indi-vidual cases the peaks of the sawtooth are indicative for absorbingaerosol events such as haze or dust storm during the monthsstudied.
The effects of the disastrous forest fire happened in May 1987 inDaxinganling of northeastern China can be clearly seen in the TOMSAOD records (c.f. Fig. 3). With respect to entire time series, AOD ofas high as 1.44 stands out clearly in May 1987, followed by decay inthe following months, which presumably is due to the injectioninto the stratosphere of ash as a result of biomass burning. In orderto avoid the contamination of the extremely high AOD caused byfire on the long-term trend, linear trend regression was performedusing the AODs after removing those inMay 1987 and the followingseveral months.
Over eight typical regions shown in Fig. 1, there are virtually nonotable upward or downward tendencies (�0.0006/decade) in AODduring 1980e1992, as described in Table 1. However, it seemsintriguing from Table 1 that during 1996e2001, positive tendencyprevails in all regions except for Region 8 (Pearl River Delta) andoscillates between 0.01/decade and 0.04/decade, with maximalmagnitude of þ0.04/decade occurring in Jingjinji and Taklimakan
Desert. Also from Table 1, the ascending tendency magnitudeduring 1996e2001 is on average at 0.0231/decade, roughly fortytimes high than that (�0.0006/decade) during 1980e1992,implying a distinct discontinuity existing. But it is totally contraryto the transition from dimming to brightening over global oceanbeginning around 1990 (Mishchenko et al., 2007b; Wild et al.,2005; Pinker et al., 2005), indicating that trends in AOD betweenocean and land surface (especially in China) exhibit quite differentresults. The large increases during period 1996e2001 likely areconsequences of large increases in industrial activities and beara strong resemblance to the long-term observations of incidentsolar radiation and cloud cover in China (Zhang et al., 2004; Cheet al., 2006; Qian et al., 2006).
Comparedwith the trends inTOMSAODduringperiod1996e2001,it exhibits much lower magnitude (average trend: �0.0017/decade)for trends in MODIS AOD (the period 2000e2008) characterized bythe weak downward tendency in the eight typical regions in China.This may be due to the implementation of flue gas desulphurization,resulting in emission reductions across China, thereby relativelyreducing the aerosol loading. On the other hand, both emissionsdecreaseby 10% from1996 to 2000over the China coastal plain (Smithet al., 2003) and reduction in industrial coal use (Carmichael et al.,2002) can attribute to the decline. Although Taklimakan Desert isthemain region that contributes to thedecreasingmonthlymeanAOD(Table 1) at �0.04/decade, the decreasing trend is not statisticallysignificant at 95% confident level. Among others, Regions 3 and 8(Jingjinji and Pearl River Delta) are the most obvious areas withescalating trend (0.01/decade, see Table 1).
To reflect the overall trend in the whole country of China, weperform the long-term trend analysis of AOD as well in China. Asshown in Table 1, no apparent AOD transition in China dominatesthe trend: firstly no notable upward tendencies in AOD during1980e1992 for the relative low value (þ0.001/decade), then during1996e2001 a discernible ascending tendency with larger magni-tude at 0.01/decade, and finally, since 2000, a weak upward trendwithþ0.004/decade. As clearly shown in Table 1, there is an upwardtrend in AOD from TOMS and MODIS in 1990’s and 2000’srespectively. Noted that the absolute difference between them is ofsecondary importance and can be attributed to distinct retrievalphilosophy. As a result, a trend of þ0.02/decade was observed inChina during the period 1996e2008.
Technically speaking, only the magnitude (0.01/decade) ofTOMS AOD during 1996e2001 shows some degree of similarity tothat (0.015e0.03/decade) found by Wang et al. (2009) using 30years of ground-based measurements (denoted by visibility
J.-P. Guo et al. / Atmospheric Environment 45 (2011) 6802e68116808
inverse), except for both TOMS AOD during 1980e1992 and MODISAOD during 2000e2008. Offsets where the trends in AOD varyquite different (both magnitude and signal) in different periods canpossibly be due to the differences in measurement system.
3.3. Seasonal characteristics of AOD
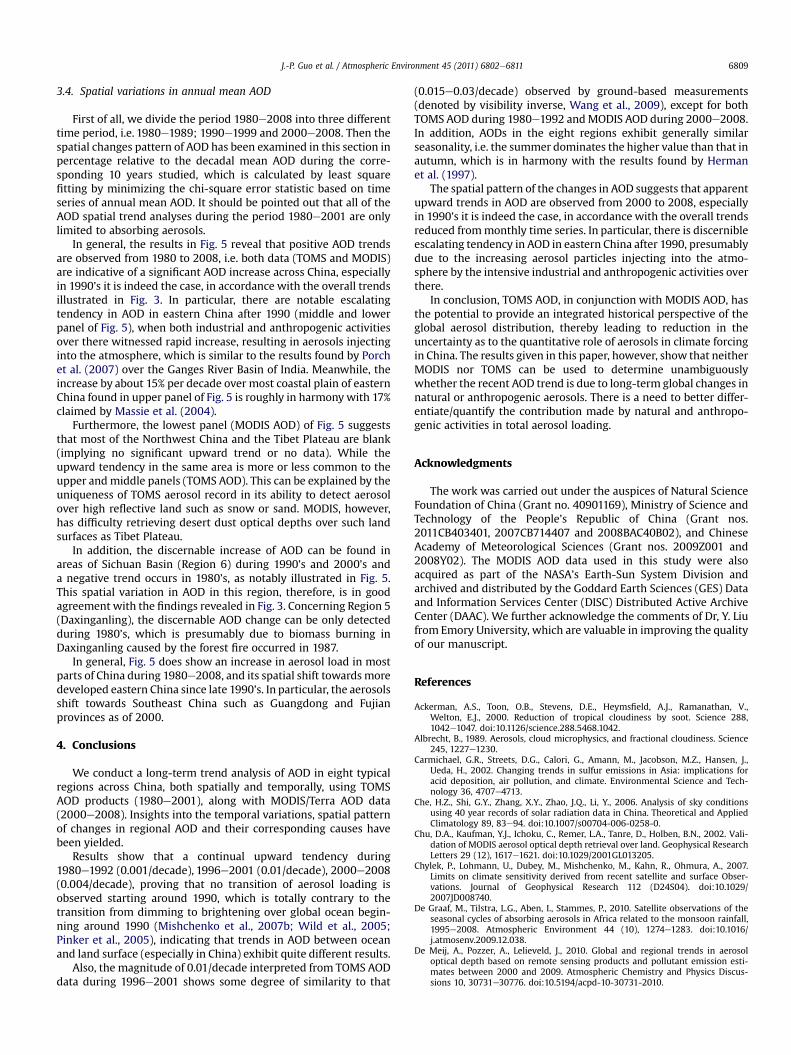
FromthepreviousSection3.2, theobtained timeseries shows inter-monthly AOD variation cycle like sawtooth in all the eight regions,suggesting strong aerosol seasonality in all regions is indeed thecase. The spring (MarcheAprileMay), summer (JuneeJulyeAugust),autumn (SeptembereOctobereNovember) and winter (Decem-bereJanuaryeFebruary) mean AOD in eight regions during1980e2008 are shown in Fig. 4. On account of the different source ofAOD (i.e. TOMS and MODIS) applied in this research, we study theseasonality during 1980e2001 (TOMS) and 2000e2008 (MODIS)separately.
According to Fig. 4, the climatology of AOD does not showsimilar seasonality during both periods of 1980e2001 and2000e2008 except in Region 4 (Northeast China), and Region 5(Daxinganling). In Region 4, the minimum AOD (about 0.18) isobserved in autumn while maximum (about 0.40) in winter forboth periods. Likewise, similar seasonal pattern is apparent inRegions 5 for both periods, i.e. AOD in this region has seasonalvariability with the minimum occurring during autumn and themaximum occurring during spring, obeying the precipitationpatterns and weather system common to this region.
Noted that during the period 1980e2001, all the eight regionsexcept Taklimakan Desert have the maximum aerosols in winter,possibly due to the emission increases caused by coal burning inthat season. There is not such seasonality during the period2000e2008, which can be explained by the high efficiency of TOMSin capturing the absorbing aerosols in winter. During the period2000e2008, spring almost dominates the maximum AOD inRegions 3, 6, 7 and 8. Such seasonality is partly due to the stagnantmeteorological conditions common in those regions.
Also, Fig. 4 reveals that AODs in the eight regions exhibit generallysimilar seasonality and the summer dominates the higher value thanthat in autumn, which is in harmony with the results found byHerman et al. (1997). During summer, photochemical interactionsare more active owing to higher air temperatures, which increaseaerosol concentrations in the atmosphere (Dickerson et al., 1997).
Fig. 4. Seasonal mean distribution of TOMS AOD during 1980e2001 (upper panel) andMODIS AOD during 2000e2008 (lower panel) in the eight regions given in Fig. 1.
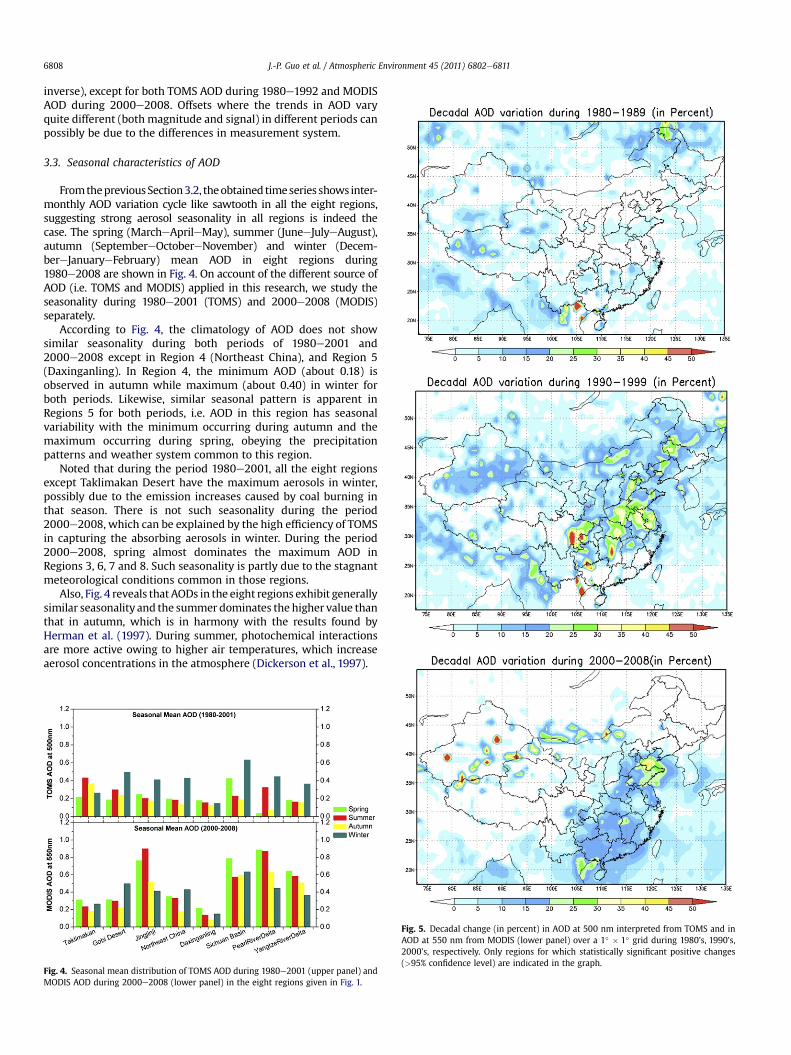
Fig. 5. Decadal change (in percent) in AOD at 500 nm interpreted from TOMS and inAOD at 550 nm from MODIS (lower panel) over a 1� � 1� grid during 1980’s, 1990’s,2000’s, respectively. Only regions for which statistically significant positive changes(>95% confidence level) are indicated in the graph.
J.-P. Guo et al. / Atmospheric Environment 45 (2011) 6802e6811 6809
3.4. Spatial variations in annual mean AOD
First of all, we divide the period 1980e2008 into three differenttime period, i.e. 1980e1989; 1990e1999 and 2000e2008. Then thespatial changes pattern of AOD has been examined in this section inpercentage relative to the decadal mean AOD during the corre-sponding 10 years studied, which is calculated by least squarefitting by minimizing the chi-square error statistic based on timeseries of annual mean AOD. It should be pointed out that all of theAOD spatial trend analyses during the period 1980e2001 are onlylimited to absorbing aerosols.
In general, the results in Fig. 5 reveal that positive AOD trendsare observed from 1980 to 2008, i.e. both data (TOMS and MODIS)are indicative of a significant AOD increase across China, especiallyin 1990’s it is indeed the case, in accordance with the overall trendsillustrated in Fig. 3. In particular, there are notable escalatingtendency in AOD in eastern China after 1990 (middle and lowerpanel of Fig. 5), when both industrial and anthropogenic activitiesover there witnessed rapid increase, resulting in aerosols injectinginto the atmosphere, which is similar to the results found by Porchet al. (2007) over the Ganges River Basin of India. Meanwhile, theincrease by about 15% per decade over most coastal plain of easternChina found in upper panel of Fig. 5 is roughly in harmony with 17%claimed by Massie et al. (2004).
Furthermore, the lowest panel (MODIS AOD) of Fig. 5 suggeststhat most of the Northwest China and the Tibet Plateau are blank(implying no significant upward trend or no data). While theupward tendency in the same area is more or less common to theupper andmiddle panels (TOMS AOD). This can be explained by theuniqueness of TOMS aerosol record in its ability to detect aerosolover high reflective land such as snow or sand. MODIS, however,has difficulty retrieving desert dust optical depths over such landsurfaces as Tibet Plateau.
In addition, the discernable increase of AOD can be found inareas of Sichuan Basin (Region 6) during 1990’s and 2000’s anda negative trend occurs in 1980’s, as notably illustrated in Fig. 5.This spatial variation in AOD in this region, therefore, is in goodagreement with the findings revealed in Fig. 3. Concerning Region 5(Daxinganling), the discernable AOD change can be only detectedduring 1980’s, which is presumably due to biomass burning inDaxinganling caused by the forest fire occurred in 1987.
In general, Fig. 5 does show an increase in aerosol load in mostparts of China during 1980e2008, and its spatial shift towardsmoredeveloped eastern China since late 1990’s. In particular, the aerosolsshift towards Southeast China such as Guangdong and Fujianprovinces as of 2000.
4. Conclusions
We conduct a long-term trend analysis of AOD in eight typicalregions across China, both spatially and temporally, using TOMSAOD products (1980e2001), along with MODIS/Terra AOD data(2000e2008). Insights into the temporal variations, spatial patternof changes in regional AOD and their corresponding causes havebeen yielded.
Results show that a continual upward tendency during1980e1992 (0.001/decade), 1996e2001 (0.01/decade), 2000e2008(0.004/decade), proving that no transition of aerosol loading isobserved starting around 1990, which is totally contrary to thetransition from dimming to brightening over global ocean begin-ning around 1990 (Mishchenko et al., 2007b; Wild et al., 2005;Pinker et al., 2005), indicating that trends in AOD between oceanand land surface (especially in China) exhibit quite different results.
Also, the magnitude of 0.01/decade interpreted from TOMS AODdata during 1996e2001 shows some degree of similarity to that
(0.015e0.03/decade) observed by ground-based measurements(denoted by visibility inverse, Wang et al., 2009), except for bothTOMS AOD during 1980e1992 andMODIS AOD during 2000e2008.In addition, AODs in the eight regions exhibit generally similarseasonality, i.e. the summer dominates the higher value than that inautumn, which is in harmony with the results found by Hermanet al. (1997).
The spatial pattern of the changes in AOD suggests that apparentupward trends in AOD are observed from 2000 to 2008, especiallyin 1990’s it is indeed the case, in accordance with the overall trendsreduced frommonthly time series. In particular, there is discernibleescalating tendency in AOD in eastern China after 1990, presumablydue to the increasing aerosol particles injecting into the atmo-sphere by the intensive industrial and anthropogenic activities overthere.
In conclusion, TOMS AOD, in conjunction with MODIS AOD, hasthe potential to provide an integrated historical perspective of theglobal aerosol distribution, thereby leading to reduction in theuncertainty as to the quantitative role of aerosols in climate forcingin China. The results given in this paper, however, show that neitherMODIS nor TOMS can be used to determine unambiguouslywhether the recent AOD trend is due to long-term global changes innatural or anthropogenic aerosols. There is a need to better differ-entiate/quantify the contribution made by natural and anthropo-genic activities in total aerosol loading.
Acknowledgments
The work was carried out under the auspices of Natural ScienceFoundation of China (Grant no. 40901169), Ministry of Science andTechnology of the People’s Republic of China (Grant nos.2011CB403401, 2007CB714407 and 2008BAC40B02), and ChineseAcademy of Meteorological Sciences (Grant nos. 2009Z001 and2008Y02). The MODIS AOD data used in this study were alsoacquired as part of the NASA’s Earth-Sun System Division andarchived and distributed by the Goddard Earth Sciences (GES) Dataand Information Services Center (DISC) Distributed Active ArchiveCenter (DAAC). We further acknowledge the comments of Dr, Y. Liufrom Emory University, which are valuable in improving the qualityof our manuscript.
References
Ackerman, A.S., Toon, O.B., Stevens, D.E., Heymsfield, A.J., Ramanathan, V.,Welton, E.J., 2000. Reduction of tropical cloudiness by soot. Science 288,1042e1047. doi:10.1126/science.288.5468.1042.
Albrecht, B., 1989. Aerosols, cloud microphysics, and fractional cloudiness. Science245, 1227e1230.
Carmichael, G.R., Streets, D.G., Calori, G., Amann, M., Jacobson, M.Z., Hansen, J.,Ueda, H., 2002. Changing trends in sulfur emissions in Asia: implications foracid deposition, air pollution, and climate. Environmental Science and Tech-nology 36, 4707e4713.
Che, H.Z., Shi, G.Y., Zhang, X.Y., Zhao, J.Q., Li, Y., 2006. Analysis of sky conditionsusing 40 year records of solar radiation data in China. Theoretical and AppliedClimatology 89, 83e94. doi:10.1007/s00704-006-0258-0.
Chu, D.A., Kaufman, Y.J., Ichoku, C., Remer, L.A., Tanre, D., Holben, B.N., 2002. Vali-dation of MODIS aerosol optical depth retrieval over land. Geophysical ResearchLetters 29 (12), 1617e1621. doi:10.1029/2001GL013205.
Chylek, P., Lohmann, U., Dubey, M., Mishchenko, M., Kahn, R., Ohmura, A., 2007.Limits on climate sensitivity derived from recent satellite and surface Obser-vations. Journal of Geophysical Research 112 (D24S04). doi:10.1029/2007JD008740.
De Graaf, M., Tilstra, L.G., Aben, I., Stammes, P., 2010. Satellite observations of theseasonal cycles of absorbing aerosols in Africa related to the monsoon rainfall,1995e2008. Atmospheric Environment 44 (10), 1274e1283. doi:10.1016/j.atmosenv.2009.12.038.
De Meij, A., Pozzer, A., Lelieveld, J., 2010. Global and regional trends in aerosoloptical depth based on remote sensing products and pollutant emission esti-mates between 2000 and 2009. Atmospheric Chemistry and Physics Discus-sions 10, 30731e30776. doi:10.5194/acpd-10-30731-2010.
J.-P. Guo et al. / Atmospheric Environment 45 (2011) 6802e68116810
Dickerson, R.R., Kondragunta, S., Stenchikov, G., Civerolo, K.L., Doddridge, B.G.,Holben, B.N., 1997. The impact of aerosols on solar ultraviolet radiation andphotochemical smog. Science 278, 827e830. doi:10.1126/science.278.5339.827.
Duncan, B.N., Martin, R.V., Staudt, A.C., Yevich, R., Logan, J.A., 2003. Interannual andseasonal variability of biomass burning emissions constrained by satelliteobservations. Journal of Geophysical Research 108 (D2), 4100. doi:10.1029/2002JD002378.
Geogdzhayev, I.V., Mishchenko, M.I., Terez, E.I., Terez, G.A., Gushchin, G.K., 2005.Regional advanced very high resolution radiometer-derived radiometer derivedclimatology of aerosol optical thickness and size. Journal of GeophysicalResearch 110, D23205. doi:10.1029/2005JD006170.
George, J.P., Harenduprakash, L., Mohan, M., 2008. Multi year changes of AerosolOptical Depth in the monsoon region of the Indian Ocean since 1986 as seen inthe AVHRR and TOMS data. Annales Geophysicae 26, 7e11. doi:10.5194/angeo-26-7-2008.
Hansen, J., Sato, M., Lacis, A., Ruedy, R., 1997. The missing climate forcing. Philo-sophical Transactions of the Royal Society of London, Series B 352, 231e240.doi:10.1098/rstb.1997.0018.
Herman, J.R., Bhartia, P.K., Torres, O., Hsu, C., Seftor, C., Celarier, E., 1997. Globaldistribution of UV-absorbing aerosols from Nimbus 7/TOMS data. Journal ofGeophysical Research 102 (D14), 16911e16922. doi:10.1029/96JD03680.
Ichoku, C., Chu, D.A., Mattoo, S., Kaufman, Y.J., Remer, L.A., Tanré, D., Slutsker, I.,Holben, B.N., 2002. A spatio-temporal approach for global validation andanalysis of MODIS aerosol products. Geophysical Research Letters 29 (12), 8006.doi:10.1029/2001GL013206.
Intergovernmental Panel on Climate Change (IPCC), 2007. Climate change 2007: thephysical science basis. In: Solomon, S., Qin, D., Manning, M., Chen, Z.,Marquis, M., Averyt, K., Tignor, M., Miller, H.L. (Eds.), Contribution of WorkingGroup I to the Fourth Assessment Report of the Intergovernmental Panel onClimate Change. Cambridge University Press, Cambridge, United Kingdom andNew York, NY, USA, p. 996.
Jeong, M.-J., Li, Z., 2005. Quality, compatibility and synergy analyses of globalaerosol products derived from the advanced very high resolution radiometersand total ozone mapping spectrometers. Journal of Geophysical Research 110(D10S08). doi:10.1029/2004JD00464 2005.
Jia, Y.T., Rahn, K.A., He, K.B., Wen, T.X., Wang, Y.S., 2008. A novel technique forquantifying the regional component of urban aerosol solely from its sawtoothcycles. Journal of Geophysical Research 113 (D21). doi:10.1029/2008JD010389.
Jin, M., Shepherd, J.M., 2005. On including urban landscape in land surface model ehow can satellite data help? Bulletin of the American Meteorological Society 86(5), 681e689. doi:10.1175/BAMS-86-5-681.
Kahn, R., Garay, M., Nelson, D., Yau, K., Bull, M., Martonchik, J., 2007. Satellite-derived aerosol optical depth over dark water from MISR and MODIS:comparisons with AERONET and implications for climatological studies. Journalof Geophysical Research 112, D18205. doi:10.1029/2006JD008175.
Kaufman, Y.J., Tanré, D., Remer, L.A., Vermote, E.F., Chu, A., Holben, B.N., 1997.Operational remote sensing of tropospheric aerosol over the land from EOS-MODIS. Journal of Geophysical Research 102 (14), 17051e17068.
King, D.M., Kaufman, Y.J., Tanre, D., Nakajima, T., 1999. Remote sensing of tropo-spheric aerosols from space: past, present, and future. Bulletin of the AmericanMeteorological Society 80 (11), 2229e2259. doi:10.1175/1520-0477(1999)080.1999.
Kinne, S., Schulz, M., Textor, C., Guibert, S., Balkanski, Y., Bauer, S.E., Berntsen, T.,Berglen, T.F., Boucher, O., Chin, M., Collins, W., Dentener, F., Diehl, T., Easter, R.,Feichter, J., Fillmore, D., Ghan, S., Ginoux, P., Gong, S., Grini, A., Hendricks, J.,Herzog, M., Horowitz, L., Isaksen, I., Iversen, T., Kirkevag, A., Kloster, S., Koch, D.,Kristjansson, J.E., Krol, M., Lauer, A., Lamarque, J.F., Lesins, G., Liu, X., Lohmann, U.,Montanaro, V., Myhre, G., Penner, J., Pitari, G., Reddy, S., Seland, O., Stier, P.,Takemura, T., Tie, X., 2006. An AeroCom initial assessmente optical properties inaerosol component modules of global models. Atmospheric Chemistry andPhysics 6, 1815e1834. doi:10.5194/acp-6-1815-2006.
Kinne, S., 2009. Remote sensing data combinations: superior global maps foraerosol optical depth. In: Kokhanovsky, A.A., de Leeuw, G. (Eds.), SatelliteAerosol Remote Sensing Over Land. Springer, Berlin.
Kokhanovsky, A.A., Breon, F.M., Cacciari, A., Carboni, E., Diner, D., Di Nicolantonio, W.,Grainger, R.G., Grey, W.M.F., Holler, R., Lee, K.H., Li, Z., North, P.R.J., Sayer, A.,Thomas, G., von Hoyningen-Huene, W., 2007. Aerosol remote sensing over land:satellite retrievals using different algorithms and instruments. AtmosphericResearch 85 (3e4), 372e394. doi:10.1016/j.atmosres.2007.02.008.
Koren, I., Kaufman, Y.J., Remer, L.A., Martins, J.V., 2004. Measurement of the effect ofbiomass burning aerosol on inhibition of cloud formation over the Amazon.Science 303, 1342e1345. doi:10.1126/science.1089424.
Lee, K.H., Li, Z., Kim, Y.J., Kokhanovsky, A., 2009. Aerosol monitoring from satelliteobservations: a history of three decades. In: Kim, Y.J., Platt, U., Gu, M.B., Iwaha-shi, H. (Eds.), Atmospheric and Biological Environmental Monitoring. Springer,pp. 13e38. doi:10.1007/978-1-4020-9674-7.
Levy, R.C., Remer, L.A., Mattoo, S., Vermote, E.F., Kaufman, Y.J., 2007. Second-gener-ation operational algorithm: retrieval of aerosol properties over land frominversion of Moderate Resolution Imaging Spectroradiometer spectral reflec-tance. Journal of Geophysical Research 112 (D13211). doi:10.1029/2006JD007811.
Li, C., Marufu, L.T., Dickerson, R.R., Li, Z., Wen, T., Wang, Y., Wang, P., Chen, H.,Stehr, J.W., 2007. In situ measurements of trace gases and aerosol opticalproperties at a rural site in northern China during East Asian Study of Tropo-spheric Aerosols: an International Regional Experiment 2005. Journal ofGeophysical Research 112 (D22S04). doi:10.1029/2006JD007592.
Lu, Z., Streets, D.G., Zhang, Q., Wang, S., Carmichael, G.R., Cheng, Y.F., Wei, C.,Chin, M., Diehl, T., Tan, Q., 2010. Sulfur dioxide emissions in China and sulfurtrends in East Asia since 2000. Atmospheric Chemistry and Physics 10,6311e6331. doi:10.5194/acp-10-6311-2010.
Luo, Y.F., Lu, D.R., Li, W.L., Zhou, X.J., 2000. Characteristics of atmospheric aerosoloptical depth variation over China in recent 30 years. Chinese Science Bulletin45 (14), 1328e1333.
Luo, Y.F., Lu, D.R., Zhou, X.J., 2001. Characteristics of the spatial distribution andyearly variation of aerosol optical depth over China in last 30 years. Journal ofGeophysical Research 106 (D13), 14501e14513. doi:10.1029/2001JD900030.
Massie, S.T., Torres, O., Smith, S.J., 2004. Total Ozone Mapping Spectrometer (TOMS)observations of increases in Asian aerosol in winter from 1979 to 2000. Journalof Geophysical Research 109 (D18211). doi:10.1029/2004JD004620.
Menon, S., Hansen, J., Nazarenko, L., Luo, Y.F., 2002. Climate effects of black carbonaerosols in China and India. Science 297, 2250e2253. doi:10.1126/science.1075159.
Mishchenko, M.I., Geogdzhaev, I.V., 2007. Satellite remote sensing reveals regionaltropospheric aerosol trends. Optics Express 15, 7423e7438. doi:10.1364/OE.15.007423.
Mishchenko, M.I., Geogdzhaev, I.V., Cairns, B., Carlson, B.E., Chowdhary, J.,Lacis, A.A., Liu, L., Rossow, W.B., Travis, L.D., 2007a. Past, present, and future ofglobal aerosol climatologies derived from satellite observations: a perspective.Journal of Quantitative Spectroscopy and Radiative Transfer 106, 325e347.doi:10.1016/j.jqsrt.2007.01.007.
Mishchenko, M.I., Geogdzhaev, I.V., Rossow, W.B., Cairns, B., Carlson, B.E., Lacis, A.A.,Liu, L., Travis, L.D., 2007b. Long-term satellite record reveals likely recentaerosol trend. Science 315 (5818), 1543. doi:10.1126/science.1136709.
Mishchenko, M.I., Geogdzhayev, I.V., Liu, L., Lacis, A.A., Cairns, B., Travis, L.D., 2009.Towardunified satellite climatology of aerosol properties:what do fully compatibleMODIS and MISR aerosol pixels tell us? Journal of Quantitative Spectroscopy andRadiative Transfer 110 (6e7), 402e408. doi:10.1016/j.jqsrt.2009.01.007.
Pincus, R., Baker, M.B., 1994. Effect of precipitation on the albedo susceptibility of cloudsin the marine boundary layer. Nature 372, 250e252. doi:10.1038/372250a0.
Pinker, R.T., Zhang, B., Dutton, E.G., 2005. Do satellites detect trends in surface solarradiation? Science 308 (5723), 850e854. doi:10.1126/science.1103159.
Porch, W., Chylek, P., Dubey, M., Massie, S., 2007. Trends in aerosol optical depth forcities in India. Atmospheric Environment 41 (35), 7524e7532. doi:10.1016/j.atmosenv.2007.05.055.
Qian, Y., Kaiser, D.P., Leung, L.R., Xu, M., 2006. More frequent cloud-free sky and lesssurface solar radiation in China from 1955 to 2000. Geophysical ResearchLetters 33 (L01812). doi:10.1029/2005GL024586.
Qiu, J., 1998. A method to determine atmospheric aerosol optical depth using totaldirect solar radiation. Journal of Atmospheric Sciences 55, 744e757.doi:10.1175/1520-0469(1998)055<0744:AMTDAA>2.0.CO;2.
Ramanathan, V., Chung, C., Kim, D., Bettge, T., Buja, L., Kiehl, J.T., Washingtonz, W.M.,Fu, Q., Sikka, D.R., Wild, M., 2005. Atmospheric brown clouds: impacts on SouthAsian climate and hydrological cycle. Proceedings of the National Academy ofSciences 102 (15), 5326e5333.
Remer, L.A., Kaufman, Y.J., Tanre, D., Mattoo, S., Chu, D.A., Martins, J.V., Li, R.R.,Ichoku, C., Levy, R.C., Kleidman, R.G., Eck, T.F., Vermote, E., Holben, B.N., 2005.The MODIS aerosol algorithm, products and validation. Journal of AtmosphericSciences 62, 947e973. doi:10.1175/JAS3385.1.
Remer, L.A., Kleidman, R.G., Levy, R.C., Kaufman, Y.J., Tanre, D., Mattoo, S.,Martins, J.V., Ichoku, C., Koren, I., Yu, H., Holben, B.N., 2008. Global aerosolclimatology from the MODIS satellite sensors. Journal of Geophysical Research113 (D14S07). doi:10.1029/2007JD009661 2008.
Rosenfeld, D., 2000. Suppression of rain and snow by urban and industrial airpollution. Science 287 (5459), 1793e1796. doi:10.1126/science.287.5459.1793.
Smith, S.J., Andres, R., Conception, E., Lurz, J., 2003. Historical Sulfur Dioxide Emissions1850e2000: Methods and Results. Pacific Northwest National Laboratory Report:PNNL-14537. Pacific Northwest National Laboratory, Richland, Washington.
Stern, D.I., 2006. Reversal of the trend in global anthropogenic sulfur emissions. GlobalEnvironmental Change 16, 207e220. doi:10.1016/j.gloenvcha.2006.01.001.
Torres, O., Bhartia, P., Herman, J., Syniuk, A., Ginoux, P., Holben, B.N., 2002. A longterm record of aerosol optical depth from TOMS observations and comparisonto AERONET measurements. Journal of Atmospheric Sciences 59, 398e413.doi:10.1175/1520-0469(2002)059<0398:ALTROA>2.0.CO;2.
Torres, O., Bhartia, P., Herman, J., Ahmad, Z., Gleason, J., 1998. Derivation of aerosolproperties from satellite measurements of backscattered ultraviolet radiation:theoretical basis. Journal of Geophysical Research 103 (D14), 17099e17110.doi:10.1029/98JD00900.
Twomey, S., 1977. The influence of pollution on the shortwave albedo of clouds.Journal of Atmospheric Sciences 34, 1149e1152. doi:10.1175/1520-0469(1977)034<1149:TIOPOT>2.0.CO;2.
Wang, P., Che, H.Z., Zhang, X.C., Song, Q.L., Wang, Y.Q., Zhang, Z.H., Dai, H., Yu, D.J.,2010. Aerosol optical properties of regional background atmosphere inNortheast China. Atmospheric Environment 44, 4404e4412. doi:10.1016/j.atmosenv.2010.07.043.
Wang, K.C., Dickinson, R.E., Liang, S.L., 2009. Clear sky visibility has decreased overland globally from 1973 to 2007. Science 323 (5920), 1468e1470. doi:10.1126/science.1167549.
Weatherhead, E.C., Reinsel, G.C., Tiao, G.C., Meng, X.-L., Choi, D., Cheang, W.-K.,Keller, T., DeLuisi, J., Wuebbles, D.J., Kerr, J.B., Miller, A.J., Oltmans, S.J.,Frederick, J.E., 1998. Factors affecting the detection of trends: statisticalconsiderations and applications to environmental data. Journal of GeophysicalResearch 103, 17149e17161. doi:10.1029/98JD00995.

J.-P. Guo et al. / Atmospheric Environment 45 (2011) 6802e6811 6811
Wild, M., Gilgen, H., Roesh, A., Ohmura, A., Long, C.N., Dutton, E.G., Forgan, B.,Kallis, A., Russak, V., Tsvetkov, A., 2005. From dimming to brightening: decadalchanges in solar radiation at Earth’s surface. Science 308, 847e850. doi:10.1126/science.1103215.
Zhang, Y.L., Qin, B.Q., Chen, W.M., 2004. Analysis of 40 year records of solar radi-ation data in Shanghai, Nanjing and Hangzhou in Eastern China. Theoretical andApplied Climatology 78, 217e227.
Zhang, J., Reid, J.S., 2010. A decadal regional and global trend analysis of the aerosoloptical depth using a data-assimilation grade over-water MODIS and Level 2
MISR aerosol products. Atmospheric Chemistry and Physics 10, 10949e10963.doi:10.5194/acp-10-10949-2010.
Zhao, F., Li, Z., 2007. Estimation of aerosol single scattering albedo from solar directspectral radiance and total broadband irradiances measured in China. Journal ofGeophysical Research 112, D22S03. doi:10.1029/2006JD007384.
Zhao, TX.-P., Laszlo, I., Guo, W., Heidinger, A., Cao, C., Jelenak, A., Tarpley, D.,Sullivan, J., 2008. Study of long-term trend in aerosol optical thickness observedfrom operational AVHRR satellite instrument. Journal of Geophysical Research113, D07201. doi:10.1029/2007JD009061.