Embed Size (px)
Citation preview

Spatio-Temporal Variability of Spatio-Temporal Variability of the North American Monsoonthe North American Monsoon
Balaji Rajagopalan
Department of Civil, Env. And Arch. Engineering (CEAE) and CIRES
Katrina Grantz, Edie ZagonaCEAE/CADSWES
& Martyn Clark (CIRES)
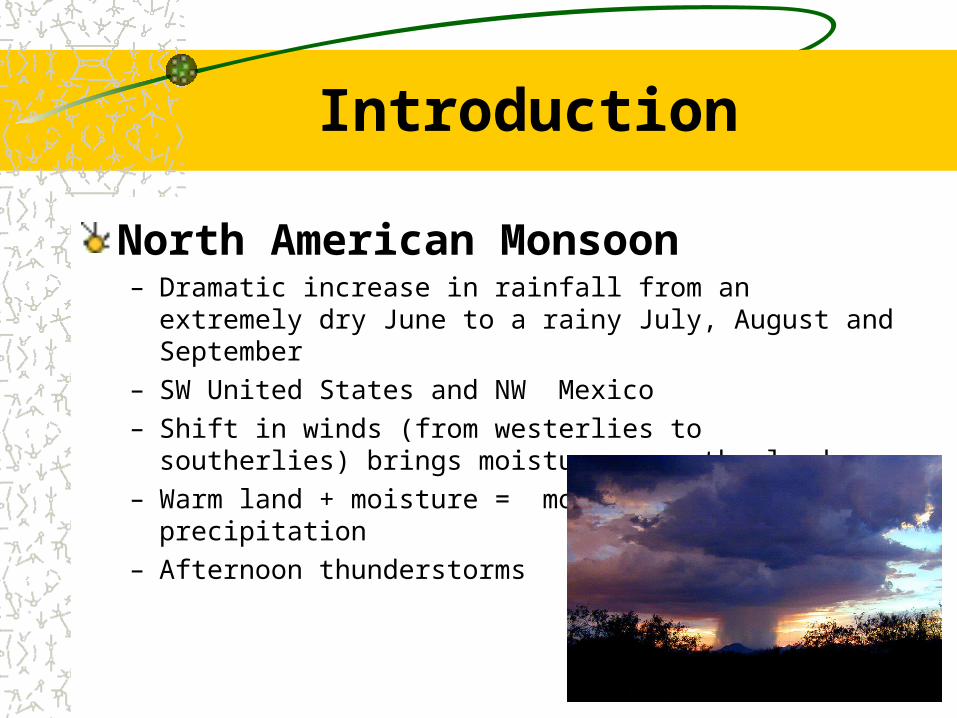
Introduction
North American Monsoon– Dramatic increase in rainfall from an extremely dry June to a rainy July,
August and September– SW United States and NW Mexico – Shift in winds (from westerlies to southerlies) brings moisture over the land– Warm land + moisture = monsoonal precipitation– Afternoon thunderstorms

Introduction
Significant portion (30-50%) of annual precipitation falls in the summer months in Arizona and New Mexico
Water management perspective: important to predict the strength of the monsoon
– for water supply and environmental planning
Few studies on timing, streamflow, and implications for water management
– important to local communities in the monsoon region
2 4 6 8 10 12
0.5
1.5
Arizona Monthly Average Precipitation
Month
Pre
cipi
tatio
n (in
)
2 4 6 8 10 12
0.5
1.5
New Mexico Monthly Average Precipitation
Month
Pre
cipi
tatio
n (in
)
Jan Jun Dec
2 4 6 8 10 12
0.5
1.5
Arizona Monthly Average Precipitation
Month
Pre
cipi
tatio
n (in
)
2 4 6 8 10 12
0.5
1.5
New Mexico Monthly Average Precipitation
Month
Pre
cipi
tatio
n (in
)
Jan Jun Dec

North American Monsoon Experiment Schematic
Schematic Illustrating the multi-tiered approach of the North American Monsoon Experiment (NAME). The schematic also shows mean (July-September 1979-1995) 925-hPa vector wind and merged satellite estimates and raingauge observations of precipitation (shading) in millimeters.

North American Monsoon Schematic

Past Studies
Spatial and temporal variability depends on:– Location of subtropical jet, topography, SSTs …
Moisture comes from Gulf of California and Gulf of MexicoWet winter Early monsoon onset and vice-versa (Higgins & Shi, 2000)
General negative correlation with previous winter’s precipitation (Gutzler, 2002; Higgins & Shi, 2000) – related to North Pacific SSTs
El Nino weaker/southward monsoon ridge (Castro, 2000)
Increased monsoonal precipitation with increased soil moisture (Toshi, et al. 2003; Small,2000)

Past StudiesHiggins et al. 1998
Composite evolution of the 30-day running mean area average precipitation (units: mm/day) over Arizona and New Mexico for wet monsoons (dotted line), dry monsoons (dot-dashed line) and all (1963-94) monsoons (solid line).
The average date of monsoon onset is July 1 for wet monsoons, July 11 for dry monsoons and July 7 for all monsoons (defined as day 0 in each case).

MotivationSeasonal cycle shifts in Western US hydroclimatology
(Regonda et al. 2005)
Regonda, S., B. Rajagopalan, M. Clark, and J. Pitlick, 2005: Seasonal Regonda, S., B. Rajagopalan, M. Clark, and J. Pitlick, 2005: Seasonal cycle shifts in hydroclimatology over the Western US, cycle shifts in hydroclimatology over the Western US, Journal of ClimateJournal of Climate..
Earlier Flow (#days) Later Flows (#days) Days Vs. Elevation (m)
50% annual flow of water year

Cont’dTemp. spell
(Days)
April 1 SWE(cm)
Winter Precip.(cm)
Annual flows
(100 cfs)
Decrease in quantity Increase in quantity

Motivation
What are the large-scale Ocean/Atmospheric/Land drivers of space-time (timing and amount) variability of N. American Monsoon (interannual / decadal)?Potential Long-lead Precitability?Implications for water management.
Need a systematic investigation of the monsoon rainfall attributes and also the streamflows.

Outline
Study area, dataThe research project– Precipitation diagnostics– Streamflow diagnostics (preliminary
results)
– Water management issues– Incorporating forecasts into water
management

Study Area
Monsoon Region (NAME II): Arizona and New Mexico
Water Management: Gila River– Flows from New Mexico through Arizona,
joins Colorado River at Yuma, Arizona
AZ NM

Data
Precipitation– Monthly climate division data (1948-2004)
• NM (8 divisions), AZ (7 divisions)– Daily NWS co-op data (1948-1999)
• 219 stations across AZ and NM
Temperature, PDSI– Monthly climate division data (1948-2004)
Large-scale climate variables– Monthly NOAA NCEP-NCAR reanalysis data (1948-2004)– SST, precipitable water, geopotential heights, vector winds
Streamflow– Daily HCDN streamflow (1948-1999)– USGS daily/monthly values (1948-2005)
Co-op Stations
The Research Project
Precipitation diagnosticsStreamflow diagnosticsWater management issuesIncorporating forecasts into water management

Precipitation Diagnostics
Monsoon cycleMonsoon rainfallPlausible hypothesisAntecedent land conditionsAntecedent ocean & Atmospheric conditions

Precipitation Diagnostics:Monsoon Cycle
Monsoon ‘timing’ at each co-op station• Calculate Julian day when 10, 25, 50, 75, and 90th percentile of the
monsoon season (July-Sept) precipitation has fallen (each station, each year)
-- Julian day time series for each threshold for each station
• Perform trend analysis on the Julian day time series
10th, 25th, 50th, 75th, and 90th percentiles capture the entire ‘monsoon cycle’ – onset, peak and recedence

Precipitation Diagnostics:Monsoon Cycle
Use Spearman rank correlation to detect trends A nonparametric (distribution-free) correlation statistic
– doesn’t require that data be normally distributed– similar to Pearson’s R, except that the values are converted to ranks
before computing the correlation coefficient.
where D is the difference of the rank numbers. (Spearman, 1904)– gives p-value and slope
Correlatate value with time to get trendResults similar for Pearson’s R

5th Percentile
25th Percentile
50th Percentile
75th Percentile
95th Percentile
TrendsClimatological
Julian day
= later= earlier
•Largest circle > 21 days
•Second largest ~ 15-21 days
•Second smallest ~ 10-15 days
•Smallest circle < 10 days
•Filled circles significant at 90%
< July 19th Jul 20th ~ 29th
Jul 20th ~ Aug 8th Aug 9th ~ Aug 18th Aug 19th ~ 28th > Aug 29th
•Entire Monsoon Cycle Shifted Later•Approx. 10~15 days shift

NM Division 3
0
0.5
1
1.5
2
2.5
3
3.5
1 2 3 4 5 6 7 8 9 10 11 12
Month
Pre
cip
(in
)
Pre-1975
Post-1975
NM Division 6
0
0.5
1
1.5
2
2.5
3
3.5
4
1 2 3 4 5 6 7 8 9 10 11 12
Month
Pre
cip
(in
)
Pre-1975
Post-1975
AZ Division 2
0
0.5
1
1.5
2
2.5
3
1 2 3 4 5 6 7 8 9 10 11 12
Month
Pre
cip
(in
)
Pre-1975
Post-1975
AZ Division 7
0
0.5
1
1.5
2
2.5
3
3.5
1 2 3 4 5 6 7 8 9 10 11 12
Month
Pre
cip
(in
)
Pre-1975
Post-1975

Precipitation Diagnostics:Monsoon Rainfall Amount
Monsoon rainfall amount at each station and climate division
– July, August, September, July - September
Spearman rank correlation to compute the trends

Precipitation Diagnostics:Monsoon Rainfall
Decrease in JulyIncrease in August and September (esp in NM)July- September: NM increase, AZ mixed/decreaseConsistent with the monsoon timing results
= precip
= precip
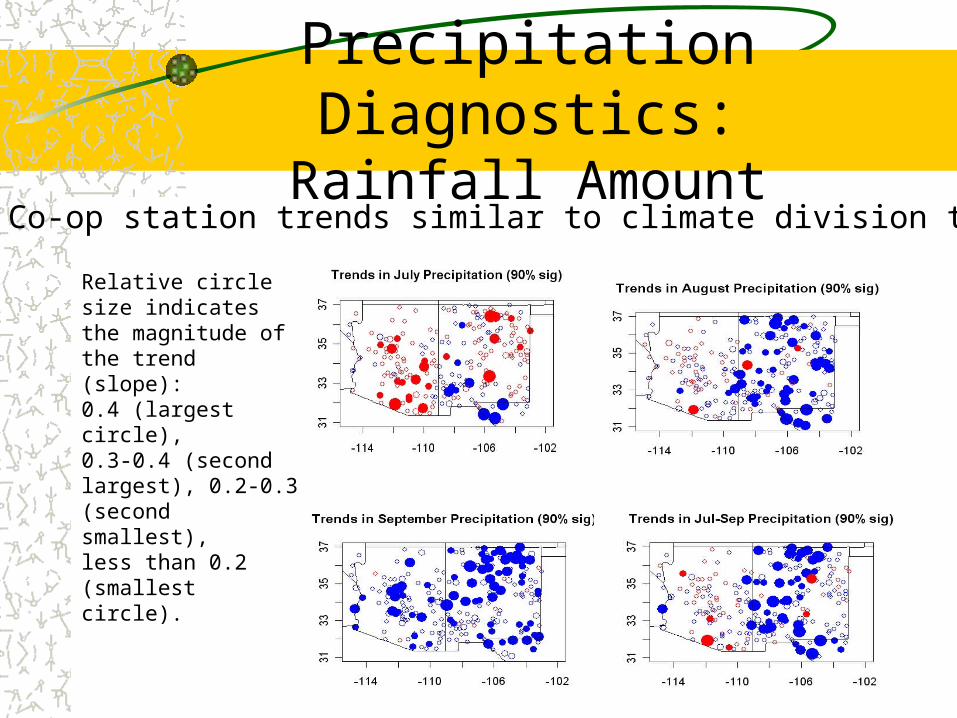
Precipitation Diagnostics:Rainfall Amount
Co-op station trends similar to climate division trends
Relative circle size indicates the magnitude of the trend (slope): 0.4 (largest circle), 0.3-0.4 (second largest), 0.2-0.3 (second smallest), less than 0.2 (smallest circle).

Precipitation Diagnostics:Monsoon Rainfall
-114 -112 -110 -108 -106 -104
1960
1970
1980
1990
Shift in Strength of Monsoon- August (5yr moving avg)
Longitude
Yea
r
Is the trend a steady increase, or jump, or … ?August precipitation over AZ and NM– 5 year moving windowEastern region (NM) gets wetter in the later periodWestern region (Arizona) trend not as distinctShift most apparent after a dry spell in the late 1970s

Precipitation Diagnostics:Monsoon Moisture
Trends in Palmer drought severity index (PDSI) and 850mb precipitable water Corroborate results seen in precipitation (more so with precipitable water)
July August September July-September

Precipitation Diagnostics:Plausible Hypothesis
What is driving the delay in the monsoon cycle?
Hypothesis:
Increased pre-monsoon (antecedent winter/spring) soil moisture longer summer heating to set up the land-ocean gradient delaying the monsoon cycleWetter antecedent winter / spring conditions in southwest driven by increased El Nino Southern Oscillation (ENSO) activity in recent decades

Precipitation Diagnostics:Antecedent Land Conditions
December- May precipitation and PDSI trends Increasing trend in southwest, decreasing trend in northwest– classic ENSO teleconnection pattern
= precip/moisture
= precip/moisture
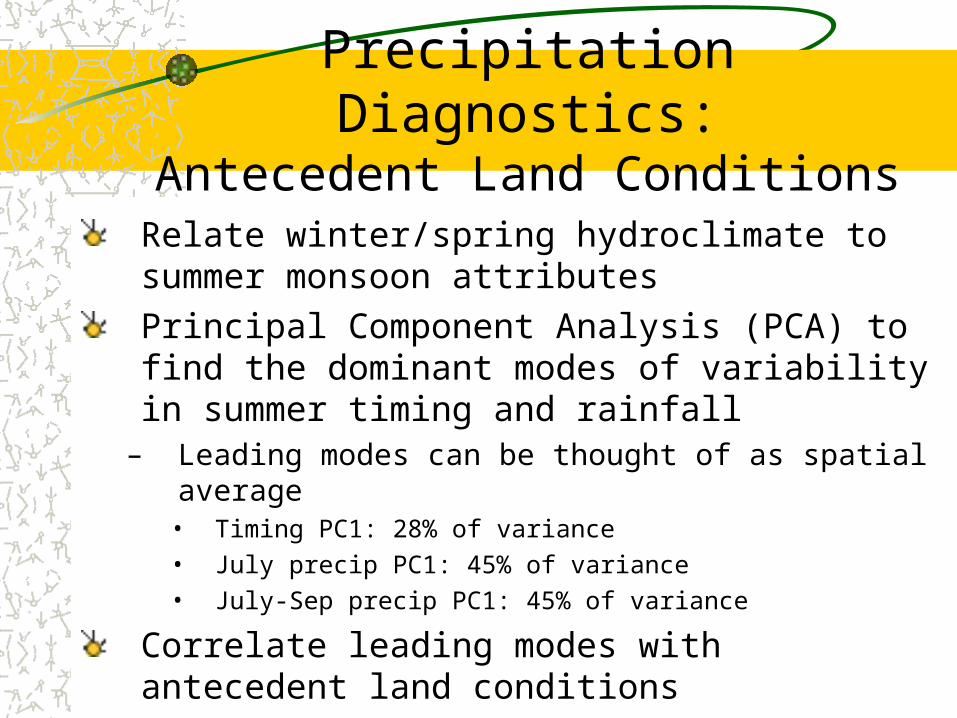
Precipitation Diagnostics:Antecedent Land Conditions
Relate winter/spring hydroclimate to summer monsoon attributesPrincipal Component Analysis (PCA) to find the dominant modes of variability in summer timing and rainfall
– Leading modes can be thought of as spatial average• Timing PC1: 28% of variance• July precip PC1: 45% of variance • July-Sep precip PC1: 45% of variance
Correlate leading modes with antecedent land conditions

Precipitation Diagnostics:Antecedent Land Conditions
Correlate 50th and 10th percentile timing PC1 with antecedent precipitation/PDSI across western USSignificant positive (negative) correlations in southwest (northwest) Correlations are stronger for the 10th percentile timing PC onset of monsoon more strongly affected by antecedent soil conditions
= negative correlation
= positive correlation

Precipitation Diagnostics:Antecedent Land Conditions
Correlate July and Jul-Sep precipitation PC1 with antecedent precipitation/PDSI across western USSignificant negative (positive) correlations in southwest (northwest) This negative correlation between winter/spring precipitation and monsoon precipitation noted by Gutzler (2000)Correlations are stronger for July PC Early monsoon rainfall more strongly affected by antecedent soil conditions
= negative correlation
= positive correlation
Precipitation Diagnostics:Antecedent Ocean-Atmospheric Conditions
Large-scale Drivers of summer variability
Correlate leading modes (PCs) of monsoon rainfall and timing with antecedent Ocean & Atmospheric variables.

Timing:Antecedent Ocean Conditions
Correlate summer timing PCs with winter/spring SST and Z500Positive correlations in equatorial Pacific- ENSO pattern
– increased SSTs in winter/spring go with increased Julian day (i.e., delayed monsoon)
– Correlations slightly stronger for 10th percentile (onset of monsoon)50th percentile Timing PC 10th percentile Timing PC
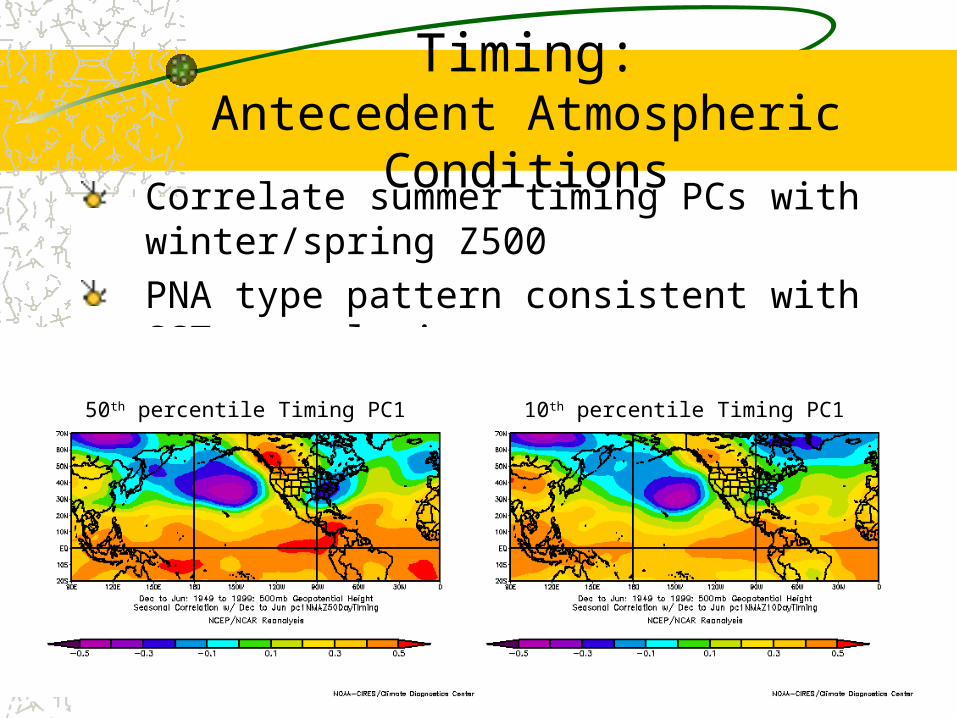
Timing:Antecedent Atmospheric Conditions
Correlate summer timing PCs with winter/spring Z500PNA type pattern consistent with SST correlations
50% Timing PC
10% Timing PC
50th percentile Timing PC1 10th percentile Timing PC1

Rainfall amount:Antecedent Ocean Conditions
Correlate summer rainfall PCs with winter/spring SSTsJuly: negative correlations in equatorial Pacific – La Nina pattern
– Decreased SSTs in winter/spring go with increased July precipitation (La Nina typically goes with decreased winter/spring precip -> increased July precipitation
– Correlations flipped forAug, almost no patternfor Sep and Jul-Sep
– Early monsoon precipamount affected by SSTsbut later monsoon may have different drivers

Rainfall amount:Antecedent Ocean Conditions
Correlate monsoon rainfall PCs with winter/spring Z500Results consistent with SST correlationsJuly: PNA type pattern
– Correlations weaker and reversed sign for Aug,Sep and Jul-Sep.
– Early monsoon precipamount affected by pre-monsoon Pacific Oceanand Atmospheric features,but later monsoon may have different drivers
July Aug
Sep Jul-Sep

Rainfall Amount:High-Low Composites
Aug and Sep rainfall extremes impacted by the surrounding Ocean/Atmospheric status
Jul
Aug
Sep
Winds Z500 SST

Precipitation Diagnostics:Conclusions
Entire Monsoon cycle shifted approx 10~15 days later in recent decadesConsequently, decreased rainfall in July and increase in Aug and SeptIncreased pre-monsoon precip/soil moisture
(driven largely by large-scale Pacific Ocean/Atmospheric features)Leading modes of Monsoon timing and early (July) rainfall strongly related to pre-monsoon Ocean/Atmospheric/Land featuresAug-Sep rainfall driven by local Ocean-Atmospheric conditions
Significant implications for long-lead Monsoon forecast

Proposed Hypothesis
Increased winter/spring wetness requires longer summer heating to set up adequate land-ocean gradient delayed monsoon cycle reduced early Monsoon rainfall.Large scale Ocean-Atmosphere conditions in Winter as main drivers.
LAND(pre-monsoon soil moisture)
Winter SST/ ENSO
MONSOON(timing and amount)

The Research Project
Precipitation diagnosticsStreamflow diagnosticsWater management issuesIncorporating forecasts into water management
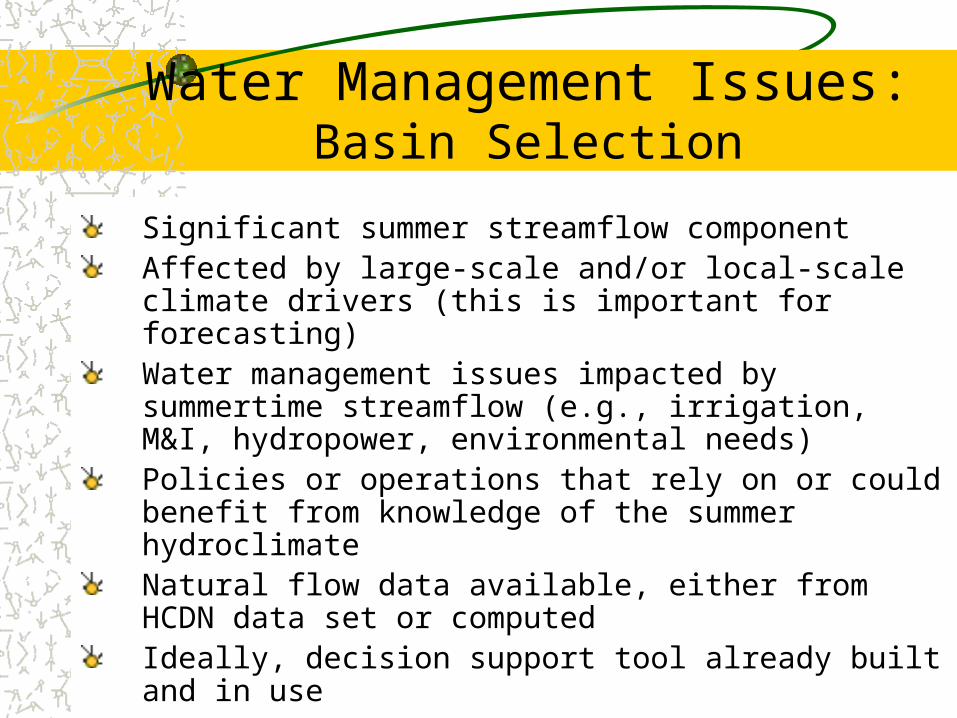
Water Management Issues:Basin Selection
Significant summer streamflow componentAffected by large-scale and/or local-scale climate drivers (this is important for forecasting)Water management issues impacted by summertime streamflow (e.g., irrigation, M&I, hydropower, environmental needs)Policies or operations that rely on or could benefit from knowledge of the summer hydroclimateNatural flow data available, either from HCDN data set or computedIdeally, decision support tool already built and in use

Water Management Issues:Gila River
Gila River BasinArizona and New Mexico
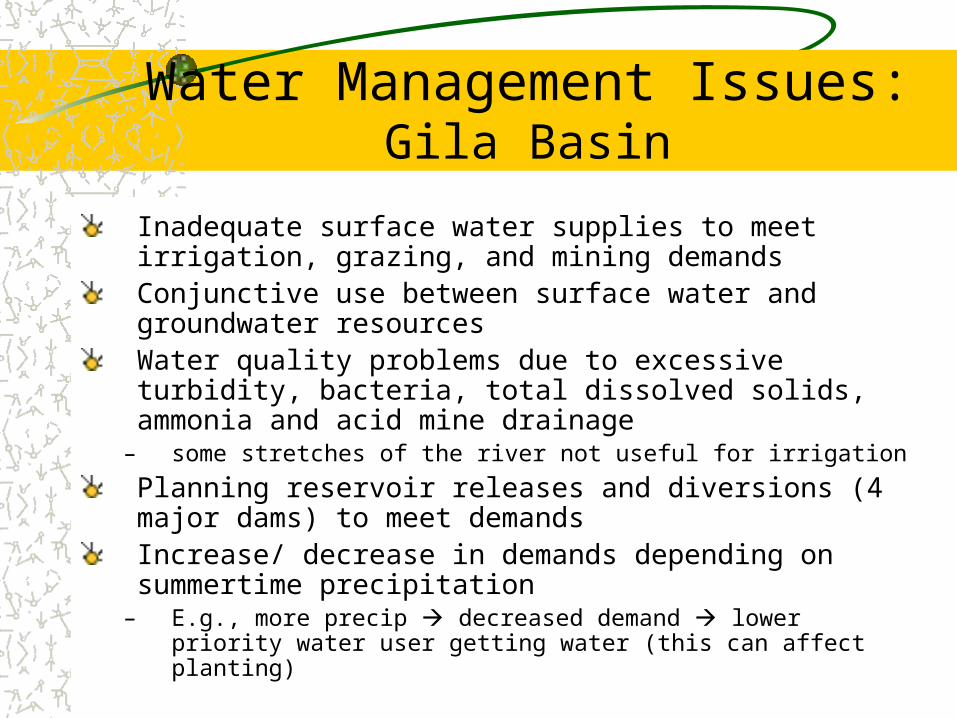
Water Management Issues:Gila Basin
Inadequate surface water supplies to meet irrigation, grazing, and mining demandsConjunctive use between surface water and groundwater resourcesWater quality problems due to excessive turbidity, bacteria, total dissolved solids, ammonia and acid mine drainage
– some stretches of the river not useful for irrigation
Planning reservoir releases and diversions (4 major dams) to meet demandsIncrease/ decrease in demands depending on summertime precipitation
– E.g., more precip decreased demand lower priority water user getting water (this can affect planting)

Water Management Issues:Expected Outcomes
Detailed investigation of the Gila River basin – Key management issues (both supply and demand) – Operations and policies
Decision calendar: timeframe of when decisions are made about reservoir releases and diversionsIdentify attributes of the hydroclimate that need to be predicted for improved water resources management
– Forecast variable (precipitation or streamflow)– timing of the forecasted variable (spring values, summer values, or both), – the forecast issue date– amount to be forecasted (seasonal, monthly, etc.)

Preliminary Streamflow Analysis
Water Management Issues:Gila River
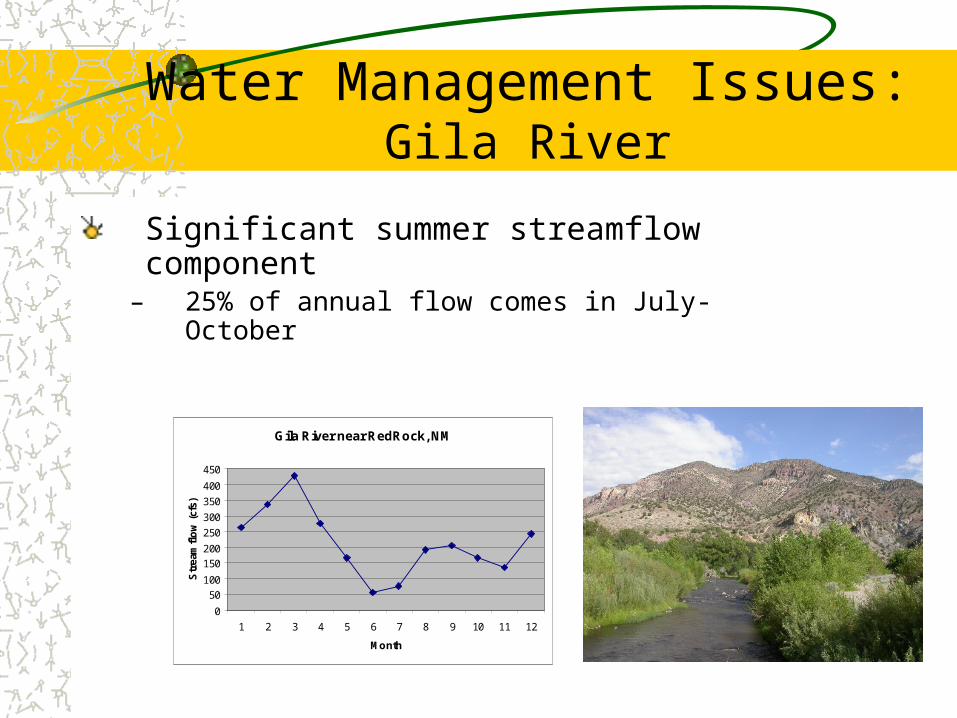
Gila River near RedRock, NM
0
50
100
150
200
250
300
350
400
450
1 2 3 4 5 6 7 8 9 10 11 12
Month
Str
eam
flo
w (
cfs
)
Significant summer streamflow component – 25% of annual flow comes in July-October

Streamflow Diagnostics:Volume Analysis (summer)
Gila River near Red Rock, NMJuly: decreasing trendAug, Sep, Oct: increasing trend Gila River Near Red Rock, NM
JULY
y = -0.1891x + 449.93
0
50
100
150
200
250
300
350
1930 1940 1950 1960 1970 1980 1990 2000 2010
Year
Str
eam
flo
w (
cfs)
Gila River Near Red Rock, NM AUGUST
y = 0.8351x - 1452.9
0
200
400
600
800
1000
1200
1400
1930 1940 1950 1960 1970 1980 1990 2000 2010
Year
Str
eam
flo
w (
cfs)
Gila River Near Red Rock, NM SEPTEMBER
y = 0.5469x - 871.41
0
200
400
600
800
1000
1200
1400
1600
1930 1940 1950 1960 1970 1980 1990 2000 2010
Year
Str
eam
flo
w (
cfs)
Gila River Near Red Rock, NM OCTOBER
y = 1.1286x - 2055.6
0200400600800
100012001400160018002000
1930 1940 1950 1960 1970 1980 1990 2000 2010
Year
Str
eam
flo
w (
cfs)

Streamflow Diagnostics:Volume Analysis (summer)
San Francisco River at Clifton, AZJuly, Aug: decreasing trendSep, Oct: increasing trend
San Francisco River at Clifton, AZ JULY
y = -0.4539x + 976.79
0
50
100
150
200
250
300
1920 1930 1940 1950 1960 1970 1980 1990 2000 2010
Year
Str
eam
flo
w (
cfs)
San Francisco River at Clifton, AZ AUGUST
y = -0.695x + 1558.6
0
200
400
600
800
1000
1200
1400
1600
1920 1930 1940 1950 1960 1970 1980 1990 2000 2010
Year
Str
eam
flo
w (
cfs)
San Francisco River at Clifton, AZ SEPTEMBER
y = 0.1866x - 221.29
0
100
200
300
400
500
600
700
800
900
1920 1930 1940 1950 1960 1970 1980 1990 2000 2010
Year
Str
eam
flo
w (
cfs)
San Francisco River at Clifton, AZ OCTOBER
y = 3.8691x - 7403.9
0
500
1000
1500
2000
2500
3000
3500
4000
4500
1920 1930 1940 1950 1960 1970 1980 1990 2000 2010
Year
Str
eam
flo
w (
cfs)

Streamflow Diagnostics:Winter/Spring Flow
Winter/Spring Flows strongly related to winter/spring Pacific SST and Z500 (ENSO/PNA patterns)

Gila River -- Antecedent Flow Relationship
•High Spring flows Low Summer flows
•Consistent with Precipitation results

Streamflow Diagnostics:Precipitation – Streamflow Relationship
Precipitation – streamflow relationship is non-linearHigh rainfall very little infiltration high streamflowStreamflow can be forecast from precipitation.

Streamflow Diagnostics:Methodology
Streamflow stations with significant summer component (due to monsoon rains) ~ approx. 40 in the regionTiming analysis
– Trends in initiation, peak, and recedence of summer streamflowVolume analysis
– Trends in the summer and spring streamflow volumeDetermine the dominant modes of timing and volume variability
– Using PCAIdentify the land/ocean/atmospheric forcings that drive the streamflow variability
– correlate antecedent conditions with the leading modesDetermine the relationship between spring and summer streamflow; precipitation and streamflow in the monsoon season; and the role of subsurface flow
See how well the ‘Precipitation Hypothesis’ holds with streamflowImplications to Water Resources Management
Summary and Conclusions
Antecedent (winter/spring) Pacific Ocean-Atmospheric conditions and the continental (Western US) land conditions have a substantial influence on the following summer monsoon cycle and rainfall amount.
Streamflows in the region too exhibit similar connection
Enhanced prospects of long lead forecast of the monsoon hydroclimatology (i.e., timing, rainfall amount and streamflow)

Future Work
Further understanding the physical mechanisms of the proposed hypothesis via modeling experiments.
Develop hydroclimate forecasting framework incorporating the large-scale climate information.
Evaluate the utility in a water management context.

Acknowledgements
Funding provided by NOAA/GAPP (GEWEX Americas Prediction Project)Grantz, K., B. Rajagopalan, M. Clark, and E. Zagona, Spatio-Temporal Variability of the North American Monsoon (submitted), Journal of Climate, Special issue on the North American Monsoon, 2005.
http://civil.colorado.edu/~balajir/ publications

Questions / Comments ?

Precipitation Diagnostics:Rainfall Amount PCA
Percent of total variance captured by each leading PC of monsoonal precipitation in varying months and regions
State Month variance
NM and AZ July 45% NM and AZ August 53% NM and AZ September 58% NM and AZ July-September 43%
AZ July 80% AZ August 78% AZ September 75% AZ July-September 77% NM July 61% NM August 64% NM September 71% NM July-September 63%