Embed Size (px)
Citation preview

ORIGINAL ARTICLE
Spatio-Temporal Variability of Summer Monsoon Onset over Pakistan
Shaukat Ali1,2 & Bushra Khalid2,3,4& Rida Sehar Kiani4 & Romaisa Babar4 & Sana Nasir4 & Nadia Rehman1
&
Muhammad Adnan1& Muhammad Arif Goheer1
Received: 5 December 2018 /Revised: 29 April 2019 /Accepted: 2 May 2019 /Published online: 27 June 2019# The Author(s) 2019
AbstractPakistan receives huge amount of rainfall during summer monsoon season that provides water replenishment fortransition periods, helps in maintaining natural and anthropogenic ecosystems, and increased crop productivity. Inthis changing world, shifts in summer monsoon onset in Pakistan have been observed that seems to affect thesociety in general. Therefore, it is vital to address these summer monsoon onset shifts to help policy makingsand implementation. The study was carried out to analyse the spatio-temporal variability in summer monsoon onsetin four objectively defined regions covering all Pakistan. A total of 35 meteorological stations spreading over fourregions (i.e., northern, central east, central west, and southern) were taken in to account and shifts in summermonsoon onset have been calculated for the period of 1971–2010. The analysis is based on the observational dataof daily precipitation from 20th Jun-20th July for 40 years. The onset for each year and mean onset for each decadehas been calculated for all stations. The data was analysed for homogeneity, spatial and temporal variability ofmonsoon rainfall has been calculated for all four regions, and station wise monsoon onset has been discussed indetail. The temporal analysis shows that the onset of monsoon has shift towards earlier onset from first week of Julyto last week of June at most of the stations in which the investigation was carried out during the studied period. Thespatial analysis shows that the amount of monsoon precipitation during the onset period has decreased after 1970’sin almost all regions. This variability in monsoon onset can have major impacts on rain fed agriculture andcultivation of crops like maize, soybean, rice and sugarcane etc. and will have to revisit the cropping calendar.
Keywords Monsoon onset . Spatial variability . Temporal variability . Asian summermonsoon .Monsoon shifts
1 Introduction
The summer monsoon over Pakistan is part of the biggerAsian Summer Monsoon (ASM) circulation system. TheASM onset generally occurs by June 1 at the southernmostpeninsula and progresses towards the most northwestern re-gion in India by mid-July. The ASM withdraws from thenorthwest and southernmost peninsula by September 1 andmid-October respectively (Singh and Ranade 2010).According to IMD (1943), the presence of a continuedwarming tendency and positive radiation balance of the north-ern hemisphere cause the progression of monsoon over north-west India and Pakistan. The ASM passes through the Indianmainland, further advances northwest and enters centralPakistan from 5 July-24 July (Ding and Sikka 2006; Singhand Ranade 2010). The southwest flow of ASM officiallybegins the Pakistan’s rainy season (Latif and Syed 2015).The general trend of the South Asian monsoon, its begin andend, its movement over different regions within South Asia
Highlights 1- Observations at 35 meteorological stations were processedfor summer monsoon onset in Pakistan2- Temporal analysis of four decades i.e., 1971-20103- Mean monsoon onset has observed a shift over 40 years to an earliertime in Pakistan4- Total amount of precipitation has decreased over the studied period5- North eastern region of Pakistan received highest amount ofprecipitation among all others
Responsible Editor: Ashok Karumuri.
* Bushra [email protected]
1 Global Change Impact Studies Centre, Ministry of Climate Change,Islamabad, Pakistan
2 Earth System Physics, The Abdus Salam International Centre forTheoretical Physics, Trieste, Italy
3 International Institute for Applied Systems Analysis,Laxenburg, Austria
4 Department of Environmental Science, International IslamicUniversity, Islamabad, Pakistan
Asia-Pacific Journal of Atmospheric Sciences (2020) 56:147–172https://doi.org/10.1007/s13143-019-00130-z
Online ISSN 1976-7951Print ISSN 1976-7633
Korean Meteorological Society

has been thoroughly discussed in scientific literature (c.f.Krishnamurti 1985; Webster and Lukas 1992; Lau et al.2000; Ding and Chan 2005; Bhat et al. 2002; Johnson et al.2004; Webster 2005; Singh and Ranade 2010; Saeed et al.2011; Imran et al. 2014; Rasul and Chaudhry 2010). Thesummer monsoon rainfall over the subcontinent has great so-cial, agricultural, and economic value (Ahmad et al. 2014).The summer monsoon contributes 65–75% of the total annualrainfall in Pakistan (Ahmad et al. 2014). The summer mon-soon rainfall in Pakistan provides water replenishment whichallows the water requirements to be fulfilled during the tran-sition period until the onset of winter rainfall (Imran et al.2014). Summer monsoon rainfall is of vital importance foranthropogenic and natural ecosystems of the region (Singhand Ranade 2010).
Date of monsoon onset over Pakistan is important from theperspective of agricultural yield (Imran et al. 2014). The agri-cultural sector of Pakistan accounts for 24% of total GrossDomestic Product (GDP) (IUCN 2009). Small variations inmonsoon onset may have adverse impacts on agricultural pro-ductivity that in turn may have negative impacts on GDP(Latif and Syed 2015). In monsoon dependent regions, cropproductivity is mainly determined by the onset even if themean rainfall during summer season remains normal (Latifand Syed 2015). Rashid and Rasul (2011) discussed the maizecrop which is cultivated with the onset of monsoon and be-comes mature when the monsoon season ends by Septemberin Pakistan. The maize crop is highly sensitive to moisturesurplus and deficit. The yield decreases if the rainfall exceedsthe peak value 300 mm. If the monsoon onset is delayed, itaffects the crop as deficient soil moisture cannot sustain seedgermination and growth (Rashid and Rasul 2011).
The variation in the standard deviation of monsoon onset islarger over Pakistan (i.e., ~11–12 days) as compared to India(i.e., ~7–8 days) (Latif and Syed 2015; Fasullo and Webster2003; Raju et al. 2005; Pai and Nair 2009; Wang et al. 2009;Puranik et al. 2013). The monsoon onset in Pakistan may besignificantly delayed due to El Nino Southern Oscillation(ENSO) (Latif and Syed 2015). The north-eastern belt ofPakistan including stations of Lahore, Sialkot, Jhelum andIslamabad receive the first rainfall as the summer monsoonsystem enters in the country after deflecting from the greatHimalayas and travelling along the foothills. At the same time,southwest winds from the Arabian Sea progress towardPakistan and the first monsoon rainfall prevails over Chhorand Badin stations, making it the south-eastern belt of summermonsoon (Imran et al. 2014). The onset of summer monsoonover India has been investigated in several studies (c.f.Shamshad 1988; Ananthakrishnan and Soman 1988; Rajuet al. 2005; Joseph et al. 2006; Simon et al. 2006; Cook andBuckley 2009; Kumar et al. 2009). A few studies are presentin scientific literature discussing the monsoon onset overPakistan; some studies discussed over all monsoon onset
situation in Pakistan (e.g., IMD 1943; Singh and Ranade2010; Latif and Syed 2015; Rasul and Chaudhry 2010;Sadiq and Qureshi 2010), and a few studies discussed mon-soon onset for selected cities only (e.g., Imran et al. 2014).However, there is a limitation in these studies from the per-spective of spatial and temporal variability in monsoon onsetcovering all stations and all regions separately in the Pakistan.This study provides comprehensive analysis of monsoon on-set over different meteorological stations as well as differentregions of Pakistan which form the basis for the trends infuture projection of monsoon variability in the country. Theonset of summer monsoon over the Core Monsoon Region ofPakistan (CMRP) has been discussed by Latif and Syed,(2015) using observational daily rainfall and PerceptibleWater (PW) data sets. An objective criterion is proposed todefine monsoon onset dates by employing Precipitation Indexand Normalized Perceptible Water Index techniques. The re-sult of the study shows that the seasonal transition from pre-monsoon to the monsoon season occurs in the end of June orthe start of July. The mean onset date determined throughstation data is July 1 with a standard deviation of about 12 daysover the CMRP. The other data sets APHRODITE andNVAP-M both exhibit onset date as 30 June with standard deviationof 11.7 and 10.5 days, respectively. Although, PW-based cli-matological mean onset date is very similar to the rainfall-based mean onset date but onset dates on annual basis arevarying.
The spatial and temporal variation in summer monsoononset has not been studied extensively in Pakistan.Therefore, this study intends to present the spatio-temporalvariability of summer monsoon onset over 35 meteorologicalstations consists of four different regions of Pakistan. Theanalysis was done for the period of 1971–2010 and decadewise monsoon onset has been discussed. An overall temporalshift in summer monsoon onset has been analyzed. The spatialvariability analysis involves Inverse Distance Weighted(IDW) interpolation to show the rainfall distributions overPakistan during the monsoon onset for 40 years. While tem-poral variability assessment is carried out on individual sta-tions as well as based on four regions of Pakistan.
2 Material and Methods
2.1 Study Region
Pakistan is located between 23.35o N to 37.50o N latitude andextends from 60.50o E to 77.50° E longitude. A large part ofPakistan is characterized by spatial and temporal variability inclimate. The climate of Pakistan is influenced by its topo-graphic features. Pakistan lies on the northern part of south-west monsoon currents in the subcontinent, on the westernfrontier of the ASM, on the fringe of western disturbances
148 S. Ali et al.
Korean Meteorological Society
entering the subcontinent from the far west. The southernplains of Pakistan are almost arid. The Baluchistan provinceand north-eastern mountains have arid highland climate. Thedesert and arid region of Pakistan are the eastern limit of southAsia and one of the world’s largest dry regions. In the regionof northern mountains, the mean annual precipitation is quiteinsufficient for natural vegetation (Shamshad 1988). The hugeamount of total annual rainfall in Pakistan is received duringthe summer monsoon season.
To carry out this study the map of Pakistan was divided intofour regions namely Region I (North), Region II (CentralEast), Region III (Central West) and Region IV (South)(Fig. 1). Total 35 meteorological stations were selectedspreading over these four regions. Pakistan has a very diversetopography due to which different climatic conditions prevailin different parts of the country. The division in this study ismade based on climatology and weather conditions, extent ofmonsoon system penetrating, and amount of precipitation re-ceived during monsoon season in these regions of Pakistan.Region I is the northern part of Pakistan comprised of moun-tains and glaciers with different temperature and precipitationpatterns as compared to the rest of the country. Region II
comprises monsoon dominated part of Pakistan which re-ceives maximum amount of rainfall during the summer mon-soon season. Region III is the part where monsoon penetratesto a greater degree but far less than the Region II. The stationslying in Region IV receive monsoon from south westernwinds from Arabian Sea, however, the amount of rainfall isquite less as compared to Region II and Region III. The above-mentioned division was made based on different climatic con-ditions of the regions and is shown in Fig. 1. All the stationsselected for study have their own importance because of theirgeographical location. The selected stations and their divisioninto regions are listed in the Table 1.
2.2 Data Acquisition
The climatic data used in this study was collected fromPakistan Meteorological Department (PMD). This data in-volves the daily observational precipitation (mm) for themonths of June and July for 35 stations that are in differentareas ranging from north to south of the country as shown inFig. 1. The data used in this study covered a time period of40 years i.e., 1971–2010. To get an overall view of the
Spatio-Temporal Variability of Summer Monsoon Onset over Pakistan 149
Korean Meteorological Society
Fig. 1 Map of study area showing the selected meteorological stations in different regions of Pakistan

precipitation of the selected stations, statistical analysis wascarried out. The total/average annual precipitation (mm) andtotal/average monsoon precipitation (mm) (June-Sep) of theselected stations was calculated for the period of 1971–2010.
2.3 Homogeneity Test
Homogeneity test is used to detect the variability in data se-ries. In general, when the data is homogeneous, it means thatthe measurements of the data are taken at a time with the sameinstruments and in same environments. According to Kang
and Yusof (2012) it is difficult to deal with rainfall data be-cause environmental characteristics and structures, changes inmeasurement techniques and location of stations affect theobservations. Since, the data used in current study isobservational, so it was important to check the homogeneityof the data before carrying out analysis. Karabork et al. (2007)described two classifications of the homogeneity tests of timeseries i.e., ‘absolute method’ and ‘relative method’. In relativemethod, testing process is carried out in neighbouring stationswhile in absolute method, each station is tested individually(Chang et al. 2017). Relative method detects inhomogeneity
Table 1 Selected meteorological stations with their division into four regions
Sr. No. Station Latitude Longitude Elevation/Height a.m.s.l. Region
1. Drosh 35° 33′ 29” N 71°47′ 33″ E 1463.90 m North
2. Chitral 35° 50′ 30” N 71° 46′ 54″ E 1497.8 m North
3. Gupis 36° 14′ 0” N 73° 26′ 0″ E 2156.0 m North
4. Gilgit 35° 16′ 55.0812” N 74° 50′ 30.9912″ E. 1460.0 m North
5. Bunji 35° 16′ 55.0812” N 74° 50′ 30.9912″ E. 1372.0 m North
6. Astore 35° 02′ 12.18” N 75° 06′ 22.14″ E. 2168.0 m North
7. Skardu 35° 17′ 59” N 75° 37′ 0″ E 2317.0 m North
8. Balakot 34° 32′ 22.7940” N 73° 21′ 0.8460″ E. 995.40 m Central East
9. Kakul 34° 11′ 0” N 73° 16′ 0″ E 1308.0 m Central East
10. Muzaffarabad 34° 21′ 34.8768” N 73° 28′ 15.7944″ E 702.0 m Central East
11. G-dupatta 34° 13′ 17.4”N 73° 36′ 57″E 813.5 m Central East
12. Murree 33°54′27.98”N 73°23′29.4″E 2167 m Central East
13. Kotli 33°31′0.01”N 73°55′0.01″E 614.0 m Central East
14. Islamabad 33° 44′ 16.9620” N 73° 5′ 4.1568″ E. 507 m Central East
15. Jehlum 32° 56′ 25.9728” N 73° 43′ 39.4716″ E. 287.19 m Central East
16. Sialkot 32°29′33.65”N 74°31′52.82″E 255.1 m Central East
17. Lahore 31° 34′ 55.3620” N 74° 19′ 45.7536″ E 214.00 m Central East
18. Faisalabad 31° 25′ 15.7620” N 73° 5′ 21.4584″ E 185.6 m Central East
19. Sargodha 32° 4′ 56.8776” N 72° 40′ 8.8608″ E. 187 m Central East
20. Parachinar 33°53′1.29”N 70°6′35.49″E 1725.00 m Central West
21. Peshawar 34° 1′ 33.3012” N 71° 33′ 36.4860″ E. 327 m Central West
22. Cherat 33°50′2.04”N 71°51′2.58″E 1372.0 m Central West
23. Kohat 33° 36′ 4.0608” N 71° 26′ 41.2008″ E. 503 m Central West
24. D.I Khan 31° 49′ 53.3352” N 70° 54′ 41.7528″ E 171.20 m Central West
25. Mianwali 32°35′7.48”N 71°32′37.02″E 210 m Central West
26. Bahawalnagar 29°59′57.06”N 73°15′31.84″E 161.05 m South
27. Multan 30° 10′ 34.1652” N 71° 27′ 14.5728″ E. 121.95 m South
28. Bahawalpur 29° 25′ 5.0448” N 71° 40′ 14.4660″ E. 110.00 m South
29. Khanpur 26°59′53.01”N 67°41′32.29″E 88.41 m South
30. Jaccobabad 28°16′58.57”N 68°26′11.36″E 55 m South
31. Hyderabad 31° 20′ 30.4692” N 71° 41′ 49.1964″ E 28 m South
32. Zoab 31°09′60.00” N 68°49′59.99″ E 1405 m South
33. Quetta 30°11’ N 66° 57′ E 1626 m South
34. Dalbadin 28° 53’ N 64° 24′ E 848 m South
35. Karachi 24° 54’ N 66° 56′ E’ 22 m South
Pakistan Meteorological Department
150 S. Ali et al.
Korean Meteorological Society
easily however, this method does not distinguish between thereal changes and the random fluctuations of the observations(Peterson et al. 1998). In this study, we used the ‘absolutemethod’ to detect inhomogeneity in which the test is appliedseparately for each station (e.g., Wijngaard et al. 2003) todistinguish between the real changes and random fluctuationsof the observations. Using the absolute method, the homoge-neity of the total precipitation of the period 20th June -20thJuly of each station was tested by using Pettitt’s Test from1971 to 2010. Pettitt’s test is a nonparametric test developedby Pettit, (Pettitt 1979), is quite helpful in detecting the occur-rence of abrupt changes in climatic data (Smadi and Zghoul2006). Homogeneity test is generally used to identify a singlechange-point in continuous data sets such as climate series orhydrological series. The results of the test for each stationwere evaluated for a significance level of 5% to detect in-homogeneities. To minimize the error in analysis, standarddeviation of onset time was also calculated. The results ofhomogeneity test were evaluated based on different classes.These classes were made according to the study of Wijngaardet al. (2003). The classification described by Wijngaard et al.(2003) was based on number of tests rejecting the null hypoth-esis. As present study involved Pettitt’s test therefore twoclasses were identified and are as follows:
Class A: It refers to data that is useful in which none of thetest rejects the null hypothesis. The series seem to be ade-quately homogeneous for further analysis.
Class B: It refers to data that is doubtful in which test rejectsthe null hypothesis. It means that there is indication of in-homogeneity. Thus, the results of further analysis shouldbe observed critically from the perspective of existence ofpossible in-homogeneities.
2.4 Temporal Analysis of Monsoon Onset
World Meteorological Organization (WMO) has describedmonsoon onset as Pentad criteria i.e., “the five day mean rain-fall averaged over calendar day intervals of five days is calledpentad rainfall” (Compendium of Meteorology 1979). To de-termine the onset of summer monsoon in 35 meteorologicalstations of Pakistan, daily precipitation data for 31 days i.e.,20th June to 20th July for the years of 1971–2010 was assem-bled. The reason to select this 31-day window is the seasonaltransition from pre-monsoon to the monsoon season that oc-curs in the end of June to the start of July. The mean onset datedetermined through different studies is start of July with astandard deviation of about 12 days (Latif and Syed 2015).Hence, the onset of monsoon on different stations in Pakistanis likely to occur from 20th June to 20th July. To calculate thetemporal shift in the monsoon onset in Pakistan, the onset dateof each individual year from 1971 to 2010 for all the stationswas determined. As different parts of the country receive var-iable amount of monsoon precipitation, the whole country was
divided into four regions based on the amount of monsoonprecipitation it receives (Table 1). The criteria used to deter-mine the onset date varied with each region and is based onprevious studies (c.f. Latif and Syed 2015; Faisal and Sadiq2012), with some modifications (Table 2).
2.5 Criterion for Central East Region
Central east region comprises of major monsoon stations andreceives the highest amount of precipitation annually. To de-termine the onset in this region pentad rainfall methodologywas adopted, according to which the date of monsoon onsetover selected stations is the middle date of the 5-day periodwith the provision that the 5-day accumulated rainfall (with atleast three rainy days) should not be less than 20 mm in this31-day period (Faisal and Sadiq 2012).
2.6 Criterion for Central West Region
The monsoon precipitation penetrates to a greater extent in thecentral west region but far less than the central east region,hence a different criterion was adopted to determine the mon-soon onset for this region. The criteria adopted by Faisal andSadiq (2012) was modified and threshold for the criteria waschanged to 10mm. Hence, in this region the middle date of the5-day period is considered as monsoon onset with the provi-sion that the 5-day accumulated rainfall (with at least threerainy days) should not be less than 10 mm in this 31-daywindow.
2.7 Criterion for North and South Region
The monsoon system penetrates to a much lesser degree in theextreme north and south regions of Pakistan, so a generalanalysis of precipitation was made in these regions. Thecriteria of 7-day period was adopted for these regions withthe provision of 7-day accumulated rainfall (with at least threerainy days) should not be less than 2 mm.
2.8 Statistical Analysis for Determination of MeanOnset
The first step of statistical analysis includes determination ofonset date of each year. For this purpose, the prescribedcriteria were applied to each year from 1971 to 2010 and theonset date was calculated for every station included in thisstudy. The next step was the determination of mean onset dateof each of the four decades from 1971 to 2010. For this, theformula of average was applied on the onset dates of fourdecades i.e. 1971–1980, 1981–1990, 1991–2000, and 2001–2010, corresponding to each station of all four regions. Tocalculate onset dates for four regions, the average of the meandates of all stations lying in the respective region was
Spatio-Temporal Variability of Summer Monsoon Onset over Pakistan 151
Korean Meteorological Society

determined. In this way, a single average onset date for eachregion corresponding to every decade was determined. Thestandard deviation with respect to time period of onset wasalso calculated for each decade. To visualize the results, onsetdates of four regions for each decade was plotted on the graphas well as on the map. In this way, four graphs correspondingto four stations were prepared to analyse the temporal varia-tion in the onset of monsoon at various stations in Pakistan.
2.9 Spatial Analysis of Monsoon Precipitation
For analysing the spatial trends of average precipitation thisstudy used IDW interpolation method. IDW interpolationmethod assumes that the things which are closer to each otherhave more features in common than those that are far fromeach other. To estimate a value for any unmeasured location,IDW uses the measured values surrounding the predictionlocation. The measured values closest to the prediction loca-tion have more influence on the predicted value than thosefarther away (ESRI 2017). While doing the interpolation thepower was set as ‘2’. The adjusted power 2 shows that thesample point values will provide better averaged output be-cause sample points with unknown values that are far awayfrom the location become more influential until all of the sam-ple points have the same influence. Moreover, the search ra-dius for nearest neighbour sample point was set as 5.327 m.The resultant raster had a format of grid with cell size of 0.05.
3 Results
The lifeline of Pakistan’s water resources and agriculture is thesummer monsoon rainfall which is received from the monthsof June to September. Any variability in the summer monsoonsystem can have major impacts on the irrigation as well as onthe water resource management in the country. Uncertaintyand uneven temporal and spatial distribution of rainfall maycause extreme situations such as flooding and long dry spells(Lai et al. 1998). This study provides an insight to the onset ofsummer monsoon season on the selected stations in Pakistan.Results of this study also indicate the spatial and temporalvariability in the monsoon onset and precipitation in Pakistan.
3.1 Analysis of Average Annual and MonsoonPrecipitation of Study Area 1971–2010
3.1.1 Average Annual Precipitation 1971–2010
Average annual precipitation in Pakistan ranges from90 mm to 1750 mm. The stations receiving maximumamount of precipitation annually lies in the Region II(central east) while those receiving the minimum precip-itation lies in the Region IV (south region) of the coun-try. The Fig. 2 shows that the Murree station receivedthe maximum precipitation at the rate of 1727 mm an-nua l ly f rom 1971 to 2010 . The Balako t andMuzaffa rabad sta t ions rece ived 1553 mm and1500 mm of annual precipitation respectively andDalbadin received the least annual precipitation i.e.,93 mm from 1971 to 2010. Also, the stations ofJacobabad and Khanpur received the least amount ofannual precipitation from 1971 to 2010 i.e., 114 mmand 109 mm respectively.
3.1.2 Average Monsoon Precipitation 1971–2010
The analysis of monsoon precipitation shows that theRegion II (central east) receive the maximum amountof rainfall during summer monsoon season (June-Sep).It shows that this region is the main part of the countryreceiving monsoon precipitation (Fig. 3). Some stationsin the Region III (central west) also show receivingenough amount of precipitation during June-Sep. Theresults show minimal amount of precipitation receivedin Region I and Region IV in monsoon season from1971 to 2010. The station showing maximum amountof average monsoon rainfall is Murree which received914 mm precipitation from 1971 to 2010. The Balakotand Islamabad stations lies on the second and third rankwith respect to monsoon precipitation receiving 855 mmand 791 mm respectively. The stations receiving mini-mum monsoon precipitation are Dalbadin, Quetta andSkardu which received 10 mm, 26 mm and 44 mmaverage monsoon precipitation respectively from 1971to 2010.
Table 2 Criteria used for determination of monsoon onset
Regions Criteria for Monsoon Onset Determination
Central East Region Middle date of the 5-day rainfall accumulated period (with at least three rainy days) in which rainfall shouldnot be less than 20 mm.
Central West Region Middle date of the 5-day rainfall accumulated period (with at least three rainy days) in which rainfall shouldnot be less than 10 mm.
North and South Region Middle date of the 7-day rainfall accumulated period (with at least three rainy days) in which rainfall shouldnot be less than 2 mm.
152 S. Ali et al.
Korean Meteorological Society

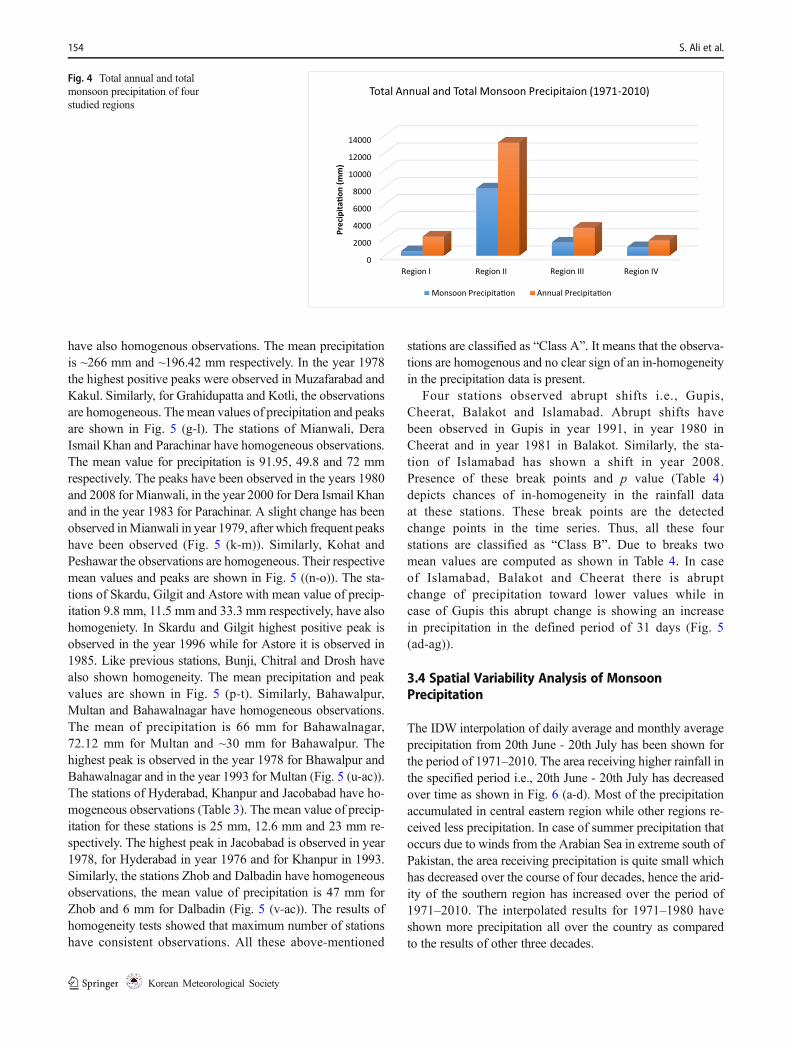
3.2 Total Annual and Total Monsoon Precipitationof all Regions 1971–2010
Results show that the Region II (central east) receivedhighest total annual and total monsoon precipitationfrom 1971 to 2010. As shown in Fig. 4, the Region IIreceived ~12,000 mm total annual precipitation out ofwhich the total monsoon precipitation received is~ 7 5 0 0 mm . Th e R e g i o n I I I ( c e n t r a l w e s t )received ~3000 mm total annual precipitation out ofwhich the total monsoon precipitation received is~1500 mm in the region. The total annual precipitationreceived in the Region I (north) is ~2200 mm out ofwhich the total monsoon precipitation is ~500 mm. InRegion IV (south) the total annual precipitation receivedis ~1700 mm and major portion of this precipitation isreceived in the monsoon season which is brought by thewinds from the Arabian Sea. The total monsoon precip-itation in this region is ~1000 mm.
3.3 Evaluation of the Results of Homogeneity Test
The results of the homogeneity test and the classification ofstations is shown in Table 3. The Pettit’s test results haveshown that the Murree has homogeneous observations.There is no break point in this station’s data. However, thehomogeneity test graph shows occurrence of changes since2001 i.e., the precipitation in determined period i.e., 20thJune to 20th July is decreasing (Fig. 5 (a-f)). The mean valueof precipitation is 273.85 mm in case ofMurree. Similarly, thestations of Faisalabad, Sargodha and Sialkot have also ahigher p value thus their observation is homogeneous. Themean value is given as 85.5 mm, 72.42 mm and 229.18 mmrespectively. In case of Jhelum and Lahore the null hypothesisis accepted (Table 3) thus observations are homogeneous. Themean value of precipitation is 176.08 mm for Jhelum and140 mm for Lahore. The positive peaks are shown in the years1975, 1979 and 1989 in case of Jhelum and in 1981 for Lahore(Fig. 5 (a-f)). The stations of Muzafarabad and Kakul
Fig. 2 Annual precipitation instudy regions for 1971–2010
Fig. 3 Monsoon precipitation instudy regions for 1971–2010
Spatio-Temporal Variability of Summer Monsoon Onset over Pakistan 153
Korean Meteorological Society
0
200
400
600
800
1000
1200
1400
1600
1800
2000
Dro
sh A
stor
e C
hitr
al S
kard
u G
upis
Bun
ji G
ilgit
Mur
ree
Bal
akot
Muz
affar
abad
Kak
ul G
arhi
Dup
a�a
Kot
liIs
lam
abad
Sia
lkot
Jhel
um L
ahor
e S
argo
dha
Fai
sala
bad
Par
achi
nar
Koha
tM
ianw
ali
Che
rat
Pesh
awar
D.I.
Khan
Zho
bQ
ue�
a B
ahaw
al N
agar
Mul
tan
Kar
achi
Bah
awal
Pur
Hyd
erab
adJa
coba
bad
Kha
npur
Dalb
andi
n
Region I Region II Region III Region IVPr
ecip
ita�o
n (m
m)
Annual Precipita�on 1971-2010
0100200300400500600700800900
1000
Bun
ji A
stor
e D
rosh
Gup
is G
ilgit
Ska
rdu
Chi
tral
Mur
ree
Bal
akot
Isla
mab
ad M
uzaff
arab
ad S
ialk
ot K
otli
Kak
ul G
arhi
Dup
a�a
Jhel
um L
ahor
e F
aisa
laba
d S
argo
dha
Mia
nwal
i P
arac
hina
rKo
hat
Che
rat
D.I.
Khan
Pesh
awar
Bah
awal
Nag
ar K
arac
hi M
ulta
n Z
hob
Bah
awal
Pur
Hyd
erab
adJa
coba
bad
Kha
npur
Que
�a
Dalb
andi
n
Region I Region II Region III Region IV
Prec
ipita
�on
(mm
)
Monsoon Precipita�on 1971-2010
have also homogenous observations. The mean precipitationis ~266 mm and ~196.42 mm respectively. In the year 1978the highest positive peaks were observed in Muzafarabad andKakul. Similarly, for Grahidupatta and Kotli, the observationsare homogeneous. The mean values of precipitation and peaksare shown in Fig. 5 (g-l). The stations of Mianwali, DeraIsmail Khan and Parachinar have homogeneous observations.The mean value for precipitation is 91.95, 49.8 and 72 mmrespectively. The peaks have been observed in the years 1980and 2008 for Mianwali, in the year 2000 for Dera Ismail Khanand in the year 1983 for Parachinar. A slight change has beenobserved inMianwali in year 1979, after which frequent peakshave been observed (Fig. 5 (k-m)). Similarly, Kohat andPeshawar the observations are homogeneous. Their respectivemean values and peaks are shown in Fig. 5 ((n-o)). The sta-tions of Skardu, Gilgit and Astore with mean value of precip-itation 9.8 mm, 11.5 mm and 33.3 mm respectively, have alsohomogeniety. In Skardu and Gilgit highest positive peak isobserved in the year 1996 while for Astore it is observed in1985. Like previous stations, Bunji, Chitral and Drosh havealso shown homogeneity. The mean precipitation and peakvalues are shown in Fig. 5 (p-t). Similarly, Bahawalpur,Multan and Bahawalnagar have homogeneous observations.The mean of precipitation is 66 mm for Bahawalnagar,72.12 mm for Multan and ~30 mm for Bahawalpur. Thehighest peak is observed in the year 1978 for Bhawalpur andBahawalnagar and in the year 1993 for Multan (Fig. 5 (u-ac)).The stations of Hyderabad, Khanpur and Jacobabad have ho-mogeneous observations (Table 3). The mean value of precip-itation for these stations is 25 mm, 12.6 mm and 23 mm re-spectively. The highest peak in Jacobabad is observed in year1978, for Hyderabad in year 1976 and for Khanpur in 1993.Similarly, the stations Zhob and Dalbadin have homogeneousobservations, the mean value of precipitation is 47 mm forZhob and 6 mm for Dalbadin (Fig. 5 (v-ac)). The results ofhomogeneity tests showed that maximum number of stationshave consistent observations. All these above-mentioned
stations are classified as “Class A”. It means that the observa-tions are homogenous and no clear sign of an in-homogeneityin the precipitation data is present.
Four stations observed abrupt shifts i.e., Gupis,Cheerat, Balakot and Islamabad. Abrupt shifts havebeen observed in Gupis in year 1991, in year 1980 inCheerat and in year 1981 in Balakot. Similarly, the sta-tion of Islamabad has shown a shift in year 2008.Presence of these break points and p value (Table 4)depicts chances of in-homogeneity in the rainfall dataat these stations. These break points are the detectedchange points in the time series. Thus, all these fourstations are classified as “Class B”. Due to breaks twomean values are computed as shown in Table 4. In caseof Islamabad, Balakot and Cheerat there is abruptchange of precipitation toward lower values while incase of Gupis this abrupt change is showing an increasein precipitation in the defined period of 31 days (Fig. 5(ad-ag)).
3.4 Spatial Variability Analysis of MonsoonPrecipitation
The IDW interpolation of daily average and monthly averageprecipitation from 20th June - 20th July has been shown forthe period of 1971–2010. The area receiving higher rainfall inthe specified period i.e., 20th June - 20th July has decreasedover time as shown in Fig. 6 (a-d). Most of the precipitationaccumulated in central eastern region while other regions re-ceived less precipitation. In case of summer precipitation thatoccurs due to winds from the Arabian Sea in extreme south ofPakistan, the area receiving precipitation is quite small whichhas decreased over the course of four decades, hence the arid-ity of the southern region has increased over the period of1971–2010. The interpolated results for 1971–1980 haveshown more precipitation all over the country as comparedto the results of other three decades.
Fig. 4 Total annual and totalmonsoon precipitation of fourstudied regions
154 S. Ali et al.
Korean Meteorological Society
0
2000
4000
6000
8000
10000
12000
14000
Region I Region II Region III Region IV
Prec
ipita
�on
(mm
)
Total Annual and Total Monsoon Precipitaion (1971-2010)
Monsoon Precipita�on Annual Precipita�on

3.5 Temporal Variability Analysis of Monsoon Onset
The analysis to determine the variability in onset of monsoonwas carried out for four objectively defined regions as well asfor individual stations. The results show the variability of re-gional onset of summer monsoon season over the period offour decades i.e., 1971–2010 and are presented as follows:
3.5.1 Monsoon Onset over Region I
The Region I (north) comprise of seven stations andan overall monsoon trend in this region depicts that
the monsoon onset has shifted to an earlier time(Fig. 7). In the decade of 1971–80, monsoon onsetwas in the start of July i.e., 2nd July±7 days whichwas shifted to 8th July±6 days in the next decade i.e.,1981–1990. However, in 1991–2000-decade, monsoononset shows a significant shift towards the end ofJune i.e., 30th June ±6 days and this trend continuedin the next decade i.e., 2001–2010, in which the mon-soon onset was on 27th June ±6 days. There is asharp shift in onset trend from the first week of Julyto last week of June in the Region I during the stud-ied period.
Table 3 Results ofhomogeneity test Station P Value
(< a or > a)Breakpoint
H0 accepted orrejected
Classification Homogeneous(Yes or No)
Dalbadin 0.956 > 0.05 Accepted A Yes
Zhob 0.131 > 0.05 Accepted A Yes
Quetta 0.605 > 0.05 Accepted A Yes
Karachi 0.621 > 0.05 Accepted A Yes
Jacobabad 0.748 > 0.05 Accepted A Yes
Hyderabad 0.976 > 0.05 Accepted A Yes
Gupis 0.009 < 0.05 1991 Rejected B No
Astore 0.288 > 0.05 Accepted A Yes
Gilgit 0.208 > 0.05 Accepted A Yes
Bunji 0.800 > 0.05 Accepted A Yes
Skardu 0.769 > 0.05 Accepted A Yes
Muzafarabad 0.532 > 0.05 Accepted A Yes
Kotli 0.098 > 0.05 Accepted A Yes
Garhidupatta 0.486 > 0.05 Accepted A Yes
Peshawar 0.271 > 0.05 Accepted A Yes
Kohat 0.367 > 0.05 Accepted A Yes
Parachinar 0.657 > 0.05 Accepted A Yes
Kakul 0.585 > 0.05 Accepted A Yes
Drosh 0.825 > 0.05 Accepted A Yes
D.I. Khan 0.247 > 0.05 Accepted A Yes
Chitral 0.434 > 0.05 Accepted A Yes
Cheerat 0.038 < 0.05 1980 Rejected B No
Balakot 0.036 < 0.05 1981 Rejected B No
Sargodha 0.204 > 0.05 Accepted A Yes
Sialkot 0.314 > 0.05 Accepted A Yes
Multan 0.874 > 0.05 Accepted A Yes
Lahore 0.542 > 0.05 Accepted A Yes
Khanpur 0.519 > 0.05 Accepted A Yes
Mianwali 0.341 > 0.05 Accepted A Yes
Jehlum 0.570 > 0.05 Accepted A Yes
Faisalabad 0.867 > 0.05 Accepted A Yes
Bahawalpur 0.733 > 0.05 Accepted A Yes
Bahawalnagar 0.997 > 0.05 Accepted A Yes
Murree 0.740 > 0.05 Accepted A Yes
Islamabad 0.047 < 0.05 2008 Rejected B No
Spatio-Temporal Variability of Summer Monsoon Onset over Pakistan 155
Korean Meteorological Society

3.5.2 Monsoon Onset over Region II
The Region II (central east) receives rainfall duringsummer monsoon season from the currents transportedfrom the Bay of Bengal that are later deflected byHimalayas and fall as precipitation in northeast ofPakistan. While investigating the variation in onset timeof monsoon it is evident that the central eastern regionhas shown an overall earlier onset of summer monsoonover the course of four decades i.e., 1971–2010. It isalso shown from the analysis that three decades i.e.,
1971–1980, 1991–2000 & 2001–2010 had earlier onsetof monsoon while the decade (1981–1990) showed lateonset of monsoon season. The mean onset calculated forRegion II for the decade 1971–1980 is 1st July withstandard deviation of 6 days, which is quite high. Theonset for the decade 1981–1990 is determined to be 3rdJuly while the standard deviation of 3 days. In 1991–2000, the onset in this region shifted to 29th June witha standard deviation of 4 days. Similarly, the onset for2001–2010 decade is 29th June with a standard devia-tion of 3 days (Fig. 8).
156 S. Ali et al.
Korean Meteorological Society
0
50
100
150
200
250
1970 1980 1990 2000 2010 2020
Prec
ipita
tion
(mm
)
Years
(c) Sargodha
Sargodha mu = 72.245 Linear (Sargodha)
0
100
200
300
400
500
600
700
1970 1980 1990 2000 2010 2020
Prec
ipita
tion
(mm
)
Years
(d) Sialkot
Sialkot mu = 229.148 Linear (Sialkot)
050
100150200250300350400450500
1970 1980 1990 2000 2010 2020
Prec
ipita
tion
(mm
)
Years
(e) Jehlum
jehlum mu = 176.085 Linear (jehlum)
0
50
100
150
200
250
300
1970 1980 1990 2000 2010 2020
Prec
ipita
tion
(mm
)
Years
(f) Lahore
lahore mu = 140.364 Linear (lahore)
0
200
400
600
800
1970 1980 1990 2000 2010 2020
Prec
ipita
tion
(mm
)
Years
(a) Murree
Murree mu = 273.875 Linear (Murree)
0
50
100
150
200
250
300
1970 1980 1990 2000 2010 2020
Prec
ipita
tion
(mm
)
Years
(b) Faisalabad
faisalabad mu = 85.919 Linear (faisalabad)
Fig. 5 a-ag Homogeneity test analysis for stations in different region in Pakistan showing the trend of precipitation over the period of 1971–2010

3.5.3 Monsoon Onset over Region III
The Region III (central west) comprise of stations wheremonsoon reaches after the Region II. The amount ofprecipitation received in this region is less as comparedto the CMRP. The analysis of variation in monsoononset of Region III shows that the trend in the monsoononset is consistent with the central east region (Fig. 9).In the decade of 1971–1980, the onset occurred at themean date of 6th July with the standard deviation of4 days after which an earlier mean onset was observedin the next decade on 5th July ±2 days in 1981–1990.
In the decade of 1991–2000, the mean onset remainedconstant at 5th July with standard deviation of 3 days,however the mean onset again shifted toward earlierJuly i.e., 3rd July ±3 days in 2001–2010. Hence, thecentral west region shows an overall shift towards ear-lier onset in the summer monsoon during 1971–2010.
3.5.4 Monsoon Onset over Region IV
The Region IV (south) of the country consists of sta-tions which receives their share of rainfall from theArabian Sea during summer monsoon season. This
Spatio-Temporal Variability of Summer Monsoon Onset over Pakistan 157
Korean Meteorological Society
0100200300400500600700800
1970 1980 1990 2000 2010 2020
Prec
ipita
tion
(mm
)
Years
(g) Muzafarabad
Muzafarabad mu = 265.957
Linear (Muzafarabad)
50100150200250300350400450
1970 1980 1990 2000 2010 2020
Prec
ipita
tion
(mm
)
Years
(h) Kakul
Kakul mu = 196.424 Linear (Kakul)
0
100
200
300
400
500
1970 1980 1990 2000 2010 2020
Prec
ipita
tion
(mm
)
Years
(i) G.Dupa�a
G.Dupa�a mu = 215.624 Linear (G.Dupa�a)
0
100
200
300
400
500
600
1970 1980 1990 2000 2010 2020Pr
ecip
itatio
n (m
m)
Years
(j) Kotli
Kotli mu = 208.126 Linear (Kotli)
0
50
100
150
200
250
300
1970 1980 1990 2000 2010 2020
Prec
ipita
tion
(mm
)
Years
(k) Mianwali
Mianwali mu = 91.951 Linear (Mianwali)
020406080
100120140160180
1970 1980 1990 2000 2010 2020
Prec
ipita
tion
(mm
)
Years
(l) D.I.Khan
D.I.Khan mu = 49.882 Linear (D.I.Khan)
Fig. 5 (continued)

region receives rainfall far less than the north easternpart of the country (i.e., Region II) (Imran et al.2014). The temporal analysis of the monsoon onset inRegion II shows a consistent shift toward earlier onsetover the period of four decades i.e., 1971–2010. In1971–80, the mean onset date was observed to be 5thJuly with the standard deviation of 1 day while themean onset shows backward shift in the next three de-cades i.e., 4th July, 3rd July and 2nd July in 1981–90,1991–2000 and 2001–2010 respectively. Hence, it canbe concluded based on analysis that the onset inRegion III is showing a shift towards start of July(Fig. 10). Overall monsoon onset and standard deviationin all studied regions has been shown in Fig. 11.
3.6 Individual Station Analysis for Variabilityof Monsoon Onset
3.6.1 Individual Station Analysis of Region I (North)
In Astore, the monsoon onset has a shift from the firstweek of July to the last week of June. Similarly, inBunji, monsoon onset has shifted from the first week
of July to the last week of June. In Gupis the monsoononset does not show any significant shift but there isvariability in onset within the last week of June. InChitral there is a shift in monsoon onset from the firstweek of July to the last week of June. In Drosh there isa significant shift in the monsoon onset i.e., from thefirst week of July to the third week of June. In Gilgitthe monsoon onset mostly remained steady in the firstweek of July. The trend line shows the variability with-in the days of first week of July for Gupis. However, asignificant shift can be seen in Skardu which explainsthat the monsoon onset has shifted to earlier time. Theshift has occurred from the first week of July to the lastweek of June (Fig. 12 (a-g)).
3.6.2 Individual Station Analysis of Region II (Central East)
In Murree, a significant shift in monsoon onset has beenobserved from end of June to the third week of Juneduring the studied period. In Islamabad, the monsoononset shows a significant shift from first week of Julytowards last week of June from 1971 to 2010. TheKotli has shown a significant shift in monsoon onset
158 S. Ali et al.
Korean Meteorological Society
0
50
100
150
200
250
300
1970 1980 1990 2000 2010 2020
Prec
ipita
tion
(mm
)
Years
(m) Parachinar
Parachinar mu = 71.999 Linear (Parachinar)
020406080
100120140160180
1970 1980 1990 2000 2010 2020
Prec
ipita
tion
(mm
)
Years
(n) Kohat
Kohat mu = 57.763 Linear (Kohat)
0
50
100
150
200
250
1970 1980 1990 2000 2010 2020
Prec
ipita
tion
(mm
)
Years
(o) Peshawar
Peshawar mu = 37.317 Linear (Peshawar)
05
10152025303540
1970 1980 1990 2000 2010 2020
Prec
ipita
tion
(mm
)
Years
(p) Skardu
Skardu mu = 9.846 Linear (Skardu)
Fig. 5 (continued)
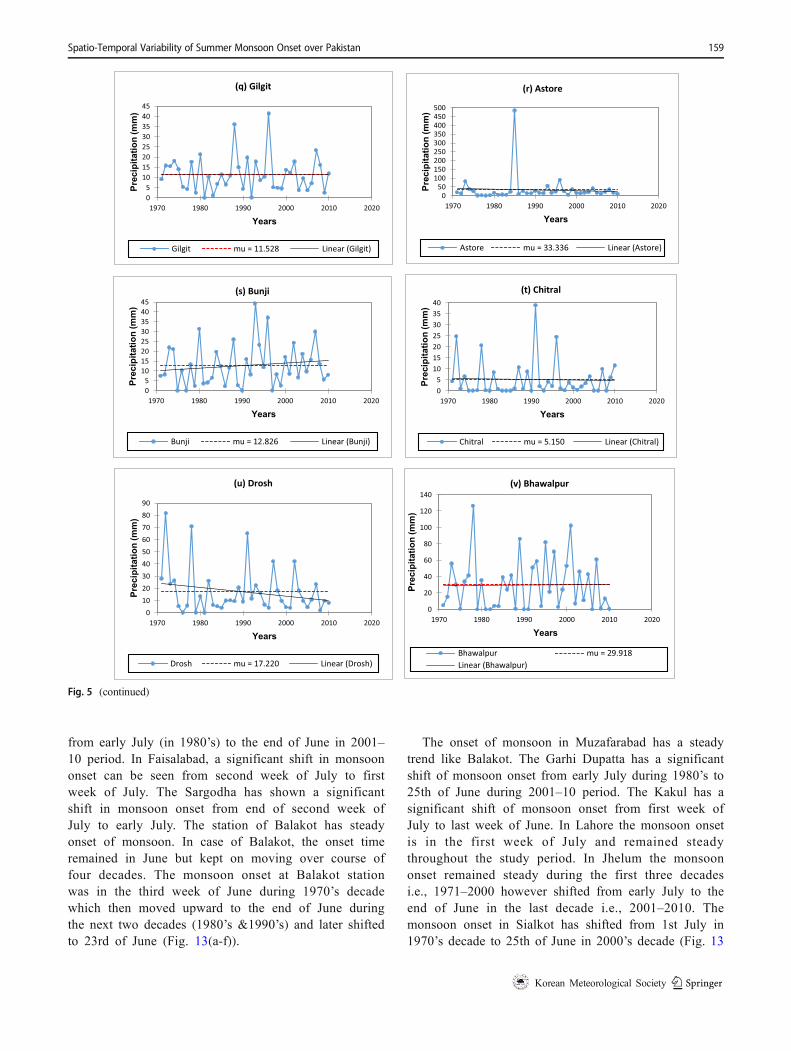
from early July (in 1980’s) to the end of June in 2001–10 period. In Faisalabad, a significant shift in monsoononset can be seen from second week of July to firstweek of July. The Sargodha has shown a significantshift in monsoon onset from end of second week ofJuly to early July. The station of Balakot has steadyonset of monsoon. In case of Balakot, the onset timeremained in June but kept on moving over course offour decades. The monsoon onset at Balakot stationwas in the third week of June during 1970’s decadewhich then moved upward to the end of June duringthe next two decades (1980’s &1990’s) and later shiftedto 23rd of June (Fig. 13(a-f)).
The onset of monsoon in Muzafarabad has a steadytrend like Balakot. The Garhi Dupatta has a significantshift of monsoon onset from early July during 1980’s to25th of June during 2001–10 period. The Kakul has asignificant shift of monsoon onset from first week ofJuly to last week of June. In Lahore the monsoon onsetis in the first week of July and remained steadythroughout the study period. In Jhelum the monsoononset remained steady during the first three decadesi.e., 1971–2000 however shifted from early July to theend of June in the last decade i.e., 2001–2010. Themonsoon onset in Sialkot has shifted from 1st July in1970’s decade to 25th of June in 2000’s decade (Fig. 13
Spatio-Temporal Variability of Summer Monsoon Onset over Pakistan 159
Korean Meteorological Society
05
1015202530354045
1970 1980 1990 2000 2010 2020
Prec
ipita
tion
(mm
)
Years
(s) Bunji
Bunji mu = 12.826 Linear (Bunji)
0102030405060708090
1970 1980 1990 2000 2010 2020
Prec
ipita
tion
(mm
)
Years
(u) Drosh
Drosh mu = 17.220 Linear (Drosh)
05
10152025303540
1970 1980 1990 2000 2010 2020
Prec
ipita
tion
(mm
)Years
(t) Chitral
Chitral mu = 5.150 Linear (Chitral)
05
1015202530354045
1970 1980 1990 2000 2010 2020
Prec
ipita
tion
(mm
)
Years
(q) Gilgit
Gilgit mu = 11.528 Linear (Gilgit)
0
20
40
60
80
100
120
140
1970 1980 1990 2000 2010 2020
Prec
ipita
tion
(mm
)
Years
(v) Bhawalpur
Bhawalpur mu = 29.918Linear (Bhawalpur)
050
100150200250300350400450500
1970 1980 1990 2000 2010 2020
Prec
ipita
tion
(mm
)
Years
(r) Astore
Astore mu = 33.336 Linear (Astore)
Fig. 5 (continued)

(g-l)). In almost all of the stations the onset of monsoonin 1980’s appeared to occur in the first or second weekof July. While in remaining three decades the onsetr ema ined in June wi th some excep t ions l ikeFaisalabad, Sargodha and Lahore etc.
3.6.3 Individual Stations Analysis of Region III (Central West)
In Mianwali, the monsoon onset shows a steady trend duringthe four decades (i.e., 1971–2010) as it has shifted from firstweek of July to the end of June. In Kohat, the onset shiftedfrom second week of July to the first week of July. The
Parachinar station received the highest amount of precipitationas compared to other stations in this region (cf. Shah et al.2012). The station shows onset of monsoon in the month ofJune as compared to other stations in the central west regionwhere onset occurred mostly in the month of July. However,the trend of mean onset dates among four decades is similar tothat of other stations where mean onset is shifting towardsearlier time i.e. from first week of July to the third week ofJune. The mean onset trend in D.I.Khan is similar to that ofParachinar as the second decade i.e., 1981–1990 showsa shift towards late monsoon onset as compared to thefirst decade i.e., 1971–1980. However, the overall trend
160 S. Ali et al.
Korean Meteorological Society
0
200
400
600
800
1000
1200
1400
1970 1980 1990 2000 2010 2020
Prec
ipita
tion
(mm
)
Years
(w) Multan
Multan mu = 72.126 Linear (Multan)
0
20
40
60
80
100
120
1970 1980 1990 2000 2010 2020
Prec
ipita
tion
(mm
)
Years
(y) Hyderabad
hyderabad mu = 25.235 Linear (hyderabad)
020406080
100120140160180
1970 1980 1990 2000 2010 2020
Prec
ipita
tion
(mm
)
Years
(x) Bhawalnagar
Bhawalnagar mu = 66.269Linear (Bhawalnagar)
0
10
20
30
40
50
60
70
80
1970 1980 1990 2000 2010 2020
Prec
ipita
tion
(mm
)
Years
(z) Khanpur
khanpur mu = 12.608 Linear (khanpur)
0
50
100
150
200
1970 1980 1990 2000 2010 2020
prec
ipita
tion(
mm
)
Years
(aa) Jacobabad
jacobabad mu = 22.675 Linear (jacobabad)
Fig. 5 (continued)

of monsoon onset is not as significant as on other sta-tions in the region, but it shows a trend of earlier onsetof monsoon with a shift to the start of July. In
Peshawar and Cherat a shift in monsoon onset has beenobserved from second week of July towards the firstweek of July (Fig. 14(a-f)).
Table 4 Table showing mean precipitation values before and after break point of stations with inhomogeneity
Station μ1 (Mean value of precipitation before Break point) μ2 (Mean value of precipitation after Break point)
Islamabad 230.1 65.8
Balakot 371.3 205.02
Cheerat 124.5 48.5
Gupis 6.26 17.2
Spatio-Temporal Variability of Summer Monsoon Onset over Pakistan 161
Korean Meteorological Society
0
20
40
60
80
100
120
140
1970 1980 1990 2000 2010 2020
Prec
ipita
tion
(mm
)
Years
(ab) Zhob
Zhob mu = 47.748 Linear (Zhob)
0
20
40
60
80
100
120
1970 1980 1990 2000 2010 2020
Prec
ipita
tion
(mm
)
Years
(ac) Dalbandin
dalbadin mu = 6.133 Linear (dalbadin)
0
100
200
300
400
500
600
700
1970 1980 1990 2000 2010 2020
Prec
ipita
tion
(mm
)
Years
(ad) Islamabad
Islamabad mu1 = 230.105
mu2 = 65.800 Linear (Islamabad)
0
100
200
300
400
500
600
700
800
1970 1980 1990 2000 2010 2020
Prec
ipita
tion
(mm
)
Years
(ae) Balakot
Balakot mu1 = 371.399
mu2 = 205.026 Linear (Balakot)
0
50
100
150
200
250
300
1970 1980 1990 2000 2010 2020
Peci
pita
tion
(mm
)
Years
(af) Cheerat
Cheerat mu1 = 124.504
mu2 = 48.572 Linear (Cheerat)
01020304050607080
1970 1980 1990 2000 2010 2020
Prec
ipita
tion
(mm
)
Years
(ag) Gupis
Gupis mu1 = 6.268
mu2 = 17.218 Linear (Gupis)
Fig. 5 (continued)
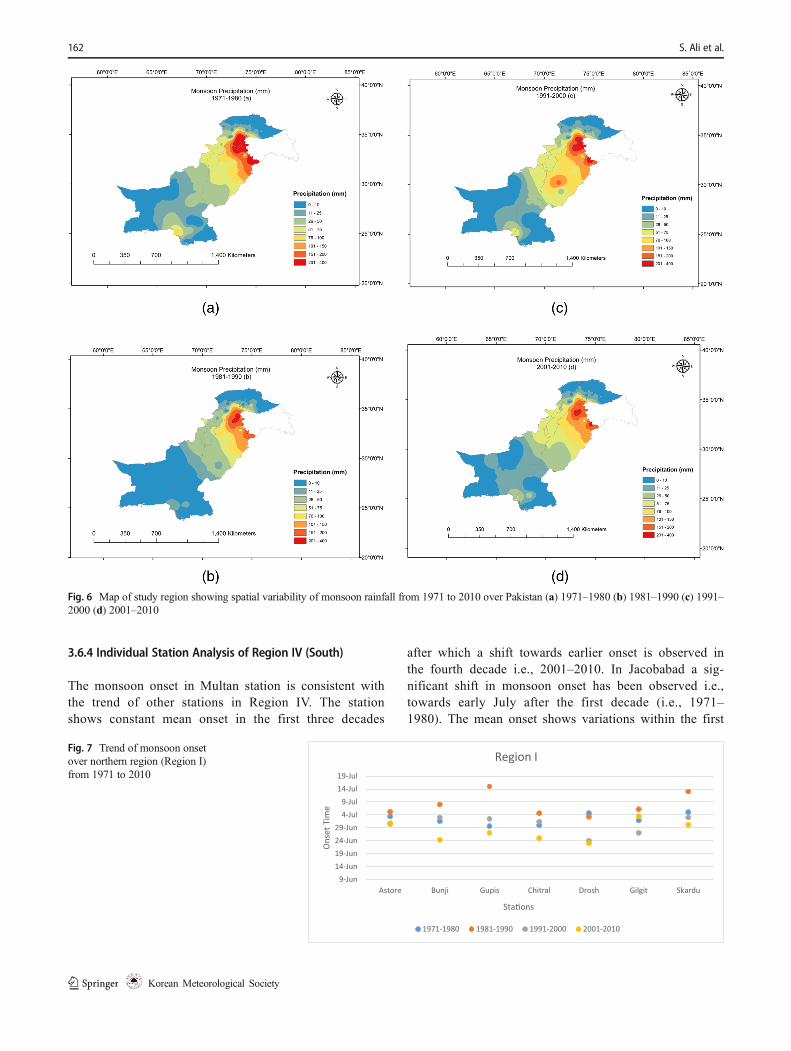
3.6.4 Individual Station Analysis of Region IV (South)
The monsoon onset in Multan station is consistent withthe trend of other stations in Region IV. The stationshows constant mean onset in the first three decades
after which a shift towards earlier onset is observed inthe fourth decade i.e., 2001–2010. In Jacobabad a sig-nificant shift in monsoon onset has been observed i.e.,towards early July after the first decade (i.e., 1971–1980). The mean onset shows variations within the first
Fig. 7 Trend of monsoon onsetover northern region (Region I)from 1971 to 2010
162 S. Ali et al.
Korean Meteorological Society
Fig. 6 Map of study region showing spatial variability of monsoon rainfall from 1971 to 2010 over Pakistan (a) 1971–1980 (b) 1981–1990 (c) 1991–2000 (d) 2001–2010
9-Jun14-Jun19-Jun24-Jun29-Jun
4-Jul9-Jul
14-Jul19-Jul
Astore Bunji Gupis Chitral Drosh Gilgit Skardu
Ons
et T
ime
Sta�ons
Region I
1971-1980 1981-1990 1991-2000 2001-2010

week of July over the period of four decades inJacobabad. In Khanpur there is variability in the mon-soon onset over the four decades. The onset shows asharp forward shift in the second decade i.e., 1981–1990 as compared to the first decade (i.e., 1971–1980); it again comes to the same date in the thirddecade (i.e., 1991–2000) after which a shift to the ear-lier time in mean onset is observed in the last decade(i.e., 2001–2010), however the overall trend has notshifted significantly. The trend in monsoon onset overBahawalpur is similar to that of Jacobabad in which themean onset seems to be sharply shifted to the last weekof June.
In Karachi, the monsoon onset in the first two de-cades (i.e., 1971–1980 & 1981–1990) shows a shift tothe earlier time however in the third decade (i.e., 1991–2000) the mean date shows forward shift after which itagain followed the shift to earlier time in the fourthdecade (i.e., 2001–2010). In Hyderabad, the trend doesnot show any significant shift and the monsoon onsetremained during the first week of July throughout thestudy period. The trend in monsoon onset for the sta-tions of Zhoab and Bahawalnagar show a steady shift to
earlier time in monsoon onset. However, the monsoononset for the last decade in Zhoab was observed at theend of June while all other stations show monsoon on-set in early July (Fig. 15 (a-h)).
3.6.5 Overall Monsoon Trends of Regions
The average summer monsoon rainfall (June–July-August) for the 40-year period 1970–2010 in theRegions (I, II and III) and Region IV of Pakistan areplotted with the standardized values in Figs. 16, 17, and18. A recent study by Preethi et al. (2017) suggests adecreasing trend in summer monsoon rainfall oversouthern parts of Pakistan which comprises of ourRegion IV and increasing trend over the northern partsof Pakistan i.e., Region I, II and III in this study.
4 Discussion
The current study indicates inter-decadal spatial andtemporal variability in the precipitation related to themonsoon onset in Pakistan. The results are consistent
Fig. 8 Trend of monsoon onsetover central east region (RegionII) from 1971 to 2010
Fig. 9 Trend of monsoon onsetover central west region (RegionIII) from 1971 to 2010
Spatio-Temporal Variability of Summer Monsoon Onset over Pakistan 163
Korean Meteorological Society
14-Jun
19-Jun
24-Jun
29-Jun
4-Jul
9-Jul
14-Jul
19-Jul
Ons
et T
ime
Sta�ons
Region II
1971-1980 1981-1990 1991-2000 2001-2010
18-Jun
22-Jun
26-Jun
30-Jun
4-Jul
8-Jul
12-Jul
16-Jul
Mianwali Kohat Parachinar DI Khan Peshawar Cherat
Ons
et T
ime
Sta�ons
Region III
1971-1980 1981-1990 1991-2000 2001-2010

with the studies carried out around the globe indicating thechanges in the summermonsoon rainfall in South Asia includ-ing Pakistan (Das et al. 2013; Imran et al. 2014; Latif and Syed2015). Seasonal mean rainfall in south Asia shows inter-decadal variability, particularly in terms of declining trendwith frequently occurring deficiency in summer monsoonrainfall (Intergovernmental Panel on Climate Change 2014).In this regard, Pakistan has a noticeable share in the largeclimatic variations taken place in the northwest India duringthe Holocene which has caused the spatial shifts in the rainfallpattern of the region (Bryson and Murray 1977).
The analysis of temporal variability in monsoonshows that the mean onset has shifted from earlierJuly to the end of June. The results are consistent forall the four regions as well as for all the stations in-cluded in the study. This trend of earlier onset followsthe study carried out by Imran et al. (2014), whichinclude the major stations of the Region II constitutingCMRP. This study also shows the time of monsoononset at the stations like Islamabad and Lahore whichagrees with the results of the current study. Moreover,
the calculated onset time using the criteria agrees withthe time calculated by Latif and Syed (2015). However,minor differences exist in the mean onset time shown inthis study as compared to the previous studies on se-lected stations (c.f. Latif and Syed 2015). The studies ofImran et al. (2014) and Latif and Syed (2015) are lim-ited to Region II and CMRP respectively while the cur-rent study cover almost whole of Pakistan and providesthe depth analysis of variability in the monsoon onset.The assessment has been carried out for each stationindividually as well as for different regions of Pakistanwhich provide a comprehensive picture of previousmonsoon onset trends in Pakistan. Moreover, this studyprovides a reliable base for conducting future projectionstudies relevant to monsoon trends in Pakistan. Theshift in monsoon onset may be due to the changes inthe specific humidity over the Indian Ocean andArabian Sea (Sahana et al. 2015).
It is noted that, during the time period 1981–1990,the onset on all stations have shown a significant delay.This delay might be attributed to the unusual climatic
Fig. 11 Standard deviation ofmonsoon onset in four regions ofPakistan over the four decadesfrom 1971 to 2010
Fig. 10 Trend of monsoon onsetover southern region (Region IV)from 1971 to 2010
164 S. Ali et al.
Korean Meteorological Society
9-Jun
14-Jun
19-Jun
24-Jun
29-Jun
4-Jul
9-Jul
14-Jul
19-Jul
Region I Region II Region III Region IV
Ons
et T
ime
Studied Regions
1971-80 1981-90 1991-2000 2001-2010
26-Jun
28-Jun
30-Jun
2-Jul
4-Jul
6-Jul
8-Jul
10-Jul
Multan Jacocabad Khanpur B-Pur Karachi Hyderabad Zhoab B-nagar
Ons
et T
ime
Sta�ons
Region IV
1971-1980 1981-1990 1991-2000 2001-2010

Spatio-Temporal Variability of Summer Monsoon Onset over Pakistan 165
Korean Meteorological Society
04-Jun14-Jun24-Jun04-Jul14-Jul24-Jul
setadtesnO
(a) Astore
04-Jun14-Jun24-Jun04-Jul14-Jul24-Jul
Ons
et D
ates
(b) Bunji
25-May
14-Jun
04-Jul
24-Jul
13-Aug
setadtesnO
(c) Gupis
04-Jun14-Jun24-Jun04-Jul14-Jul24-Jul
Ons
et d
ates
(d) Chitral
04-Jun
14-Jun
24-Jun
04-Jul
14-Jul
24-Jul
Ons
et D
ates
(e) Drosh
04-Jun
14-Jun
24-Jun
04-Jul
14-Jul
24-Jul
Ons
et D
ates
(f) Gilgit
25-May
04-Jun
14-Jun
24-Jun
04-Jul
14-Jul
24-Jul
Ons
et D
ates
(g) Skardu
Fig. 12 Trend of monsoon onset over individual stations of north region (Region I)

14-Jun
19-Jun
24-Jun
29-Jun
04-Jul
09-JulsetaDtesnO
(a) Murree
04-Jun09-Jun14-Jun19-Jun24-Jun29-Jun04-Jul09-Jul14-Jul19-Jul
Onse
t Dat
es
(b) Islamabad
09-Jun14-Jun19-Jun24-Jun29-Jun04-Jul09-Jul14-Jul
setaDtesnO
(c) Kotli
24-Jun26-Jun28-Jun30-Jun02-Jul04-Jul06-Jul08-Jul10-Jul12-Jul14-Jul
Onse
t Dat
es
(d) Faisalabad
04-Jun
14-Jun
24-Jun
04-Jul
14-Jul
24-Jul
03-Aug
setaDtesnO
(e) Sargodha
09-Jun14-Jun19-Jun24-Jun29-Jun04-Jul09-Jul14-Jul
Onse
t Dat
es
(f) Balakot
09-Jun14-Jun19-Jun24-Jun29-Jun04-Jul09-Jul14-Jul
1971-80 1981-90 1991-2000 2001-2010
setaDtesnO
(g) Muzafarabad
09-Jun14-Jun19-Jun24-Jun29-Jun04-Jul09-Jul
Onse
t Dat
es
(h) G.Dupa�a
Fig. 13 Trend of monsoon onset over individual stations of central east region (Region II)
166 S. Ali et al.
Korean Meteorological Society

event like ENSO. It is evident from the scientific liter-ature that a worst Asian drought occurred during 1987(Kumar and Dassai 2004), which is attributed to thestrong ENSO year. Also, various studies provide theconnection of delayed onset of monsoon with El Ninoevent. Zhou and Chan (2007) indicated that in the yearsassociated with warm El Nino event, the monsoon tendsto have a delayed onset.
The study conducted by Latif et al. (2016) indicatesthat the highest rainfall area of 200 mm/month is ob-served over CMRP which is also evident from the spa-tial analysis of rainfall during onset time carried out incurrent study. In fact, this high rainfall zone is mostlyaffected by the penetration of monsoon currentsresulting from the depressions/low pressure systemstravelling west and north-westward from Bay ofBengal (Faisal and Sadiq 2012). As pointed out byRahmatullah (1952), monsoon rainfall hardly ap-proaches western Pakistan (Baluchistan Province), ex-cept when westward moving depressions from Bay ofBengal occasionally recurves toward this region, there-fore the amount of precipitation is low in these areas.The low amount of precipitation in these areas is be-cause of Arabian Sea branch of monsoon (Imran et al.2014).
Pakistan receives the summer monsoon rainfallthrough two different systems; first from Bay ofBengal, the south westerly winds strike the Himalayasand enters Pakistan after deflecting and travelling alongthe foothill of Himalayas while second is the southwestwinds that enter south Pakistan from the Arabian Sea.The Region I and II comprise the north-eastern belt ofmonsoon in Pakistan where Sialkot, Jhelum, Islamabadand Lahore stations lie that receive first monsoon rain-fall from these currents and make the north-eastern beltof summer monsoon, therefore, show an earlier onset atthe end of June. After Region II, the winds penetratethe Region III which experiences monsoon onset laterand hence shows an onset in start of July. Region IVreceives monsoon partially from a weakened north-eastern belt and partially from south-western windswhich is developed later and cause the onset in the startof July.
The spatial analysis done in this study has shownthat the amount of precipitation has decreased in allregions over the course of four decades, with leastamount of precipitation is received during the decadeof 1981–1990. Latif et al. (2016) has also indicatedsignificant weakening trends of seasonal mean rainfallover the south Asian region during monsoon season for
04-Jun09-Jun14-Jun19-Jun24-Jun29-Jun04-Jul09-Jul14-Jul
setaDtesnO
(i) Kakul
04-Jun09-Jun14-Jun19-Jun24-Jun29-Jun04-Jul09-Jul14-Jul19-Jul
Onse
t Dat
es
(j) Lahore
09-Jun14-Jun19-Jun24-Jun29-Jun04-Jul09-Jul14-Jul19-Jul24-Jul
1971-80 1981-90 1991-2000 2001-2010
setaDtesnO
(k) Jehlum
09-Jun14-Jun19-Jun24-Jun29-Jun04-Jul09-Jul14-Jul
Onse
t Dat
es
(l) Sialkot
Fig. 13 (continued)
Spatio-Temporal Variability of Summer Monsoon Onset over Pakistan 167
Korean Meteorological Society

the period of 1951–2012 using CRU data sets.Similarly, a study by Singh and Sen (2002) found de-creasing trend of summer monsoon rainfall from 1964to 1992 in Beas River catchment. Moreover, thedrought occurred during the 1980’s might be a reasonof less amount of precipitation during the decade of1981–1990. The results show that the area with highestamount of mean precipitation seems to be shrinkingover the period of four decade which agrees with thestudy carried out by Hanif et al. (2013). Hanif et al.(2013) stated that the extreme monsoon rainfall was
observed shifting away from the eastern boundary to-wards the north-western part of Pakistan. Our resultsshow that the drier condition in the parts of Sindh andBaluchistan Provinces which have been indicated byHanif et al. (2013), are showing the decreasing precip-itation trend in southern part of Pakistan as well asalong the coastal belt and parts of Sindh Province.
Hence, understanding the spatio-temporal distribution ofprecipitation during the monsoon period is essential to waterresource management in Pakistan, such as flood management,flood mitigation, water conservation, and irrigation system.
168 S. Ali et al.
Korean Meteorological Society
Fig. 14 Trend of monsoon onset over individual stations of central west region (Region III)
14-Jun19-Jun24-Jun29-Jun04-Jul09-Jul14-Jul19-Jul
setaDtesnO
(a) Mianwali
14-Jun19-Jun24-Jun29-Jun04-Jul09-Jul14-Jul19-Jul24-Jul
1971-80 1981-90 1991-2000 2001-2010
Ons
et D
ates
(b) Kohat
14-Jun
19-Jun
24-Jun
29-Jun
04-Jul
09-Jul
setaDtesnO
(c) Parachinar
09-Jun
14-Jun
19-Jun
24-Jun
29-Jun
04-Jul
09-Jul
14-Jul
19-Jul
1971-80 1981-90 1991-2000 2001-2010
Ons
et D
ates
(d) DI Khan
19-Jun24-Jun29-Jun04-Jul09-Jul14-Jul19-Jul
1971-80 1981-90 1991-20002001-2010
setaDtesnO
(e)Peshawar
19-Jun
24-Jun
29-Jun
04-Jul
09-Jul
14-Jul
19-Jul
1971-80 1981-90 1991-20002001-2010
Ons
et D
ates
(f) Cherat

As the economy of Pakistan is highly supported from theagriculture sector, the occurrence of monsoon rainfall (fromJune–September) is very important. The accurate prediction of
space–time precipitation in Pakistan provides useful informa-tion for decision making in the management of water re-sources (Bates et al. 2008).
Spatio-Temporal Variability of Summer Monsoon Onset over Pakistan 169
Korean Meteorological Society
14-Jun19-Jun24-Jun29-Jun04-Jul09-Jul14-Jul19-Jul
setaDtesnO
(a) Multan
09-Jun14-Jun19-Jun24-Jun29-Jun04-Jul09-Jul14-Jul19-Jul
Ons
et D
ates
(b) Jacocabad
19-Jun
24-Jun
29-Jun
04-Jul
09-Jul
14-Jul
setaDtesnO
(c) Khanpur
14-Jun19-Jun24-Jun29-Jun04-Jul09-Jul14-Jul19-Jul
1971-80 1981-90 1991-20002001-2010
Ons
et D
ates
(d) B-Pur
09-Jun14-Jun19-Jun24-Jun29-Jun04-Jul09-Jul14-Jul
setaDtesnO
(e) Karachi
14-Jun19-Jun24-Jun29-Jun04-Jul09-Jul14-Jul19-Jul
Ons
et D
ates
(f) Hyderabad
19-Jun
24-Jun
29-Jun
04-Jul
09-Jul
14-Jul
setaDtesnO
(g) Zhoab
09-Jun14-Jun19-Jun24-Jun29-Jun04-Jul09-Jul14-Jul19-Jul
Ons
et D
ates
(h) Bahawalnagar
Fig. 15 Trend of monsoon onset over individual stations of southern region (Region IV)

Fig. 16 Average of summermonsoon rainfall for stationsfalling in the Regions I, II and III
Fig. 17 Average of summermonsoon rainfall for stationsfalling in the Region IV
Fig. 18 Average of summermonsoon rainfall for stations in allthe four regions and standarddeviation
170 S. Ali et al.
Korean Meteorological Society
-2.5
-2
-1.5
-1
-0.5
0
0.5
1
1.5
2
2.5
1971
1972
1973
1974
1975
1976
1977
1978
1979
1980
1981
1982
1983
1984
1985
1986
1987
1988
1989
1990
1991
1992
1993
1994
1995
1996
1997
1998
1999
2000
2001
2002
2003
2004
2005
2006
2007
2008
2009
2010
-2
-1.5
-1
-0.5
0
0.5
1
1.5
2
2.5
3
1971
1972
1973
1974
1975
1976
1977
1978
1979
1980
1981
1982
1983
1984
1985
1986
1987
1988
1989
1990
1991
1992
1993
1994
1995
1996
1997
1998
1999
2000
2001
2002
2003
2004
2005
2006
2007
2008
2009
2010
-2.5
-2
-1.5
-1
-0.5
0
0.5
1
1.5
2
2.5
1971
1972
1973
1974
1975
1976
1977
1978
1979
1980
1981
1982
1983
1984
1985
1986
1987
1988
1989
1990
1991
1992
1993
1994
1995
1996
1997
1998
1999
2000
2001
2002
2003
2004
2005
2006
2007
2008
2009
2010

5 Conclusion
This study provides a detailed insight to the monsoon onsetover Pakistan from 1971 to 2010. In the present study conclu-sion has been drawn based on statistical analysis of precipita-tion data obtained from 35 weather stations located all overPakistan. Analysis of 40 years of data revealed variations inthe time of summer monsoon onset over Pakistan. The tem-poral analysis shows that monsoon onset has an earlier shift inPakistan region. Although there are certain factors which ef-fect the monsoon system such as ENSO that has caused adelay in the monsoon onset during the decade of 1981–1990. Therefore, the mean monsoon onset over 40 years hasa shift to an earlier time in the whole region.
Spatial analysis in this study revealed the decreasing trendin total amount of precipitation in all regions within definedtime period of 20th June–20th July, over the course of fourdecades. Region II received highest amount of precipitationamong all regions whereas the Region IV is deprived of plen-tiful and enough rainfall. Winds from Arabian Sea bring pre-cipitation in the southern part of the country and it is evidentfrom the study that in 1970’s there was a significant amount ofprecipitation in the region although the area receiving the pre-cipitation was quite smaller. Over the course of these fourdecades that smaller area is diminishing. The overall decreas-ing trend in precipitation can be attributed to impacts of cli-mate change.
Pakistan is an agricultural country with cropping pat-tern largely dependent on monsoon rainfall. The resultsobtained in this study will help in predicting and investi-gating the future scenario of rainfall and monsoon weathersystem which is a life line for agriculture in Pakistan.Therefore, accurate prediction of monsoon onset will helpto manage the agricultural issues in an efficient way. Inorder to understand recent trends in temporally shiftedprolonged monsoon and spatially occurring rainfalls inPakistan, it is necessary to explore trends in precipitationover the regions prone to environmental changes.Moreover, a better understanding of precipitation patternswill be helpful for the future planning in terms of wateravailability and utilization in various fields most impor-tantly for power generation and irrigation purposes.
Acknowledgments Open access funding provided by InternationalInstitute for Applied Systems Analysis (IIASA). We acknowledgeGlobal Change Impact Studies Center, Islamabad, Pakistan for its supportin performing analysis.
Open Access This article is distributed under the terms of the CreativeCommons At t r ibut ion 4 .0 In te rna t ional License (h t tp : / /creativecommons.org/licenses/by/4.0/), which permits unrestricted use,distribution, and reproduction in any medium, provided you give appro-priate credit to the original author(s) and the source, provide a link to theCreative Commons license, and indicate if changes were made.
References
Ahmad, I., Mahmood, I., Malik, I.R., Arshad, I.A., Haq, E.I., Iqbal, Z.:Probability analysis of monthly rainfall on seasonal monsoon inPakistan. Int. J. Climatol. 34, 827–834 (2014)
Ananthakrishnan, R., Soman, M.K.: The onset of the south-west mon-soon over Kerala.1901- 1980. J. Clim. 8, 283–296 (1988)
Bates, B.C., Kundzewicz, Z.W., Wu, S., Palutikof, J.P.: Climate Changeand Water, Technical paper of the Intergovernmental Panel onClimate Change, p. 210 (2008)
Bhat, G.S., Chakraborty, A., Nanjundiah, R.S., Srinivasan, J.: Verticalthermal structure of the atmosphere during active and weak phasesof convection over the north bay of Bengal: observation and modelresults. Curr. Sci. 83, 296–302 (2002)
Bryson, R.A.,Murray, T.J.: Climates of Hunger: Mankind and the world’sChanging Weather. University of Wisconsin Press, Madison (1977)
Chang, C.K., Ghani, A., Puay, H.T., Othman,M.A.: Homogeneity testingand trends analysis in long term rainfall data for Sungai PahangRiver Basin over 40 years records. Proceedings of the 37th IAHRWorld Congress. Kuala Lumpur, Malaysia (2017)
Compendium of Meteorology.: Editor Aksel, W.N. Volume II, Part 4 –Tropical meteorology, prepared by Krishnamurti, T.N. WorldMeteorological Organization, Geneva, Switzerland (364), 238(1979)
Cook, B.I., Buckley, B.M.: Objective determination of monsoon seasononset, withdrawal, and length. J. Geoph. Res. 114, D23109 (2009)
Das, S.K., Deb, S.K., Kishtawal, C.M., Pal, P.K.: Seasonal prediction ofIndian summer monsoon: sensitivity to persistent SST. J. Earth Syst.Sci. 122(5), 1183–1193 (2013)
Ding, Y.H., Chan, C.L.: The east Asian summer monsoon: an overview.Meteor. Atoms Phys. 89, 117–142 (2005)
Ding, Y., Sikka, D.R.: Synoptic systems and weather. In: Wang, B. (ed.)The Asian Monsoon, pp. 131–201. Springer, Berlin (2006)
ESRI-Make predictions overview—Analytics | ArcGIS Desktop.:Environmental Systems Research Institute ESRI. http://desktop.arcgis.com/en/analytics/case–studies/overview–of–make–predictions.htm (2017). Accessed on 22 December 2017
Faisal, N., Sadiq, N.: Monsoon onset over selected eastern boundarycities of Pakistan. Nucleus. 49, 239–245 (2012)
Fasullo, J., Webster, P.J.: A hydrological definition of Indian monsoononset and withdrawal. J. Clim. 16(19), 3200–3211 (2003)
Hanif, M., Khan, A.H., Adnan, S.: Latitudinal precipitation characteris-tics and trends in Pakistan. J. Hyd. 492, 266–272 (2013)
Imran, A., Zaman, Q., Rasul, G., Mahmood, A.: An analytical study ofthe variations in the monsoon patterns over Pakistan. Pak. J. Met.10(20), 25–37 (2014)
India Meteorological Department (IMD): Climatological Atlas forAirmen. India Meteorological Department, New Delhi (1943)
Intergovernmental Panel on Climate Change-IPCC: Contribution ofworking group II to the fifth assessment report of the intergovern-mental panel on climate change, pp. 1327–1370. CambridgeUniversity press, Cambridge, and New York (2014)
IUCN:Nepal. Proceeding, workshop on ‘stabilizing climate change in theHimalayas’ (2009)
Johnson, R.H., Ciesielski, H.P., Keenan, T.D.: Oceanic east Asian mon-soon convection: results from the 1998 SCSMEX. In: The EastAsian Monsoon. Ed. by C. P. Chang. World Scientific, Singapore,436–459 (2004)
Joseph, P.V., Sooraj, K.P., Rajan, C.K.: The summer monsoon onset pro-cess over south Asia and an objective method for the date of mon-soon onset over Kerala. Int. J. Climatol. 26, 1871–1893 (2006)
Kang, H.M., Yusof, F.: Homogeneity tests on daily rainfall series in pen-insular Malaysia. Int. J. Contemp. Math. Sci. 7, 9–72 (2012)
Spatio-Temporal Variability of Summer Monsoon Onset over Pakistan 171
Korean Meteorological Society

Karabork, M.C., Kahya, E., Komuscu, A.U.: Analysis of Turkish precip-itation data: homogeneity and the southern oscillation forcings onfrequency distributions. Hydr. Proc. 21, 3203–3210 (2007)
Krishnamurti, T.N.: Summer Monsoon experiment-a review. Mon. Wea.Rev. 113, 1590–1626 (1985)
Kumar, R., Dassai, P.: A new criterion for identifying breaks inmonsoon conditions over the Indian subcontinent. Geoph.Res. Lett. 31(1–4), (2004)
Kumar, M.R.R., Sankar, A., Reason, C.: An investigation into the condi-tions leading to monsoon onset over Kerala. Theor. App. Clim.95(1–2), 69–82 (2009)
Lai, M., Whettori, P.H., Pittodi, A.B., Chakraborty, B.: The greenhousegas induced climate change over the Indian sub-continent asprojected by GCM model experiments. Terr. Atmos. Oce. Sci.9(663–669), (1998)
Latif, M., Syed, F.: Determination of summer monsoon onset and itsrelated large–scale circulation characteristics over Pakistan. Theor.App. Clim. 125, 509–520 (2015)
Latif, M., Syed, F.S., Hannachi, A.: Rainfall trends in the south Asiansummer monsoon and its related large-scale dynamics with focusover Pakistan. Clim. Dyn. 48, 3565–3581 (2016)
Lau, K.M., Ding, Y.H., Wang, J.T., Johnson, R., Keenan, T.,Cifelli, R., Gerlach, J., Thiele, O., Rickenbach, T., Tsay,S.C., et al.: A report of the field operation and early resultsof the South China Sea Monsoon experiment (SCSMEX).Bull. Amer. Meteor. Soc. 81, 1261–1270 (2000)
Pai, D.S., Nair, R.M.: Summer monsoon onset over Kerala: new defini-tion and prediction. J. Earth. Syst. Sci. 118(2), 123–135 (2009)
Peterson, T.C., Easterling, D.R., Karl, T.R., Groisman, P., Nicholls, N.,Plummer, N., Torok, S., Auer, I., Boehm, R., Gullett, D., Vincent, L.,Heino, R., Tuomenvirta, H., Mestre, O., Szentimrey, T., Salinger, J.,Forland, E., Hanssen-Bauer, I., Alexandersson, H., Jones, P., Parker,D.: Homogeneity adjustments of in situ atmospheric climate data: areview. Int. J. Climatol. 18, 1493–1517 (1998)
Pettitt, A.N.: A non-parametric approach to the change point problem. J.App. Stat. 28, 126–135 (1979)
Preethi, B., Mujumdar, M., Kripalani, R.H., Prabhu, A., Krishnan, R.:Recent trends and tele-connections among south and east Asiansummer monsoon in a warming environment. Clim. Dyn. 48,2489–2505 (2017)
Puranik, S.S., Ray, K.S., Sen, P.N., Kumar, P.P.: An index forpredicting the onset of monsoon over Kerala. Curr. Sci.105(7), 954–961 (2013)
Rahmatullah, M.: Synoptic aspects of the monsoon circulation and rain-fall over indo-Pakistan. J. Met. 9, 176–179 (1952)
Raju, P.V.S., Mohanty, U.C., Bhatla, R.: Onset characteristics ofthe southwest monsoon over India. Int. J. Climatol. 25(2),167–182 (2005)
Rashid, K., Rasul, G.: Rainfall variability and maize production over thePotohar plateau of Pakistan. Pak. J. Met. 8, 63–74 (2011)
Rasul, G., Chaudhry, Q.Z.: Review of advance in research on Asiansummer Monsoon. Pak. J. Met. 6(12), 1–10 (2010)
Sadiq, N., Qureshi, M.S.: Climatic variability and linear trend models forthe five major cites of Pakistan. J. Geogr. Geol. 2(1), 83–92 (2010)
Saeed, S., Müller, W.A., Hagemann, S., Jacob, D., Mujumdar, M. andKrishnan, R.: Precipitation variability over the South Asian mon-soon heat low and associated teleconnections. Geophys. Res. Lett.38, (2011). https://doi.org/10.1029/2011GL046984
Sahana, A.S., Ghosh, S., Ganguly, A., Murtugudde, R.: Shift in Indiansummer Monsoon onset during 1976-1977. Env. Res. Lett. 10(5),054006 (2015)
Shah, M.A., Zeb, A., Mahmood, S.: In: Met, P.J. (ed.) The RainfallActivity and Temperatures Distribution over KPK during theMonsoon Season (July to September) 2009, vol. 8, pp. 43–69 (2012)
Shamshad, K.: Predicting Stream Flow and Sediment Yield forMountainous Areas in Northern Pakistan. Ph.D. degree inWatershed Science. Utah State University (1988)
Simon, B., Rahman, S.H., Joshi, P.C.: Conditions leading to the onset ofthe Indian monsoon: a satellite perspective. Met. Atmos. Phys.93(3–4), 201–210 (2006)
Singh, N., Ranade, A.A.: Determination of Onset and Withdrawal Datesof Summer Monsoon across India Using NCEP/NCAR re-Analysis.Research Report No. RR-124. Indian Institute of TropicalMeteorology, Pune-411 008, India (2010)
Singh, R.B., Sen, R.S.: Climate variability and hydrological extremes in aHimalayan catchment. ERB and Northern European FRIENDProject 5 Conf., Slovakia (2002)
Smadi, M., Zghoul, A.: A sudden change in rainfall characteristics inAmman, Jordan during the mid-1950s. J. Env. Sci. 2, 84–91 (2006)
Wang, B., Ding, Q., Joseph, P.V.: Objective definition of the Indian sum-mer Monsoon onset. J. Clim. 22(12), 3303–3316 (2009)
Webster, P.J.: Oceans and monsoons, In The Global Monsoon System:Research and Forecast. Ed. by Chang, C. P., Wang, B., Lau, N.C.G.,WMO/TD NO.1266, 253–298 (2005)
Webster, P.J., Lukas, R.: The coupled ocean-atmospheric response exper-iment. Bull. Amer. Meteor. Soc. 73, 1377–1416 (1992)
Wijngaard, J.B., Klein, A.M.G., Konnen, G.P.: Homogeneity of 20thcentury European daily temperature and precipitation series. Int. J.Climatol. 23, 679–692 (2003)
Zhou,W., Chan, J.C.I.: ENSO and the South China Sea summermonsoononset. Int. J. Climatol. 27, 157–167 (2007)
Publisher’s Note Springer Nature remains neutral with regard to juris-dictional claims in published maps and institutional affiliations.
172 S. Ali et al.
Korean Meteorological Society