Embed Size (px)
Citation preview
HYDROLOGICAL PROCESSESHydrol. Process. (2007)Published online in Wiley InterScience(www.interscience.wiley.com) DOI: 10.1002/hyp.6869
Spatio-temporal distribution of near-surface and root zonesoil moisture at the catchment scale
C. Martinez,1* G. R. Hancock,1 J. D. Kalma2 and T. Wells1
1 The School of Environmental and Life Sciences, The University of Newcastle, Callaghan, New South Wales, 2308, Australia2 The School of Engineering, The University of Newcastle, Callaghan, New South Wales, 2308, Australia
Abstract:
Soil moisture is highly variable both spatially and temporally. It is widely recognized that improving the knowledge andunderstanding of soil moisture and the processes underpinning its spatial and temporal distribution is critical. This paperaddresses the relationship between near-surface and root zone soil moisture, the way in which they vary spatially and temporally,and the effect of sampling design for determining catchment scale soil moisture dynamics. In this study, catchment scale near-surface (0–50 mm) and root zone (0–300 mm) soil moisture were monitored over a four-week period. Measurements ofnear-surface soil moisture were recorded at various resolutions, and near-surface and root zone soil moisture data were alsomonitored continuously within a network of recording sensors. Catchment average near-surface soil moisture derived fromdetailed spatial measurements and continuous observations at fixed points were found to be significantly correlated (r2 D 0Ð96;P D 0Ð0063; n D 4). Root zone soil moisture was also found to be highly correlated with catchment average near-surface,continuously monitored (r2 D 0Ð81; P < 0Ð0001; n D 26) and with detailed spatial measurements of near-surface soil moisture(r2 D 0Ð84). The weaker relationship observed between near-surface and root zone soil moisture is considered to be causedby the different responses to rainfall and the different factors controlling soil moisture for the soil depths of 0–50 mmand 0–300 mm. Aspect is considered to be the main factor influencing the spatial and temporal distribution of near-surfacesoil moisture, while topography and soil type are considered important for root zone soil moisture. The ability of a limitednumber of monitoring stations to provide accurate estimates of catchment scale average soil moisture for both near-surfaceand root zone is thus demonstrated, as opposed to high resolution spatial measurements. Similarly, the use of near-surfacesoil moisture measurements to obtain a reliable estimate of deeper soil moisture levels at the small catchment scale wasdemonstrated. Copyright 2007 John Wiley & Sons, Ltd.
KEY WORDS soil moisture; near-surface; root zone; catchment scale; NAFE’05; SASMAS
Received 26 November 2006; Accepted 5 July 2007
INTRODUCTION
Soil moisture is a key variable within earth systemdynamics (Famiglietti et al., 1998). It exerts considerableinfluence on many hydrological (e.g. runoff and floodforecasting) and pedogenic processes (Western et al.,2004), and on the water and energy balances of land sur-faces (Qui et al., 2001; Di Domenico et al., 2006). Thespatial distribution of soil moisture has received increas-ing attention over recent decades (Famiglietti et al., 1998;Starks et al., 2006) because it is widely recognized thatimproving our knowledge and understanding of soilmoisture and the processes underpinning its spatial andtemporal distribution is critical (Wilson et al., 2003).
Soil moisture content is highly variable, spatially andtemporally (Famiglietti et al., 1998; Qui et al., 2001;Cosh et al., 2004; Western et al., 2004; Hebrard et al.,2006). Near-surface soil moisture (i.e. in the top 50 mmof the soil profile) is particularly complex and highlyvariable (Svetlitchnyi et al., 2003). Many authors haveinvestigated the main factors controlling the spatial and
* Correspondence to: C. Martinez, School of Environmental and LifeSciences, The University of Newcastle, Callaghan, NSW 2308, Australia.E-mail: [email protected]
temporal dynamics of soil moisture, including topography(slope gradient, curvature, relative elevation), soil prop-erties (clay content, albedo, organic matter), aspect, landuse, vegetation, solar radiation, upslope or specific con-tributing area, and mean soil moisture (Famiglietti et al.,1998; Western et al., 1999; Qui et al., 2001; Svetlitch-nyi et al., 2003; Canton et al., 2004; Wilson et al., 2005;Hebrard et al., 2006). Conflicting opinions over which ofthese factors are most important are widespread. Many ofthese factors are interrelated, making it difficult to isolateand quantify the relative importance of individual fac-tors (Qui et al., 2001; Canton et al., 2004). Furthermore,Famiglietti et al. (1998) suggest the reason for the contra-dictory findings within the literature can be attributed tounder-sampling in space or time, or both. Further researchis therefore required at a range of scales (hillslope andcatchment) and soil depths, for different environmentsand time scales.
Present methods for measuring and estimating soilmoisture can be classified into three main groups:(1) ground-based measurement; (2) estimation based onremote sensing; and (3) estimation via simulation models(Grayson and Western, 1998). Ground-based measure-ments can be direct (e.g. gravimetric soil sampling) or
Copyright 2007 John Wiley & Sons, Ltd.
C. MARTINEZ ET AL.
indirect (e.g. Theta probes) and can be made at var-ious spatial and temporal scales. In recent years handheld instruments, such as the Theta probe, have allowedthe quick and easy measurement of soil moisture in thenear-surface (0–50 mm). Use of these probes provides asimple and reliable method of obtaining an instantaneousmeasure of soil moisture at the hillslope and catchmentscale (Wilson et al., 2003). Nevertheless, while it hasbeen shown that this data can provide information on sur-face soil moisture, little work has been done to addressthe variability of soil moisture at a range of differentscales to ensure that point based measurements of soilmoisture can provide reliable data at the field, hillslopeand catchment scale.
In this study we compare two different approaches toexamine the spatial and temporal distribution of near-surface (0–50 mm) and root zone (0–300 mm) soil mois-ture. Ground-based data collected during the four-weekNational Airborne Field Experiment (NAFE) (Walkeret al., 2005) in November 2005 (high spatial, low tem-poral resolution) is compared with continuously recordeddata obtained over the same period as part of the Scalingand Assimilation of Soil Moisture and Streamflow (SAS-MAS) project (low spatial, high temporal resolution)(Rudiger et al., 2007, in press). Together, these projectsadd two unique datasets to the limited number availablewhich can be employed to investigate the spatio-temporalpatterns of soil moisture (De Lannoy et al., 2006). Thisstudy is based within the 150 ha Stanley catchment inthe Upper Hunter region of New South Wales, Australia,an area which is of particular interest as it is the focus ofa study to examine the spatial and temporal dynamics ofsoil carbon at the hillslope and catchment scale (Martinezet al., 2006). Soil moisture exerts control over the spa-tial distribution of vegetation, regulates soil temperatureand the decomposition of organic matter by microbialactivity, and is therefore an important variable influenc-ing the spatial and temporal distribution of soil carbonwithin the landscape. This study is focused on obtain-ing estimates of catchment-scale average soil moisture(both near-surface and root zone) which, according to
Grayson and Western (1998), are required for a varietyof hydrologic applications. This research aims to addressthe following questions:
ž How does soil moisture (near-surface and root zone)vary spatially and temporally at the small catchmentscale?
ž What are the main factors controlling the spatial andtemporal distribution of near-surface and root zone soilmoisture at the small catchment scale?
ž What is the relationship between near-surface and rootzone soil moisture?
ž Can near-surface soil moisture measurements providedata on soil moisture at greater depths?
ž What is the effect of sampling design (i.e. low spa-tial, high temporal resolution [SASMAS] versus highspatial, low temporal resolution [NAFE]) for the deter-mination of catchment scale soil moisture dynamics?
STUDY SITE
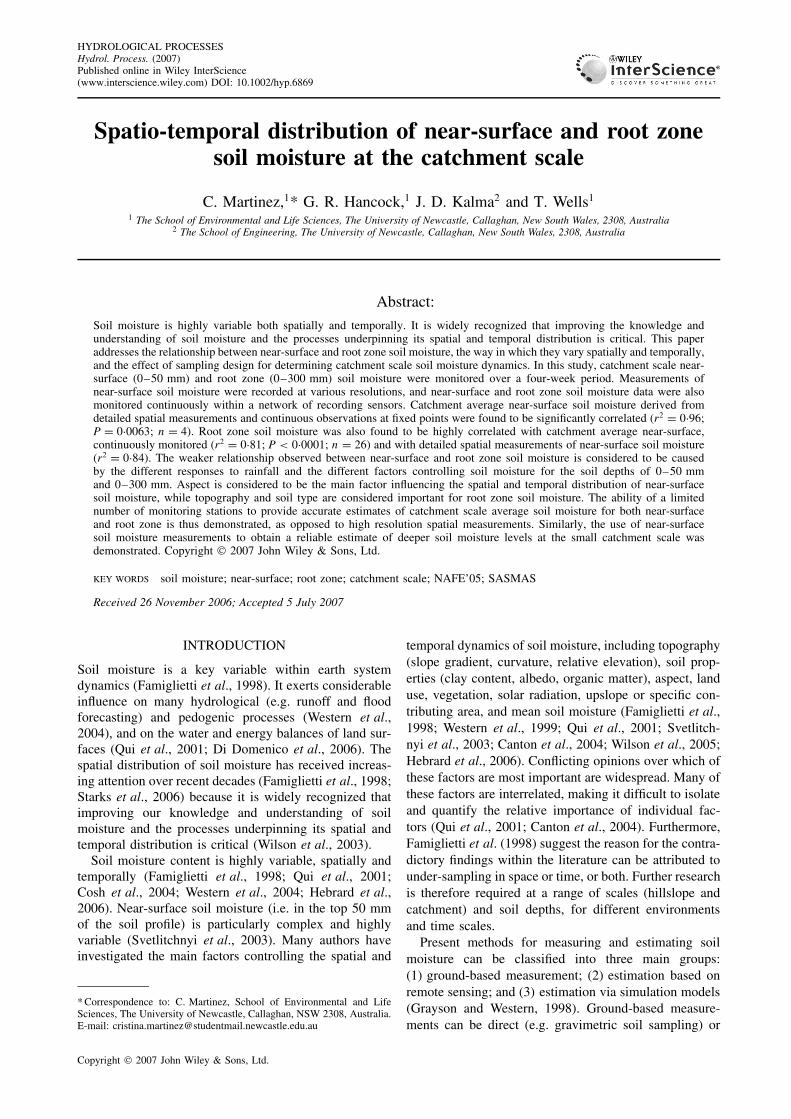
The 150 ha Stanley catchment (150°0700000E and32°0503200S) is a tributary of the 562 km2 Krui Rivercatchment, located in the Upper Hunter Valley ofNew South Wales, Australia (Figure 1). The catchmenthas seven permanent soil moisture monitoring stations,labelled S1–S7 (Figure 1), one of which, S2, doublesas a weather station. S2–S4 and S5–S7 are positionedon south-west and north-west facing hillslopes, respec-tively (Figure 2), while S1 is located on the relativelyflat area alongside the main drainage line leading tothe catchment outlet. Soil moisture and soil temperatureare continuously recorded at each of these sites (20-minintervals) at a number of depths (0–50 mm, 0–300 mm,300–600 mm, and 600–900 mm).
The catchment is underlain with Tertiary Basalt ofthe Liverpool Range beds (McInnes-Clarke, 2003) andforms part of the Merriwa Plateau (Story et al., 1963).Three soil landscapes have been identified, includingthe Ant Hill (ah and landscape variant aha), Bow
Figure 1. Location map showing Goulburn, Krui and Merriwa River catchments and the Stanley study catchment (including location of SASMASsoil moisture monitoring sites)
Copyright 2007 John Wiley & Sons, Ltd. Hydrol. Process. (2007)DOI: 10.1002/hyp
CATCHMENT-SCALE SOIL MOISTURE PATTERNS
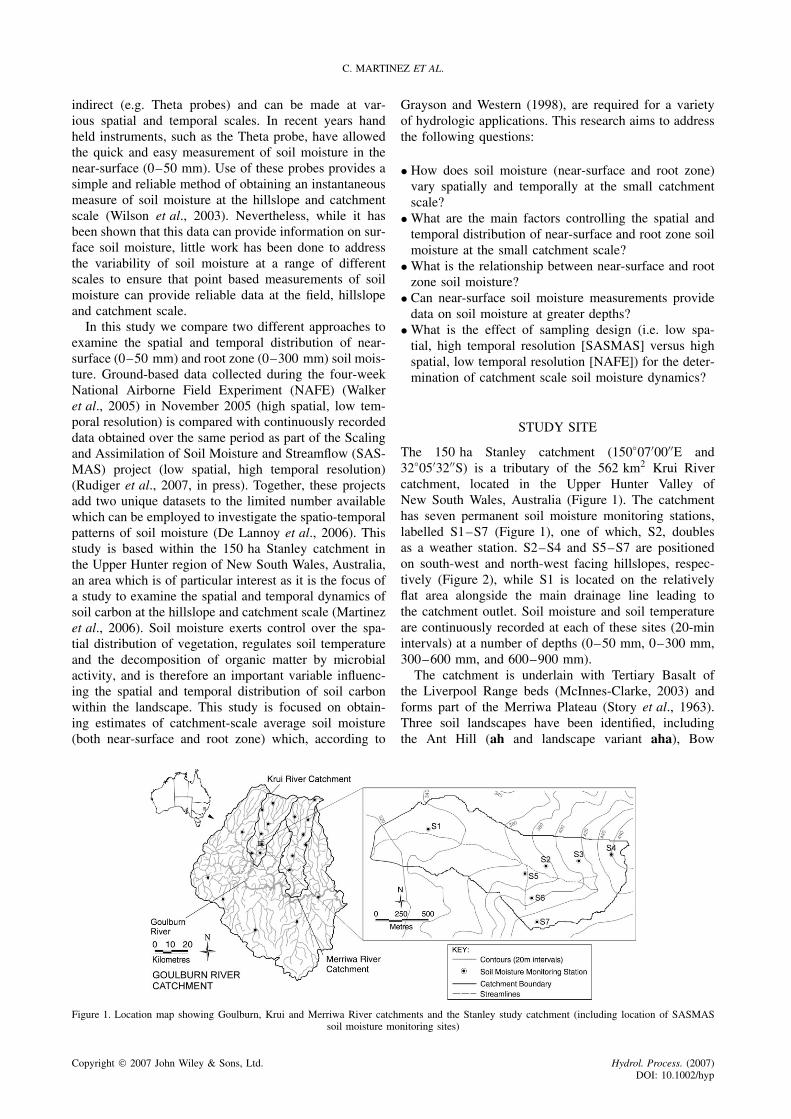
Figure 2. Aspect map for the Stanley micro-catchment
Figure 3. Soil landscape map for the Stanley micro-catchment
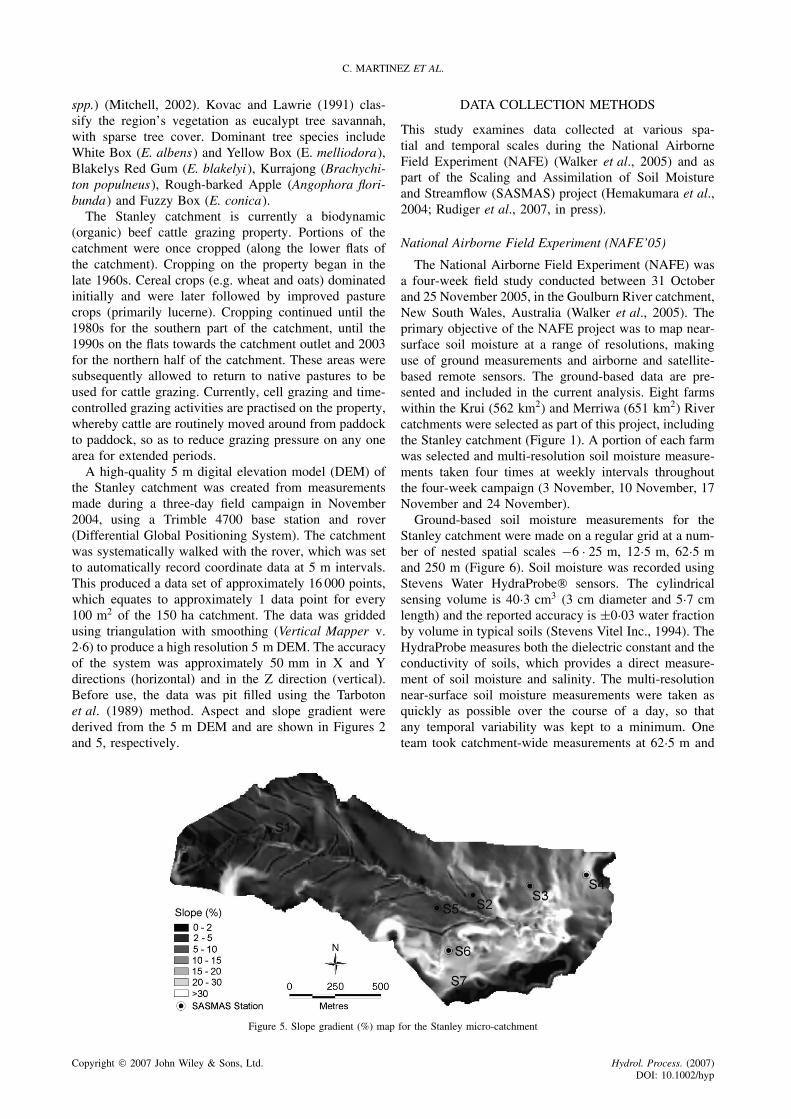
(bw) and Yarramoor (ym) (Figure 3) (McInnes-Clarke,2003). The catchment consists of undulating hillslopeswith gradients between 15–30% (ah) and 2–10% (bw)(McInnes-Clarke, 2003). The dominant soils of the AntHill soil landscape include Red and Black Dermosols(Chocolate soils and Euchrozems) and Red Vertisols (RedClays). Soils in the Bow soil landscape are predominantlyBlack Vertisols and Black Dermosols (Black Earths andChocolate soils) (Kovac and Lawrie, 1991).
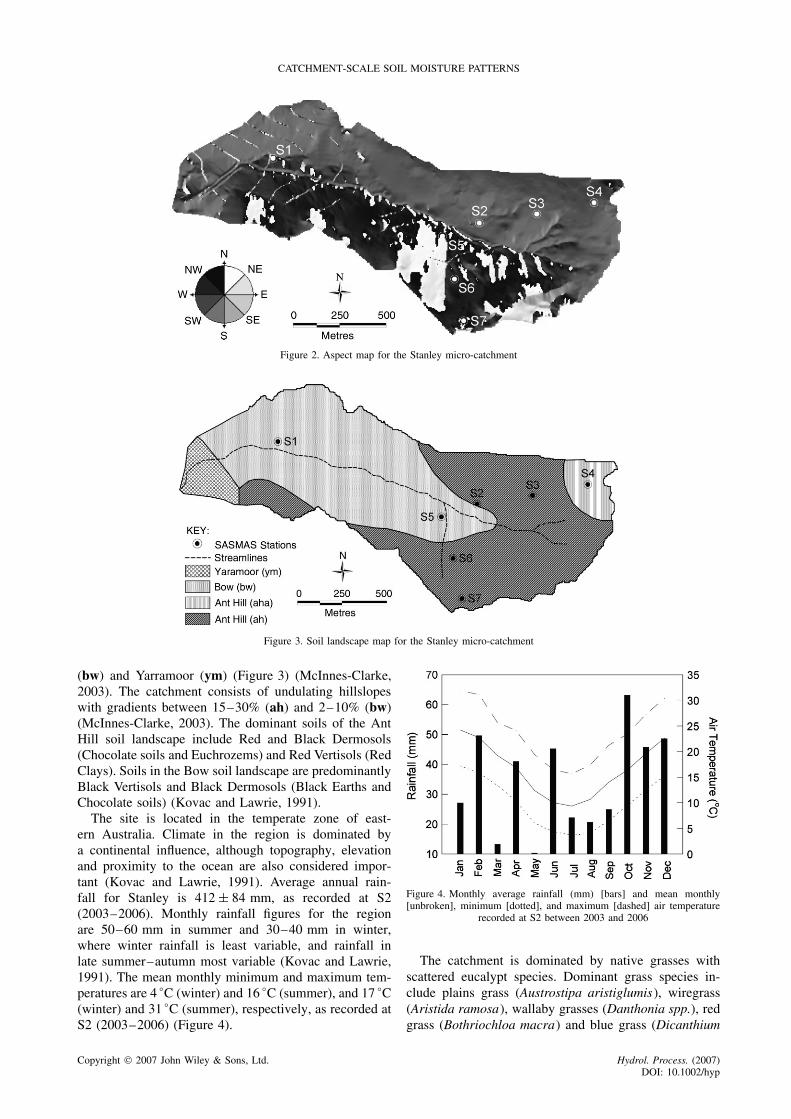
The site is located in the temperate zone of east-ern Australia. Climate in the region is dominated bya continental influence, although topography, elevationand proximity to the ocean are also considered impor-tant (Kovac and Lawrie, 1991). Average annual rain-fall for Stanley is 412 š 84 mm, as recorded at S2(2003–2006). Monthly rainfall figures for the regionare 50–60 mm in summer and 30–40 mm in winter,where winter rainfall is least variable, and rainfall inlate summer–autumn most variable (Kovac and Lawrie,1991). The mean monthly minimum and maximum tem-peratures are 4 °C (winter) and 16 °C (summer), and 17 °C(winter) and 31 °C (summer), respectively, as recorded atS2 (2003–2006) (Figure 4).
Figure 4. Monthly average rainfall (mm) [bars] and mean monthly[unbroken], minimum [dotted], and maximum [dashed] air temperature
recorded at S2 between 2003 and 2006
The catchment is dominated by native grasses withscattered eucalypt species. Dominant grass species in-clude plains grass (Austrostipa aristiglumis), wiregrass(Aristida ramosa), wallaby grasses (Danthonia spp.), redgrass (Bothriochloa macra) and blue grass (Dicanthium
Copyright 2007 John Wiley & Sons, Ltd. Hydrol. Process. (2007)DOI: 10.1002/hyp
C. MARTINEZ ET AL.
spp.) (Mitchell, 2002). Kovac and Lawrie (1991) clas-sify the region’s vegetation as eucalypt tree savannah,with sparse tree cover. Dominant tree species includeWhite Box (E. albens) and Yellow Box (E. melliodora),Blakelys Red Gum (E. blakelyi ), Kurrajong (Brachychi-ton populneus), Rough-barked Apple (Angophora flori-bunda) and Fuzzy Box (E. conica).
The Stanley catchment is currently a biodynamic(organic) beef cattle grazing property. Portions of thecatchment were once cropped (along the lower flats ofthe catchment). Cropping on the property began in thelate 1960s. Cereal crops (e.g. wheat and oats) dominatedinitially and were later followed by improved pasturecrops (primarily lucerne). Cropping continued until the1980s for the southern part of the catchment, until the1990s on the flats towards the catchment outlet and 2003for the northern half of the catchment. These areas weresubsequently allowed to return to native pastures to beused for cattle grazing. Currently, cell grazing and time-controlled grazing activities are practised on the property,whereby cattle are routinely moved around from paddockto paddock, so as to reduce grazing pressure on any onearea for extended periods.
A high-quality 5 m digital elevation model (DEM) ofthe Stanley catchment was created from measurementsmade during a three-day field campaign in November2004, using a Trimble 4700 base station and rover(Differential Global Positioning System). The catchmentwas systematically walked with the rover, which was setto automatically record coordinate data at 5 m intervals.This produced a data set of approximately 16 000 points,which equates to approximately 1 data point for every100 m2 of the 150 ha catchment. The data was griddedusing triangulation with smoothing (Vertical Mapper v.2Ð6) to produce a high resolution 5 m DEM. The accuracyof the system was approximately 50 mm in X and Ydirections (horizontal) and in the Z direction (vertical).Before use, the data was pit filled using the Tarbotonet al. (1989) method. Aspect and slope gradient werederived from the 5 m DEM and are shown in Figures 2and 5, respectively.
DATA COLLECTION METHODS
This study examines data collected at various spa-tial and temporal scales during the National AirborneField Experiment (NAFE) (Walker et al., 2005) and aspart of the Scaling and Assimilation of Soil Moistureand Streamflow (SASMAS) project (Hemakumara et al.,2004; Rudiger et al., 2007, in press).
National Airborne Field Experiment (NAFE’05)
The National Airborne Field Experiment (NAFE) wasa four-week field study conducted between 31 Octoberand 25 November 2005, in the Goulburn River catchment,New South Wales, Australia (Walker et al., 2005). Theprimary objective of the NAFE project was to map near-surface soil moisture at a range of resolutions, makinguse of ground measurements and airborne and satellite-based remote sensors. The ground-based data are pre-sented and included in the current analysis. Eight farmswithin the Krui (562 km2) and Merriwa (651 km2) Rivercatchments were selected as part of this project, includingthe Stanley catchment (Figure 1). A portion of each farmwas selected and multi-resolution soil moisture measure-ments taken four times at weekly intervals throughoutthe four-week campaign (3 November, 10 November, 17November and 24 November).
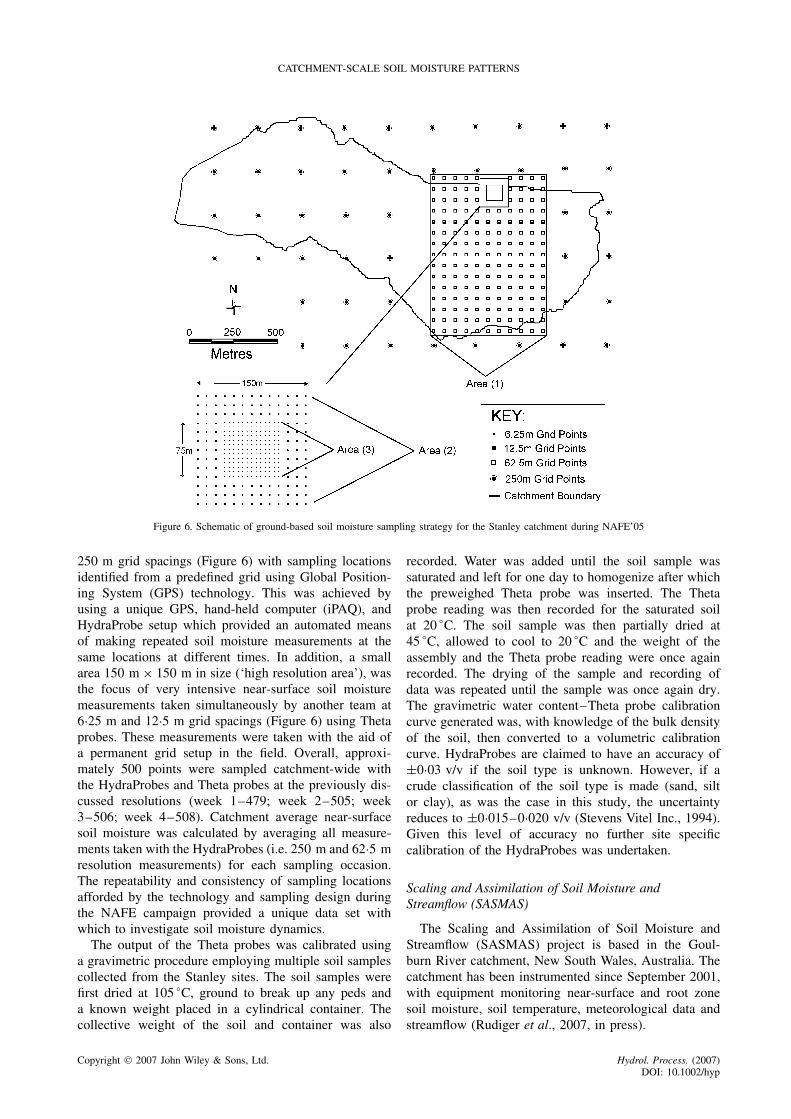
Ground-based soil moisture measurements for theStanley catchment were made on a regular grid at a num-ber of nested spatial scales �6 Ð 25 m, 12Ð5 m, 62Ð5 mand 250 m (Figure 6). Soil moisture was recorded usingStevens Water HydraProbe sensors. The cylindricalsensing volume is 40Ð3 cm3 (3 cm diameter and 5Ð7 cmlength) and the reported accuracy is š0Ð03 water fractionby volume in typical soils (Stevens Vitel Inc., 1994). TheHydraProbe measures both the dielectric constant and theconductivity of soils, which provides a direct measure-ment of soil moisture and salinity. The multi-resolutionnear-surface soil moisture measurements were taken asquickly as possible over the course of a day, so thatany temporal variability was kept to a minimum. Oneteam took catchment-wide measurements at 62Ð5 m and
Figure 5. Slope gradient (%) map for the Stanley micro-catchment
Copyright 2007 John Wiley & Sons, Ltd. Hydrol. Process. (2007)DOI: 10.1002/hyp
CATCHMENT-SCALE SOIL MOISTURE PATTERNS
Figure 6. Schematic of ground-based soil moisture sampling strategy for the Stanley catchment during NAFE’05
250 m grid spacings (Figure 6) with sampling locationsidentified from a predefined grid using Global Position-ing System (GPS) technology. This was achieved byusing a unique GPS, hand-held computer (iPAQ), andHydraProbe setup which provided an automated meansof making repeated soil moisture measurements at thesame locations at different times. In addition, a smallarea 150 m ð 150 m in size (‘high resolution area’), wasthe focus of very intensive near-surface soil moisturemeasurements taken simultaneously by another team at6Ð25 m and 12Ð5 m grid spacings (Figure 6) using Thetaprobes. These measurements were taken with the aid ofa permanent grid setup in the field. Overall, approxi-mately 500 points were sampled catchment-wide withthe HydraProbes and Theta probes at the previously dis-cussed resolutions (week 1–479; week 2–505; week3–506; week 4–508). Catchment average near-surfacesoil moisture was calculated by averaging all measure-ments taken with the HydraProbes (i.e. 250 m and 62Ð5 mresolution measurements) for each sampling occasion.The repeatability and consistency of sampling locationsafforded by the technology and sampling design duringthe NAFE campaign provided a unique data set withwhich to investigate soil moisture dynamics.
The output of the Theta probes was calibrated usinga gravimetric procedure employing multiple soil samplescollected from the Stanley sites. The soil samples werefirst dried at 105 °C, ground to break up any peds anda known weight placed in a cylindrical container. Thecollective weight of the soil and container was also
recorded. Water was added until the soil sample wassaturated and left for one day to homogenize after whichthe preweighed Theta probe was inserted. The Thetaprobe reading was then recorded for the saturated soilat 20 °C. The soil sample was then partially dried at45 °C, allowed to cool to 20 °C and the weight of theassembly and the Theta probe reading were once againrecorded. The drying of the sample and recording ofdata was repeated until the sample was once again dry.The gravimetric water content–Theta probe calibrationcurve generated was, with knowledge of the bulk densityof the soil, then converted to a volumetric calibrationcurve. HydraProbes are claimed to have an accuracy ofš0Ð03 v/v if the soil type is unknown. However, if acrude classification of the soil type is made (sand, siltor clay), as was the case in this study, the uncertaintyreduces to š0Ð015–0Ð020 v/v (Stevens Vitel Inc., 1994).Given this level of accuracy no further site specificcalibration of the HydraProbes was undertaken.
Scaling and Assimilation of Soil Moisture andStreamflow (SASMAS)
The Scaling and Assimilation of Soil Moisture andStreamflow (SASMAS) project is based in the Goul-burn River catchment, New South Wales, Australia. Thecatchment has been instrumented since September 2001,with equipment monitoring near-surface and root zonesoil moisture, soil temperature, meteorological data andstreamflow (Rudiger et al., 2007, in press).
Copyright 2007 John Wiley & Sons, Ltd. Hydrol. Process. (2007)DOI: 10.1002/hyp
C. MARTINEZ ET AL.
A series of 26 soil moisture and temperature moni-toring sites are located throughout the Goulburn catch-ment, with seven of these located in the Stanley micro-catchment (S1–S7) (Figure 1). At each of these sites,soil moisture and temperature are continuously recordedat 20-min intervals. Up to three vertically insertedwater content reflectometers (Campbell Scientific CS616;Campbell Scientific, 2002) are installed at these sites ata number of soil depths (0–300 mm, 300–600 mm and600–900 mm). The number of soil moisture sensors, andtherefore the depth to which the soil moisture profile ismonitored at these sites, is dependent upon soil depthto bedrock, which is less than 900 mm in some cases.HydraProbes are also installed vertically at each of thesites (excluding S2) to continuously monitor surface soilmoisture (top 50 mm). Surface soil temperatures weremonitored with a thermistor at a depth of 25 mm. Oneof these sites (S2) is also a weather station. For the pur-poses of consistency, only the 0–50 mm and 0–300 mmcontinuously monitored soil moisture data are presentedin this study. Further details of the SASMAS project andassociated infrastructure are available from Rudiger et al.(2007, in press).
The sensitivity of the CS616 sensor output to soil typenecessitated the separate calibration of the probes to soiltaken from each micro-catchment site. A summary ofthe calibration procedure follows (for a more completedescription, see Rudiger (2006)). Oven dried soil samplesfrom each site were carefully loaded into cylindricalcontainers 150 mm in diameter and 400 mm deep anda CS616 probe located vertically along the containeraxis. A thermocouple was also positioned close to thecontainer axis at 150 mm depth. The containers weresuspended from load cells to enable gravimetric changesin soil moisture to be recorded. Commencing with thedry material the response of the probe was recordedfor a range of temperatures once the temperature of theunit had stabilized. A small volume of water was thenadded to the top of the container and allowed to infiltratedown through the soil column. Once the CS616 andthermocouple output stabilized a new set of responseswas recorded for a range of temperatures. This processwas repeated until the soil column was saturated.
The CS616 calibration data was fitted to a modifiedversion of the standardized calibration equations pro-posed for CS615 probes by Western and Seyfried (2005).First, the CS616 response was corrected for temperaturein the following manner:
P25 D Pobs � o�T � 25�
1 C s�T � 25��1�
where Pobs is the raw CS616 response (ms), for the givensoil moisture and temperature conditions (T, °C); o and sare calibration constants that are dependent on soil typeand P25 is the CS616 output corrected to 25 °C.
The volumetric water content, � (v/v), of the soil wasthen calculated using the following:
� D ˛N N � 0Ð5 �2�
� D 0Ð5˛ C(
0Ð4 � 0Ð5˛
0Ð5ˇ
)�N � 0Ð5�ˇ N > 0Ð5 �3�
where N is the normalized sensor output calculated usingEquation (4):
N D P25 � P0Ð0P0Ð4 � P0Ð0
�4�
and ˛, ˇ are calibration constants (independent of soiltype). P0Ð0 and P0Ð4 are the average sensor outputsfor dried soil (soil independent) and the optimizedsoil specific sensor output for soil of 0Ð4 v/v contentrespectively.
RESULTS
Near-surface soil moisture—detailed spatialmeasurements (NAFE)
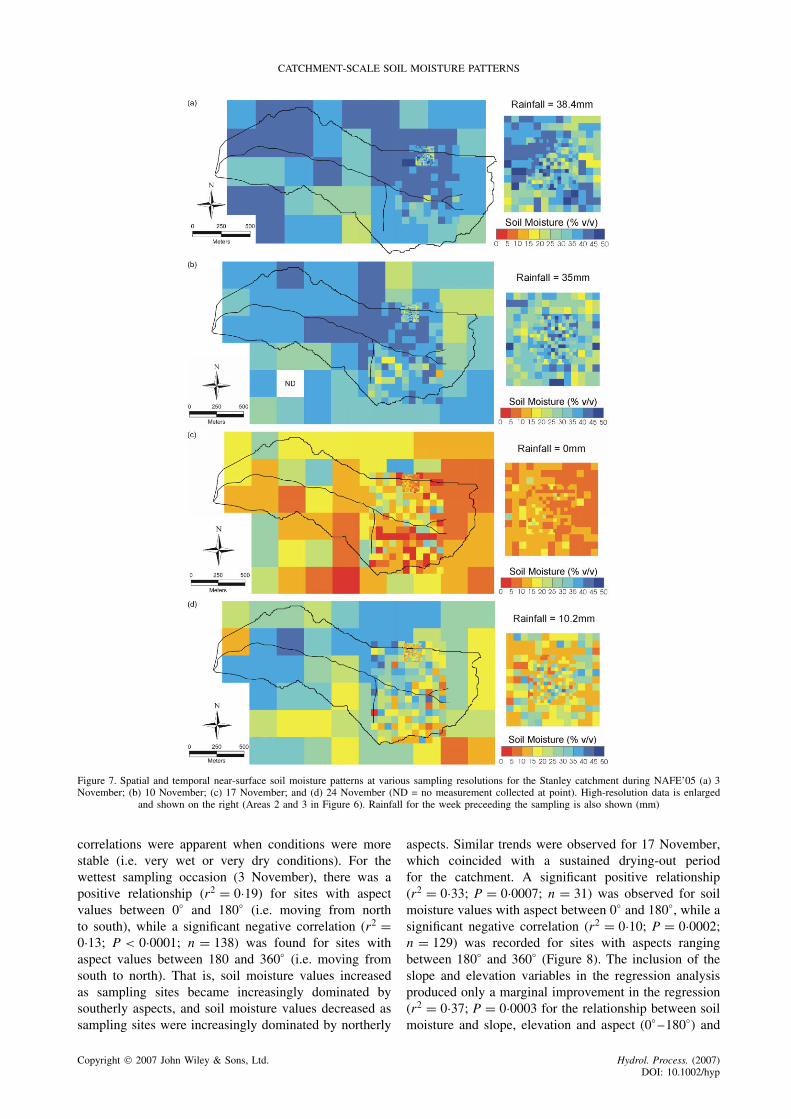
The spatial distribution of near-surface soil moistureat four different resolutions (6Ð25 m, 12Ð5 m, 62Ð5 mand 250 m) for the Stanley catchment recorded dur-ing the four-week NAFE campaign is illustrated inFigure 7. Daily rainfall recorded during this period atS2 is also shown, with total rainfall for the weekpreceding each of the sampling occasions indicated(Figure 7). Rainfall appears to be well correlated withthe observed temporal soil moisture trends, with wetconditions at the start of the campaign, followed by adrying period after 10 November, before a final wettingtowards the end of the campaign. Figure 7 and Table Iindicate that 3 November (Week 1) was the wettestsampling occasion, closely followed by 10 November(Week 2), while 17 November (Week 3) was the dri-est.
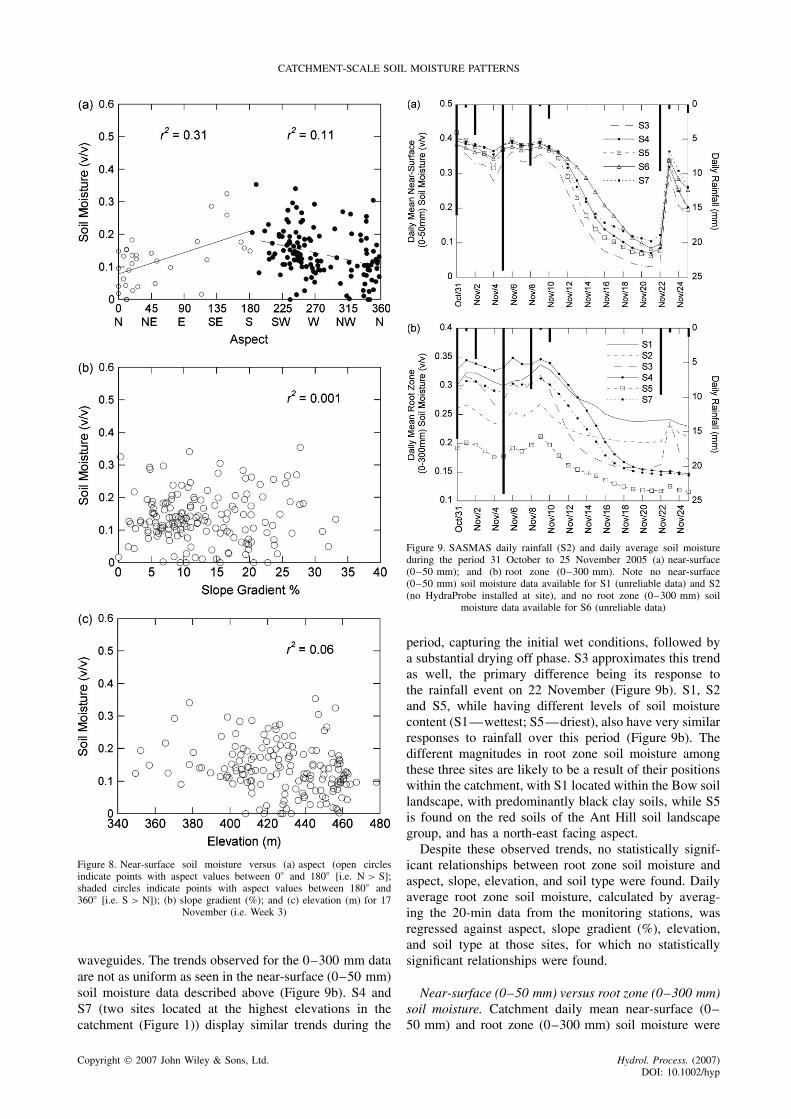
Factors such as aspect, topography and soil type arelikely to influence the distribution of near-surface soilmoisture. A visual assessment of the catchment indi-cates that areas in the upper reaches of the catchmentand along the drainage divide (i.e. greatest slope values)with a north-facing aspect (Figures 2 and 5) appear tobe consistently drier relative to the rest of the catchment(Figure 7). Conversely, the region towards the catchmentoutlet, along the flats, is consistently among the wettestareas of the catchment. Higher levels of clay-sized parti-cles associated with the Bow (bw) soil landscape, foundin the lower reaches of the catchment, may also helpto explain the higher soil moisture values in those areas(Figure 3).
Nevertheless, no statistically significant relationshipswere observed between near-surface soil moisture andthe factors investigated (i.e. slope gradient, elevationand soil type), excluding aspect (Figure 8). Weak, yetsignificant, relationships were observed for aspect ontwo sampling occasions. Sampling sites were groupedinto two categories: 0–180° (N > S) or 180–360° (S >N). This was designed to assess whether soil moisturevalues decreased as aspect moved from a northern tosouthern orientation and vice versa. Results for thefour sampling occasions were mixed. The strongest
Copyright 2007 John Wiley & Sons, Ltd. Hydrol. Process. (2007)DOI: 10.1002/hyp
CATCHMENT-SCALE SOIL MOISTURE PATTERNS
Figure 7. Spatial and temporal near-surface soil moisture patterns at various sampling resolutions for the Stanley catchment during NAFE’05 (a) 3November; (b) 10 November; (c) 17 November; and (d) 24 November (ND = no measurement collected at point). High-resolution data is enlarged
and shown on the right (Areas 2 and 3 in Figure 6). Rainfall for the week preceeding the sampling is also shown (mm)
correlations were apparent when conditions were morestable (i.e. very wet or very dry conditions). For thewettest sampling occasion (3 November), there was apositive relationship (r2 D 0Ð19) for sites with aspectvalues between 0° and 180° (i.e. moving from northto south), while a significant negative correlation (r2 D0Ð13; P < 0Ð0001; n D 138) was found for sites withaspect values between 180 and 360° (i.e. moving fromsouth to north). That is, soil moisture values increasedas sampling sites became increasingly dominated bysoutherly aspects, and soil moisture values decreased assampling sites were increasingly dominated by northerly
aspects. Similar trends were observed for 17 November,which coincided with a sustained drying-out periodfor the catchment. A significant positive relationship(r2 D 0Ð33; P D 0Ð0007; n D 31) was observed for soilmoisture values with aspect between 0° and 180°, while asignificant negative correlation (r2 D 0Ð10; P D 0Ð0002;n D 129) was recorded for sites with aspects rangingbetween 180° and 360° (Figure 8). The inclusion of theslope and elevation variables in the regression analysisproduced only a marginal improvement in the regression(r2 D 0Ð37; P D 0Ð0003 for the relationship between soilmoisture and slope, elevation and aspect (0° –180°) and
Copyright 2007 John Wiley & Sons, Ltd. Hydrol. Process. (2007)DOI: 10.1002/hyp
C. MARTINEZ ET AL.
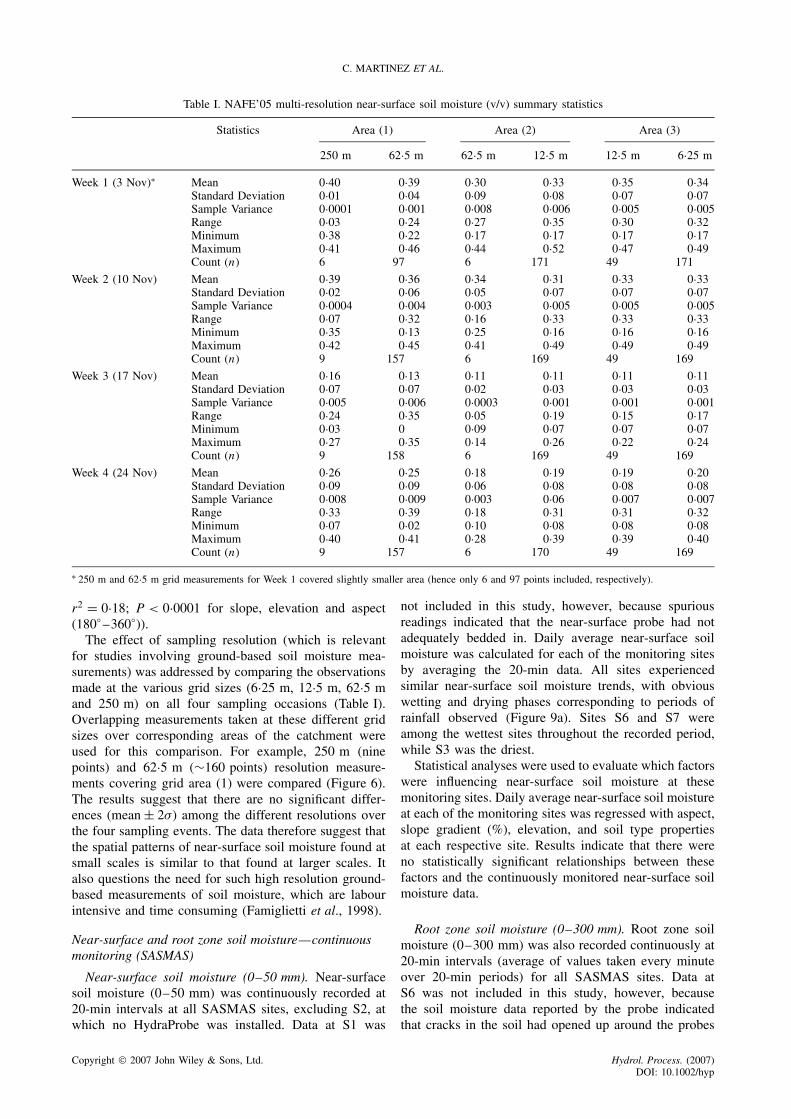
Table I. NAFE’05 multi-resolution near-surface soil moisture (v/v) summary statistics
Statistics Area (1) Area (2) Area (3)
250 m 62Ð5 m 62Ð5 m 12Ð5 m 12Ð5 m 6Ð25 m
Week 1 (3 Nov)Ł Mean 0Ð40 0Ð39 0Ð30 0Ð33 0Ð35 0Ð34Standard Deviation 0Ð01 0Ð04 0Ð09 0Ð08 0Ð07 0Ð07Sample Variance 0Ð0001 0Ð001 0Ð008 0Ð006 0Ð005 0Ð005Range 0Ð03 0Ð24 0Ð27 0Ð35 0Ð30 0Ð32Minimum 0Ð38 0Ð22 0Ð17 0Ð17 0Ð17 0Ð17Maximum 0Ð41 0Ð46 0Ð44 0Ð52 0Ð47 0Ð49Count (n) 6 97 6 171 49 171
Week 2 (10 Nov) Mean 0Ð39 0Ð36 0Ð34 0Ð31 0Ð33 0Ð33Standard Deviation 0Ð02 0Ð06 0Ð05 0Ð07 0Ð07 0Ð07Sample Variance 0Ð0004 0Ð004 0Ð003 0Ð005 0Ð005 0Ð005Range 0Ð07 0Ð32 0Ð16 0Ð33 0Ð33 0Ð33Minimum 0Ð35 0Ð13 0Ð25 0Ð16 0Ð16 0Ð16Maximum 0Ð42 0Ð45 0Ð41 0Ð49 0Ð49 0Ð49Count (n) 9 157 6 169 49 169
Week 3 (17 Nov) Mean 0Ð16 0Ð13 0Ð11 0Ð11 0Ð11 0Ð11Standard Deviation 0Ð07 0Ð07 0Ð02 0Ð03 0Ð03 0Ð03Sample Variance 0Ð005 0Ð006 0Ð0003 0Ð001 0Ð001 0Ð001Range 0Ð24 0Ð35 0Ð05 0Ð19 0Ð15 0Ð17Minimum 0Ð03 0 0Ð09 0Ð07 0Ð07 0Ð07Maximum 0Ð27 0Ð35 0Ð14 0Ð26 0Ð22 0Ð24Count (n) 9 158 6 169 49 169
Week 4 (24 Nov) Mean 0Ð26 0Ð25 0Ð18 0Ð19 0Ð19 0Ð20Standard Deviation 0Ð09 0Ð09 0Ð06 0Ð08 0Ð08 0Ð08Sample Variance 0Ð008 0Ð009 0Ð003 0Ð06 0Ð007 0Ð007Range 0Ð33 0Ð39 0Ð18 0Ð31 0Ð31 0Ð32Minimum 0Ð07 0Ð02 0Ð10 0Ð08 0Ð08 0Ð08Maximum 0Ð40 0Ð41 0Ð28 0Ð39 0Ð39 0Ð40Count (n) 9 157 6 170 49 169
Ł 250 m and 62Ð5 m grid measurements for Week 1 covered slightly smaller area (hence only 6 and 97 points included, respectively).
r2 D 0Ð18; P < 0Ð0001 for slope, elevation and aspect(180° –360°)).
The effect of sampling resolution (which is relevantfor studies involving ground-based soil moisture mea-surements) was addressed by comparing the observationsmade at the various grid sizes (6Ð25 m, 12Ð5 m, 62Ð5 mand 250 m) on all four sampling occasions (Table I).Overlapping measurements taken at these different gridsizes over corresponding areas of the catchment wereused for this comparison. For example, 250 m (ninepoints) and 62Ð5 m (¾160 points) resolution measure-ments covering grid area (1) were compared (Figure 6).The results suggest that there are no significant differ-ences (mean š 2�) among the different resolutions overthe four sampling events. The data therefore suggest thatthe spatial patterns of near-surface soil moisture found atsmall scales is similar to that found at larger scales. Italso questions the need for such high resolution ground-based measurements of soil moisture, which are labourintensive and time consuming (Famiglietti et al., 1998).
Near-surface and root zone soil moisture—continuousmonitoring (SASMAS)
Near-surface soil moisture (0–50 mm). Near-surfacesoil moisture (0–50 mm) was continuously recorded at20-min intervals at all SASMAS sites, excluding S2, atwhich no HydraProbe was installed. Data at S1 was
not included in this study, however, because spuriousreadings indicated that the near-surface probe had notadequately bedded in. Daily average near-surface soilmoisture was calculated for each of the monitoring sitesby averaging the 20-min data. All sites experiencedsimilar near-surface soil moisture trends, with obviouswetting and drying phases corresponding to periods ofrainfall observed (Figure 9a). Sites S6 and S7 wereamong the wettest sites throughout the recorded period,while S3 was the driest.
Statistical analyses were used to evaluate which factorswere influencing near-surface soil moisture at thesemonitoring sites. Daily average near-surface soil moistureat each of the monitoring sites was regressed with aspect,slope gradient (%), elevation, and soil type propertiesat each respective site. Results indicate that there wereno statistically significant relationships between thesefactors and the continuously monitored near-surface soilmoisture data.
Root zone soil moisture (0–300 mm). Root zone soilmoisture (0–300 mm) was also recorded continuously at20-min intervals (average of values taken every minuteover 20-min periods) for all SASMAS sites. Data atS6 was not included in this study, however, becausethe soil moisture data reported by the probe indicatedthat cracks in the soil had opened up around the probes
Copyright 2007 John Wiley & Sons, Ltd. Hydrol. Process. (2007)DOI: 10.1002/hyp
CATCHMENT-SCALE SOIL MOISTURE PATTERNS
Figure 8. Near-surface soil moisture versus (a) aspect (open circlesindicate points with aspect values between 0° and 180° [i.e. N > S];shaded circles indicate points with aspect values between 180° and360° [i.e. S > N]); (b) slope gradient (%); and (c) elevation (m) for 17
November (i.e. Week 3)
waveguides. The trends observed for the 0–300 mm dataare not as uniform as seen in the near-surface (0–50 mm)soil moisture data described above (Figure 9b). S4 andS7 (two sites located at the highest elevations in thecatchment (Figure 1)) display similar trends during the
Figure 9. SASMAS daily rainfall (S2) and daily average soil moistureduring the period 31 October to 25 November 2005 (a) near-surface(0–50 mm); and (b) root zone (0–300 mm). Note no near-surface(0–50 mm) soil moisture data available for S1 (unreliable data) and S2(no HydraProbe installed at site), and no root zone (0–300 mm) soil
moisture data available for S6 (unreliable data)
period, capturing the initial wet conditions, followed bya substantial drying off phase. S3 approximates this trendas well, the primary difference being its response tothe rainfall event on 22 November (Figure 9b). S1, S2and S5, while having different levels of soil moisturecontent (S1—wettest; S5—driest), also have very similarresponses to rainfall over this period (Figure 9b). Thedifferent magnitudes in root zone soil moisture amongthese three sites are likely to be a result of their positionswithin the catchment, with S1 located within the Bow soillandscape, with predominantly black clay soils, while S5is found on the red soils of the Ant Hill soil landscapegroup, and has a north-east facing aspect.
Despite these observed trends, no statistically signif-icant relationships between root zone soil moisture andaspect, slope, elevation, and soil type were found. Dailyaverage root zone soil moisture, calculated by averag-ing the 20-min data from the monitoring stations, wasregressed against aspect, slope gradient (%), elevation,and soil type at those sites, for which no statisticallysignificant relationships were found.
Near-surface (0–50 mm) versus root zone (0–300 mm)soil moisture. Catchment daily mean near-surface (0–50 mm) and root zone (0–300 mm) soil moisture were
Copyright 2007 John Wiley & Sons, Ltd. Hydrol. Process. (2007)DOI: 10.1002/hyp
C. MARTINEZ ET AL.
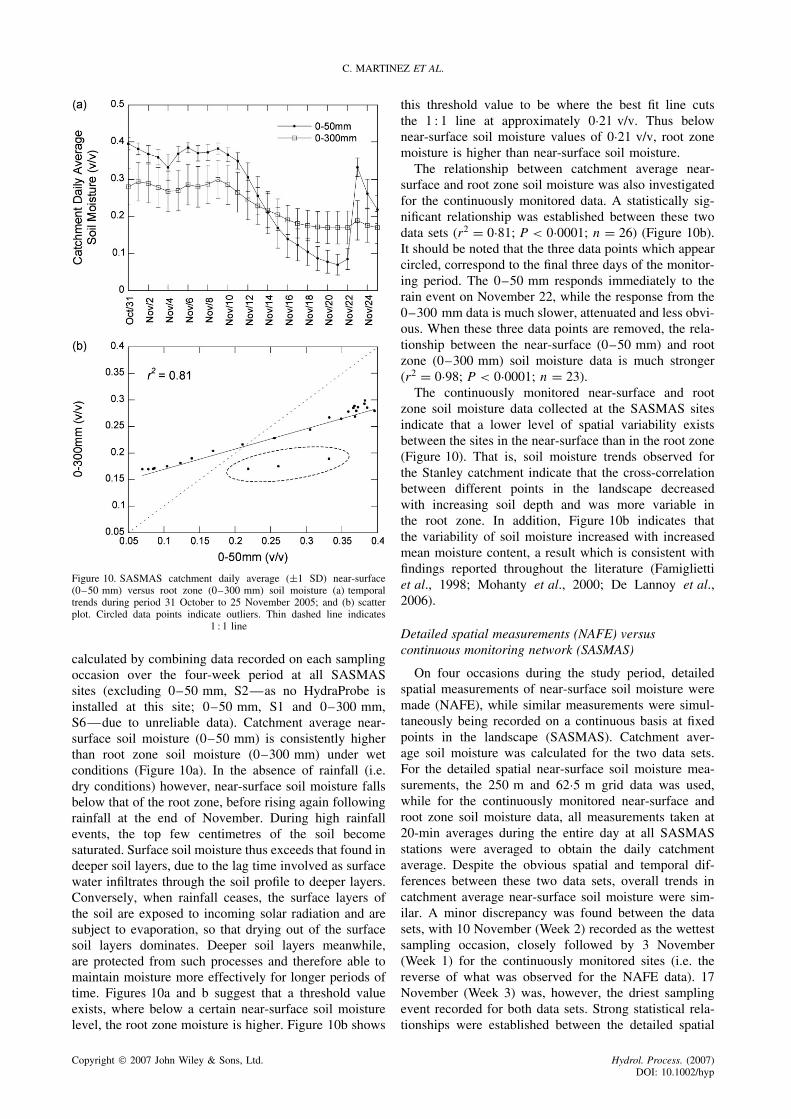
Figure 10. SASMAS catchment daily average (š1 SD) near-surface(0–50 mm) versus root zone (0–300 mm) soil moisture (a) temporaltrends during period 31 October to 25 November 2005; and (b) scatterplot. Circled data points indicate outliers. Thin dashed line indicates
1 : 1 line
calculated by combining data recorded on each samplingoccasion over the four-week period at all SASMASsites (excluding 0–50 mm, S2—as no HydraProbe isinstalled at this site; 0–50 mm, S1 and 0–300 mm,S6—due to unreliable data). Catchment average near-surface soil moisture (0–50 mm) is consistently higherthan root zone soil moisture (0–300 mm) under wetconditions (Figure 10a). In the absence of rainfall (i.e.dry conditions) however, near-surface soil moisture fallsbelow that of the root zone, before rising again followingrainfall at the end of November. During high rainfallevents, the top few centimetres of the soil becomesaturated. Surface soil moisture thus exceeds that found indeeper soil layers, due to the lag time involved as surfacewater infiltrates through the soil profile to deeper layers.Conversely, when rainfall ceases, the surface layers ofthe soil are exposed to incoming solar radiation and aresubject to evaporation, so that drying out of the surfacesoil layers dominates. Deeper soil layers meanwhile,are protected from such processes and therefore able tomaintain moisture more effectively for longer periods oftime. Figures 10a and b suggest that a threshold valueexists, where below a certain near-surface soil moisturelevel, the root zone moisture is higher. Figure 10b shows
this threshold value to be where the best fit line cutsthe 1 : 1 line at approximately 0Ð21 v/v. Thus belownear-surface soil moisture values of 0Ð21 v/v, root zonemoisture is higher than near-surface soil moisture.
The relationship between catchment average near-surface and root zone soil moisture was also investigatedfor the continuously monitored data. A statistically sig-nificant relationship was established between these twodata sets (r2 D 0Ð81; P < 0Ð0001; n D 26) (Figure 10b).It should be noted that the three data points which appearcircled, correspond to the final three days of the monitor-ing period. The 0–50 mm responds immediately to therain event on November 22, while the response from the0–300 mm data is much slower, attenuated and less obvi-ous. When these three data points are removed, the rela-tionship between the near-surface (0–50 mm) and rootzone (0–300 mm) soil moisture data is much stronger(r2 D 0Ð98; P < 0Ð0001; n D 23).
The continuously monitored near-surface and rootzone soil moisture data collected at the SASMAS sitesindicate that a lower level of spatial variability existsbetween the sites in the near-surface than in the root zone(Figure 10). That is, soil moisture trends observed forthe Stanley catchment indicate that the cross-correlationbetween different points in the landscape decreasedwith increasing soil depth and was more variable inthe root zone. In addition, Figure 10b indicates thatthe variability of soil moisture increased with increasedmean moisture content, a result which is consistent withfindings reported throughout the literature (Famigliettiet al., 1998; Mohanty et al., 2000; De Lannoy et al.,2006).
Detailed spatial measurements (NAFE) versuscontinuous monitoring network (SASMAS)
On four occasions during the study period, detailedspatial measurements of near-surface soil moisture weremade (NAFE), while similar measurements were simul-taneously being recorded on a continuous basis at fixedpoints in the landscape (SASMAS). Catchment aver-age soil moisture was calculated for the two data sets.For the detailed spatial near-surface soil moisture mea-surements, the 250 m and 62Ð5 m grid data was used,while for the continuously monitored near-surface androot zone soil moisture data, all measurements taken at20-min averages during the entire day at all SASMASstations were averaged to obtain the daily catchmentaverage. Despite the obvious spatial and temporal dif-ferences between these two data sets, overall trends incatchment average near-surface soil moisture were sim-ilar. A minor discrepancy was found between the datasets, with 10 November (Week 2) recorded as the wettestsampling occasion, closely followed by 3 November(Week 1) for the continuously monitored sites (i.e. thereverse of what was observed for the NAFE data). 17November (Week 3) was, however, the driest samplingevent recorded for both data sets. Strong statistical rela-tionships were established between the detailed spatial
Copyright 2007 John Wiley & Sons, Ltd. Hydrol. Process. (2007)DOI: 10.1002/hyp
CATCHMENT-SCALE SOIL MOISTURE PATTERNS
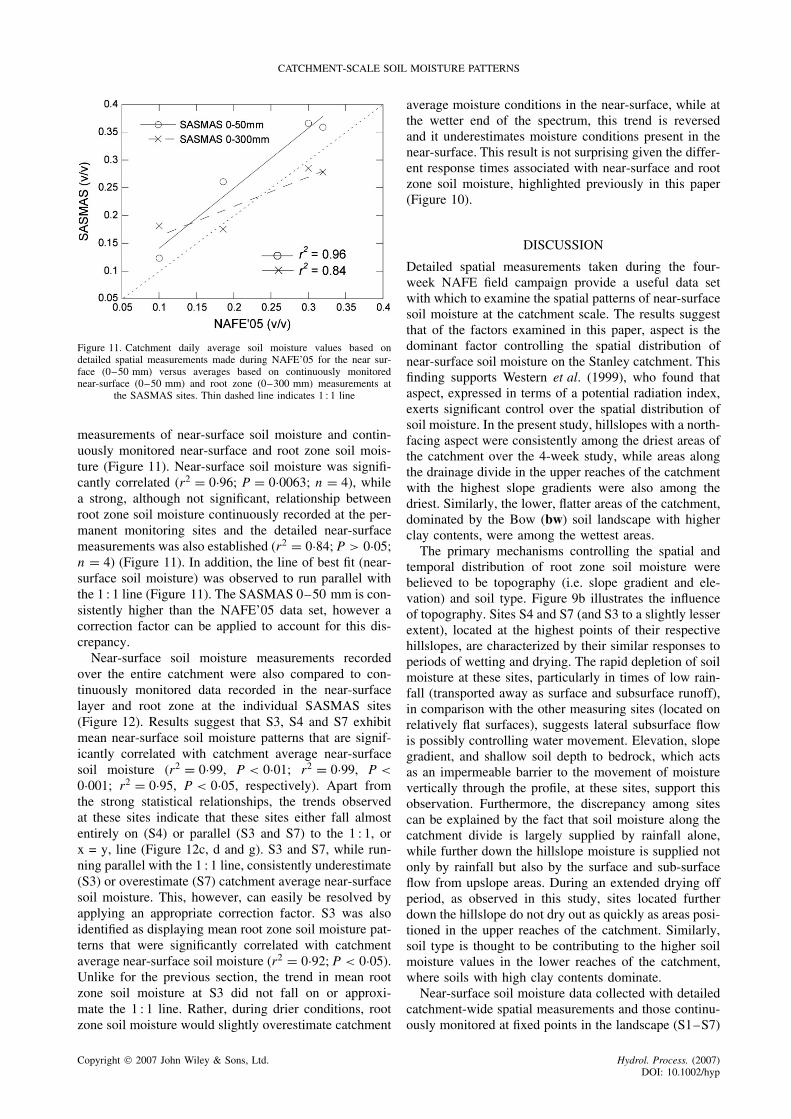
Figure 11. Catchment daily average soil moisture values based ondetailed spatial measurements made during NAFE’05 for the near sur-face (0–50 mm) versus averages based on continuously monitorednear-surface (0–50 mm) and root zone (0–300 mm) measurements at
the SASMAS sites. Thin dashed line indicates 1 : 1 line
measurements of near-surface soil moisture and contin-uously monitored near-surface and root zone soil mois-ture (Figure 11). Near-surface soil moisture was signifi-cantly correlated (r2 D 0Ð96; P D 0Ð0063; n D 4), whilea strong, although not significant, relationship betweenroot zone soil moisture continuously recorded at the per-manent monitoring sites and the detailed near-surfacemeasurements was also established (r2 D 0Ð84; P > 0Ð05;n D 4) (Figure 11). In addition, the line of best fit (near-surface soil moisture) was observed to run parallel withthe 1 : 1 line (Figure 11). The SASMAS 0–50 mm is con-sistently higher than the NAFE’05 data set, however acorrection factor can be applied to account for this dis-crepancy.
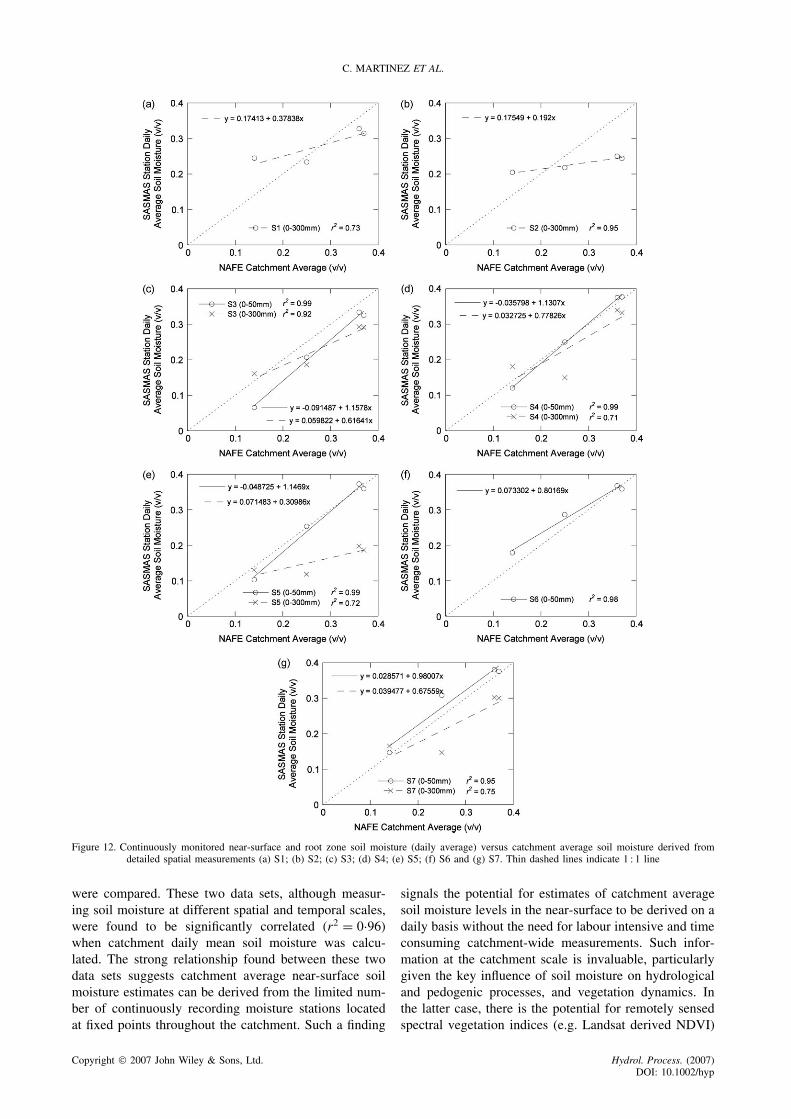
Near-surface soil moisture measurements recordedover the entire catchment were also compared to con-tinuously monitored data recorded in the near-surfacelayer and root zone at the individual SASMAS sites(Figure 12). Results suggest that S3, S4 and S7 exhibitmean near-surface soil moisture patterns that are signif-icantly correlated with catchment average near-surfacesoil moisture (r2 D 0Ð99, P < 0Ð01; r2 D 0Ð99, P <0Ð001; r2 D 0Ð95, P < 0Ð05, respectively). Apart fromthe strong statistical relationships, the trends observedat these sites indicate that these sites either fall almostentirely on (S4) or parallel (S3 and S7) to the 1 : 1, orx = y, line (Figure 12c, d and g). S3 and S7, while run-ning parallel with the 1 : 1 line, consistently underestimate(S3) or overestimate (S7) catchment average near-surfacesoil moisture. This, however, can easily be resolved byapplying an appropriate correction factor. S3 was alsoidentified as displaying mean root zone soil moisture pat-terns that were significantly correlated with catchmentaverage near-surface soil moisture (r2 D 0Ð92; P < 0Ð05).Unlike for the previous section, the trend in mean rootzone soil moisture at S3 did not fall on or approxi-mate the 1 : 1 line. Rather, during drier conditions, rootzone soil moisture would slightly overestimate catchment
average moisture conditions in the near-surface, while atthe wetter end of the spectrum, this trend is reversedand it underestimates moisture conditions present in thenear-surface. This result is not surprising given the differ-ent response times associated with near-surface and rootzone soil moisture, highlighted previously in this paper(Figure 10).
DISCUSSION
Detailed spatial measurements taken during the four-week NAFE field campaign provide a useful data setwith which to examine the spatial patterns of near-surfacesoil moisture at the catchment scale. The results suggestthat of the factors examined in this paper, aspect is thedominant factor controlling the spatial distribution ofnear-surface soil moisture on the Stanley catchment. Thisfinding supports Western et al. (1999), who found thataspect, expressed in terms of a potential radiation index,exerts significant control over the spatial distribution ofsoil moisture. In the present study, hillslopes with a north-facing aspect were consistently among the driest areas ofthe catchment over the 4-week study, while areas alongthe drainage divide in the upper reaches of the catchmentwith the highest slope gradients were also among thedriest. Similarly, the lower, flatter areas of the catchment,dominated by the Bow (bw) soil landscape with higherclay contents, were among the wettest areas.
The primary mechanisms controlling the spatial andtemporal distribution of root zone soil moisture werebelieved to be topography (i.e. slope gradient and ele-vation) and soil type. Figure 9b illustrates the influenceof topography. Sites S4 and S7 (and S3 to a slightly lesserextent), located at the highest points of their respectivehillslopes, are characterized by their similar responses toperiods of wetting and drying. The rapid depletion of soilmoisture at these sites, particularly in times of low rain-fall (transported away as surface and subsurface runoff),in comparison with the other measuring sites (located onrelatively flat surfaces), suggests lateral subsurface flowis possibly controlling water movement. Elevation, slopegradient, and shallow soil depth to bedrock, which actsas an impermeable barrier to the movement of moisturevertically through the profile, at these sites, support thisobservation. Furthermore, the discrepancy among sitescan be explained by the fact that soil moisture along thecatchment divide is largely supplied by rainfall alone,while further down the hillslope moisture is supplied notonly by rainfall but also by the surface and sub-surfaceflow from upslope areas. During an extended drying offperiod, as observed in this study, sites located furtherdown the hillslope do not dry out as quickly as areas posi-tioned in the upper reaches of the catchment. Similarly,soil type is thought to be contributing to the higher soilmoisture values in the lower reaches of the catchment,where soils with high clay contents dominate.
Near-surface soil moisture data collected with detailedcatchment-wide spatial measurements and those continu-ously monitored at fixed points in the landscape (S1–S7)
Copyright 2007 John Wiley & Sons, Ltd. Hydrol. Process. (2007)DOI: 10.1002/hyp
C. MARTINEZ ET AL.
Figure 12. Continuously monitored near-surface and root zone soil moisture (daily average) versus catchment average soil moisture derived fromdetailed spatial measurements (a) S1; (b) S2; (c) S3; (d) S4; (e) S5; (f) S6 and (g) S7. Thin dashed lines indicate 1 : 1 line
were compared. These two data sets, although measur-ing soil moisture at different spatial and temporal scales,were found to be significantly correlated (r2 D 0Ð96)when catchment daily mean soil moisture was calcu-lated. The strong relationship found between these twodata sets suggests catchment average near-surface soilmoisture estimates can be derived from the limited num-ber of continuously recording moisture stations locatedat fixed points throughout the catchment. Such a finding
signals the potential for estimates of catchment averagesoil moisture levels in the near-surface to be derived on adaily basis without the need for labour intensive and timeconsuming catchment-wide measurements. Such infor-mation at the catchment scale is invaluable, particularlygiven the key influence of soil moisture on hydrologicaland pedogenic processes, and vegetation dynamics. Inthe latter case, there is the potential for remotely sensedspectral vegetation indices (e.g. Landsat derived NDVI)
Copyright 2007 John Wiley & Sons, Ltd. Hydrol. Process. (2007)DOI: 10.1002/hyp
CATCHMENT-SCALE SOIL MOISTURE PATTERNS
to be used in conjunction with the high resolution soilmoisture data afforded by the SASMAS sites to providefurther insights into the spatial and temporal dynamics ofvegetation patterns at the catchment scale, which are cen-tral to both hydrological and biogeochemical cycles (e.g.carbon cycle). In addition, this information may then beused to monitor, and perhaps predict, the spatial and tem-poral distribution of soil carbon, given the influence ofsoil moisture on organic matter decomposition, and veg-etation dynamics, both above- and below-ground. Thesoil carbon pool is widely recognized as being a keyelement within the global carbon cycle, and is report-edly more than three times the size of the atmosphericpool, and approximately 4Ð5 times that of the biotic pool(Lal, 2004). Soil thus has the potential to be a significantreservoir for the storage of carbon, through the processof carbon sequestration. Increasing the amount of carbonstored in the soil will therefore help to reduce atmosphericconcentrations of CO2, as well as provide significant ben-efits to the physical, chemical and biological propertiesof soils (Lal et al., 1998). Despite its significance, thereremains a lack of understanding of the spatial and tempo-ral dynamics of soil carbon at regional and sub-regional(e.g. catchment and hillslope) scales. The SASMAS dataset therefore offers a unique opportunity to investigatethe influence of soil moisture dynamics on the spatialand temporal distribution of soil carbon at the catchmentscale.
Catchment average near-surface (continuously moni-tored and intensively sampled) and root zone soil mois-ture were also found to be correlated in this study, how-ever this relationship was not as strong as that found fornear-surface soil moisture alone. Continuously monitorednear-surface and root zone soil moisture were signifi-cantly correlated (r2 D 0Ð81), while the detailed spatialmeasurements of near-surface soil moisture were alsoclosely related to the continuously monitored root zonedata (r2 D 0Ð84). While no independent measures of rootzone soil moisture were available at the catchment scaleto assess the reliability of the continuously monitoredroot zone soil moisture, these findings suggest that esti-mates of root zone soil moisture can be inferred fromnear-surface measurements with a reasonable amount ofconfidence. The discrepancy between near-surface androot zone soil moisture data is likely to have two causes:(1) near-surface layers will respond faster to wettingevents and will dry out more quickly in the absence ofrainfall; and (2) different mechanisms control the spa-tial and temporal distribution of soil moisture at differentdepths.
Different response times to rainfall events for thetwo soil depths examined were observed in this study.When wet conditions prevailed, the top few centimetresof the soil became saturated. Soil moisture levels thusexceeded those found in deeper soil layers, due to the lagtime involved with water moving down through the soilprofile. Conversely, under dry conditions, near-surfacesoil moisture fell below that of the root zone. In theabsence of rainfall, surface soil layers were exposed
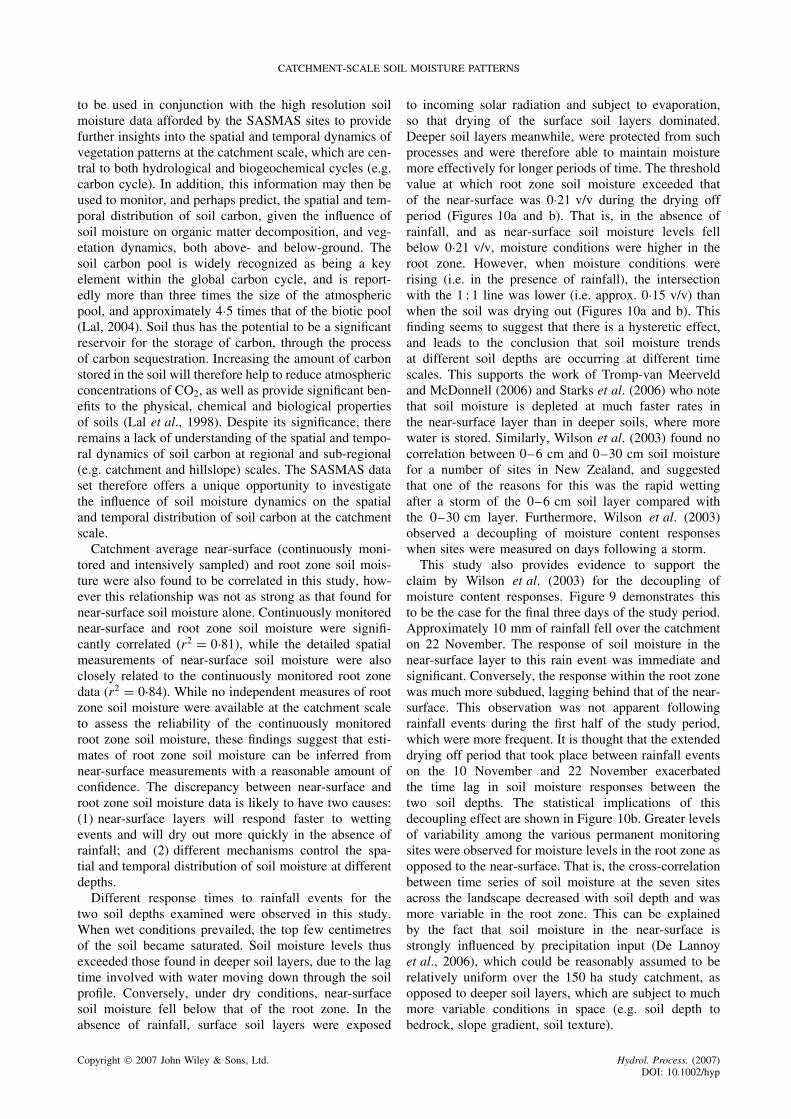
to incoming solar radiation and subject to evaporation,so that drying of the surface soil layers dominated.Deeper soil layers meanwhile, were protected from suchprocesses and were therefore able to maintain moisturemore effectively for longer periods of time. The thresholdvalue at which root zone soil moisture exceeded thatof the near-surface was 0Ð21 v/v during the drying offperiod (Figures 10a and b). That is, in the absence ofrainfall, and as near-surface soil moisture levels fellbelow 0Ð21 v/v, moisture conditions were higher in theroot zone. However, when moisture conditions wererising (i.e. in the presence of rainfall), the intersectionwith the 1 : 1 line was lower (i.e. approx. 0Ð15 v/v) thanwhen the soil was drying out (Figures 10a and b). Thisfinding seems to suggest that there is a hysteretic effect,and leads to the conclusion that soil moisture trendsat different soil depths are occurring at different timescales. This supports the work of Tromp-van Meerveldand McDonnell (2006) and Starks et al. (2006) who notethat soil moisture is depleted at much faster rates inthe near-surface layer than in deeper soils, where morewater is stored. Similarly, Wilson et al. (2003) found nocorrelation between 0–6 cm and 0–30 cm soil moisturefor a number of sites in New Zealand, and suggestedthat one of the reasons for this was the rapid wettingafter a storm of the 0–6 cm soil layer compared withthe 0–30 cm layer. Furthermore, Wilson et al. (2003)observed a decoupling of moisture content responseswhen sites were measured on days following a storm.
This study also provides evidence to support theclaim by Wilson et al. (2003) for the decoupling ofmoisture content responses. Figure 9 demonstrates thisto be the case for the final three days of the study period.Approximately 10 mm of rainfall fell over the catchmenton 22 November. The response of soil moisture in thenear-surface layer to this rain event was immediate andsignificant. Conversely, the response within the root zonewas much more subdued, lagging behind that of the near-surface. This observation was not apparent followingrainfall events during the first half of the study period,which were more frequent. It is thought that the extendeddrying off period that took place between rainfall eventson the 10 November and 22 November exacerbatedthe time lag in soil moisture responses between thetwo soil depths. The statistical implications of thisdecoupling effect are shown in Figure 10b. Greater levelsof variability among the various permanent monitoringsites were observed for moisture levels in the root zone asopposed to the near-surface. That is, the cross-correlationbetween time series of soil moisture at the seven sitesacross the landscape decreased with soil depth and wasmore variable in the root zone. This can be explainedby the fact that soil moisture in the near-surface isstrongly influenced by precipitation input (De Lannoyet al., 2006), which could be reasonably assumed to berelatively uniform over the 150 ha study catchment, asopposed to deeper soil layers, which are subject to muchmore variable conditions in space (e.g. soil depth tobedrock, slope gradient, soil texture).
Copyright 2007 John Wiley & Sons, Ltd. Hydrol. Process. (2007)DOI: 10.1002/hyp
C. MARTINEZ ET AL.
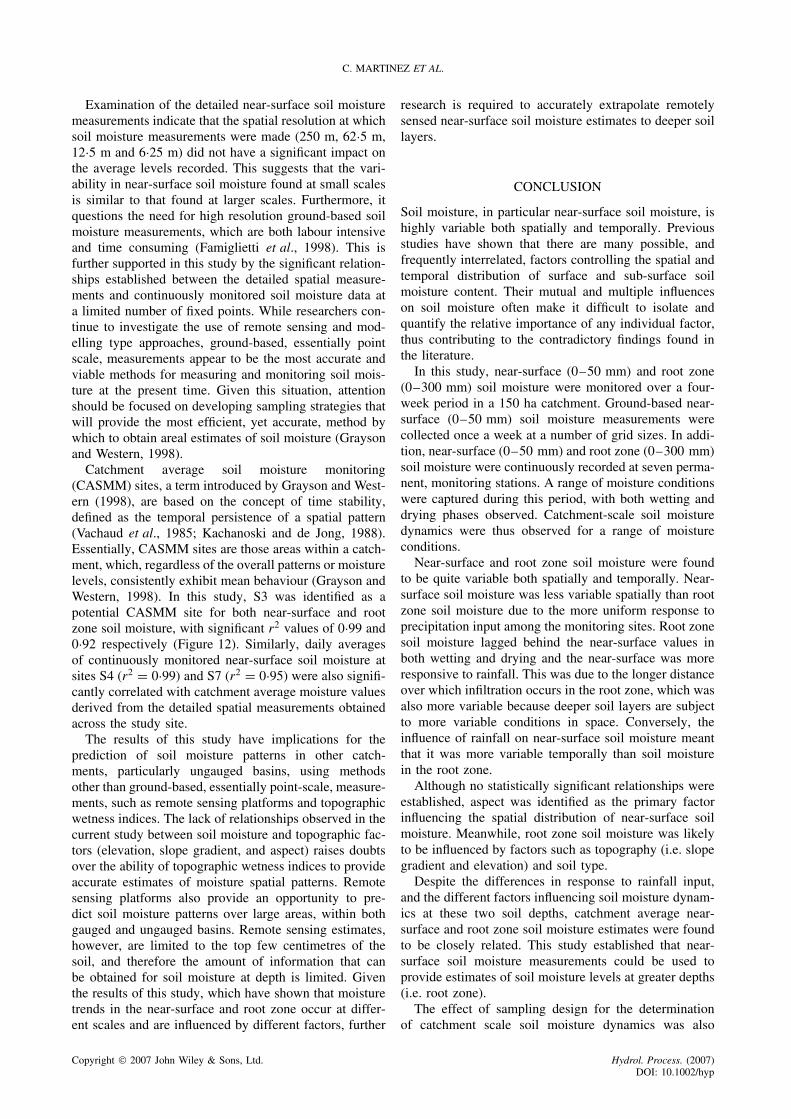
Examination of the detailed near-surface soil moisturemeasurements indicate that the spatial resolution at whichsoil moisture measurements were made (250 m, 62Ð5 m,12Ð5 m and 6Ð25 m) did not have a significant impact onthe average levels recorded. This suggests that the vari-ability in near-surface soil moisture found at small scalesis similar to that found at larger scales. Furthermore, itquestions the need for high resolution ground-based soilmoisture measurements, which are both labour intensiveand time consuming (Famiglietti et al., 1998). This isfurther supported in this study by the significant relation-ships established between the detailed spatial measure-ments and continuously monitored soil moisture data ata limited number of fixed points. While researchers con-tinue to investigate the use of remote sensing and mod-elling type approaches, ground-based, essentially pointscale, measurements appear to be the most accurate andviable methods for measuring and monitoring soil mois-ture at the present time. Given this situation, attentionshould be focused on developing sampling strategies thatwill provide the most efficient, yet accurate, method bywhich to obtain areal estimates of soil moisture (Graysonand Western, 1998).
Catchment average soil moisture monitoring(CASMM) sites, a term introduced by Grayson and West-ern (1998), are based on the concept of time stability,defined as the temporal persistence of a spatial pattern(Vachaud et al., 1985; Kachanoski and de Jong, 1988).Essentially, CASMM sites are those areas within a catch-ment, which, regardless of the overall patterns or moisturelevels, consistently exhibit mean behaviour (Grayson andWestern, 1998). In this study, S3 was identified as apotential CASMM site for both near-surface and rootzone soil moisture, with significant r2 values of 0Ð99 and0Ð92 respectively (Figure 12). Similarly, daily averagesof continuously monitored near-surface soil moisture atsites S4 (r2 D 0Ð99) and S7 (r2 D 0Ð95) were also signifi-cantly correlated with catchment average moisture valuesderived from the detailed spatial measurements obtainedacross the study site.
The results of this study have implications for theprediction of soil moisture patterns in other catch-ments, particularly ungauged basins, using methodsother than ground-based, essentially point-scale, measure-ments, such as remote sensing platforms and topographicwetness indices. The lack of relationships observed in thecurrent study between soil moisture and topographic fac-tors (elevation, slope gradient, and aspect) raises doubtsover the ability of topographic wetness indices to provideaccurate estimates of moisture spatial patterns. Remotesensing platforms also provide an opportunity to pre-dict soil moisture patterns over large areas, within bothgauged and ungauged basins. Remote sensing estimates,however, are limited to the top few centimetres of thesoil, and therefore the amount of information that canbe obtained for soil moisture at depth is limited. Giventhe results of this study, which have shown that moisturetrends in the near-surface and root zone occur at differ-ent scales and are influenced by different factors, further
research is required to accurately extrapolate remotelysensed near-surface soil moisture estimates to deeper soillayers.
CONCLUSION
Soil moisture, in particular near-surface soil moisture, ishighly variable both spatially and temporally. Previousstudies have shown that there are many possible, andfrequently interrelated, factors controlling the spatial andtemporal distribution of surface and sub-surface soilmoisture content. Their mutual and multiple influenceson soil moisture often make it difficult to isolate andquantify the relative importance of any individual factor,thus contributing to the contradictory findings found inthe literature.
In this study, near-surface (0–50 mm) and root zone(0–300 mm) soil moisture were monitored over a four-week period in a 150 ha catchment. Ground-based near-surface (0–50 mm) soil moisture measurements werecollected once a week at a number of grid sizes. In addi-tion, near-surface (0–50 mm) and root zone (0–300 mm)soil moisture were continuously recorded at seven perma-nent, monitoring stations. A range of moisture conditionswere captured during this period, with both wetting anddrying phases observed. Catchment-scale soil moisturedynamics were thus observed for a range of moistureconditions.
Near-surface and root zone soil moisture were foundto be quite variable both spatially and temporally. Near-surface soil moisture was less variable spatially than rootzone soil moisture due to the more uniform response toprecipitation input among the monitoring sites. Root zonesoil moisture lagged behind the near-surface values inboth wetting and drying and the near-surface was moreresponsive to rainfall. This was due to the longer distanceover which infiltration occurs in the root zone, which wasalso more variable because deeper soil layers are subjectto more variable conditions in space. Conversely, theinfluence of rainfall on near-surface soil moisture meantthat it was more variable temporally than soil moisturein the root zone.
Although no statistically significant relationships wereestablished, aspect was identified as the primary factorinfluencing the spatial distribution of near-surface soilmoisture. Meanwhile, root zone soil moisture was likelyto be influenced by factors such as topography (i.e. slopegradient and elevation) and soil type.
Despite the differences in response to rainfall input,and the different factors influencing soil moisture dynam-ics at these two soil depths, catchment average near-surface and root zone soil moisture estimates were foundto be closely related. This study established that near-surface soil moisture measurements could be used toprovide estimates of soil moisture levels at greater depths(i.e. root zone).
The effect of sampling design for the determinationof catchment scale soil moisture dynamics was also
Copyright 2007 John Wiley & Sons, Ltd. Hydrol. Process. (2007)DOI: 10.1002/hyp
CATCHMENT-SCALE SOIL MOISTURE PATTERNS
investigated. The network of continuously monitoringsensors was shown to be able to provide accurateestimates of catchment average near-surface and rootzone soil moisture content for a range of moistureconditions as assessed by comparison with detailedspatial measurements obtained over a few hours. Inaddition, potential CASMM sites were identified amongthe continuously monitoring stations. The findings ofthis study have shown that the network of monitoringstations established on the study catchment providereliable estimates of average soil moisture, both in thenear-surface and root zone. This provides a uniqueopportunity for such an extensive data set to improve ourunderstanding of additional catchment-scale processes,including vegetation dynamics and nutrient cycling, forwhich soil moisture is a key factor.
ACKNOWLEDGEMENTS
The authors thank all property owners involved in theSASMAS project and NAFE’05 field campaign for host-ing soil moisture, streamflow or climate monitoringsites and allowing free access to their land during theintensive field campaigns. The owners of the ‘Stanley’property, Doc and Fiona Strachan, are thanked espe-cially for their cooperation and assistance in hostingsuch a large amount of monitoring equipment. We alsothank all colleagues who participated in the NAFE’05field campaign and helped to collect the ground-baseddata set, for their extraordinary efforts over the four-week campaign. The advice and support of Olivier Rey-Lescure (digital elevation model preparation), and thereview comments by David O’Brien are also very muchappreciated. This research was funded by the AustralianResearch Council Discovery Projects DP0556941: ‘Car-bon, nutrient and sediment dynamics in a semi-arid catch-ment’, DP0557543, and DP0209724. The two anonymousreviewers are thanked for their constructive commentsand recommendations which have helped improve themanuscript.
REFERENCES
Campbell Scientific Inc. 2002. CS616 Water Content ReflectometerInstruction Manual . Campbell Scientific Inc: Logan, USA, 33.
Canton Y, Sole-Benet A, Domingo F. 2004. Temporal and spatialpatterns of soil moisture in semiarid badlands of SE Spain. Journalof Hydrology 285: 199–214. DOI:10Ð1016/j.jhydrol.2003Ð08Ð018.
Cosh MH, Jackson TJ, Bindlish R, Prueger JH. 2004. Watershed scaletemporal and spatial stability of soil moisture and its role in validatingsatellite estimates. Remote Sensing of Environment 92: 427–435.DOI:10Ð1016/j.rse.2004Ð02Ð016.
De Lannoy GJM, Verhoest NEC, Houser PR, Gish TJ, Van Meir-venne M. 2006. Spatial and temporal characteristics of soil moisture inan intensively monitored agricultural field (OPE3). Journal of Hydrol-ogy , 331(3–4): 719–730.
Di Domenico A, Laguardia G, Fiorentino M. 2006. Capturing criticalbehaviour in soil moisture spatio-temporal dynamics. Advances inWater Resources . 30(3): 543–554.
Famiglietti JS, Rudnicki JW, Rodell M. 1998. Variability in surfacemoisture content along a hillslope transect: Rattlesnake Hill, Texas.Journal of Hydrology 210: 259–281.
Grayson RB, Western AW. 1998. Towards areal estimation of soil watercontent from point measurements: time and space stability of meanresponse. Journal of Hydrology 207: 68–82.
Hebrard O, Voltz M, Andrieux P, Moussa R. 2006. Spatio-temporaldistribution of soil surface moisture in a heterogeneously farmedMediterranean catchment. Journal of Hydrology 329: 110–121.DOI:10Ð1016/jjhydrol.2006Ð02Ð012.
Hemakumara M, Kalma JD, Walker JP, Willgoose G. 2004. Downscal-ing of low resolution passive microwave soil moisture observations.Proceedings of the 2 nd International CAHMDA Workshop on: The Ter-restrial Water Cycle: Modelling and Data Assimilation Across Catch-ment Scales, Princeton, NJ.
Kachanoski RG, De Jong E. 1988. Scale dependence and the temporalpersistence of spatial patterns of soil water storage. Water ResourcesResearch 24(1): 85–91.
Kovac M, Lawrie JW. 1991. Soil Landscapes of the Singleton 1 : 250 000Sheet . Soil Conservation Service of NSW, Sydney, Australia.
Lal R. 2004. Soil carbon sequestration impacts on global climate changeand food security. Science 304: 1623–1627.
Lal R, Kimble J, Follett R. 1998. Pedospheric processes and the carboncycle. In Soil Processes and the Carbon Cycle. Lal R, Kimble JM,Follett RF, Stewart BA (eds.) CRC Press: Boca Raton, FL; 1–8.
Martinez C, Hancock GR, Murphy D, Kalma JD. 2006. An Assessmentof Soil Carbon at the Hillslope Scale—Australian Examples,Geophysical Research Abstracts [CD-ROM], 8, EGU06-A-05311,EGU General Assembly, Vienna, Austria, 2–7 April 2006.
McInnes-Clarke S. 2003. Environmental Services Scheme Soil Survey:Stanley—Merriwa, Hunter Valley , NSW Department of Infrastructure,Planning and Natural Resources. Sydney, Australia.
Mitchell M. 2002. Native Grasses: An Identification Handbook forTemperate Australia (3rd edition), CSIRO: Melbourne, Australia, 43.
Mohanty BP, Skaggs TH, Famiglietti JS. 2000. Analysis and mapping offield-scale soil moisture variability using high-resolution, ground-baseddata during the Southern Great Plains 1997 (SGP1997) HydrologyExperiment. Water Resources Research 36(4): 1023–1031.
Qui Y, Fu B, Wang J, Chen L. 2001. Soil moisture variation in relation totopography and land use in a hillslope catchment of the Loess Plateau,China. Journal of Hydrology 240: 243–263.
Rudiger C. 2006. Streamflow data assimilation for soil moistureprediction. PhD thesis, The University of Melbourne, Australia.
Rudiger C, Hemakumara HM, Jacobs B, Kalma JD, Walker JP, Will-goose GR, Martinez C, Hancock G. 2007. Goulburn River exper-imental catchment data set. Water Resources Research, DOI:10.1029/2006WR005837 (in press).
Starks PJ, Heathman GC, Jackson TJ, Cosh MH. 2006. Temporalstability of soil moisture profile. Journal of Hydrology 324: 400–411.DOI:10Ð1016/j.jhydrol.2005Ð09Ð024.
Stevens Vitel Inc. 1994. Hydra Soil Moisture Probe User’s Manual(Version 1Ð2). Virginia, USA.
Story R, Galloway RW, van de Graaff RHM, Tweedie AD. 1963.General Report on the Lands of the Hunter Valley. Land ResearchSeries No. 8, Commonwealth Scientific and Industrial ResearchOrganization: Melbourne, Australia.
Svetlitchnyi AA, Plotnitskiy SV, Stepovaya OY. 2003. Spatial distribu-tion of soil moisture content within catchments and its modellingon the basis of topographic data. Journal of Hydrology 277: 50–60.DOI:10Ð1016/S0022–1694(03)00083–0.
Tarboton DG, Bras RL, Rodriguez-Iturbe I. 1989. The analysis of riverbasins and channel networks using digital terrain data, TR 326 .Department of Civil and Environmental Engineering, MassachusettsInstitute of Technology, Boston.
Tromp-van Meerveld HJ, McDonnell JJ. 2006. On the interrelationsbetween topography, soil depth, soil moisture, transpiration rates andspecies distribution at the hillslope scale. Advances in Water Resources29: 293–310. DOI:10Ð1016/j.advwatres.2005Ð02Ð016.
Vachaud G, Passerat De Silan A, Balabanis P, Vauclin M. 1985.Temporal stability of spatially measured soil water probablility densityfunction. Soil Science Society of America Journal 49: 822–828.
Walker JP, Hacker JM, Kalma JD, Kim EJ, Panciera R. 2005. NationalAirborne Field Experiments for prediction in ungauged basins. InMODSIM 2005 International Congress on Modelling and Simulation,Zerger A, Argent RM (eds). Modelling and Simulation Society ofAustralia and New Zealand: 2974–2980.
Western AW, Grayson RB, Bloschl G, Willgoose GR, McMahon TA.1999. Observed spatial organization of soil moisture and its relation toterrain indices. Water Resources Research 35(3): 797–810.
Western AW, Seyfried MS. 2006. A calibration and temperaturecorrection procedure for the water content reflectometer. WaterResources Research 19: 3785–3793.
Copyright 2007 John Wiley & Sons, Ltd. Hydrol. Process. (2007)DOI: 10.1002/hyp

C. MARTINEZ ET AL.
Western AW, Zhou S-L, Grayson RB, McMahon TA, Bloschl G, Wil-son DJ. 2004. Spatial correlation of soil moisture in small catchmentsand its relationship to dominant spatial hydrological processes. Journalof Hydrology 286: 113–134. DOI:10Ð1016/j.jhydrol.2003Ð09Ð014.
Wilson DJ, Western AW, Grayson RB. 2005. A terrain and data-based method for generating the spatial distribution of soil mois-ture. Advances in Water Resources 28: 43–54. DOI:10Ð1016/j.advwatres.2004Ð09Ð007.
Wilson DJ, Western AW, Grayson RB, Berg AA, Lear MS, Rodell M,Famiglietti JS, Woods RA, McMahon TA. 2003. Spatial distribution ofsoil moisture over 6 and 30cm depth, Mahurangi river catchment, NewZealand. Journal of Hydrology 276: 254–274. DOI:10Ð1016/S0022-1694(03)00060-X.
Copyright 2007 John Wiley & Sons, Ltd. Hydrol. Process. (2007)DOI: 10.1002/hyp