Embed Size (px)
Citation preview
309
G e o l o g i c a A c t a , V o l . 1 0 , N º 3 , S e p t e m b e r 2 0 1 2 , 3 0 9 - 3 1 8D O I : 1 0 . 1 3 4 4 / 1 0 5 . 0 0 0 0 0 1 7 5 1A v a i l a b l e o n l i n e a t w w w. g e o l o g i c a - a c t a . c o m
Spatial variation of coda wave attenuation in the Southern Indian Shield and its implications
C. SINGH S.K. BASHA M. SHEKAR R.K. CHADHA
Department of Geology and GeophysicsIndian Institute of Technology, Karagpur, West Bengal 721-302 E-mail: [email protected]
National Geophysical Research InstituteCouncil of Scientific and Industrial Research, Uppal Road, Hyderabad 500007
A B S T R A C T
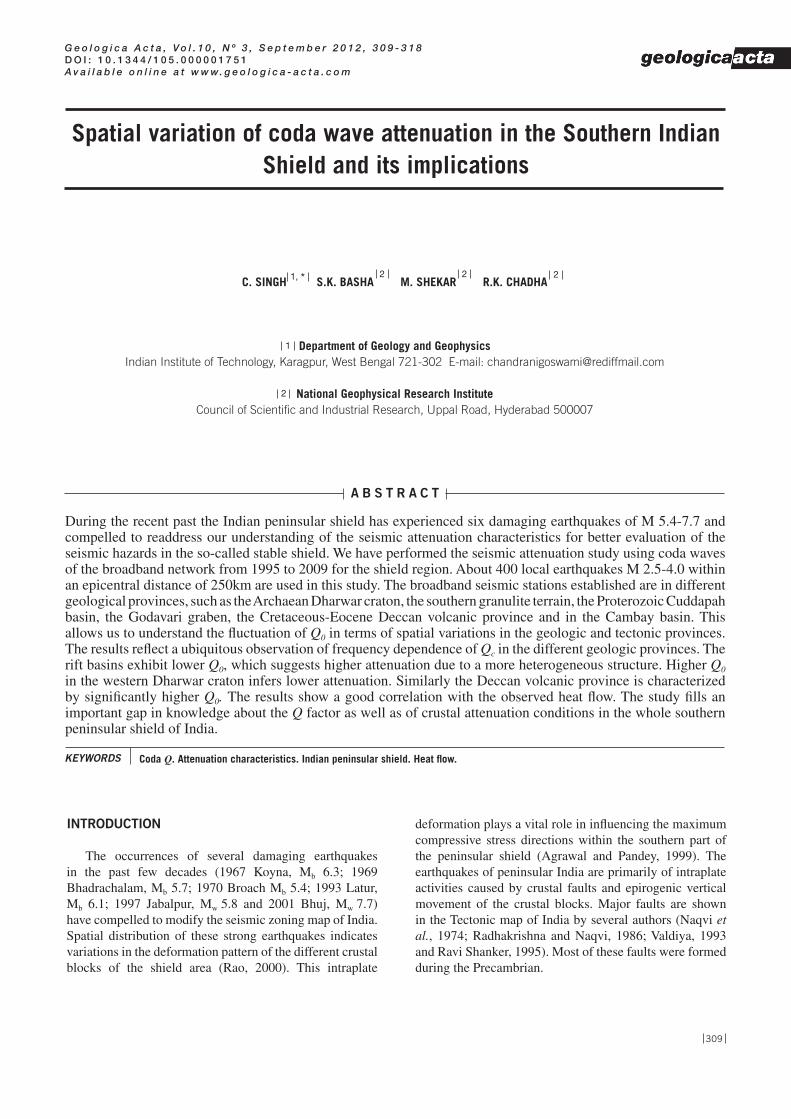
During the recent past the Indian peninsular shield has experienced six damaging earthquakes of M 5.4-7.7 and compelled to readdress our understanding of the seismic attenuation characteristics for better evaluation of the seismic hazards in the so-called stable shield. We have performed the seismic attenuation study using coda waves of the broadband network from 1995 to 2009 for the shield region. About 400 local earthquakes M 2.5-4.0 within an epicentral distance of 250km are used in this study. The broadband seismic stations established are in different geological provinces, such as the Archaean Dharwar craton, the southern granulite terrain, the Proterozoic Cuddapah basin, the Godavari graben, the Cretaceous-Eocene Deccan volcanic province and in the Cambay basin. This allows us to understand the fluctuation of Q0 in terms of spatial variations in the geologic and tectonic provinces. The results reflect a ubiquitous observation of frequency dependence of Qc in the different geologic provinces. The rift basins exhibit lower Q0, which suggests higher attenuation due to a more heterogeneous structure. Higher Q0
in the western Dharwar craton infers lower attenuation. Similarly the Deccan volcanic province is characterized by significantly higher Q0. The results show a good correlation with the observed heat flow. The study fills an important gap in knowledge about the Q factor as well as of crustal attenuation conditions in the whole southern peninsular shield of India.
Coda Q. Attenuation characteristics. Indian peninsular shield. Heat flow.KEYWORDS
INTRODUCTION
The occurrences of several damaging earthquakes in the past few decades (1967 Koyna, Mb 6.3; 1969 Bhadrachalam, Mb 5.7; 1970 Broach Mb 5.4; 1993 Latur, Mb 6.1; 1997 Jabalpur, Mw 5.8 and 2001 Bhuj, Mw 7.7) have compelled to modify the seismic zoning map of India. Spatial distribution of these strong earthquakes indicates variations in the deformation pattern of the different crustal blocks of the shield area (Rao, 2000). This intraplate
deformation plays a vital role in influencing the maximum compressive stress directions within the southern part of the peninsular shield (Agrawal and Pandey, 1999). The earthquakes of peninsular India are primarily of intraplate activities caused by crustal faults and epirogenic vertical movement of the crustal blocks. Major faults are shown in the Tectonic map of India by several authors (Naqvi et al., 1974; Radhakrishna and Naqvi, 1986; Valdiya, 1993 and Ravi Shanker, 1995). Most of these faults were formed during the Precambrian.
21, * 2 2
2
1

C . S I N G H e t a l .
G e o l o g i c a A c t a , 1 0 ( 3 ) , 3 0 9 - 3 1 8 ( 2 0 1 2 )D O I : 1 0 . 1 3 4 4 / 1 0 5 . 0 0 0 0 0 1 7 5 1
Coda wave attenuation in southern Indian Shield
310
The knowledge of regional values of the attenuation factor coda Qc and its spatial variation attracts considerable interest in relation to tectonics and seismicity, being an important subject in seismic risk analysis and engineering seismology (Singh and Herrmann, 1983; Jin and Aki, 1988). The coda Qc method is based on the following: 1) the coda wave is not affected by the source radiation pattern along the source-receiver direction, 2) path corrections are not necessary with the coda method since coda waves are scattered in the crustal volume, and 3) it can be applied successfully for single-station data (Aki, 1969, 1980; Aki and Chouet, 1975). It can be estimated using methods based on the single scattering model for coda wave generation (Aki and Chouet, 1975; Sato, 1977) which are based on the fit of the seismogram envelope, obtained at different frequency bands, to single-scattering theoretical models. Although single scattering is no longer taken to be a valid assumption (Gao et al., 1983; Frankel and Wennerberg, 1987), it is still used as it is found that estimated Qc are similar to the direct S-wave quality factor, and represent the attenuation characteristics of a given region. Aki (1985) observed agreement between Qc and S-wave Q and concluded that the S coda is formed by single S-to-S backscattered waves in the 1–25Hz range. Sarker and Abers (1998) compared the coda Q with S-wave Q measured using seismograms recorded at two seismic arrays in the Caucasus and Kopet Dagh (Turkmenistan). Their results demonstrated that coda Q agrees with S-wave Q in both areas. Several studies have been carried out in varied geological terrains worldwide to investigate the seismic wave attenuation property of the medium, characterize the seismic activity and discriminate seismically active regions from stable ones (Aki and Chouet, 1975; Sato, 1977; Roecker et al., 1982; Pulli, 1984; Wu, 1985; Jin and Aki, 1988, 1989; Havskov et al., 1989; Ibanez et al., 1990; Pujades et al., 1991; Canas et al., 1991; Akinci et al., 1994; Zelt et al., 1999; Biescas et al., 2007). Phillips et al. (1988) found significant differences in Qc related to variations in regional geology rather than variations in velocity between the two sides of the San Andreas fault in California. Seismic waves attenuate in amplitude (A) with both increasing travel time (t) and frequency (f), so that at a given t amplitudes decay with frequency A (f) ~exp(–πft/Q), where 1/Q describes the rate of attenuation in a given medium (Aki and Richards, 1980). Coda envelope shows a stable and similar time decay parameter for data from the same seismogenic area so the attenuation parameter (1/Qc) is often used to parametrize the tectonic characteristics. The heterogeneities responsible for the development of Qc can be caused by velocity and/or density perturbations, and the presence of cracks and faults. Aki (1980) and Pulli (1984) have determined a correlation between the dependence of Qc on frequency and the tectonic complexity of a region. Areas of strong tectonic heterogeneity show a strong frequency dependence of Qc. Among many other physical phenomena that affect 1/Q, temperature also probably
plays a dominant role below the upper crust (Sarker and Abers, 1999). It is widely accepted that the Qc value in high temperature or magma intrusion area is usually low. Sarker and Abers (1999) have shown that the 1/Q variations are a reasonable proxy for temperature variations. Gao (1992) suggested that, if coda mainly reflects the intrinsic Q, it should be very sensitive to temperature and the content of liquid within the detected body. However, if the activities are caused by small stress variations, consideration of coda Q may be less sensitive to the change in stress in comparison to temperature; it may thus be less sensitive to the stress-related precursors.
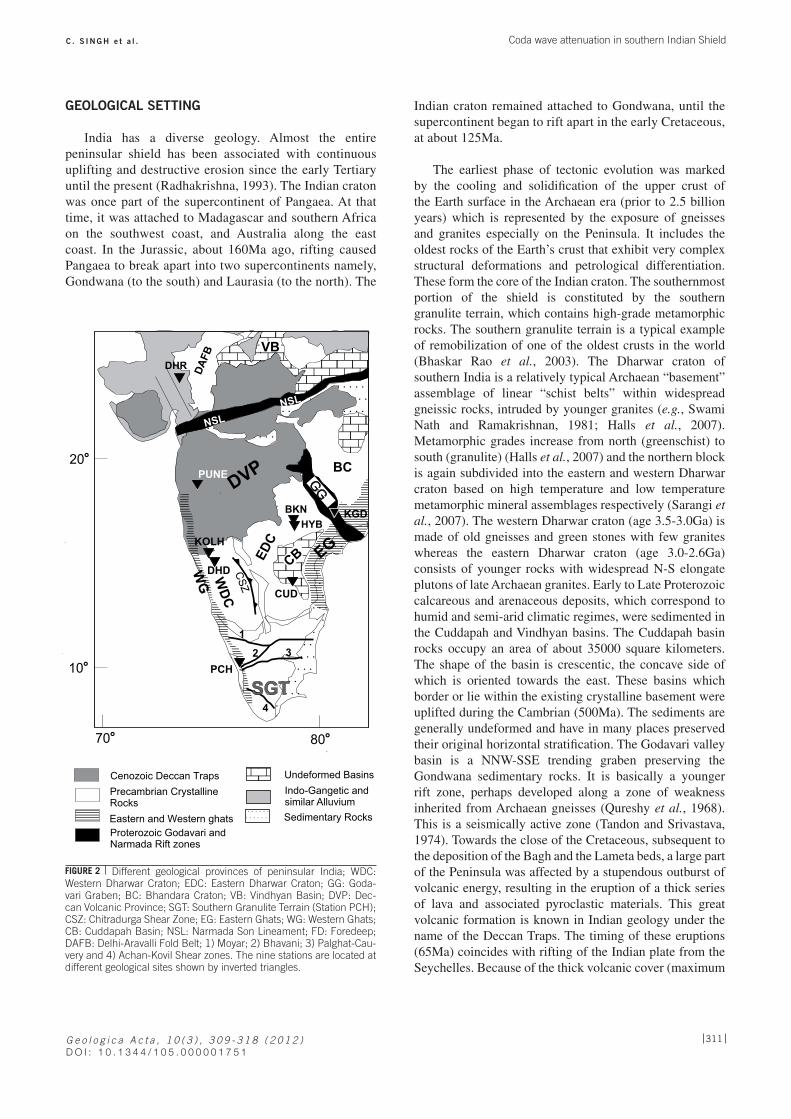
In this context, it is interesting to investigate whether the distinct geologic provinces of the Southern shield with differential heat variation show disparate attenuation characteristics. The attenuation of coda waves will be measured here as a function of frequency using about 400 local earthquakes during 1995-2009 (Fig. 1). Our investigation sites include three from the Archaean Dharwar craton, one from the southern granulite terrain, one from the Proterozoic Cuddapah basin of southern India, one from Godavari Graben, two from the southern part of the Cretaceous-Eocene Deccan volcanic province of central India and one site from the recent Cenozoic era (Fig. 2). This makes it interesting to study the influence of the geological structure on coda waves.
70 75 80
10
15
20
E°
N°
PUNE
KOLH
DHD
PCH
KGDBKN
HYB
CUD
DHR
25
Epicenter map of the events used for the analysis of Coda Q attenuation. Inverted triangles represent broadband seismic station locations.
FIGURE 1
G e o l o g i c a A c t a , 1 0 ( 3 ) , 3 0 9 - 3 1 8 ( 2 0 1 2 )D O I : 1 0 . 1 3 4 4 / 1 0 5 . 0 0 0 0 0 1 7 5 1
C . S I N G H e t a l . Coda wave attenuation in southern Indian Shield
311
GEOLOGICAL SETTING
India has a diverse geology. Almost the entire peninsular shield has been associated with continuous uplifting and destructive erosion since the early Tertiary until the present (Radhakrishna, 1993). The Indian craton was once part of the supercontinent of Pangaea. At that time, it was attached to Madagascar and southern Africa on the southwest coast, and Australia along the east coast. In the Jurassic, about 160Ma ago, rifting caused Pangaea to break apart into two supercontinents namely, Gondwana (to the south) and Laurasia (to the north). The
Indian craton remained attached to Gondwana, until the supercontinent began to rift apart in the early Cretaceous, at about 125Ma.
The earliest phase of tectonic evolution was marked by the cooling and solidification of the upper crust of the Earth surface in the Archaean era (prior to 2.5 billion years) which is represented by the exposure of gneisses and granites especially on the Peninsula. It includes the oldest rocks of the Earth’s crust that exhibit very complex structural deformations and petrological differentiation. These form the core of the Indian craton. The southernmost portion of the shield is constituted by the southern granulite terrain, which contains high-grade metamorphic rocks. The southern granulite terrain is a typical example of remobilization of one of the oldest crusts in the world (Bhaskar Rao et al., 2003). The Dharwar craton of southern India is a relatively typical Archaean “basement” assemblage of linear “schist belts” within widespread gneissic rocks, intruded by younger granites (e.g., Swami Nath and Ramakrishnan, 1981; Halls et al., 2007). Metamorphic grades increase from north (greenschist) to south (granulite) (Halls et al., 2007) and the northern block is again subdivided into the eastern and western Dharwar craton based on high temperature and low temperature metamorphic mineral assemblages respectively (Sarangi et al., 2007). The western Dharwar craton (age 3.5-3.0Ga) is made of old gneisses and green stones with few granites whereas the eastern Dharwar craton (age 3.0-2.6Ga) consists of younger rocks with widespread N-S elongate plutons of late Archaean granites. Early to Late Proterozoic calcareous and arenaceous deposits, which correspond to humid and semi-arid climatic regimes, were sedimented in the Cuddapah and Vindhyan basins. The Cuddapah basin rocks occupy an area of about 35000 square kilometers. The shape of the basin is crescentic, the concave side of which is oriented towards the east. These basins which border or lie within the existing crystalline basement were uplifted during the Cambrian (500Ma). The sediments are generally undeformed and have in many places preserved their original horizontal stratification. The Godavari valley basin is a NNW-SSE trending graben preserving the Gondwana sedimentary rocks. It is basically a younger rift zone, perhaps developed along a zone of weakness inherited from Archaean gneisses (Qureshy et al., 1968). This is a seismically active zone (Tandon and Srivastava, 1974). Towards the close of the Cretaceous, subsequent to the deposition of the Bagh and the Lameta beds, a large part of the Peninsula was affected by a stupendous outburst of volcanic energy, resulting in the eruption of a thick series of lava and associated pyroclastic materials. This great volcanic formation is known in Indian geology under the name of the Deccan Traps. The timing of these eruptions (65Ma) coincides with rifting of the Indian plate from the Seychelles. Because of the thick volcanic cover (maximum
DVP
80°70°
20°
10°
KGD
DHD
PUNE
PCH
CUD
1
2 3
4
WD
C
ED
C
DA
FB
SGT
BC
EGC
SZ
GG
CB
VB
Indo-Gangetic and similar Alluvium
Cenozoic Deccan Traps
Precambrian Crystalline Rocks
Eastern and Western ghats
Proterozoic Godavari and Narmada Rift zones
Undeformed Basins
Sedimentary Rocks
WG
HYB
NSL
NSL
BKN
DHR
KOLH
Different geological provinces of peninsular India; WDC: Western Dharwar Craton; EDC: Eastern Dharwar Craton; GG: Goda-vari Graben; BC: Bhandara Craton; VB: Vindhyan Basin; DVP: Dec-can Volcanic Province; SGT: Southern Granulite Terrain (Station PCH); CSZ: Chitradurga Shear Zone; EG: Eastern Ghats; WG: Western Ghats; CB: Cuddapah Basin; NSL: Narmada Son Lineament; FD: Foredeep; DAFB: Delhi-Aravalli Fold Belt; 1) Moyar; 2) Bhavani; 3) Palghat-Cau-very and 4) Achan-Kovil Shear zones. The nine stations are located at different geological sites shown by inverted triangles.
FIGURE 2
C . S I N G H e t a l .
G e o l o g i c a A c t a , 1 0 ( 3 ) , 3 0 9 - 3 1 8 ( 2 0 1 2 )D O I : 1 0 . 1 3 4 4 / 1 0 5 . 0 0 0 0 0 1 7 5 1
Coda wave attenuation in southern Indian Shield
312
thickness ~3000m), it is not easily possible to ascertain whether the basement rocks constitute those similar to the Dharwar craton. The origin of the Cambay rift basin, which is located in the northwest margin of the Indian platform, is connected with the northward movement of the Indian subcontinent after the break-up of Gondwanaland. This structure is occupied by a 3500m-thick pile of Tertiary and Quaternary sediments and bounded by north-northwest striking deep discontinuous normal faults.
DATA
In the aftermath of the many strong earthquakes in the southern peninsular shield region there has been an effort to monitor the seismic activity through the deployment of permanent broadband seismographs by various organizations like the Indian Meteorological Department, National Geophysical Research Institute, Center for Earth Science Studies, Indian Institute of Geomagnetism, Gujarat Engineering Research Institute, and Osmania University, supported by the Department of Science and Technology across the entire shield region. We have used nine stations from peninsular India like DHD, from the western Dharwar craton, which is situated in the core of the mid-Archaean craton; HYB and BKN are from the eastern Dharwar craton; PCH is from the southern granulite terrain; CUD is from the Proterozoic Cuddapah basin of southern India; KGD is from the Godavari graben; stations at KOLH and PUNE are on the Deccan volcanic province of central India and DHR is on the Cambay basin of the recent Cenozoic era (Fig. 2). All stations contain rocks of variable age, geological characters and different heat flow anomalies. These stations have been equipped with Broad-band three component seismographs. The HYB station is part of the GEOSCOPE global network with STS-1(360sec) and PUNE with STS-2(120sec). All the other stations are equipped with Guralp CMG-40T (30sec) and REFTEK-72A digitizers till the year 2006. From February 2007 onwards these stations are replaced with Nanometrics
Seismometer Trillium T240 (240sec) and Taurus digitizers. The details are given in Table 1. The locations of relatively higher magnitude earthquakes are taken from reporting agency Indian Meteorological Department, Maharashtra Engineering Research Institute, Nasik. Other very local earthquakes are located by using the single station method (Roberts et al., 1989). The arrival times of P and S phases and back azimuth (from station to source) are used for the estimation of origin time and epicenter. The locations of the events are reported in Figure 1. Only waveforms with good signal-to-noise (S/N) ratio (≥2) are analyzed. Different stations have different sample/sec, from 100 to 20 sample/s. The stations (HYB, PUNE and DHR) with 20 samples/s records were used for the estimation of Q up to 5Hz. Data from other stations used up to 16Hz (Table 1). About 400 local earthquakes are used, the epicentral distances of which are within 250km and of M 2.5-4. (Fig. 1). These earthquakes were recorded with sufficient coda duration. The vertical component is chosen, the clipped or overlapped earthquakes are removed and finally correlation coefficients with greater than 0.50 are considered for the present analysis. Figure 3 shows a digital seismogram recorded at station KOLH whose data were used for this analysis and the box marks the position of coda window for start times 2ts.
METHODOLOGY
Aki and Chouet (1975) proposed a single backscattering model to explain the coda waves as a superposition of secondary waves from randomly distributed heterogeneities. Assuming that coda waves are composed of single backscattered waves, the coda amplitude can be approximately expressed by the following formula:
A(f, t) = c(f)t - a exp(-πft / Qc ) (1)
where A(f, t) is the coda amplitude for a central frequency “f” over a narrow bandwidth signal at a lapse time “t” measured from the origin time of the seismic event and
1
Table 1
Station (Place) Agency Sensor Type Data used No earth-quakes
used
Frequencyband used
(Hz)
Geology
PCH (Peechi) CESS CMG-40T 12.2000 to 12.2007 51 1.5-16 South granulite terrain DHD (Dharwar) NGRI CMG-40T (01-03-2007 onwards Trillium 240) 12.2001 to 08.2008 58 1.5-16 Western Dharwar craton HYB (Hyderabad) GEOSCOPE STS-1 05.1995 to 01.2006 56 0.75-5 Eastern Dharwar craton BKN (Bicknoor) OU CMG-40T (01-08-2007 onwards Trillium 240) 03.2000 to 01.2009 30 1.5-16 Eastern Dharwar craton CUD (Cuddapah) NGRI CMG-40T (01-03-2007 onwards Trillium 240) 03.2000 to 07.2009 52 1.5-16 Cuddapah basin KGD (Kothagudem) NGRI CMG-40T (18-02-2007 onwards Trillium 240) 12.2000 to 08.2009 45 1.5-16 Godavari graben KOLH (Kolhapur) IIG Trillium 240 04.2008 to 07.2009 39 1.5-16 Deccan Volcanic province PUNE (Pune) IMD STS-2 08.2005 to 10.2008 20 0.75-5 Deccan Volcanic province DHR (Dharoi) GEERI CMG-40T 01.2000 to 10.2005 46 0.75-5 Western Cambay basin
Details of the types of instrumentation, period for which data was used, number of events and the operating agencies for each station. Agency abbreviations are given in the text. The frequency bands used for each station for the analysis are also indicatedTABLE 1

G e o l o g i c a A c t a , 1 0 ( 3 ) , 3 0 9 - 3 1 8 ( 2 0 1 2 )D O I : 1 0 . 1 3 4 4 / 1 0 5 . 0 0 0 0 0 1 7 5 1
C . S I N G H e t a l . Coda wave attenuation in southern Indian Shield
313
C(f) is the coda source factor. This is used for the estimation of quality factor Qc of coda waves representing the average attenuation properties of the medium for a given region. This is the most frequently used model and often chosen because it facilitates the comparison with other studies made elsewhere. Rautian and Khalturin (1978), however, found that equation (1) is valid only for the lapse time, t, greater than about two times the S-wave travel time, ts. Assuming the source factor, C(f), to be independent of time and radiation pattern and the geometrical spreading parameter (a) equals to 1 for body waves, the above equation can be rewritten as
lnA(f, t)* t = c - bt (2)
Where b = πft / Qc and c = lnC(f). Equation (2) represents the equation of a straight line, slope of which b = πft / Qc provides the Qc, for the central frequency f. Sato (1977)
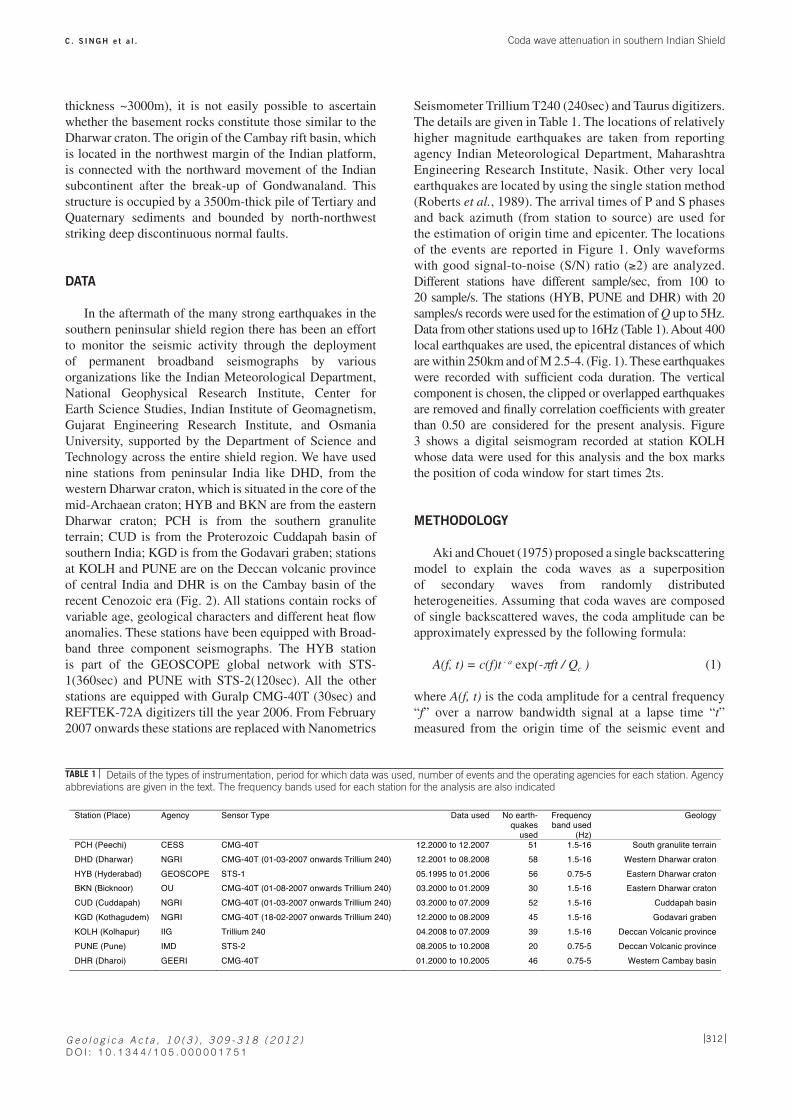
introduced the source receiver offset in a single scattering model so that the coda analysis begins after the arrival of the shear wave. The Qc-values were calculated using the SEISAN software package (Havskov and Ottemoller, 2003). The time envelope for the coda decay observation is taken at twice the time of S-wave (2ts) from the origin time of the event with fixed lapse time window length 70s. The coda of all the filtered seismograms from time t onwards are smoothed by using a root mean square (rms) technique which calculates the rms values of coda amplitude of the filtered seismograms with a sliding window of 5s length along the coda in steps of 2.5s and evaluates the value at each step in the same frequency band. Figure 4 shows the smoothed coda amplitude for the coda part of the filtered seismograms recorded at PUNE. The Qc is calculated at different frequency bands from the slope of the least-square fit straight line of the plot between ln[A(f, t)t ] and lapse time (t). Table 2 shows central frequency and bandwidth used for the estimation of QC. The calculated Qc-values at given central frequencies were accepted only when correlation coefficients (C) for the best-fit line for the coda decay slope with respect to lapse time were greater than 0.5 and the signal-to-noise ratio (S/N) was greater than 2 for a given data set. In Figure 5(A, B), Qc-values versus frequencies are plotted for the stations having 20 samples and 100 samples respectively. The power law in the form Qc = Q0 fn is fitted for the QC of each station, where Q0 is the QC-value at 1Hz and n is the frequency relation parameter.
RESULTS AND DISCUSSION
Variation of QC with frequency
The location of the earthquakes and recording stations covers different types of geologic provinces. Estimates of coda Qc for different frequencies are shown in Figure 5A, B. We have observed that in all cases Qc increases with increasing frequency. This seems to be a general
SP
Q=362; SN=670.75 Hz
Q=570; SN=1421 Hz
Q=1136; SN=242 Hz
Q=943; SN=273 Hz
Q=799; SN=531.5 Hz
Q=1183; SN=214 Hz
Q=1667; SN=195 Hz
An example of seismogram recorded at one of our stations (KOLH). P- and S-arrival times are shown with vertical arrows and coda window of 70s for tstart=2ts is shown with a box.
FIGURE 3
The top panel of the figure shows the vertical component seismogram from station PUNE. The first arrow on the left side of the top panel shows origin time and the other two arrows indicate the coda duration. The lower panels in each set of figures show filtered coda windows for 7 central frequencies at tstart=2ts. The number on the right-hand side within each panel represents central frequency in Hz. Tick marks on the x axes for all panels are at an interval of 30s. The y axis represents amplitude. In the lower nine panels amplitude scales are amplified with respect to that in the top panel to show the coda part more clearly. Abbreviations: Q–Qc, SN – signal to noise ratio.
FIGURE 4
C . S I N G H e t a l .
G e o l o g i c a A c t a , 1 0 ( 3 ) , 3 0 9 - 3 1 8 ( 2 0 1 2 )D O I : 1 0 . 1 3 4 4 / 1 0 5 . 0 0 0 0 0 1 7 5 1
Coda wave attenuation in southern Indian Shield
314
feature of frequency dependence of Qc (Aki, 1980). It depends on both degree of heterogeneity of a medium and level of tectonic activity in an area (Aki, 1980; Pulli and Aki, 1981; Roecker et al., 1982). Aki (1980) postulated from these observations that scattering of seismic waves mainly controls the frequency dependence of Qc. The low Qc values (high attenuation) for lower frequencies may indicate a high degree of heterogeneity and the decrease in rock strength in the crust whereas the high Qc values (low attenuation) at higher frequencies may be related to relatively more homogeneous deeper crustal layers. In the present study DHR and KGD show relatively low Qc for the lower frequency band (Fig. 5A, B) indicating existence of heterogeneities due to significant influence of underplating and compressional tectonism at Cambay basin (Reddy et al., 1999) and presence of a conjugate set of faults transverse to the Godavari Graben respectively. The high values at lower frequency ranges for CUD and KOLH indicate the crusts below both the stations are homogeneous. For frequencies above 8Hz the coda Q distribution is nearly uniform (Fig. 5B), indicating that the uniform distributions of smaller scale scatter over the study region (Jin and Aki, 2005).
Variations of Q0 and frequency parameter n at different geologic regime
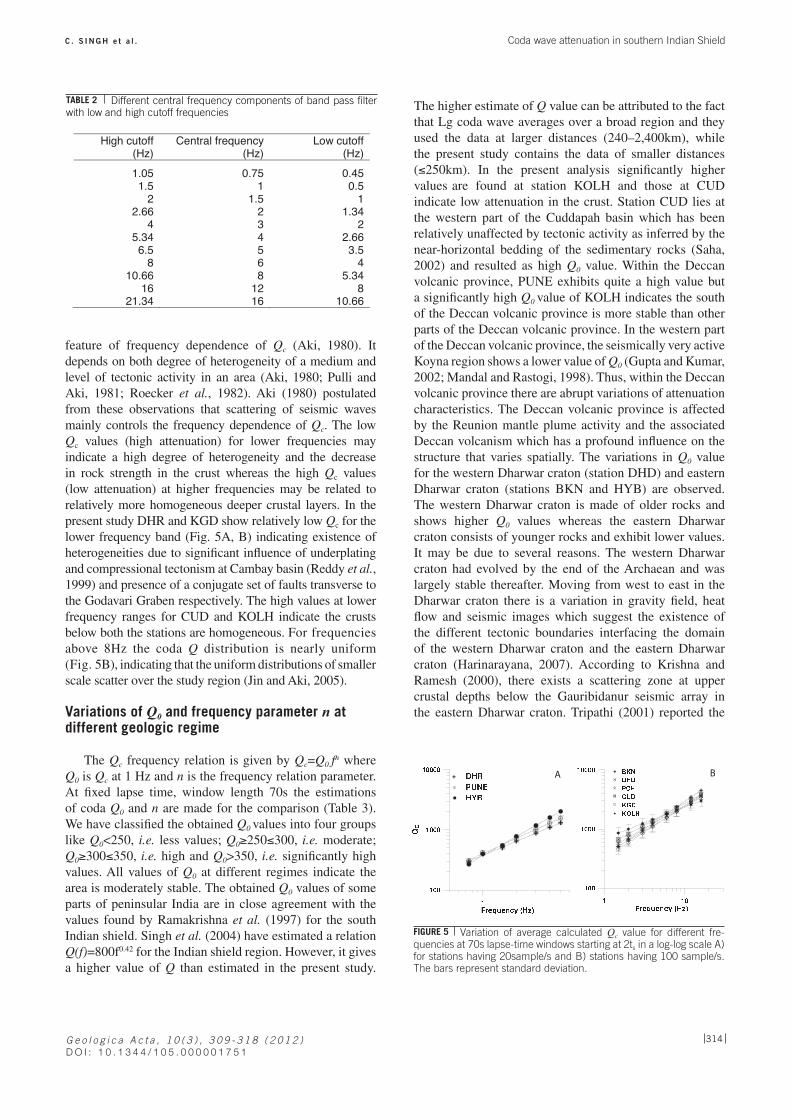
The Qc frequency relation is given by Qc=Q0 fn where Q0 is Qc at 1 Hz and n is the frequency relation parameter. At fixed lapse time, window length 70s the estimations of coda Q0 and n are made for the comparison (Table 3). We have classified the obtained Q0 values into four groups like Q0<250, i.e. less values; Q0≥250≤300, i.e. moderate; Q0≥300≤350, i.e. high and Q0>350, i.e. significantly high values. All values of Q0 at different regimes indicate the area is moderately stable. The obtained Q0 values of some parts of peninsular India are in close agreement with the values found by Ramakrishna et al. (1997) for the south Indian shield. Singh et al. (2004) have estimated a relation Q(f)=800f0.42 for the Indian shield region. However, it gives a higher value of Q than estimated in the present study.
The higher estimate of Q value can be attributed to the fact that Lg coda wave averages over a broad region and they used the data at larger distances (240–2,400km), while the present study contains the data of smaller distances (≤250km). In the present analysis significantly higher values are found at station KOLH and those at CUD indicate low attenuation in the crust. Station CUD lies at the western part of the Cuddapah basin which has been relatively unaffected by tectonic activity as inferred by the near-horizontal bedding of the sedimentary rocks (Saha, 2002) and resulted as high Q0 value. Within the Deccan volcanic province, PUNE exhibits quite a high value but a significantly high Q0 value of KOLH indicates the south of the Deccan volcanic province is more stable than other parts of the Deccan volcanic province. In the western part of the Deccan volcanic province, the seismically very active Koyna region shows a lower value of Q0 (Gupta and Kumar, 2002; Mandal and Rastogi, 1998). Thus, within the Deccan volcanic province there are abrupt variations of attenuation characteristics. The Deccan volcanic province is affected by the Reunion mantle plume activity and the associated Deccan volcanism which has a profound influence on the structure that varies spatially. The variations in Q0 value for the western Dharwar craton (station DHD) and eastern Dharwar craton (stations BKN and HYB) are observed. The western Dharwar craton is made of older rocks and shows higher Q0 values whereas the eastern Dharwar craton consists of younger rocks and exhibit lower values. It may be due to several reasons. The western Dharwar craton had evolved by the end of the Archaean and was largely stable thereafter. Moving from west to east in the Dharwar craton there is a variation in gravity field, heat flow and seismic images which suggest the existence of the different tectonic boundaries interfacing the domain of the western Dharwar craton and the eastern Dharwar craton (Harinarayana, 2007). According to Krishna and Ramesh (2000), there exists a scattering zone at upper crustal depths below the Gauribidanur seismic array in the eastern Dharwar craton. Tripathi (2001) reported the
2
Table 2
High cutoff (Hz)
Central frequency (Hz)
Low cutoff (Hz)
1.05 0.75 0.451.5 1 0.5
2 1.5 12.66 2 1.34
4 3 25.34 4 2.666.5 5 3.5
8 6 410.66 8 5.34
16 12 821.34 16 10.66
A B
Different central frequency components of band pass filter with low and high cutoff frequenciesTABLE 2
Variation of average calculated Qc value for different fre-quencies at 70s lapse-time windows starting at 2ts in a log-log scale A) for stations having 20sample/s and B) stations having 100 sample/s. The bars represent standard deviation.
FIGURE 5
G e o l o g i c a A c t a , 1 0 ( 3 ) , 3 0 9 - 3 1 8 ( 2 0 1 2 )D O I : 1 0 . 1 3 4 4 / 1 0 5 . 0 0 0 0 0 1 7 5 1
C . S I N G H e t a l . Coda wave attenuation in southern Indian Shield
315
presence of high heterogeneities beneath the Gauribidanur seismic array located at the western flank of the eastern Dharwar craton on the basis of differential attenuation at the array. Mohan and Rai (1992) suggested the presence of heterogeneities in the major geological contact between the eastern and western Dharwar cratons; this is prominent in the deeper crust and in the upper mantle. The station at the southern granulite terrain shows a moderate value of Q0.The low value of Q0 at the KGD suggests that the crustal part of the Godavari graben is heterogeneous. The Godavari graben represents a seismically active zone (Tandon and Srivastava, 1974), and in the northern side the faults associated with the Godavari graben show movement during the Holocene. The long and narrow Godavari rift oriented NW–SE, which forms the contact between the two major cratons, namely, Dharwar and Singhbhum cratons, is the source area that generated the April 13, 1969 earthquake (M 5.7) and its aftershock sequence (Gangrade and Arora, 2000). The Q0 value at the DHR can be explained in terms of its underplating and compressional tectonism (Reddy et al., 1999).
A strong correlation between the degree of frequency dependence (n value) and the level of tectonic activity was observed by several authors in different parts of the world (e.g., Aki, 1980; Pulli and Aki, 1981; Roecker et al., 1982; Van-Eck, 1988; Akinci et al., 1994). They ascertained that the n value is higher for tectonically active regions compared to the tectonically stable regions. In the present study, “n” ranges from 0.5 to 1.1. The lowest value of “n” at KOLH suggests that the crust is more stable.
Q and Temperature
The ongoing intraplate deformation and the presence of large scale inhomogeneity within the Indian shield are well reflected in the geothermal heat distribution. Several studies on heat flow for southern peninsular India have been
reported (Gupta et al., 1991; Agarwal and Pandey, 1999; Roy and Rao, 2000). Gao (1992) described that, if coda mainly reflects the intrinsic Q, it should be very sensitive to temperature and liquid content within the medium. Havskov et al. (1989) reported that coda Q at Mount St. Helens (volcanic region) is significantly lower than in the surrounding areas. The certain parts of peninsular India, Cambay basin and Godavari graben, which show higher heat flow, result in comparatively lower Q0 than other parts of the stable shield. Measurements carried out in the Cambay basin indicate high heat flow values (75-93mW/m2) with an average value of 83mW/m2 as compared to a normal heat flow value of approximately 46mW/m2 for stable continental areas (Thiagarajan et al., 2001). This interpretation is corroborated by the moderate value of Q0 at DHR. Heat flow is also found to be greater in the southern part of the Godavari graben where KGD is located (Roy and Rao, 2000). The Proterozoic Cuddapah basin, Dharwar craton and the Deccan volcanic province are characterized by low heat flow (Roy and Rao, 2000) that exhibit high Q0 values. Rao (2000) has found a correlation between the seismically active zones and high heat flow areas in peninsular India. The coda Q0 value obtained in the present study is comparable with the heat flow study in southern peninsular India.
Comparison of results with global observations
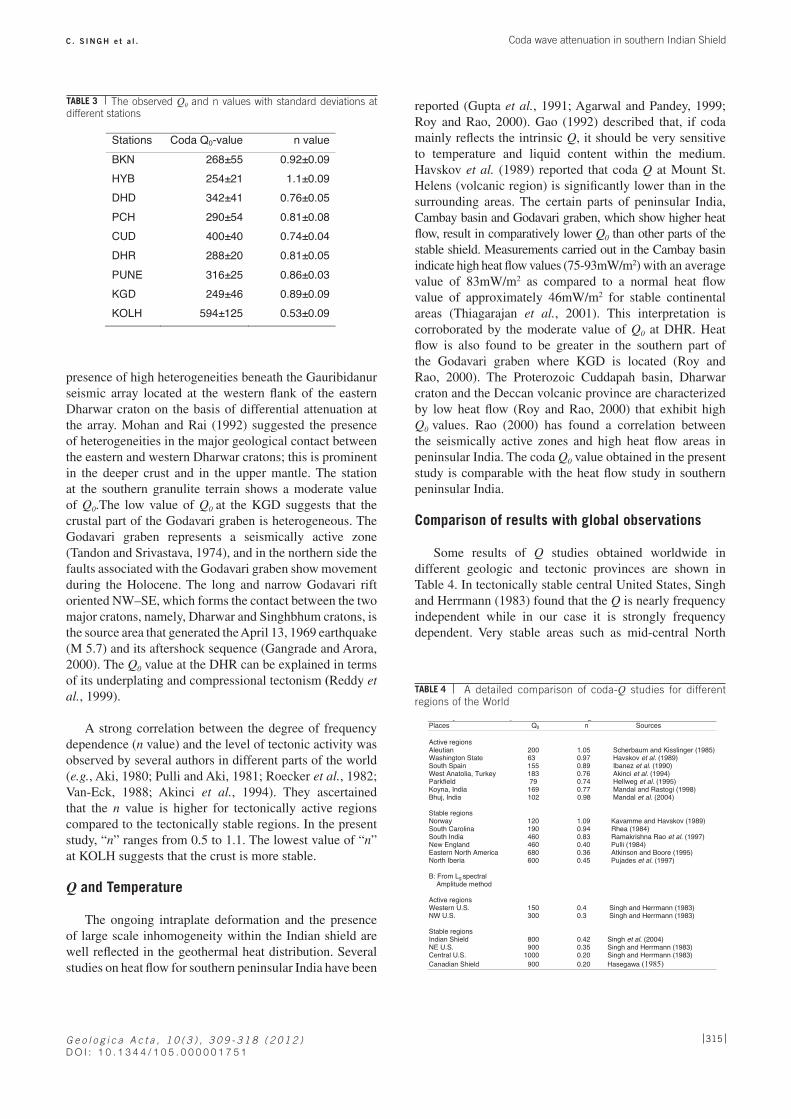
Some results of Q studies obtained worldwide in different geologic and tectonic provinces are shown in Table 4. In tectonically stable central United States, Singh and Herrmann (1983) found that the Q is nearly frequency independent while in our case it is strongly frequency dependent. Very stable areas such as mid-central North
3
Table 3
Stations Coda Q0-value n valueBKN 268±55 0.92±0.09HYB 254±21 1.1±0.09DHD 342±41 0.76±0.05PCH 290±54 0.81±0.08CUD 400±40 0.74±0.04DHR 288±20 0.81±0.05PUNE 316±25 0.86±0.03KGD 249±46 0.89±0.09KOLH 594±125 0.53±0.09
4
Table 4
A Comparison of coda-Q studies for different regions of the World Places Q0 n Sources
Active regions Aleutian 200 1.05 Scherbaum and Kisslinger (1985) Washington State 63 0.97 Havskov et al. (1989) South Spain 155 0.89 Ibanez et al. (1990) West Anatolia, Turkey 183 0.76 Akinci et al. (1994) Parkfield 79 0.74 Hellweg et al. (1995) Koyna, India 169 0.77 Mandal and Rastogi (1998) Bhuj, India 102 0.98 Mandal et al. (2004)
Stable regions Norway 120 1.09 Kavamme and Havskov (1989) South Carolina 190 0.94 Rhea (1984) South India 460 0.83 Ramakrishna Rao et al. (1997) New England 460 0.40 Pulli (1984) Eastern North America 680 0.36 Atkinson and Boore (1995) North Iberia 600 0.45 Pujades et al. (1997)
B: From Lg spectral Amplitude method
Active regions Western U.S. 150 0.4 Singh and Herrmann (1983) NW U.S. 300 0.3 Singh and Herrmann (1983)
Stable regions Indian Shield 800 0.42 Singh et al. (2004) NE U.S. 900 0.35 Singh and Herrmann (1983) Central U.S. 1000 0.20 Singh and Herrmann (1983) Canadian Shield 900 0.20 Hasegawa (1985)
The observed Q0 and n values with standard deviations at different stationsTABLE 3
A detailed comparison of coda-Q studies for different regions of the WorldTABLE 4

C . S I N G H e t a l .
G e o l o g i c a A c t a , 1 0 ( 3 ) , 3 0 9 - 3 1 8 ( 2 0 1 2 )D O I : 1 0 . 1 3 4 4 / 1 0 5 . 0 0 0 0 0 1 7 5 1
Coda wave attenuation in southern Indian Shield
316
America possess very high Q0 values (e.g.>600), while tectonically active regions like western US and Japan have relatively low Q0 values (e.g.<200). Intermediate Q0 values in the range of 200–600 are associated with areas of moderate seismicity (Mak et al., 2004). However, stable South Carolina and Norway have shown Q0 values of 190 and 120, respectively, which are identical to those for active regions (Rhea, 1984; Kvamme and Havskov, 1989). Singh et al. (1999) have found that the Q value of the Indian shield is similar to that of the tectonically similar region of eastern North America. The Q0 value in the present study is close to the values obtained by Ramakrishna Rao et al. (1997) for the south Indian peninsular shield. Although it is considerably lower than in other stable regions globally (Table 4), it is comparable to the intraplate regions with moderate seismicity, such as the rifted zone of the central Mississippi valley, which yielded a Q0 of 210 (Dwyer et al., 1984). Hence the Indian shield appears to be undergoing a large-scale rejuvenation and is more unstable than other shield areas worldwide. Rao (2000) has found the strain rate for the Indian shield as a whole is 6.01×10⁻¹⁰ per year, the second highest in SCR of the world, the highest being North America (6.80×10⁻¹⁰ per year) which also indicates that the Indian peninsular shield region is not very stable.
CONCLUSIONS
We calculated the coda Q0 values for the entire south India peninsular shield based on the single-scattering theory. Our study area includes varied complex tectonic provinces that had undergone breakup and reassembly of the eastern Gondwana supercontinent. To improve the resolution of Q0 for the entire southernmost part of India, we improved the resolution of Q0 by subdividing the area based on the regional geology. A dataset of ~400 digital records from local earthquakes is analyzed. The estimated Qc values show a systematic strong dependence on frequency range. The differences of Q0 values are due to differences of the attenuative properties of the mediums. The long and continued geodynamic process of the entire peninsular shield has a considerable impact on the variation in Q0 values. The relatively high value at the DHD infers low attenuation in the cratonic crust, which is expected since it has been stable for a longer time. The southern part of the Deccan volcanic province exhibits a significantly larger value of Q0 that reflects the differential level of crustal heterogeneities within the province. The low value at the KGD of the Godavari graben could be a manifestation of the ancient rifting. A good correlation between coda Q0 and heat flow across the entire peninsular shield is observed. The Q0 values in the present study are much lower than in other stable regions globally.
ACKNOWLEDGMENTS
The comments by two reviewers were very helpful in improving the paper. Prof Sagarika Mukhopadhyay is thanked for her suggestions. The authorities of the India Meteorological Department, Centre for Earth Science Studies, Indian Institute of Geomagnetism and Gujrat Engineering Research Institute are sincerely acknowledged for providing us the data. CS acknowledges the financial support provided by CSIR.
REFERENCES
Agrawal, P.K., Pandey, O.P., 1999. Relevance of hot underlying asthenosphere to the occurrence of Latur earthquake and Indian peninsular shield seismicity. Geodynamics, 28, 303-316.
Aki, K., 1980. Attenuation of shear waves in the lithosphere for frequencies from 0.05 to 25Hz. Physics of the Earth and Planetary Interiors, 21, 50-60.
Aki, K., 1969. Analysis of the seismic coda of local earthquakes as scattered waves. Journal of Geophysical Research, 74, 615-631.
Aki, K., 1985. Theory of earthquake prediction with special reference to monitoring of the quality factor of lithosphere by the coda method, Earthquake Prediction Research, 3, 219-230.
Aki, K., Chouet, B., 1975. Origin of the coda waves: source attenuation and scattering effects. Journal of Geophysical Research, 80, 3322-3342.
Aki, K., Richards, P.G., 1980. Quantitative seismology, theory and methods. San Francisco, W.H. Freeman and Company, 1, 556pp.
Akinci, A., Taktak, A.G ., Ergintav, S., 1994. Attenuation of coda waves in Western Anatolia. Physics of the Earth and Planetary Interiors, 87, 155-165.
Atkinson, G.M., Boore, D.M., 1995. Ground Motion Relations for Eastern North America. Bulletion of Seismological Society of America, 85, 17-30.
Bhaskar Rao, Y.J., Janardhan, A.S., Vijaya Kumar, T., Narayana, B.L., Dayal, A.M., Taylor, P.N., Chetty, T.R.K., 2003. Sm-Nd model ages and Rb-Sr isotopic systematics of charnockites and gneisses across the Cauvery Shear Zone, southern India: implications for the Archaean-Neoproterozoic terrane boundary in the Southern Granulite Terrain. In: Ramakrishnan, M. (ed.). Tectonics of Southern Granulite Terrain, Kuppam-Palani Geotransect. Geological Society of India, 50 (Memoir), 297-317.
Biescas, B., Rivera, Z., Zapata, J.A., 2007. Seismic attenuation of coda waves in the eastern region of Cuba. Tectonophysics, 429, 99-109.
Canas, J.A., Pujades, L., Badal, J., Payo, G., Demiguel, F., Vidal, F., Alguacil, G., Ibáñez, J., Morales, J., 1991. Lateral variation and frequency depedence of coda-Q in the southern part of Iberia. Geophysical Journal International, 107, 57-66.
Dwyer, D.J., Herrmann, R.B., Nuttli, O.W., 1984. Use of a digital seismic network to study Lg attenuation and the coda Q in the Central Mississippi Valley. Earthquake Notes, 55(3), 7-8.

G e o l o g i c a A c t a , 1 0 ( 3 ) , 3 0 9 - 3 1 8 ( 2 0 1 2 )D O I : 1 0 . 1 3 4 4 / 1 0 5 . 0 0 0 0 0 1 7 5 1
C . S I N G H e t a l . Coda wave attenuation in southern Indian Shield
317
Frankel, A., Wennerberg, L., 1987. Energy flux model of seismic coda: speration of scattering and intrinsic attenuation. Bulletin of the Seismological Society of America, 77, 1223-1251.
Gangrade, B.K., Arora, S.K., 2000. Seismicity of the Indian peninsular shield from regional earthquake data. Pure and Applied Geophysics, 157, 1683-1705.
Gao, L.S., Biswas, N.N., Lee, L.C., Aki, K., 1983. Effect on multiple scattering on coda waves in three dimensional medium. Pure and Applied Geophysics, 121, 3-15.
Gao, L.S., 1992. Physical meaning of the coda envelopes, in Volcanic Seismology. Gasparini, P., Scarpa, R., Aki, K. (eds.). I.A.V.C.E.I. Proceedings in Volcanology. New York, Springer-Verlag, 3, 391-403.
Gupta, M.L., Sharma, S.R., Sundar, A., 1991. Heat flow and heat generation in the Archaean Dharwar cratons and implications for the southern Indian shield geotherm and lithospheric thickness. Tectonophysics, 194, 107-122.
Gupta, S.C., Kumar, A., 2002. Seismic wave attenuation characteristics of three Indian regions: A comparative study. Current Science, 82, 407-413.
Halls, H.C., Kumar, A., Srinivasan, R., Hamilton, M.A., 2007. Paleomagnetism and U-Pb geochronology of easterly trending dykes in the Dharwar craton, India: feldspar clouding, radiating dyke swarms and the position of India at 2.37Ga. Precambrian Research, 155, 47-68.
Harinarayana, T., 2007. Comparison of Electrical Structure of the Deep Crust of the Central Indian Shear Zone, Narmada-Son Lineament, Deccan Traps, Southern Granulite Region and Eastern Dharwar Craton. Gondwana Research, 10, 251-261.
Hasegawa, H.S., 1985. Attenuation of Lg waves in the Canadian Shield. Bulletin of the Seismological Society of America, 75, 1569-1582.
Havskov, J., Malone, S., McClurg, D., Crosson, R., 1989. Coda Q for the state of Washington. Bulletin of the Seismological Society of America, 79, 1024-1038.
Havskov, J., Ottemoller, L., 2003. SEISAN: the earthquake analysis software for Windows, Solaris, Linux, and Mac OSX Version 8.0, 244pp.
Hellweg, M., Spudich, P., Fletcher. J.B., Baker, L.M., 1995. Stability of coda Q in the region of Parkfield, California: the view from the USGS Parkfield dense seismograph array. Journal of Geophysical Research, 100, 2089-2102.
Ibáñez, J.M., Pezzo, E. D., De Miguel, F., Herriaz, M., Alguacie, G., Morales, J., 1990. Depth dependent seismic attenuation in the Granada zone (Southern Spain). Bulletin of the Seismological Society of America, 80, 1232-1244.
Jin, A., Aki, K., 2005. High-resolution maps of coda Q in Japan and their interpretation by the brittle-ductile interaction hypothesis. Earth Planets Space, 57, 403-409.
Jin, A., Aki, K., 1989. Spatial and temporal correlation between coda Q-1 and seismicity and its physical mechanism. Journal of Geophysical Research, 94, 14041-14059.
Jin, A., Aki, K., 1988. Spatial and temporal correlation between coda Q and seismicity in China. Bulletin of the Seismological Society of America, 78, 741-769.
Krishna, V.G., Ramesh, D.S., 2000. Propagation of crustal-waveguide-trapped Pg and seismic velocity structure in south Indian shield. Bulletin of the Seismological Society of America, 90, 1281-1294.
Kvamme, L.B., Havskov, J., 1989. Q in southern Norway. Bulletin of the Seismological Society of America, 79, 1575-1588.
Mak, S., Chan, L.S., Chandler, A.M., Koo, R.C.H., 2004. Coda Q estimates in the Hong Kong Region. Journal of Asian Earth Science, 24, 127-136.
Mandal, P., Rastogi, B.K., 1998. A frequency-dependent relation of coda Qc for Koyna-Warna region India. Pure and Applied Geophysics, 153, 163-177.
Mandal, P., Jainendra., Joshi, S., Kumar, S., Bhunia, R., Rastogi, B.K., 2004. Low coda QC in the Epicentral Region of the 2001 Bhuj Earthquake of Mw 7.7. Pure and Applied Geophysics, 161, 1635-1654.
Mohan, G., Rai, S. S., 1992. Imaging of seismic scatterers beneath the Gauribidanur (GBA) array. Physics of the Earth and Planetary Interiors, 71, 36-45.
Naqvi, S.M., Divakara Rao, V., Narain, H., 1974. The Protocontinental growth of the Indian Shield and antiquity of its rift valleys. Precambrian Research, 1, 345-395.
Phillips, W.S., Lee, W.H.K., Newberry, J.T., 1988. Spatial variation of crustal coda Q in California. Pure and Applied Geophysics, 128, 251-260.
Pujades, L., Canas, J.A., Egozcue, J.J., Puigvi, M.A., Pous, J., Gallart, J., Lana, X., Casas, A., 1991. Coda Q distribution in the Iberian Peninsula. Geophysical Journal International, 100, 285-301.
Pulli, J.J., Aki, K., 1981. Attenuation of seismic waves in the lithosphere: comparison of active and stable areas. In: Beavers, J.E. (ed.). Earthquakes and Earthquake Engineering: The Eastern United States. Michigan, Ann Arbor Science Publishers Inc., Ann Arbor, 129-141.
Pulli, J.J., 1984. Attenuation of coda waves in New England. Bulletin of the Seismological Society of America, 74, 1149-1166.
Qureshy, M.N., Krishna Brahmam, N., Garde, S.C., Mathur, B.K., 1968. Gravity Anomalies and the Godavari Rift, India. Bulletin of the Seismological Society of America, 79, 1221-1230.
Radhakrishna, B.P., 1993. Neogene uplift and geomorphic rejuvenation of Indian peninsula. Current Science, 64, 787-793.
Radhakrishna, B.P., Naqvi, S.M., 1986. Precambrian continental crust of India and its evolution. Journal of Geology, 94, 145-166.
Ramakrishna Rao, C.V., Seshamma, N.V., Mandal, P., 1997. Estimation of coda-QC and spectral characteristics of some moderate earthquakes of Southern Indian Peninsula. Unpublished report.
Rao, B.R., 2000. Historical seismicity deformation rates in the Indian Peninsular Shield. Journal of Seismology, 4, 247-258.
Rautian, T.G., Khalturin, V.I., 1978. The use of the coda for the determination H.N of the earthquake source spectrum. Bulletin of the Seismological Society of America, 68, 923-948.
Ravi Shanker, 1995. Fragmented Indian shield and recent earthquakes. Geology Survey India, 27, 41-48.
Reddy, P.R., Venkateswarlu, N., Koteswara Rao, P., Prasad,

C . S I N G H e t a l .
G e o l o g i c a A c t a , 1 0 ( 3 ) , 3 0 9 - 3 1 8 ( 2 0 1 2 )D O I : 1 0 . 1 3 4 4 / 1 0 5 . 0 0 0 0 0 1 7 5 1
Coda wave attenuation in southern Indian Shield
318
A.S.S.S.R.S., 1999. Crustal structure of Peninsular Shield, India from DSS studies. Current Science, 77, 1606-1611.
Rhea, S., 1984. Q determined from local earthquakes in the South Carolina Coastal Plain. Bulletin of the Seismological Society of America, 74, 2257-2268.
Roberts, R.G., Christofferson, A., Cassidy, F., 1989. Real-time event detection, phase identification and source location estimation using single station three- component seismic data. Geophysical Journal, 97, 471-480.
Roecker, S.W., Tucker, B., King, J., Hatzfield, D., 1982. Estimates of Q in Central Asia as a function of frequency and depth using the coda of locally recorded earthquakes. Bulletin of the Seismological Society of America, 72, 129-149.
Roy, S., Rao, R.U.M., 2000. Heat flow in the Indian shield. Journal of Geophysical Research, 105, 25.587-25.604.
Saha, D., 2002. Multi-Stage Deformation in the Nallamalai Fold Belt, Cuddapah Basin, South India–Implications for Mesoproterozoic Tectonism Along Southeastern Margin of India. Gondwana Research, 5, 701-719.
Sarangi, S., Gopalan, K., Srinivasan, R., 2007. Small scale sampling for Pb-Pb dating of marbles: example from the Sargur supracrustal rocks, Dharwar Craton, South India. Precambrian Research, 152, 83-91.
Sarker, G., Abers, G.A., 1998. Comparison of seismic body wave and coda wave measures of Q. Pure and Applied Geophysics, 153, 665-683.
Sarker, G., Abers, G.A., 1999. Lithospheric temperature estimates from seismic attenuation across range fronts in southern and central Eurasia. Geology, 27, 427-430.
Sato, H., 1977. Energy propagation including scattering effects: single isotropic scattering. Journal of Physics of the Earth, 25, 27-41.
Singh, S.K., Herrmann, R.B., 1983. Regionalization of crustal coda Q in the continental United States. Journal of Geophysical Research, 88,527-538.
Singh, S.K., Ordaz, M., Dattatrayam, R.S., Gupta, H.K., 1999.
A Spectral Analysis of the May 21, 1997, Jabalpur, India Earthquake (Mw=5.8) and Estimation of Ground Motion from Future Earthquakes in the Indian Shield Region. Bulletin of the Seismological Society of America, 89, 1620-1630.
Singh, S.K., Garcia, D., Pacheco, J.F., Valenzuela, R., Bansal, B.K., Dattatrayam, R.S., 2004. Q of the Indian Shield. Bulletin of the Seismological Society of America, 94, 1564-1570.
Swami Nath, J., Ramakrishnan, M., 1981. Early Precambrian Supracrustals of Southern Karnataka. Geological Survey of India, 112 (Memoir), 351pp.
Tandon, A.N., Srivastava, H.N., 1974. Earthquake occu-rrence in India. Earthquake Engineering-Jai Krishna Commemoration Volume, Meerut. India, Sarita Prakashan, Chapter 1, 1-48.
Thiagarajan, S., Ramana, D.V., Rai, S.N., 2001. Seismically constrained two-dimensional crustal thermal structure of the Cambay basin. Proceedings of the Indian Academy of Sciences, 110, 1-8.
Tripathi, J.N., 2001. Small-scale structure of lithosphere-asthenosphere beneath Gauribidanur Seismic array deduced from amplitude and phase fluctuations. Journal of Geodynamics, 31, 411-428.
Valdiya, K.S., 1993. Latur earthquake of 30 September 1993: Implications and planning for Hazard preparedness. Current Science, 65, 515-517.
Van-Eck, T., 1988. Attenuation of coda waves in the Dead Sea region. Bulletin of the Seismological Society of America, 82, 770-779.
Wu, R.S., 1985. Multiple scattering and energy transfer of seismic waves-separation of scattering effect from intrinsic attenuation-I. Theoretical modeling. Geophysical Journal of the Royal Astronomical Society, 82, 57-80.
Zelt, B.C., Dotzev, N.T., Ellis, R.M., Roger, G.C., 1999. Coda Q in southwestern British Columbia, Canada. Bulletin of the Seismological Society of America, 89, 1083-1093.
Manuscript received April 2010;revision accepted December 2010;published Online December 2011.