Embed Size (px)
Citation preview
1015
© 2016 American Society of Mammalogists, www.mammalogy.org
Spatial variation in giraffe demography: a test of 2 paradigms
Derek e. Lee,* Monica L. BonD, BernarD M. kissui, Yustina a. kiwango, anD DougLas t. BoLger
Department of Biological Sciences, Dartmouth College, Hanover, NH 03755, USA (DEL)Wild Nature Institute, P.O. Box 165, Hanover, NH 03755, USA (MLB)Tarangire Lion Project, School for Field Studies, P.O. Box 304, Karatu, Tanzania (BMK)Tanzania National Parks, P.O. Box 3134, Arusha, Tanzania (YAK)Environmental Studies Program, Dartmouth College, Hanover, NH 03755, USA (DTB)
* Correspondent: [email protected]
Examination of spatial variation in demography among or within populations of the same species is a topic of growing interest in ecology. We examined whether spatial variation in demography of a tropical megaherbivore followed the “temporal paradigm” or the “adult survival paradigm” of ungulate population dynamics formulated from temperate-zone studies. We quantified spatial variation in demographic rates for giraffes (Giraffa camelopardalis) at regional and continental scales. Regionally, we used photographic capture-mark-recapture data from 860 adult females and 449 calves to estimate adult female survival, calf survival, and reproduction at 5 sites in the Tarangire ecosystem of Tanzania. We examined potential mechanisms for spatial variation in regional demographic rates. At the continental scale, we synthesized demographic estimates from published studies across the range of the species. We created matrix population models for all sites at both scales and used prospective and retrospective analyses to determine which vital rate was most important to variation in population growth rate. Spatial variability of demographic parameters at the continental scale was in agreement with the temporal paradigm of low variability in adult survival and more highly variable reproduction and calf survival. In contrast, at the regional scale, adult female survival had higher spatial variation, in agreement with the adult survival paradigm. At both scales, variation in adult female survival made the greatest contribution to variation in local population growth rates. Our work documented contrasting patterns of spatial variation in demographic rates of giraffes at 2 spatial scales, but at both scales, we found the same vital rate was most important. We also found anthropogenic impacts on adult females are the most likely mechanism of regional population trajectories.
Key words: conservation biology, demography, LTRE, population biology, population structure, prospective matrix analysis, retrospective matrix analysis, tropical ecology, ungulate demography, vital rates
Natural populations inevitably exhibit variation in demographic parameters, and whereas examination of temporal variation has long been a central theme in population ecology (Clutton-Brock et al. 1988; Newton 1989), spatial variation among or within populations of the same species has received much less attention (Frederiksen et al. 2005). Survival, reproduction, and other demographic traits of a species may vary markedly among populations and subpopulations inhabiting heteroge-neous environments (e.g., Paradis et al. 2000; Frederiksen et al. 2005; Grosbois et al. 2009), but this variation has not been well documented for ungulates, particularly in tropical zones.
In long-lived animals, elasticities from population models show that changes in adult female survival typically result in the greatest proportional changes in population growth rate,
relative to changes in other vital rates (e.g., Lebreton and Clobert 1990; Gaillard et al. 1998, 2000; Saether and Bakke 2000). However, several long-term studies of ungulate spe-cies from temperate zones have found that because temporal variation in adult survival is low, variation in reproduction and calf survival are typically the most important determinants of observed temporal variation in population growth rates (Eberhardt 1977, 2002; Gaillard et al. 2000). We refer to this as the “temporal paradigm” of ungulate demography, i.e., stable and high adult female survival with highly variable reproduc-tion and calf survival rates that drive variation in population growth. In contrast to the temporal paradigm, Nilsen et al. (2009) and Johnson et al. (2010) examined spatial variation in demography of 2 declining populations of temperate-zone
Journal of Mammalogy, 97(4):1015–1025, 2016DOI:10.1093/jmammal/gyw086Published online May 11, 2016
by guest on October 10, 2016
http://jmam
mal.oxfordjournals.org/
Dow
nloaded from
1016 JOURNAL OF MAMMALOGY
ungulates and found variation in population growth rate was mostly driven by low and variable adult survival. We refer to this as the “adult survival paradigm” of ungulate demography.
In this study, we examined whether the temporal paradigm or the adult survival paradigm of ungulate population dynamics can be applied to spatial variation in population dynamics for the largest-bodied ungulate, the giraffe (Giraffa cameloparda-lis). Specifically, we investigated the patterns and mechanisms of spatial demographic structure in giraffes at regional and continental scales. Giraffes are megaherbivores, like elephants (Loxodonta africana) and rhinoceroses (e.g., Diceros bicornis), and megaherbivores can illuminate patterns described by stud-ies of smaller-bodied animals by providing an extreme allome-tric endpoint for comparison and contrast (Owen-Smith 1992). At the regional scale, we quantified whether reproduction, calf survival, and adult survival probabilities varied among 5 sites in the Tarangire region of northern Tanzania, East Africa, using individually based data from the subspecies Masai giraffe (G. c. tippelskirchi). We sought mechanisms of regional spa-tial variation in demographic parameters by examining cor-relations between giraffe vital rates and spatial covariates of land management, giraffe density, lion predation pressure, and illegal killing (poaching). At the continental scale, we summa-rized variability in demographic rates using all published val-ues from across the range of the species. To determine which demographic parameter was most important to spatial variation in regional population growth, we created matrix population models and used prospective matrix analysis and retrospective life table response experiment (LTRE) methods (Caswell 2001) to compute elasticities and decompose spatial differences in population growth rates (λ) into contributions from site-specific mean vital rates and correlations between vital rates.
If the temporal paradigm best explained spatial variation in giraffe population dynamics, then we expected to see greater variability in reproduction and juvenile survival relative to adult female survival, and we expected variation in reproduc-tion and juvenile survival to have the greatest effect on varia-tion in λ. If the adult survival paradigm prevailed, we expected variation in adult female survival would have the greatest effect on variation in λ.
Materials and Methods
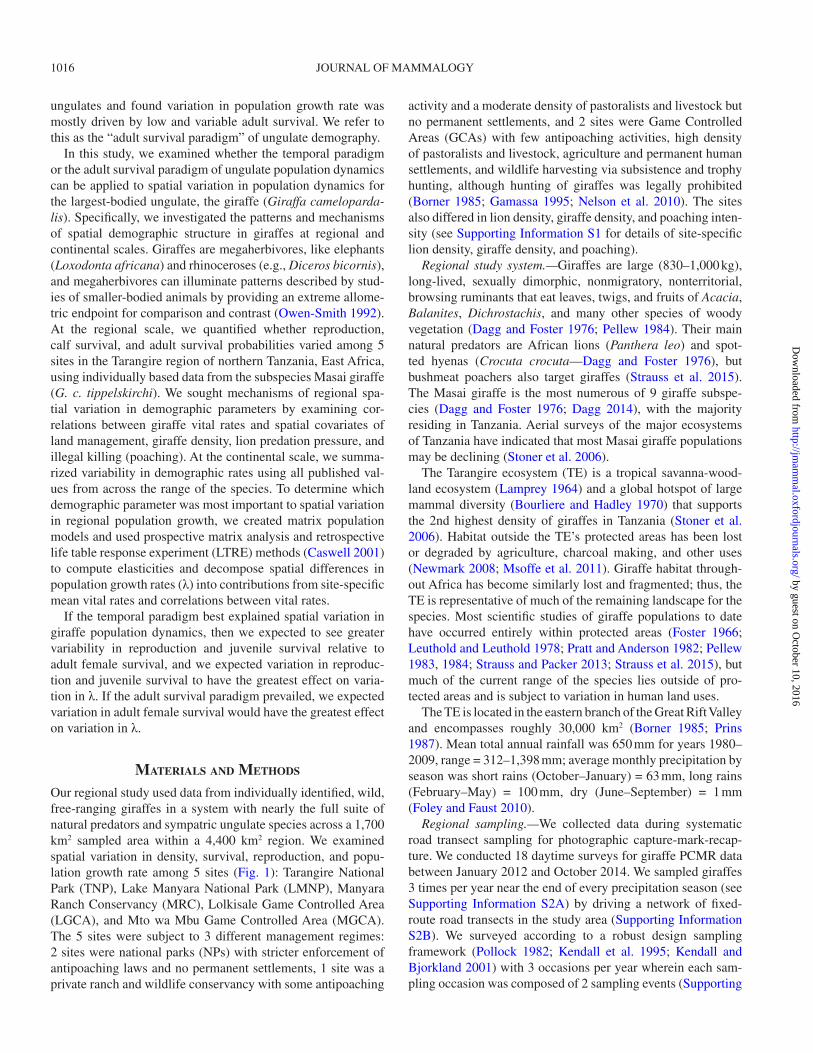
Our regional study used data from individually identified, wild, free-ranging giraffes in a system with nearly the full suite of natural predators and sympatric ungulate species across a 1,700 km2 sampled area within a 4,400 km2 region. We examined spatial variation in density, survival, reproduction, and popu-lation growth rate among 5 sites (Fig. 1): Tarangire National Park (TNP), Lake Manyara National Park (LMNP), Manyara Ranch Conservancy (MRC), Lolkisale Game Controlled Area (LGCA), and Mto wa Mbu Game Controlled Area (MGCA). The 5 sites were subject to 3 different management regimes: 2 sites were national parks (NPs) with stricter enforcement of antipoaching laws and no permanent settlements, 1 site was a private ranch and wildlife conservancy with some antipoaching
activity and a moderate density of pastoralists and livestock but no permanent settlements, and 2 sites were Game Controlled Areas (GCAs) with few antipoaching activities, high density of pastoralists and livestock, agriculture and permanent human settlements, and wildlife harvesting via subsistence and trophy hunting, although hunting of giraffes was legally prohibited (Borner 1985; Gamassa 1995; Nelson et al. 2010). The sites also differed in lion density, giraffe density, and poaching inten-sity (see Supporting Information S1 for details of site-specific lion density, giraffe density, and poaching).
Regional study system.—Giraffes are large (830–1,000 kg), long-lived, sexually dimorphic, nonmigratory, nonterritorial, browsing ruminants that eat leaves, twigs, and fruits of Acacia, Balanites, Dichrostachis, and many other species of woody vegetation (Dagg and Foster 1976; Pellew 1984). Their main natural predators are African lions (Panthera leo) and spot-ted hyenas (Crocuta crocuta—Dagg and Foster 1976), but bushmeat poachers also target giraffes (Strauss et al. 2015). The Masai giraffe is the most numerous of 9 giraffe subspe-cies (Dagg and Foster 1976; Dagg 2014), with the majority residing in Tanzania. Aerial surveys of the major ecosystems of Tanzania have indicated that most Masai giraffe populations may be declining (Stoner et al. 2006).
The Tarangire ecosystem (TE) is a tropical savanna-wood-land ecosystem (Lamprey 1964) and a global hotspot of large mammal diversity (Bourliere and Hadley 1970) that supports the 2nd highest density of giraffes in Tanzania (Stoner et al. 2006). Habitat outside the TE’s protected areas has been lost or degraded by agriculture, charcoal making, and other uses (Newmark 2008; Msoffe et al. 2011). Giraffe habitat through-out Africa has become similarly lost and fragmented; thus, the TE is representative of much of the remaining landscape for the species. Most scientific studies of giraffe populations to date have occurred entirely within protected areas (Foster 1966; Leuthold and Leuthold 1978; Pratt and Anderson 1982; Pellew 1983, 1984; Strauss and Packer 2013; Strauss et al. 2015), but much of the current range of the species lies outside of pro-tected areas and is subject to variation in human land uses.
The TE is located in the eastern branch of the Great Rift Valley and encompasses roughly 30,000 km2 (Borner 1985; Prins 1987). Mean total annual rainfall was 650 mm for years 1980–2009, range = 312–1,398 mm; average monthly precipitation by season was short rains (October–January) = 63 mm, long rains (February–May) = 100 mm, dry (June–September) = 1 mm (Foley and Faust 2010).
Regional sampling.—We collected data during systematic road transect sampling for photographic capture-mark-recap-ture. We conducted 18 daytime surveys for giraffe PCMR data between January 2012 and October 2014. We sampled giraffes 3 times per year near the end of every precipitation season (see Supporting Information S2A) by driving a network of fixed-route road transects in the study area (Supporting Information S2B). We surveyed according to a robust design sampling framework (Pollock 1982; Kendall et al. 1995; Kendall and Bjorkland 2001) with 3 occasions per year wherein each sam-pling occasion was composed of 2 sampling events (Supporting
by guest on October 10, 2016
http://jmam
mal.oxfordjournals.org/
Dow
nloaded from
LEE ET AL.—GIRAFFE SPATIAL DEMOGRAPHY 1017
Information S3) during which we surveyed all road transects in the study area (3 occasions per year × 2 events per occasion × 3 years = 18 survey events). Road density throughout the study area was high (Supporting Information S2B) relative to giraffe home-range size (~90 km2 mean female home range—Foster and Dagg 1972; Berry 1978; Leuthold and Leuthold 1978; Pellew 1984; Le Pendu and Ciofolo 1999; Fennessy 2009). Survey teams maintained a driving speed between 15 and 20 km/h on all transects, and all teams included the same 2 dedi-cated observers and a driver. We sampled each road segment only 1 time in a given event. We systematically shifted the order and direction in which we sampled sites and road transects sim-ilar to a Latin Square design to reduce sampling biases.
During PCMR sampling events, we sampled the entire study area. When we encountered a giraffe, we either “marked” or “recaptured” the animal by slowly approaching and photograph-ing the right side (Canon 40D and Rebel T2i cameras with Canon
Ultrasonic IS 100–400 mm lens; Canon U.S.A., Inc., Melville, New York). We later identified individual giraffe using unique and unchanging coat patterns (Foster 1966). We attempted to photograph every giraffe encountered for individual identification from a distance of approximately 100 m ( X = 90 ± 39 m), and we recorded sex (male, female), GPS location (Garmin eTrex Venture Cx; Garmin International, Olathe, Kansas), and age class. We categorized giraffe into 4 age classes: newborn calf (0–3 months old), older calf (4–11 months old), subadult (1–3 years old), or adult (> 3 years for females, > 6 years for males) using a suite of physical characteristics, including body shape, relative length of the neck and legs, ossicone characteristics (Strauss 2014), and height measured with photogrammetry (Supporting Information S4). This research followed American Society of Mammalogists guidelines for live animals (Sikes et al. 2011).
Regional encounter histories and survival estimation.—We matched giraffe identification images using WildID
Fig. 1.—Study area in the Tarangire ecosystem of northern Tanzania. Thick gray lines delineate the 5 sites sampled. Shaded areas are areas domi-nated by agriculture, and thin lines are roads and tracks.
by guest on October 10, 2016
http://jmam
mal.oxfordjournals.org/
Dow
nloaded from
1018 JOURNAL OF MAMMALOGY
(http://software.dartmouth.edu/Macintosh/Academic/Wild-ID_1.0.0.zip), a computer program that matched a large test data set of giraffe images collected using our protocols with a low false rejection rate (0.007) and 0.0 false acceptance rate (Bolger et al. 2012). Based on matching results, we created individual encounter histories for analysis in program MARK 7.1 (White and Burnham 1999). We assigned all individuals to 1 of the 5 sites for the entire study according to where the majority of encounters occurred. When no majority was pres-ent, we assigned the animal to the 1st observed location. Here, we focused on reproduction, adult female survival, and calf survival, as these were the main parameters of interest. We esti-mated an age-specific survival curve that included subadult age classes using a subset of 500 known-age females, and we used that age curve to interpolate subadult survival rates between local calf and adult survival values for each site (Supporting Information S5). Males will be considered in detail elsewhere.
We modeled and estimated our main parameters of interest using Pollock’s (1982) robust design statistical models (sub-script i = occasion, j = event; see Supporting Information S3). For each site, we estimated reproduction (see “Calculating reproduction” below), adult female population sizes (N
i), adult
female and calf survival probabilities (Si), as well as nuisance
parameters of capture probabilities (pj), recapture probabilities
(cj), and temporary emigration parameters ( ¢¢γ i , the probabil-
ity of being out of the survey area; and ¢γ i , the probability of remaining out of the survey area).
We tested goodness-of-fit of encounter histories to a gen-eral model using U-CARE (Choquet et al. 2009) and adjusted for lack of fit by adjusting c = χ2/d.f. (Choquet et al. 2009). Throughout model ranking and selection procedures, we ranked models using qAICc and used model qAICc Weights (W) as a metric for strength of evidence supporting a given model as the best description of the data (Burnham and Anderson 2002). During survival model selection, we began with the most fully parameterized model in our set with constraints (site effects) on the main parameters of interest and with both temporal and site effects in capture (p
j), recapture (c
j), and temporary emi-
gration ( ¢¢γ i and ¢γ i ) rates. We first ranked competing models with reduced temporal complexity of temporary emigration, then detectability parameters. Once we obtained the most parsimonious form of temporary emigration and detectability parameters, we ranked all models of survival, including spatial covariate models, a constant or null model, and a site-specific model. We used the variance components procedure in MARK to decompose spatial process variance and sampling variance, estimate spatial process variance of survival, and obtain robust estimates of mean survival probabilities.
Calculating reproduction.—We computed a site-specific index of seasonal reproduction as the ratio of newborn calves (aged 0–3 months) over the site-specific N of adult females. The proportion of females seen with a calf often has been used as a proxy for birth rate (e.g., Fryxell 1987; Eberhardt et al. 1996; Laurian et al. 2000). However, this method is biased unless spatial and temporal variation in the probability of detection is accounted for, along with survival from birth to observation
(Nichols 1992; McCorquodale 2001; Bonenfant et al. 2005). Therefore, we corrected calf counts for detectability by divid-ing the count by site- and season-specific capture probabilities. We corrected the calf count for survival from birth to observa-tion by dividing by the square root of site- and season-specific survival estimates for the 1st interval after birth. Assuming a constant rate of reproduction during the interval between sur-veys, we can approximate the survival of all calves born during the interval before a given survey by treating all calves as being born in the exact middle of the interval; thus, their survival rate from the midpoint of the interval to the survey would be the square root of the estimated full seasonal interval survival rate, or Si . Therefore, corrected count raw count= p Sj i .
We ranked models of reproduction using generalized linear models with a binomial error structure and logit link function in program R (R Core Development Team 2013). Corrected count of neonates in each season–site combination was the number of successes, and number of adult females in each site was the number of trials. We used AICc as our metric of model rank and AICc Weights (W) as strength of evidence for a given model in the set. To compare reproduction among sites, we used the mean seasonal reproduction index across all occasions. We decomposed process and sampling variance, estimated spatial process variance of reproduction, and obtained robust estimates of mean reproduction by comparing the intercept-only means model with the site-specific model (Searle et al. 1992; Franklin et al. 2000).
Covariates.—We developed a priori hypotheses about factors that might explain spatial variation in giraffe survival and repro-duction, and we devised a set of spatial covariate models based on the hypotheses. Covariate models examine whether a sig-nificant correlation exists between spatial variation in survival or reproduction and spatial variation in the covariate (e.g., lion density, antipoaching). Details of covariate models are given in Supporting Information S6. In addition to the 3 basic models of site-specific parameters (denoted: site), constant parameters across all sites (constant), and parameter variation according to management authority with 3 levels (management), we also constructed 4 spatial covariate models that might explain the observed spatial patterns in survival and reproduction: lion predation (lion density), giraffe density (giraffe density), and 2 indices of illegal hunting (antipoaching and distance to Mto wa Mbu). Mto wa Mbu is the main bushmeat market town. We con-sidered covariates of survival to be statistically significant if the 85% confidence interval (CI) of the beta coefficient excluded 0 (Arnold 2010). We considered covariates of reproduction to be significant if their slopes were significantly different from 0 at α = 0.05.
Matrix population models.—We constructed a female-based, age-structured, matrix population model for each regional and continental site (Caswell 2001). The matrix population model has 5 ages, 1-year time steps, and birth flow reproduction (Supporting Information S5B). We parameterized each regional site matrix population model with fecundity and survival rate estimates from data (Fig. 2; Supporting Information S7), and we parameterized continental sites with estimates from data or rates
by guest on October 10, 2016
http://jmam
mal.oxfordjournals.org/
Dow
nloaded from
LEE ET AL.—GIRAFFE SPATIAL DEMOGRAPHY 1019
from the published literature (Fig. 3; Supporting Information S8). Annual calf survival from birth to age class 2 (S1) and adult female survival (S
A) were computed from site-specific seasonal
survival rates. We calculated subadult survival rates (S2–4) by increasing survival each year based on an age-specific survival curve (Supporting Information S5C) until it was equal to local adult survival (S
A). We calculated fecundity (F) as annual esti-
mates of calves/adult female ( / ) .c AF ´ ´ ´S SA 1 0 5 (to represent birth flow reproduction and included only female calves, assuming equal offspring sex ratio—Caswell 2001).
Spatial variation.—We quantified spatial variability in demographic parameters among sites at both scales using the coefficient of process variation (CV = SD/mean) of site-specific demographic rates. We considered spatial variation in estimates of regional demographic parameters to be significant if the site model had a lower qAICc score than the constant model and if a likelihood ratio test (LRT) comparing those 2 models was significant (α = 0.05).
To examine spatial variation at the continental scale, we syn-thesized published estimates of adult survival, calf survival, and reproduction. Because previous work on giraffe demog-raphy was conducted entirely within protected areas, we also calculated regional spatial variability for the subset of our sites with strong wildlife protection activities (NPs and MRC).
Prospective matrix analysis.—We calculated the asymptotic population growth rate (λ) as the dominant eigenvalue of each matrix model (Caswell 2001). We calculated elasticities to quantify the change in λ resulting from a proportional change in a matrix cell while holding other cells constant (Caswell 2001). As a mean-standardized measure of sensitivity, elastici-ties allow comparison of the relative effect on λ of variation in different matrix components (Caswell 2001). The values of λ from our matrix population models are likely biased lower than the true population growth rates because our apparent survival
rates are biased low, but they serve our purpose of determining the most influential vital rates (Caswell 2001).
To assess effects of demographic variation and covariation on estimated elasticities, we calculated integrated elasticities (Reid et al. 2004). Integrated elasticities (IEs) quantify the total effect of variability in a specific demographic rate on λ, includ-ing both direct effects and indirect effects via covariation with other rates (van Tienderen 1995). For a demographic rate x, IEx xy y y xy
r e CV CV=∑ / . In this equation, rxy
is the correla-tion between rates x and y, and e
y and CV
y are the standard
elasticity and coefficient of variation of y, respectively, and CVx
is the coefficient of variation of x (van Tienderen 1995; Saether and Bakke 2000). Elasticities identify the demographic rates to which λ is most sensitive, but the contribution of each rate to variation in λ also depends on the extent to which the rate varies. To estimate the actual contribution of each demographic rate to population change, we multiplied the integrated elastic-ity of the rate by its coefficient of variation to give a variance-standardized elasticity (IE
xCV
x—van Tienderen 1995). The total
variance in λ can be estimated as: Var IE( )λ =∑ x xxCV2 2
(Horvitz et al. 1997; Gaillard et al. 2000; Caswell 2001). We therefore estimated the proportional contribution of each rate x to total variation in λ as: IE Varx xCV2 2 / ( )λ (Horvitz et al. 1997; Gaillard et al. 2000). We performed all matrix calcula-tions in R using the popbio package (R Core Development Team 2013).
Life table response experiment.—Because the vital rate to which life histories are the most sensitive (as indicated by a prospective analysis) is not necessarily the one that has con-tributed most to the observed variability in population dynam-ics, identification of those factors that have contributed most to variation in the dynamics of the population requires a retro-spective approach (Horvitz et al. 1997; Caswell 2000; Cooch et al. 2001; Angert 2006). One approach for partitioning varia-tion in growth rates is the LTRE (Horvitz et al. 1997; Caswell 2000), which relies on the fact that if projected population growth rate is measured as a deviation from a reference value, then variation in projected growth rate can be decomposed into contributions from each of the vital rates.
We used a single-classification fixed-design LTRE (Caswell 2001) to measure the contribution of each vital rate to devia-tions in λ between the matrix model for each site and a refer-ence matrix. We constructed 2 reference matrices, 1 for regional and 1 for continental sites, where each matrix was composed of the average transition probabilities of all sites in a given spatial scale (Caswell 2001). We performed all LTRE calculations in R using the popbio package (R Core Development Team 2013).
results
We analyzed encounter histories for 860 adult female giraffe and 449 calves from the TE. We found evidence for lack of fit in adult female (χ2
63 = 358, P < 0.001) and calf (χ262 = 97,
P = 0.006) encounter history data. Goodness-of-fit tests are designed to detect departures from model assumptions for independence among individuals and independence between
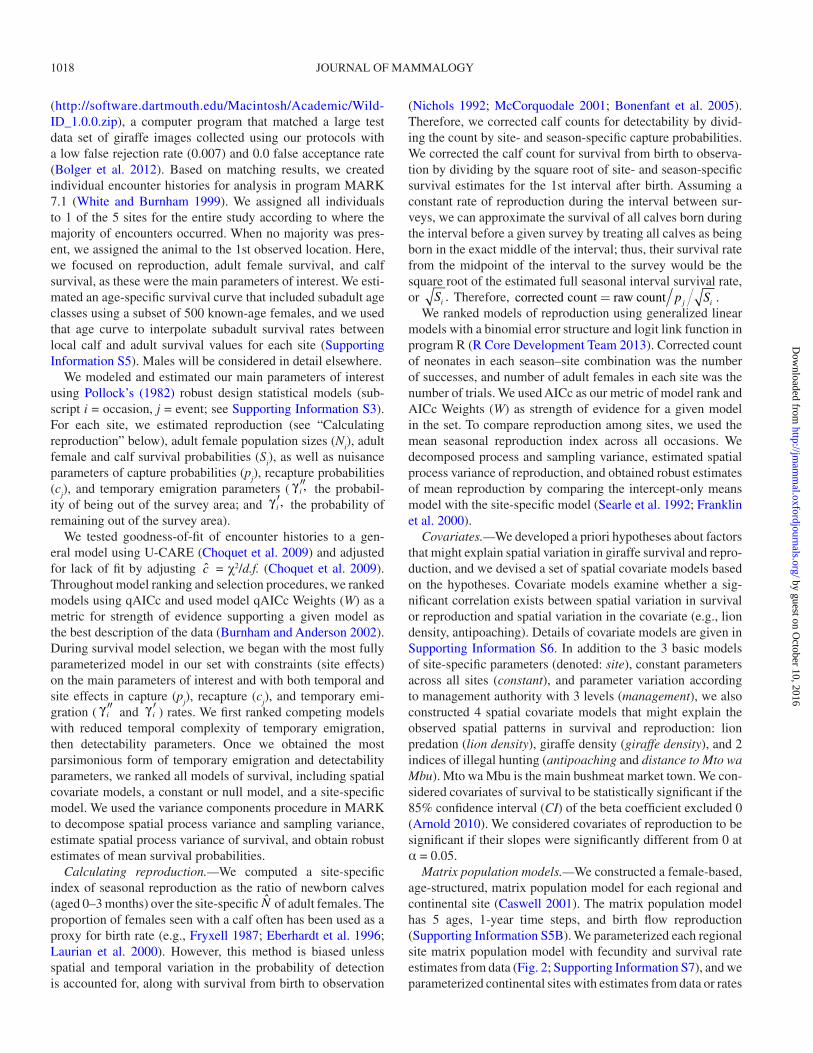
Fig. 2.—Mean (± 1 SE) site-specific adult female annual survival probability, calf 1st-year survival probability, and annual reproduc-tion index (calves/adult female) at 5 sites in the Tarangire ecosystem, 2012–2014. Only adult female survival and reproduction differed sig-nificantly among sites. Sites are LGCA = Lolkisale Game Controlled Area; LMNP = Lake Manyara National Park; MRC = Manyara Ranch Conservancy; MGCA = Mto wa Mbu Game Controlled Area; TNP = Tarangire National Park.
by guest on October 10, 2016
http://jmam
mal.oxfordjournals.org/
Dow
nloaded from
1020 JOURNAL OF MAMMALOGY
successive encounters of every individual. The lack of fit we observed is typical of large data sets where individual differ-ences inherent in any animal population are inevitably detected (Choquet et al. 2005). To make the model selection process more conservative, we applied ˆ,c a variance inflation fac-tor, which increases variances but has no effect on parameter estimates. We adjusted adult female c = 2.0 and calf c = 1.5. Results are reported as mean ± 1 SE unless otherwise noted.
We documented significant among-site spatial varia-tion in adult female survival (LRT χ2
4 = 11.08, P = 0.03; Table 1; Fig. 2) and reproduction (LRT χ2
4 = 18.8, P = 0.001; Table 2; Fig. 2). Calf survival did not vary sig-nificantly among sites (LRT χ2
4 = 6.45, P = 0.17; Supporting
Information S9). Mean vital rate values across all regional sites (robust estimates of spatial process variation) were adult female annual survival = 0.842 ± 0.022; calf survival to age 1 year = 0.479 ± 0.040; and reproduction (calves/adult female/year) = 0.320 ± 0.030.
Spatial variability of site-specific demographic rates across all sites in our regional study area was similar for adult female survival (CV = 0.20), calf survival (CV = 0.23), and reproduc-tion (CV = 0.22). When regional spatial variability was calcu-lated only using estimates from the 2 NPs and MRC, variability in adult female survival was much lower (CV = 0.04), whereas variability in calf survival (CV = 0.30) and variability in repro-duction (CV = 0.27) were slightly higher.
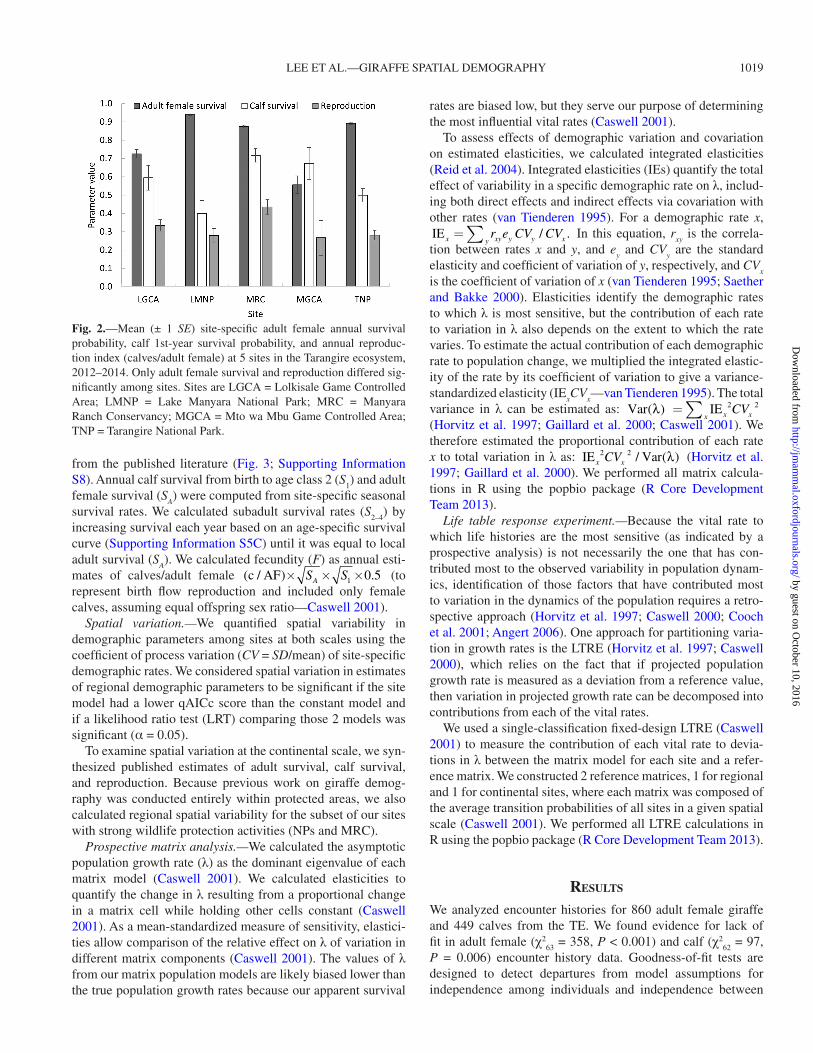
Fig. 3.—Summary of existing demographic estimates (± 1 SE) for giraffes (Giraffa camelopardalis) in national parks across the range of the spe-cies; data from this study are at far right. a) Adult female annual survival probability. b) Calf survival probability to age 1 year. c) Reproduction as number of calves per adult female per year. Locations are KNP = Kruger National Park, South Africa; WNP = Waza National Park, Cameroon; NNP = Nairobi National Park, Kenya; TENP = Tsavo East National Park, Kenya; SNP = Serengeti National Park, Tanzania; TNP = Tarangire National Park, Tanzania (see Supporting Information S8 for more details).
by guest on October 10, 2016
http://jmam
mal.oxfordjournals.org/
Dow
nloaded from
LEE ET AL.—GIRAFFE SPATIAL DEMOGRAPHY 1021
At the continental scale, estimates of adult survival, calf sur-vival, and reproduction rates from the scientific literature were available from NPs across Africa, spanning most of the range of the species (Supporting Information S8; Fig. 3). Adult female survival rates from protected areas across the range of giraffe were similar (0.90 ± 0.03 SD, CV = 0.03), but there was large range-wide variability in estimates of calf survival to age 1 year (0.43 ± 0.10 SD, CV = 0.23) and reproduction (0.31 ± 0.10 SD, CV = 0.32).
Elasticities for regional matrix population models indicated adult survival (S
A) was by far the highest elasticity parameter
in each site (Supporting Information S7), and this pattern was repeated in continental sites, where mean elasticity of S
A was
0.86, and elasticity for S1 and F were both 0.03. No vital rates were significantly correlated with each other among sites at either the regional or continental scales, but we still used IE to account for covariation among vital rates.
Prospective matrix analysis revealed the proportional contri-bution of vital rates to total variation in λ at the regional scale was greatest for adult female survival (0.990), relative to calf survival (0.002) and fecundity (0.008). At the continental scale, prospective analysis found a similar contribution of vital rates
to total variation in λ: adult female survival (0.999), relative to calf survival (0.001) and fecundity (0.0004).
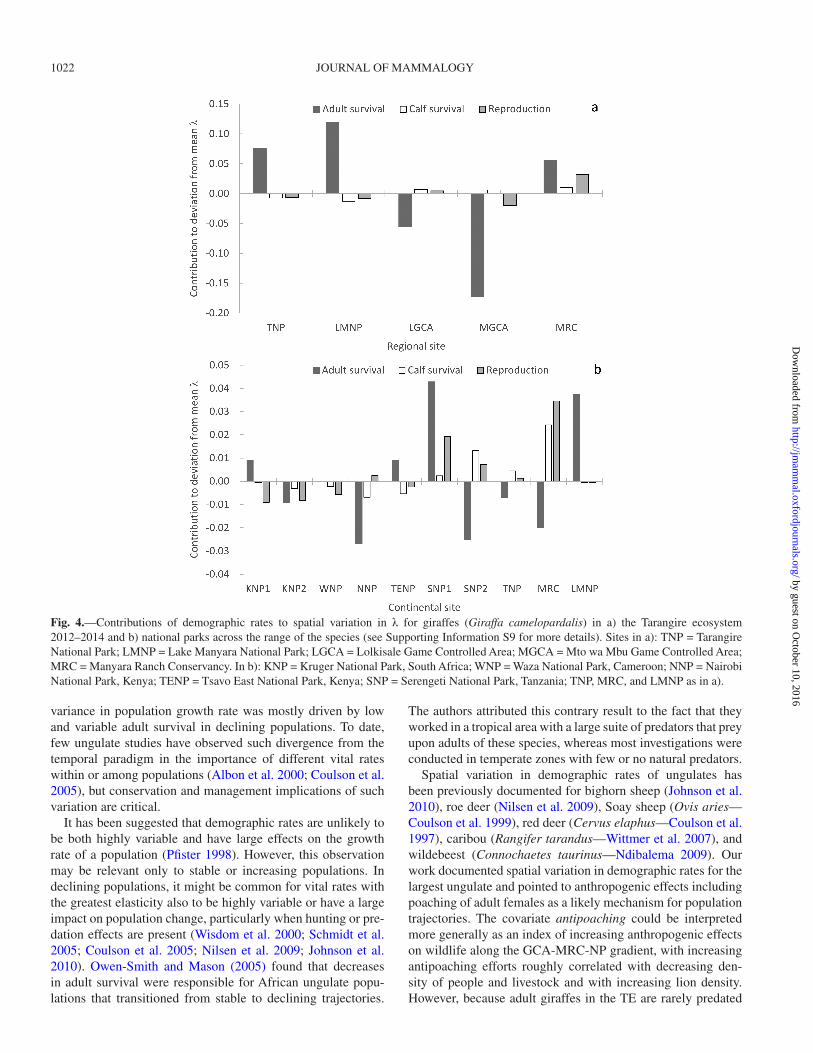
Retrospective LTRE analyses found site-specific varia-tion in adult female survival made the greatest contribution to spatial variation in λ at both scales (Fig. 4). However, at the continental scale, reproduction and calf survival made contri-butions to changes in λ nearly as large as adult survival (Fig. 4). Proportional contributions of vital rates to total variation in λ from LTRE at the regional scale were adult female survival (0.81), calf survival (0.07), and fecundity (0.12) and at the con-tinental scale were adult female survival (0.55), calf survival (0.19), and fecundity (0.27).
Covariate models indicated that regional variation in adult female survival was significantly positively correlated with anti-poaching efforts (β
antipoaching = 0.131, 85% CI = 0.063–0.200).
Two other covariate models also had competitive rankings (Table 1) and were significant. Calf survival was significantly negatively correlated with the lion predation pressure covariate model (β
lion predation pressure = 0.052, 85% CI = −0.103 to −0.002).
The reproduction covariate model related to land management indicated MRC had significantly greater reproduction relative to other sites (βMRC = 0.28, z = 2.13, P = 0.03; Table 2).
discussion
Spatial variation in demography and the temporal paradigm.—Results from the TE region supported the adult sur-vival paradigm. Adult female survival was highly spatially vari-able, and site-specific variation in adult female survival made the greatest contribution to spatial variation in λ. At the conti-nental scale, spatial variation of demographic estimates from protected areas appeared to follow the temporal paradigm of low variability in adult survival and higher variability in repro-duction and calf survival. However, at the continental scale as at the regional scale, the highest proportion of the variation in λ was explained by variation in adult female survival.
Adult female survival is typically the highest elasticity parameter in ungulate population growth models from stud-ies in temperate zones, and our matrix population models for a tropical megaherbivore, the giraffe, were no different. The dominant paradigm for temperate-zone ungulate population dynamics over time holds that although adult female survival has the highest elasticity, juvenile survival or reproduction is the primary determinant of realized population change due to a trade-off between reproductive effort and survival in long-lived organisms (Gaillard et al. 1998, 2000; Gaillard and Yoccoz 2003). Adults maintain high survival by varying reproductive effort according to environmental conditions and their own physiological status (Gaillard et al. 1998, 2000; Gaillard and Yoccoz 2003; Raithel et al. 2007).
In contrast, Johnson et al. (2010) showed that in 4 of 6 local populations of bighorn sheep (Ovis canadensis sierra) in the western United States, adult survival explained the high-est proportion of variation in population growth. Likewise, Nilsen et al. (2009) examined 8 local populations of roe deer (Capreolus capreolus) in Norway and France and found
Table 1.—Selection results for spatial covariate models of apparent survival of adult female giraffes (Giraffa camelopardalis) in 5 sites in the Tarangire ecosystem, Tanzania, 2012–2014. ΔqAICc is the differ-ence in qAICc values between a model and the top-ranked model. W is model qAICc Weight, a metric for strength of evidence supporting a given model as the best description of the data. K is the number of parameters in a model. Antipoaching, Lion Density, and Management were all statistically significant covariates. Model structure for all models was {S(apparent survival model)g′ = g″(site*t) p(site*t) c(site*t) N(site*t)}.
Apparent survival model ΔqAICc W K
Antipoaching 0 0.32 222Lion density 0.06 0.31 222Management 0.25 0.28 223Giraffe density 3.81 0.05 222Distance to Mto wa Mbu 5.17 0.08 222Site 5.36 0.02 225Constant 7.57 0.01 221
Table 2.—Selection results for spatial covariate models of seasonal giraffe (Giraffa camelopardalis) reproduction (calves/adult female/year) in 5 sites in the Tarangire ecosystem, Tanzania, 2012–2014. ΔAICc is the difference in AICc values between a model and the top-ranked model. W is model AICc Weight, a metric for strength of evi-dence supporting a given model as the best description of the data. K is the number of parameters in a model.
Reproduction model ΔAICc W K
Management 0 0.81 3Site 2.9 0.19 5Giraffe density 13.5 0.00 2Antipoaching 18.7 0.00 2Distance to Mto wa Mbu 19.4 0.00 2Lion density 22.8 0.00 2Constant 23.8 0.00 1
by guest on October 10, 2016
http://jmam
mal.oxfordjournals.org/
Dow
nloaded from
1022 JOURNAL OF MAMMALOGY
variance in population growth rate was mostly driven by low and variable adult survival in declining populations. To date, few ungulate studies have observed such divergence from the temporal paradigm in the importance of different vital rates within or among populations (Albon et al. 2000; Coulson et al. 2005), but conservation and management implications of such variation are critical.
It has been suggested that demographic rates are unlikely to be both highly variable and have large effects on the growth rate of a population (Pfister 1998). However, this observation may be relevant only to stable or increasing populations. In declining populations, it might be common for vital rates with the greatest elasticity also to be highly variable or have a large impact on population change, particularly when hunting or pre-dation effects are present (Wisdom et al. 2000; Schmidt et al. 2005; Coulson et al. 2005; Nilsen et al. 2009; Johnson et al. 2010). Owen-Smith and Mason (2005) found that decreases in adult survival were responsible for African ungulate popu-lations that transitioned from stable to declining trajectories.
The authors attributed this contrary result to the fact that they worked in a tropical area with a large suite of predators that prey upon adults of these species, whereas most investigations were conducted in temperate zones with few or no natural predators.
Spatial variation in demographic rates of ungulates has been previously documented for bighorn sheep (Johnson et al. 2010), roe deer (Nilsen et al. 2009), Soay sheep (Ovis aries—Coulson et al. 1999), red deer (Cervus elaphus—Coulson et al. 1997), caribou (Rangifer tarandus—Wittmer et al. 2007), and wildebeest (Connochaetes taurinus—Ndibalema 2009). Our work documented spatial variation in demographic rates for the largest ungulate and pointed to anthropogenic effects including poaching of adult females as a likely mechanism for population trajectories. The covariate antipoaching could be interpreted more generally as an index of increasing anthropogenic effects on wildlife along the GCA-MRC-NP gradient, with increasing antipoaching efforts roughly correlated with decreasing den-sity of people and livestock and with increasing lion density. However, because adult giraffes in the TE are rarely predated
Fig. 4.—Contributions of demographic rates to spatial variation in λ for giraffes (Giraffa camelopardalis) in a) the Tarangire ecosystem 2012–2014 and b) national parks across the range of the species (see Supporting Information S9 for more details). Sites in a): TNP = Tarangire National Park; LMNP = Lake Manyara National Park; LGCA = Lolkisale Game Controlled Area; MGCA = Mto wa Mbu Game Controlled Area; MRC = Manyara Ranch Conservancy. In b): KNP = Kruger National Park, South Africa; WNP = Waza National Park, Cameroon; NNP = Nairobi National Park, Kenya; TENP = Tsavo East National Park, Kenya; SNP = Serengeti National Park, Tanzania; TNP, MRC, and LMNP as in a).
by guest on October 10, 2016
http://jmam
mal.oxfordjournals.org/
Dow
nloaded from
LEE ET AL.—GIRAFFE SPATIAL DEMOGRAPHY 1023
naturally, we attribute most of this effect to poaching. An alter-native interpretation could be a fatal disease transmitted from livestock (Daszak et al. 2000), but because livestock densities are similar in MRC and GCAs, we would expect more simi-larity between these types of site if livestock disease were an important factor.
The covariate model of lion predation pressure best explained regional spatial variation in calf survival, and management best explained regional variation in reproduction. Both factors are likely related to natural predation by lions. Because lion preda-tion effects would be difficult to alter across this landscape, and because adult female survival was identified as the having the greatest impact on λ from both prospective and retrospective analyses, there may not be much room to affect giraffe popula-tion trajectories via reproduction or calf survival rates.
Demographic comparisons across the range of the species.—Estimates of adult female survival in the TE were much more variable across subpopulations than estimates from protected areas across the range of the giraffe in Africa. However, when we excluded GCAs from our regional study and computed variabil-ity only across local protected areas, the CV of survival became similar to the range-wide value. Estimates from across the range of giraffes were available only from protected areas, so inclu-sion of nonprotected GCAs could make the resultant regional spatial CV values incomparable to values from protected areas. However, our regional estimates likely reflected more realistic conditions faced by most giraffes, as much of their remaining habitat lies outside protected areas, where anthropogenic factors such as poaching and habitat alteration are prevalent. Local and range-wide spatial variability in other regions with increasing habitat fragmentation and human populations actually may be as high as we calculated when we included nonprotected areas, because giraffe outside protected areas likely experienced a wider spectrum of environmental and anthropogenic factors that inevitably affected demographic rates.
We documented significant regional spatial variation in giraffe demographic parameters of adult female survival and reproduc-tion. Site-specific point estimates of calf survival varied among regional sites but not significantly so due to lower precision of those estimates. Anthropogenic impacts that include poaching or livestock-related disease are the most likely proximate causes of regional variation in adult female survival. Adult female sur-vival was by far the most important driver of variation in popu-lation growth rate. Thus, the population management actions with highest expected effectiveness would be those aimed at increasing adult female survival, such as expanding antipoach-ing patrols outside NPs, and continuing efforts to disrupt bush-meat distribution networks and markets. Disease transmission from livestock to giraffe also should be investigated.
acknowledgMents
This research was carried out with permission from the Tanzania Commission for Science and Technology (COSTECH), Tanzania National Parks (TANAPA), the Tanzania Wildlife Research Institute (TAWIRI), African Wildlife Foundation,
Manyara Ranch Conservancy, and the villages of Selela, Lolkisale, and Emboret, under COSTECH permits 2011-106-NA-90-172, 2012-175-ER-90-172, and 2013-103-ER-90-172. All applicable institutional and national guidelines for the care and use of animals were followed. We are extremely grate-ful to these organizations for the opportunity to conduct this research, especially J. Keyyu, V. Kakenge, A. Mwakatobe, and K. Oola at TAWIRI; F. Olekashe at Manyara Ranch Conservancy; J. Salehe at African Wildlife Foundation; and I. Lejora, D. Njau, and S. Quolli from TANAPA. Financial support for this work was provided by Dartmouth College Graduate Studies, Fulbright U.S. Scholar Program, Sacramento Zoo, Safari West, Cleveland Metroparks Zoo and the Cleveland Zoological Society, Columbus Zoo, Cincinnati Zoo, Dartmouth College Cramer Fund, and the Explorer’s Club.
supporting inforMation
The Supporting Information documents are linked to this manuscript and are available at Journal of Mammalogy online (jmammal.oxfordjournals.org). The materials consist of data provided by the author that are published to benefit the reader. The posted materials are not copyedited. The contents of all supporting data are the sole responsibility of the authors. Questions or messages regarding errors should be addressed to the author.Supporting Information S1.—Spatial covariates describing differences among 5 subpopulations of giraffes in Tarangire ecosystem, 2012–2014.Supporting Information S2.—A. Sampling schedule relative to monthly precipitation. B. Road transects.Supporting Information S3.—Diagram of Pollock’s Robust Design and associated parameters during 1 calendar year.Supporting Information S4.—Assigning age classes with photogrammetry.Supporting Information S5.—A. Life cycle graph of female giraffes. B. Matrix population model. C. Age-specific survival curve.Supporting Information S6.—Detailed methods for regional covariates.Supporting Information S7.—Vital rates used in matrix pop-ulation models for female giraffes.Supporting Information S8.—Summary of existing studies that estimated demographic rates for giraffes.Supporting Information S9.—Selection results for spatial covariate models of apparent survival of giraffe calves.
literature cited
aLBon, S. D., T. N. couLson, D. Brown, F. E. guinness, J. M. PeMBerton, anD T. H. cLutton-Brock. 2000. Temporal changes in key factors and key age groups influencing the popu-lation dynamics of female red deer. Journal of Animal Ecology 69:1099–1110.
angert, A. L. 2006. Demography of central and marginal populations of monkeyflowers (Mimulus cardinalis and M. lewisii). Ecology 87:2014–2025.
by guest on October 10, 2016
http://jmam
mal.oxfordjournals.org/
Dow
nloaded from
1024 JOURNAL OF MAMMALOGY
arnoLD, T. W. 2010. Uninformative parameters and model selec-tion using Akaike’s Information Criterion. Journal of Wildlife Management 74:1175–1178.
BerrY, P. S. 1978. Range movements of giraffe in the Luangwa Valley, Zambia. East African Wildlife Journal 16:77–83.
BoLger, D. T., T. A. Morrison, B. Vance, D. E. Lee, anD H. FariD. 2012. A computer-assisted system for photographic mark–recap-ture analysis. Methods in Ecology and Evolution 3:812–822.
BonenFant, C., J.-M. gaiLLarD, F. kLein, anD J. L. HaMann. 2005. Can we use the young:female ratio to infer ungulate population dynamics? An empirical test using red deer (Cervus elaphus) as a model. Journal of Applied Ecology 42:361–370.
Borner, M. 1985. The increasing isolation of Tarangire National Park. Oryx 19:91–96.
BourLiere, F., anD M. HaDLeY. 1970. The ecology of tropical savan-nas. Annual Review of Ecology and Systematics 1:125–152.
BurnHaM, K. P., anD D. R. anDerson. 2002. Model selection and mul-timodel inference: a practical information-theoretical approach. Springer-Verlag, New York.
casweLL, H. 2000. Prospective and retrospective perturbation analy-ses: their roles in conservation biology. Ecology 81:619–627.
casweLL, H. 2001. Matrix population models: construction, analy-sis and interpretation. 2nd ed. Sinauer Associates, Sunderland, Massachusetts.
cHoquet, R., J.-D. LeBreton, O. giMenez, A.-M. reBouLet, anD R. PraDeL. 2009. U-CARE: utilities for performing goodness of fit tests and manipulating CApture–REcapture data. Ecography 32:1071–1074.
cHoquet, R., A.-M. reBouLet, J.-D. LeBreton, O. giMenez, anD R. PraDeL. 2005. U_CARE user’s manual. CEFE, Montpelier, France.
cLutton-Brock, T. H., S. D. aLBon, anD F. E. guinness. 1988. Reproductive success in male and female red deer. Pp. 325–343 in Reproductive success: studies of individual variation in contrasting breeding systems (T. H. Clutton-Brock, ed.). Chicago University Press, Chicago, Illinois.
coocH, E., R. F. rockweLL, anD S. BrauLt. 2001. Retrospective anal-ysis of demographic responses to environmental change: a lesser snow goose example. Ecological Monographs 71:377–400.
couLson, T., S. D. aLBon, F. E. guinness, J. PeMBerton, anD T. H. cLutton-Brock. 1997. Population substructure, local density, and calf winter survival in red deer. Ecology 78:852–863.
couLson, T., S. D. aLBon, J. PiLkington, anD T. H. cLutton-Brock. 1999. Small-scale spatial dynamics in a fluctuating ungulate popu-lation. Journal of Animal Ecology 68:658–671.
couLson, T., J.-M. gaiLLarD, anD M. Festa-BiancHet. 2005. Decomposing the variation in population growth into contribu-tions from multiple demographic rates. Journal of Animal Ecology 74:789–801.
Dagg, A. I. 2014. Giraffe biology, behavior and conservation. Cambridge University Press, New York.
Dagg, A. I., anD J. B. Foster. 1976. The giraffe: its biology, behavior, and ecology. Van Nostrand Reinhold, New York.
Daszak, P., A. A. cunningHaM, anD A. D. HYatt. 2000. Emerging infectious diseases of wildlife—threats to biodiversity and human health. Science 287:443–449.
eBerHarDt, L. L. 1977. Optimal policies for conservation of large mammals with special reference to marine ecosystems. Environmental Conservation 4:205–212.
eBerHarDt, L. L. 2002. A paradigm for population analysis of long-lived vertebrates. Ecology 83:2841–2854.
eBerHarDt, L. E., L. L. eBerHarDt, B. L. tiLLer, anD L. L. caDweLL. 1996. Growth of an isolated elk population. Journal of Wildlife Management 60:369–373.
FennessY, J. 2009. Home range and seasonal movements of Giraffa camelopardalis angolensis in the Northern Namib Desert. African Journal of Ecology 47:318–327.
FoLeY, C. A. H., anD L. J. Faust. 2010. Rapid population growth in an elephant Loxodonta africana population recovering from poaching in Tarangire National Park, Tanzania. Oryx 44:205–212.
Foster, J. B. 1966. The giraffe of Nairobi National Park: home range, sex ratios, the herd, and food. East African Wildlife Journal 4:139–148.
Foster, J. B., anD A. I. Dagg. 1972. Notes on the biology of giraffe. East African Wildlife Journal 10:1–16.
FrankLin, A. B., D. R. anDerson, R. J. guiterrez, anD K. P. BurnHaM. 2000. Climate, habitat quality, and fitness in Northern Spotted Owl populations in north-western California. Ecological Monographs 70:539–590.
FreDeriksen, M., M. P. Harris, anD S. wanLess. 2005. Inter-population variation in demographic parameters: a neglected sub-ject? Oikos 111:209–214.
FrYxeLL, J. M. 1987. Seasonal reproduction of white-eared kob in Boma National Park, Sudan. African Journal of Ecology 25:117–124.
gaiLLarD, J. M., M. Festa-BiancHet, anD N.G. Yoccoz. 1998. Population dynamics of large herbivores: variable recruitment with constant adult survival. Trends in Ecology & Evolution 13:58–63.
gaiLLarD, J. M., M. Festa-BiancHet, N. G. Yoccoz, A. Loison, anD C. toigo. 2000. Temporal variation in fitness components and pop-ulation dynamics of large herbivores. Annual Review Ecological Systematics 31:367–393.
gaiLLarD, J. M., anD N. G. Yoccoz. 2003. Temporal variation in sur-vival of mammals: a case of environmental canalization? Ecology 84:3294–3306.
gaMassa, D.-G. M. 1995. Blockade of wildlife migration corridors by agricultural development in northern Tanzania. Pp. 609–613 in Integrating people and wildlife for a sustainable future (J. Bisonette and P. Krausman, eds.). The Wildlife Society, Bethesda, Maryland.
grosBois, V., M. P. Harris, T. anker-niLssen, R. H. MccLeerY, D. N. sHaw, B. J. T. Morgan, anD O. giMenez. 2009. Modeling survival at multi-population scales using mark–recapture data. Ecology 90:2922–2932.
HorVitz, C., D. W. scHeMske, anD H. casweLL. 1997. The relative “importance” of life-history stages to population growth: pro-spective and retrospective analyses. Pp. 247–271 in Structured population models in marine, terrestrial and freshwater systems (S. Tuljapurkar and H. Caswell, eds.). Chapman and Hall, New York.
JoHnson, H. E., L. S. MiLLs, T. R. stePHenson, anD J. D. weHausen. 2010. Population-specific vital rate contributions influence man-agement of an endangered ungulate. Ecological Applications 20:1753–1765.
kenDaLL, W. L., anD R. BJorkLanD. 2001. Using open robust design models to estimate temporary emigration from capture–recapture data. Biometrics 57:1113–1122.
kenDaLL, W. L., K. H. PoLLock, anD C. Brownie. 1995. A likelihood-based approach to capture–recapture estimation of demographic parameters under the robust design. Biometrics 51:293–308.
LaMPreY, H. 1964. Estimation of the large mammal densities, bio-mass, and energy exchange in the Tarangire game reserve and the Maasai steppe in Tanzania. East African Wildlife Journal 1:3–92.
by guest on October 10, 2016
http://jmam
mal.oxfordjournals.org/
Dow
nloaded from
LEE ET AL.—GIRAFFE SPATIAL DEMOGRAPHY 1025
Laurian, C., J. P. oueLLet, R. courtois, L. Breton, anD S. st onge. 2000. Effects of intensive harvesting on moose reproduction. Journal of Applied Ecology 37:515–531.
LeBreton, J.-D., anD J. cLoBert. 1990. Bird population dynamics, management and conservation: the role of mathematical modelling. Pp 105–125 in Bird population studies: their relevance to conserva-tion and management (C. M. Perrins, J.-D. Lebreton, and G. J. M. Hirons, eds.). Oxford University Press, Oxford, United Kingdom.
LeutHoLD, B. M., anD W. LeutHoLD. 1978. Ecology of the giraffe in Tsavo East National Park, Kenya. East African Wildlife Journal 16:1–20.
MccorquoDaLe, S. M. 2001. Sex-specific bias in helicopter surveys of elk: sightability and dispersion effects. Journal of Wildlife Management 65:216–225.
MsoFFe, F. U., et aL. 2011. Drivers and impacts of land-use change in the Maasai Steppe of northern Tanzania: an ecological, social, and political analysis. Journal of Land Use 6:261–281.
nDiBaLeMa, V. G. 2009. A comparison of sex ratio, birth periods and calf survival among Serengeti wildebeest sub-populations, Tanzania. African Journal of Ecology 47:574–582.
neLson, F., et aL. 2010. Payments for ecosystem services as a frame-work for community-based conservation in northern Tanzania. Conservation Biology 24:78–85.
newMark, W. D. 2008. Isolation of African protected areas. Frontiers in Ecology and the Environment 6:321–328.
newton, I. 1989. Lifetime reproduction in birds. Academic Press, London, United Kingdom.
nicHoLs, J. D. 1992. Capture–recapture models: using marked ani-mals to study population dynamics. Bioscience 42:94–102.
niLsen, E. B., et aL. 2009. A slow life in hell or a fast life in heaven: demographic analyses of contrasting roe deer populations. Journal of Animal Ecology 78:585–594.
owen-sMitH, N. 1992. Megaherbivores: the influence of very large body size on ecology. Cambridge University Press, Cambridge, United Kingdom.
owen-sMitH, N., anD D. R. Mason. 2005. Comparitive changes in adult vs. juvenile survival affecting population trends in African Ungulates. Journal of Animal Ecology 74:762–773.
ParaDis, E., S. R. BaiLLie, W. J. sutHerLanD, C. DuDLeY, H. Q. P. crick, anD R. D. gregorY. 2000. Large-scale spatial variation in the breeding performance of song thrushes Turdus philomelos and blackbirds T. merula in Britain. Journal of Applied Ecology 37:73–87.
PeLLew, R. A. 1983. The giraffe and its food resource in the Serengeti. II. Response of the giraffe population to changes in the food sup-ply. African Journal of Ecology 21:269–283.
PeLLew, R. A. 1984. Food consumption and energy budgets of the giraffe. Journal of Applied Ecology 21:141–159.
Le PenDu, Y., anD I. cioFoLo. 1999. Seasonal movements of giraffes in Niger. Journal of Tropical Ecology 15:341–353.
PFister, C. A. 1998. Patterns of variance in stage-structured popu-lations: evolutionary predictions and ecological implications. Proceedings of the National Academy of Sciences 95:213–218.
PoLLock, K. H. 1982. A capture–recapture design robust to unequal probability of capture. Journal of Wildlife Management 46:752–757.
Pratt, D. M., anD V. H. anDerson. 1982. Population, distribution, and behavior of giraffe in the Arusha National Park, Tanzania. Journal of Natural History 16:481–489.
Prins, H. H. T. 1987. Nature conservation as an integral part of opti-mal land use in East Africa: action plan for the Masai ecosystem of northern Tanzania. Biological Conservation 40:141–161.
r core DeVeLoPMent teaM. 2013. R: a language and environment for statistical computing. R Foundation for Statistical Computing, Vienna, Austria.
raitHeL, J. D., M. J. kauFFMan, anD D. H. PLetscHer. 2007. Impact of spatial and temporal variation in calf survival on the growth of elk populations. Journal of Wildlife Management 71:795–803.
reiD, J. M., E. M. BignaL, S. BignaL, D. I. Mccracken, anD P. MonagHan. 2004. Identifying the demographic determinants of population growth rate: a case-study of red-billed choughs Pyrrhocorax pyrrhocorax. Journal of Animal Ecology 73:777–788.
saetHer, B. E., anD O. Bakke. 2000. Avian life history variation and contribution of demographic traits to the population growth rate. Ecology 81:642–653.
scHMiDt, B. R., R. FeLDMann, anD M. scHauB. 2005. Demographic processes underlying population growth and decline in Salamandra salamandra. Conservation Biology 19:1149–1156.
searLe, S. R., G. caseLLa, anD C. E. MccuLLocH. 1992. Variance components. John Wiley, New York.
stoner, C., et aL. 2006. Changes in large herbivore populations across large areas of Tanzania. African Journal of Ecology 45:202–215.
strauss, M. K. L. 2014. Ecological and anthropogenic drivers of giraffe (Giraffa camelopardalis tippelskirchi) population dynam-ics in the Serengeti. Ph.D. dissertation, University of Minnesota, St. Paul.
strauss, M. K. L., M. kiLewo, D. rentscH, anD C. Packer. 2015. Food supply and poaching limit giraffe abundance in the Serengeti. Population Ecology 57:505–516.
strauss, M. K. L., anD C. Packer. 2013. Using claw marks to study lion predation on giraffe of the Serengeti. Journal of Zoology (London) 289:134–142.
sikes, R. S., W. L. gannon, anD tHe aniMaL care anD use coMMittee oF tHe aMerican societY oF MaMMaLogists. 2011. Guidelines of the American Society of Mammalogists for the use of wild mam-mals in research. Journal of Mammalogy 92:235–253.
Van tienDeren, P. H. 1995. Life cycle trade-offs in matrix population models. Ecology 76:2482–2489.
wHite, G. C., anD K. P. BurnHaM. 1999. Program MARK: sur-vival estimation from populations of marked animals. Bird Study 46(Supplement):120–138.
wisDoM, M. J., L. S. MiLLs, anD D. F. Doak. 2000. Life stage simula-tion analysis: estimating vital-rate effects on population growth for conservation. Ecology 81:628–641.
wittMer, H. U., B. N. McLeLLan, R. serrouYa, anD C. D. aPPs. 2007. Changes in landscape composition influence the decline of a threat-ened woodland caribou population. Journal of Animal Ecology 76:568–579.
Submitted 5 January 2016. Accepted 14 April 2016.
Associate Editor was Christine R. Maher.
by guest on October 10, 2016
http://jmam
mal.oxfordjournals.org/
Dow
nloaded from


![[GARMIN ETREX 10 GUIDE] - GitHub Pages · Garmin eTrex 10 Guide v1.0 (28-Oct-2013) 1 How to Setup Your Unit Turning on Your Unit 1. Turn on your GPS unit by pressing the button on](https://img.pdfslide.us/doc/110x75/5e21e4b9cc8aee51e04c6cfc/garmin-etrex-10-guide-github-pages-garmin-etrex-10-guide-v10-28-oct-2013.jpg)