Embed Size (px)
Citation preview

Spatial-Temporal AnalysisA Cellular Automata Model of Mineral-Related Activity from 1998 to 2010 for
Idaho and Western Montana
Raines, G.L.1, Zientek, M.L.2, Causey, J.D.2, and Boleneus, D.E2.
1) U.S. Geological Survey, MS 176 c/o Mackay School of Mines, UNR, Reno, Nevada 89557; Email:[email protected]
2) U.S. Geological Survey, 904 W. Riverside Ave. Room 202, Spokane, WA 99201

Spatial Modeling Extension
• Kemp, L.D., Bonham-Carter, G.F. and Raines, G.L., 1999, Arc-WofE: Arcview extension for weights of evidence mapping.
– http://gis.nrcan.gc.ca/software/arcview/wofe
• Kemp, L.D., Bonham-Carter, G.F. and Raines, G.L., 2001, Arc-SDM: Arcview extension for spatial data modelling using weights of evidence, logistic regression, fuzzy logic and neural network analysis.
– http://gis.nrcan.gc.ca/software/arcview/sdm

What is a cellular automata?
• Cellular automata (CA) are defined by an array of cells.
• The state of each cell evolves by a simple transition rule, the automaton.
• Implementation of a CA in a GIS involves a summation filter with an if-then or logic rule.
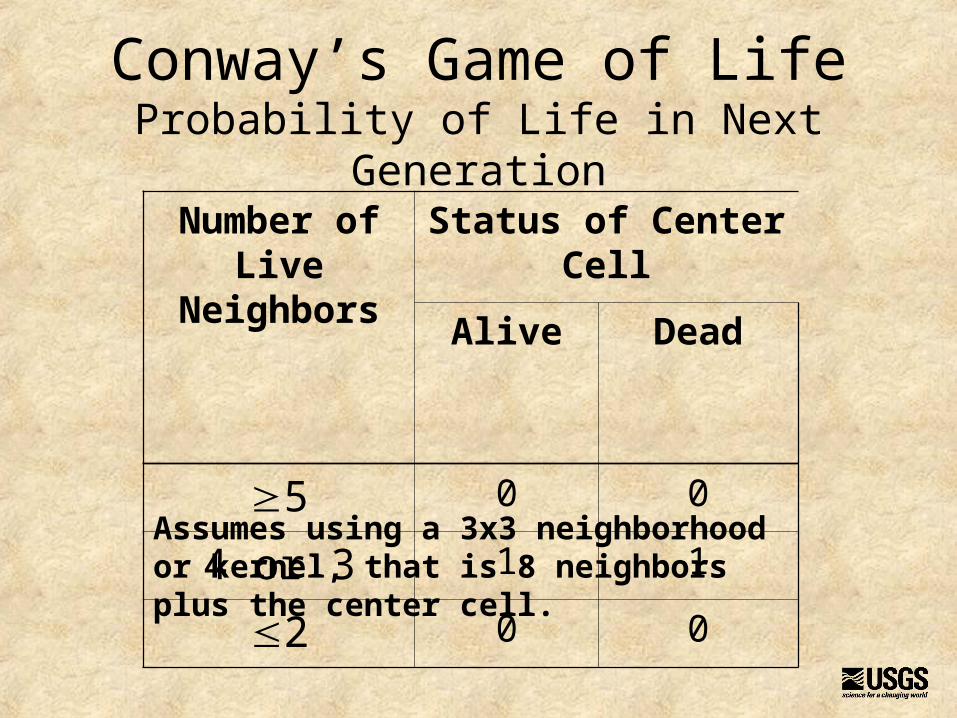
Conway’s Game of LifeProbability of Life in Next Generation
Number of Live Neighbors
Status of Center CellAlive Dead
5 0 0
4 or 3 1 1
2 0 0Assumes using a 3x3 neighborhood or kernel, that is 8 neighbors plus the center cell.


How have CAs been used?
• Modeling evolution of cities– Project Gigalopolis
http://www.ncgia.ucsb.edu/projects/gis/project_gig.htm
• Flow of lava• Evolution of forest fires• Physics – diffusion, Brownian motion,
defraction• Biology – life processes

Statement of Problem
• Project mineral-related activity on public land to 2010– Objective is to make a probabilistic prediction
of total activity– Not necessary to know annual activity
• Data on mineral activity from 1989 to 1998 are available to calibrate the CA– Permitting rules changed in 1992.

Public Lands
USFSBLMPrivate Land
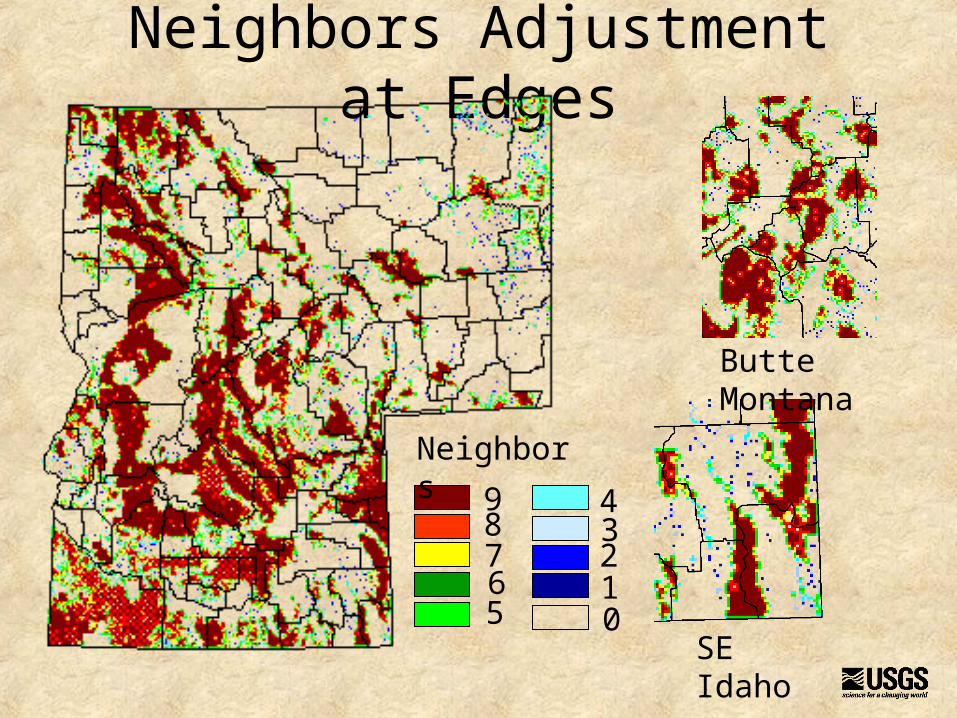
Neighbors Adjustment at Edges
SE Idaho
Butte Montana
2
987
065
43
1
Neighbors

Fuzzification of Resource Themes
Input Fuzzification Steepness
Midpoint
(km) Hedge
Permits Small 4 3 None
Significant Deposits Small 4 10 None
Patents Small 4 6 None
Exploration Activity Small 4 3 None
DMEA Small 4 3 None
Phosphate Proximity Small 5 5 More or less
Assessment Tract
Class Membership
Non-permissive Permissive Favorable
Porphyry Cu 0 0.75 0.95
Revette Cu 0 0.75 0.95

Small Fuzzification Algorithm
1
21
1f
fx
x
Where f1 is the steepness of the transition from a membership value
of 1 to 0 and f2 is the mid point where the membership value is 0.5
(Tsoukalas and Uhrig, 1997).
00.10.20.30.40.50.60.70.80.9
1
0 5 10 15 20
Crisp Values
Fu
zzy
Me
mb
ers
hip
Va
lue
Small
Somewhat Small
Very Small
Large

Resource Thresholds
> .90.75-.90<.750
Membership
SE Idaho
Butte Montana

• Echo Status (State of a cell, 1.6 x 1.6 km)– Stayed alive– Stayed died– Just born– Just died
• Trace (Sum of times a cell is alive)
States - Echo and Trace
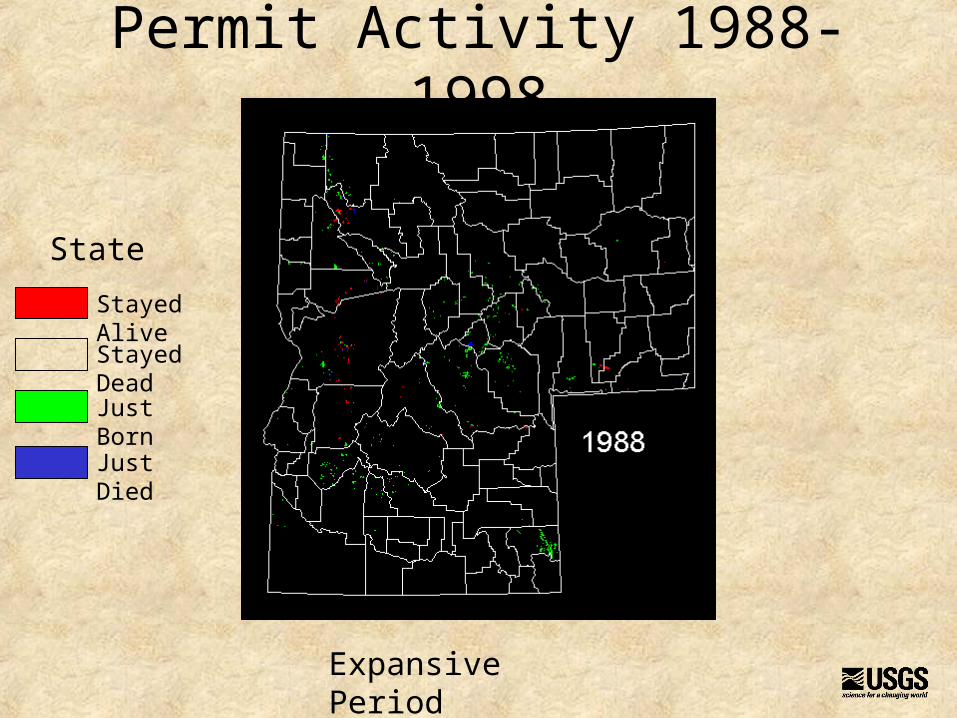
Permit Activity 1988-1998
Stayed Alive
Stayed Dead
Just Born
Just Died
State
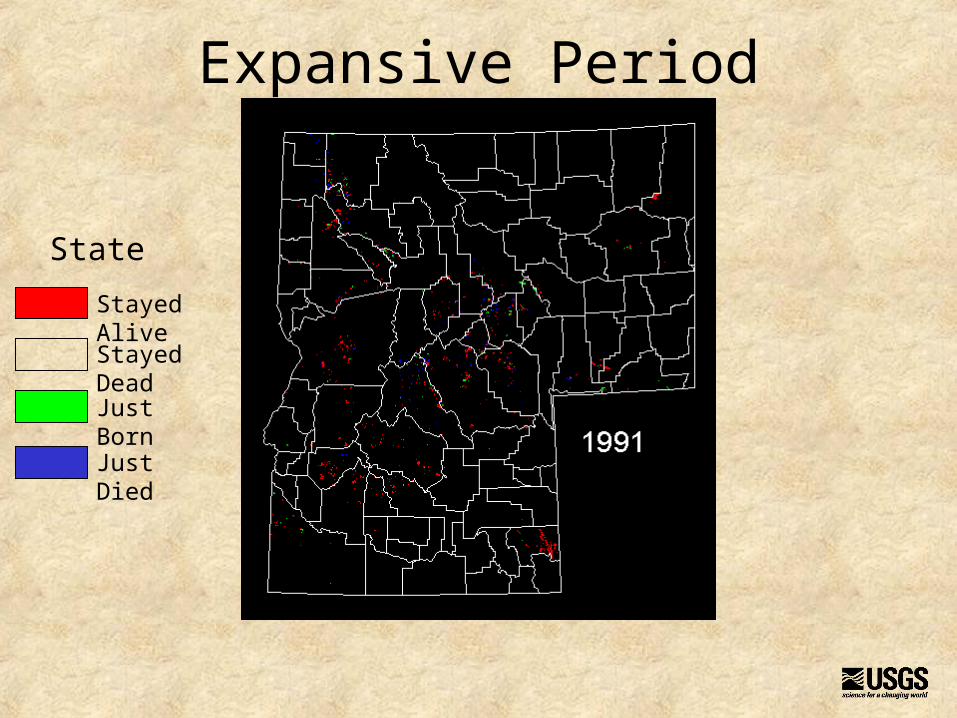
Expansive Period

Expansive Period
Stayed Alive
Stayed Dead
Just Born
Just Died
State

Expansive Period
Stayed Alive
Stayed Dead
Just Born
Just Died
State
Expansive Period
Stayed Alive
Stayed Dead
Just Born
Just Died
State

Expansive Period
Stayed Alive
Stayed Dead
Just Born
Just Died
State
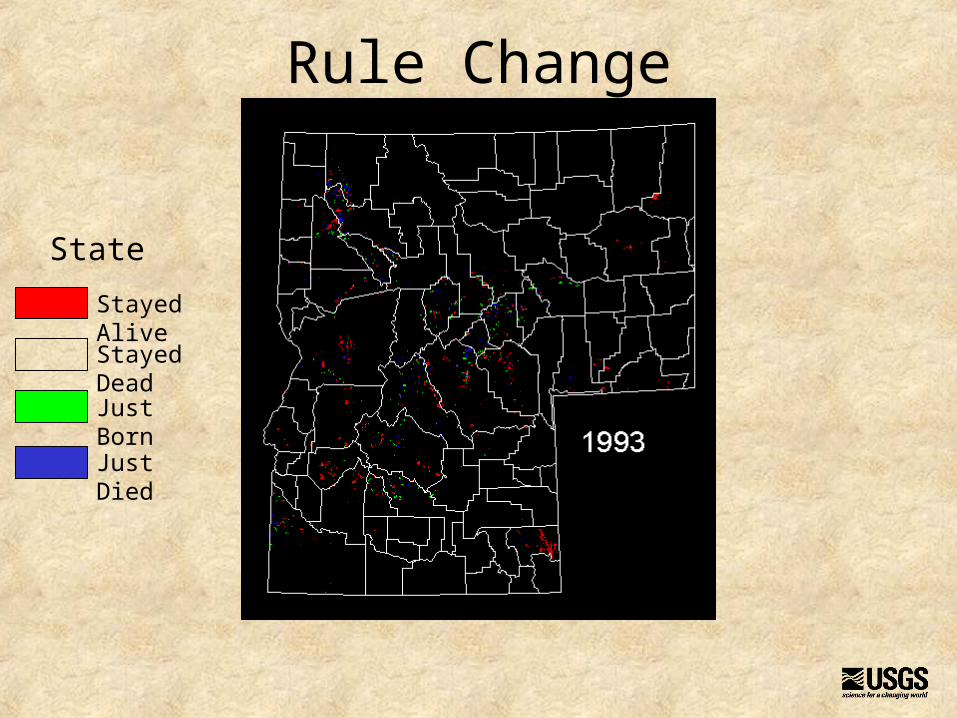
Rule Change
Stayed Alive
Stayed Dead
Just Born
Just Died
State

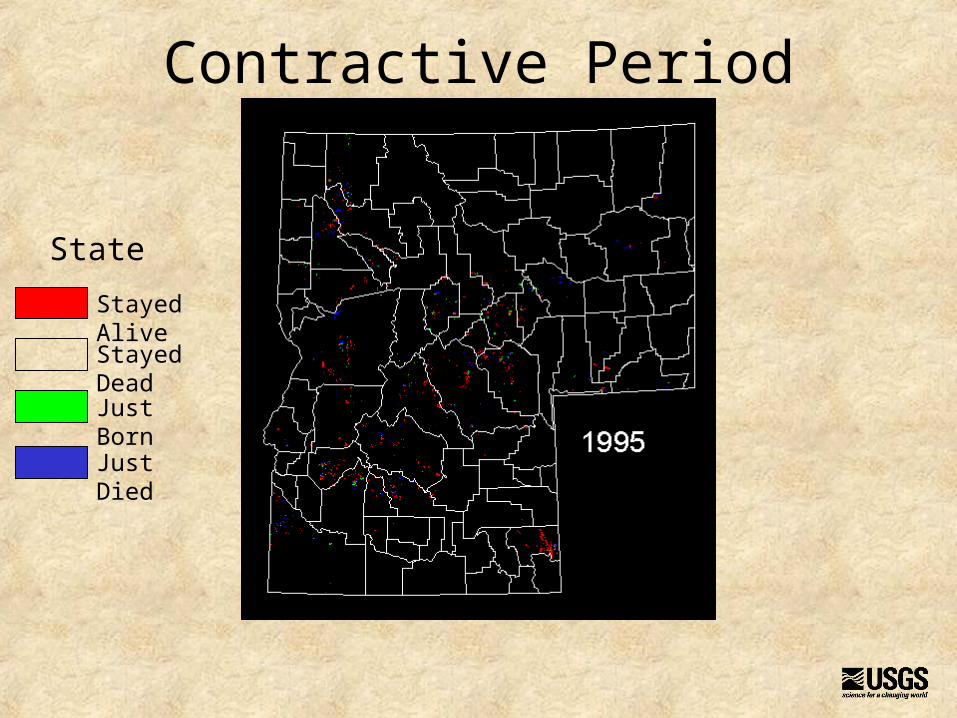
Contractive Period
Stayed Alive
Stayed Dead
Just Born
Just Died
State
Contractive Period
Stayed Alive
Stayed Dead
Just Born
Just Died
State

Contractive Period
Stayed Alive
Stayed Dead
Just Born
Just Died
State

Contractive Period
Stayed Alive
Stayed Dead
Just Born
Just Died
State

Contractive Period
Stayed Alive
Stayed Dead
Just Born
Just Died
State
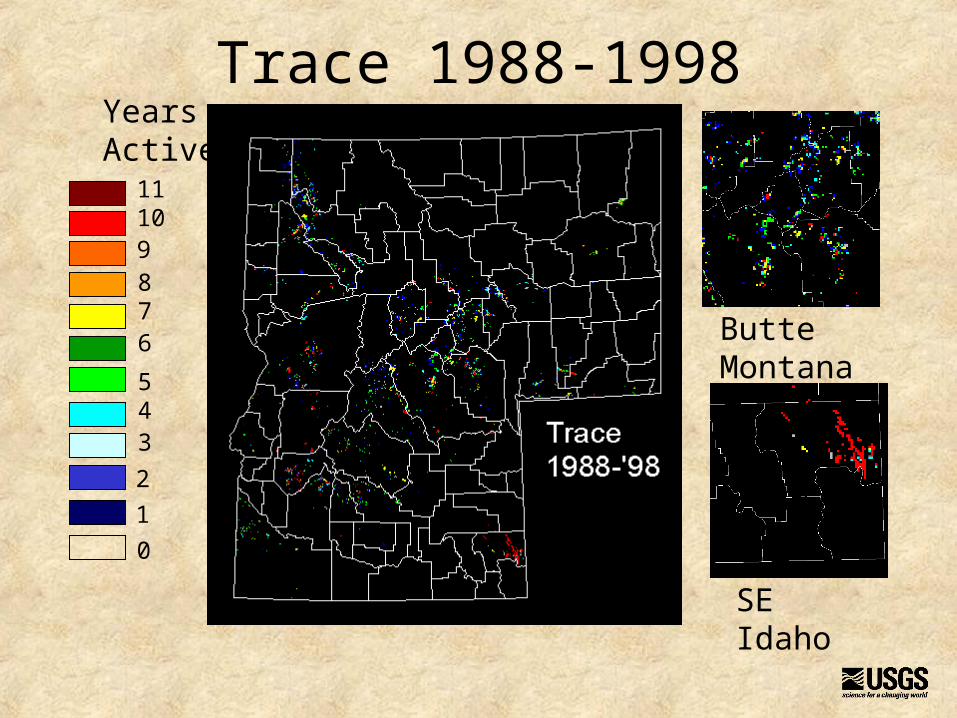
Trace 1988-1998
0
Years Active
11109876
543
2
1
SE Idaho
Butte Montana

Calibration – Echo StatesA:Stayed Dead
69000
69100
69200
69300
69400
69500
69600
69700
69800
69900
1988 1989 1990 1991 1992 1993 1994 1995 1996 1997 1998
B: Just Died
50
100
150
200
250
300
350
400
1988 1989 1990 1991 1992 1993 1994 1995 1996 1997 1998
C: Just Born
100
200
300
400
500
600
700
800
1988 1989 1990 1991 1992 1993 1994 1995 1996 1997 1998
D: Stayed Alive
200
400
600
800
1000
1200
1400
1988 1989 1990 1991 1992 1993 1994 1995 1996 1997 1998
Actual CA Calculated
Expansive Contractive

Voting Rule Probability of Life in Next Generation
Number of Live Neighbors
Status of Center Cell
Alive Dead
5 1 1
4 0 0
Does not differentiate between live and dead center cells!
For mineral-related activity results in rapid death of all activity.
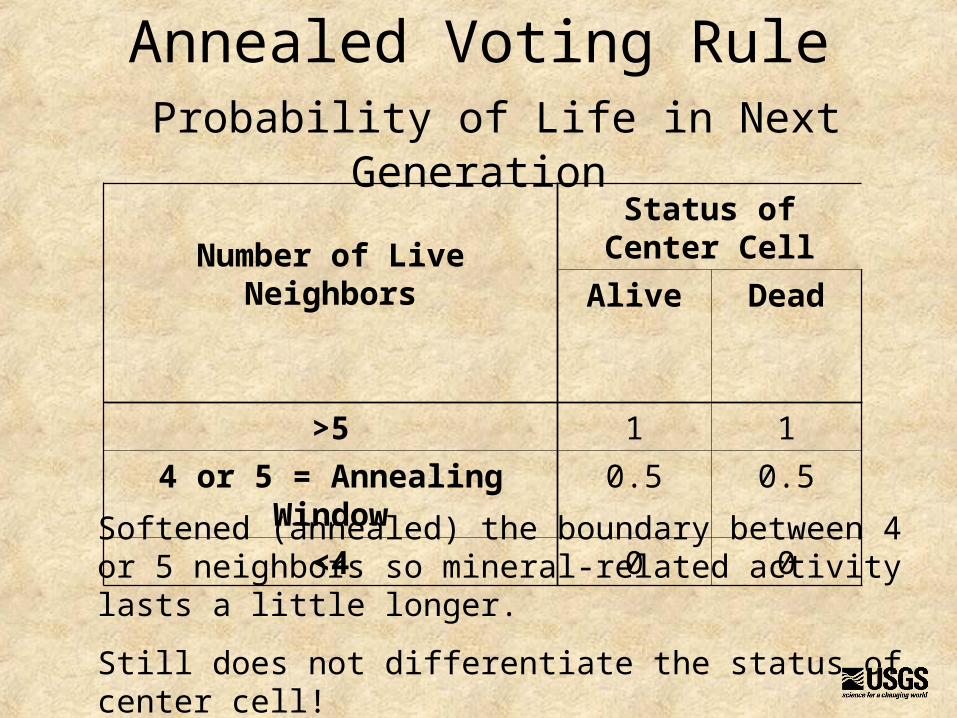
Annealed Voting Rule Probability of Life in Next Generation
Number of Live Neighbors
Status of Center Cell
Alive Dead
>5 1 1
4 or 5 = Annealing Window 0.5 0.5
<4 0 0
Softened (annealed) the boundary between 4 or 5 neighbors so mineral-related activity lasts a little longer.
Still does not differentiate the status of center cell!

Modified Annealed Voting Rule Probability of Life in Next Generation
Number of Live Neighbors
Status of Center Cell
Alive Dead
> Annealing Window Very Likely Likely
Annealing Window Likely Somewhat Likely
< Annealing Window Very Somewhat
Likely
Unlikely
Differentiating between live and dead center cells!
Complexity deals with small portion of mineral-related activity!
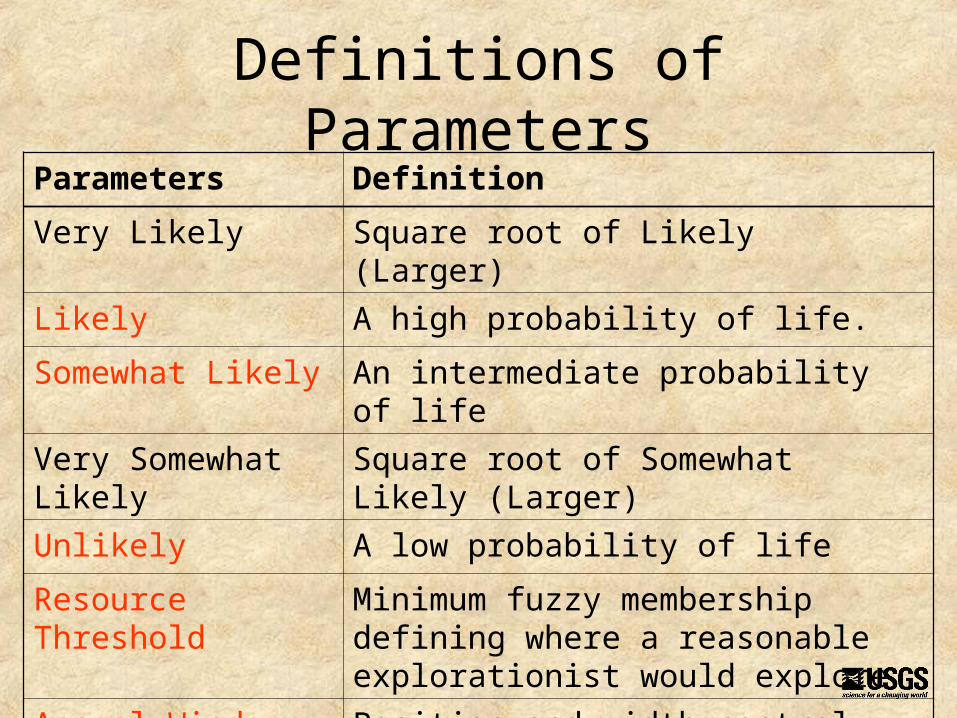
Definitions of ParametersParameters Definition
Very Likely Square root of Likely (Larger)
Likely A high probability of life.
Somewhat Likely An intermediate probability of life
Very Somewhat Likely Square root of Somewhat Likely (Larger)
Unlikely A low probability of life
Resource Threshold Minimum fuzzy membership defining where a reasonable explorationist would explore
Anneal Window Position and width control response of CA

Threshold Parameters Selected
CA Parameters
Time Periods
Expansive Contractive
Likely 0.87 0.75
Somewhat Likely 0.05 0.60
Unlikely 0.01 0.015
Resource Threshold 0.75 0.90
Anneal Window 5-1 7-4
Number of Live Neighbors
Status of Center Cell
Alive Dead
> Annealing Window Very Likely Likely
Annealing Window Likely Somewhat Likely
< Annealing Window Very Somewhat
Likely
Unlikely
Modified Annealed Voting Rule

Calibration – Echo StatesA:Stayed Dead
69000
69100
69200
69300
69400
69500
69600
69700
69800
69900
1988 1989 1990 1991 1992 1993 1994 1995 1996 1997 1998
B: Just Died
50
100
150
200
250
300
350
400
1988 1989 1990 1991 1992 1993 1994 1995 1996 1997 1998
C: Just Born
100
200
300
400
500
600
700
800
1988 1989 1990 1991 1992 1993 1994 1995 1996 1997 1998
D: Stayed Alive
200
400
600
800
1000
1200
1400
1988 1989 1990 1991 1992 1993 1994 1995 1996 1997 1998
Actual CA Calculated
Expansive Contractive

Cross-Tabulation 1989-1998Number of
CellsCA Trace
0 1 2 3 4 5 6 7 Sum
Actual
Trace
0 66364 1671 267 176 50 7 11 0 68446
1 354 136 76 70 24 4 2 0 666
2 154 42 57 49 18 4 1 0 325
3 129 69 102 133 47 29 20 3 532
4 33 32 52 78 34 20 16 1 266
5 8 11 15 25 42 31 11 5 148
6 8 4 22 34 24 22 14 3 131
7 17 4 17 34 81 125 70 25 373
Sum 66967 1969 608 599 320 242 145 37 70887

Selected Spatial StatisticsSpatial Statistic Trace CA Trace
Number of Patches 2,658 3,752
Mean Patch Size 6,829 4,836
Patch Size Coefficient of Variation 3,985 4,625
Total Edge 84,907,200 90,936,000
Edge Density 4.68 5.0
Mean Shape Index 1.19 1.17
Area Weighted Shape Index 26.43 27.32
Shannon’s Diversity Index 0.21 0.29
Shannon’s Evenness Index 0.10 0.14
Interspersion/Juxtaposition 70.21 58.71

Projected Probability of Activity 1998-2010
SE Idaho
Butte Montana
00-1616-3131-4747-6363-79
Probability

Avenue Code for Life• g = (g.FocalStats(#GRID_STATYPE_SUM, NbrHood.MakeRectangle(3,3,false), false) * 2 - g - 6).Abs <= 1OR• FiltGrid =
theGrid.FocalStats(#GRID_STATYPE_SUM, NbrHood.MakeRectangle(3,3,false), false)
• TimeGrid = ((FiltGrid = 3) or (FiltGrid = 4) ).con(1.AsGrid,0.AsGrid)

Modified Annealed Voting Rule• Ei+1,j = f (LO, Rj>RTp, Ppj(nij(x),Eij))• Where
– i = the year, p = the expansive or contractive period, and j = the cell number,– Eij = Status (alive or dead) of cell j in year i– LO = Private or public land ownership, no activity modeled on private land– Rj = Resource fuzzy-membership value of cell j– RTp = Period Resource threshold– Ppj = Random annual probability of activity in cell j for period p, which is a
function of nij(x), and Eij
– nij(x) = For year i, the number of active neighbors in the 3x3 neighborhood of cell j that is rescaled as a function of x, the maximum number of pubic-land neighbors of cell j. The value of x ranges from 1 to 9, and n(x) ranges from 0 to 9.


![OFHEO v Raines[1]](https://img.pdfslide.us/doc/110x75/577dadf11a28ab223f8fce76/ofheo-v-raines1.jpg)