Embed Size (px)
Citation preview
`
1
Working Paper Series No. 15 | December 2014
© Resilience Development Initiative
Spatial Relationship Between Land Use Change and Flood Occurrences in Urban Area of Palembang
Fernando Situngkir
Resilience Development Initiative, Bandung, Indonesia
Saut Sagala
Institute Technology of Bandung, Indonesia
Dodon Yamin
Resilience Development Initiative, Bandung, Indonesia
Ayumas Widyasari
Institute Technology of Bandung, Bandung, Indonesia
`
2
WP No : 15
Date : December, 2014
ISSN : 2406 - 7865
Spatial Relationship Between Land Use Change and Flood
Occurrences in Urban Area of Palembang
Fernando Situngkir1, Saut Sagala
2, Dodon Yamin
1, and Ayumas Widyasari
1
1Resilience Development Initiative, Bandung, Indonesia
2School of Architecture, Planning, and Policy Development, Institute Technology of Bandung,
Bandung, Indonesia
Resilience Development Initiative (RDI) is a think tank initiative based in Bandung,
Indonesia that focuses on environmental change and sustainable development. RDI
contributes to the body of knowledge on development and disaster research studies in
Indonesia and South East Asian Region.
RDI Working Paper Series is published electronically by RDI.
The views expressed in each working paper are those of the author or authors of the paper.
They do not necessarily represent the views of RDI or its editorial committee.
Citation of this electronic publication should be made in Harvard System of Referencing.
Reviewers: Ramanditya Wimbardana
Mangapul Nababan
Saut Sagala
Jonatan Lassa
Editorial Team: Ramanditya Wimbardana
M Wahyu Anhaza Lubis
Contact: Alamat: Jalan Imperial II No. 52, Bandung 40135
Jawa Barat – INDONESIA
Telepon: +62 22 2536574
Email: [email protected]
Website: www.rdi.or.id

`
3
Contents Abstract ................................................................................................................................................... 5
1. Introduction ..................................................................................................................................... 5
2. Literature Review ............................................................................................................................ 6
3. Methodology ................................................................................................................................... 8
4. Findings........................................................................................................................................... 9
5. Discussion ..................................................................................................................................... 14
`
4
Disclaimer:
This article presents the draft of original article entitled “Spatial Model of Wetland Use Change And
Flood Occurrence in Residential Areas” that was presented by authors at Sustainability Science
Symposium Conference, Bandung 8-10 September 2014.
© Resilience Development Initiative 2014
All right reserved. No part of this publication may be reproduced, stored in a retrieval system or
transmitted in any form or by any means, electronic, mechanical or photocopying, recording, or
otherwise without the prior permission of the publisher.

`
5
Spatial Relationship Between Land Use Change and Flood
Occurrences in Urban Area of Palembang
Fernando Situngkir1, Saut Sagala
2, Dodon Yamin
1, and Ayumas Widyasari
1
1Resilience Development Initiative, Bandung, Indonesia
2School of Architecture, Planning, and Policy Development, Institute Technology of Bandung,
Bandung, Indonesia
Email: [email protected]
Abstract
This paper discusses the relationship between wetland use change and the occurrences of floods in
residential areas of Palembang City. Palembang, well known as a wetland city in early 1919, has
significantly converted its wetland up to 55% in 2010. The trend of flooding in the city has increased
from 18 events in 2007 to 46 events in 2012. Uncontrolled urban development is assumed as the
major drivers of the wetland conversion. The aim of this study is to estimate the relationship between
land use changes the occurrence of flood happened in Palembang. In this paper, approximately 626
households from 4 residential areas were observed and 26 respondents were interviewed in March
2014 to gain information about the environment before, during and after the flooding and their
relation to the wetland conversion. Literature review was also conducted in order to gain more
insights about the phenomenon. By harnessing spatial correlation analysis, this study presents the
relation between wetland conversion trend and flood occurrence in Palembang, which could be used
to develop the appropriate policy to reduce the risks coming from flooding as well as preserving the
urban environment in Palembang.
Keywords: Development; Flood; Land Conversion; Spatial Correlation; Wetland.
1. Introduction
Flood occurrence has been a common phenomenon in urban areas which grew dramatically in recent
decades (IFRC, 2010; Jha et al., 2012). Flood occurrence has made people exposed to some threats
which lead to infrastructure destruction, job loss and fatalities. International Federation of Red Cross
(IFRC, 2010) noted that compared to other natural disasters, flood claims the most destructive disaster
with the biggest loss. Floods directly affect more than 99 million people per year in all over the globe
from 2000 to 2008. Jha et al. (2012) even noted that there were 178 million people affected directly
by the risk of floods in 2010.
The vulnerability of urban area to flooding is a result of several factors, such as economy and social
activities, population growth, economy growth, environmental degradation, and urbanization in urban
area which are not supported by the sufficient urban planning and management (Adelekan, 2011;
Birkman et al, 2010; Mekvichai, 2008, Razafindabre et al., 2012). The emergence of slums in flood
plain urban areas and river banks, the density of population dwellings, and the insufficient drainage
capacity are some examples of vulnerability factors which leads to flood risks. On the other hand, the
environmental change factors in global scale (i.e. the increasing of extreme rainfall events, uncertain
rainy season period, the increasing of extreme storm events, etc.) also contributed to flood risk in
urban area (Coumou and Rahmstorf, 2012; Guhathakurta et al., 2011; Rowe and Villarin, 2013;
Trenberth, 2012; Wang et al., 2013).
Compared to other South East Asian countries, Indonesia has many big cities which have dynamic
trends of urbanization, increasing economy activities and growing population, such as Jakarta,
Bandung, Medan and Surabaya (Jones, 2002). As the consequence, these cities require more land and
space provision for the development. However, the scarcity of land and spaces in urban area lead to
land use change phenomenon, especially the conversion from protected area into built area (Firman,
2009; Partoyo and Shrestha, 2013). For instance, flooding which happened in Jakarta in 2002, 2007
and 2013 showed a significant impact of land use change from agricultural areas to residential and

`
6
industrial areas in the upstream region of Bogor, Puncak and Cianjur (Bopuncur) in the last two
decades (Firman, 2009). The imbalance of rain water flow and the decreased capacity of catchment
areas resulted in the emergence of the unabsorbed water mass which flowed into the downstream area
and disembogued into the lower northern region, Jakarta. Moreover, the limitation of natural and
artificial drainage capacities in Jakarta caused flooding in most of the Jakarta region become
unavoidable (Sagala et al., 2013a).
In some cities in Indonesia, the land use change activities take place by wetlands stockpiling activities
such as swamps and turfs with dry soil to extend the built area, such as residential area, commercial
areas and infrastructures. The effort to stockpile or reclamate the wetland are commonly founded in
some cities in Sumatra and Kalimantan Islands, such as Pekanbaru, Jambi, Palembang, Pontianak and
Banjarmasin (Dahliani, 2012; Khaliesh et al., 2012; Murod and Hanum, 2012; Pulungan, 2009; Sa’ad
et al., 2010). Some prior studies prove that the existence of wetlands are able to retain and filter water
flow, control local climate, take part as the habitat of urban biodiversity, and prevents the flood
occurrences (Jia et al., 2011; Kim et al., 2010; Lantz et al., 2013).
To decrease the flood risks in the future and to achieve the sustainable development, various strategies
are important to be arranged. Up to this day, there are only few literatures and research studies which
assess the wetlands use change and its relation to the emergence of flood risks potential in some cities
in Indonesia. Moreover, the disaster risk reduction policy in some cities in Indonesia related to the
effort of land use change is aimed to study the relation between wetland use changes with flood
disaster along with the policies related to flood disaster risk reduction.
The rest parts of the article will discuss the literature on wetlands and flood risks and their
relationships. Further, the discussion goes on to the methodology of data collection and case study.
Findings on how the wetland changes and flood hazards caused are discussed. Finally, the paper
concludes with some relevant recommendations.
2. Literature Review
Wetlands are among the most productive, valuable, and yet most threatened ecosystem in the world
(Bruland, 2008). The wetland contains plenty of peat soils, plants and massy impermeable stratum;
all of them have good water retention performance; which make the wetland have huge water
retention capacity and it is equal to huge impounding reservoir. The wetland can store excessive
precipitation in rainstorm period and flooding period, and then drain the water through runoff in a
long time. On this aspect, the wetland can effectively reduce flood peak, weaken the hazard of flood
to the downstream. Meanwhile the wetland can also influence the local hydrologic situations and
impound flood, where one portion of flood is preserved in the form of surface water, and the other
portion of flood infiltrates into the underground water to increase the reserves of underground water;
such underground water can relieve the scarce water resources in the water scarcity season and then
the purpose to regulate the water source is achieve (An and Wang, 2014)
Human activities have changed the environment and caused a series of wetland changes, prolonging
dry season, altering groundwater levels, and decreasing connectivity and habitat heterogeneity
(Airoldi and Beck, 2007; Brock at al., 1999; Ivan et al., 2008; Stendman et al., 2008). Along with the
rapid economic development in estuarine area, the damage caused by the interference of human
activities is becoming more and more obvious (Chen, 2002). Large areas of wetland are disappearing,
and those remaining areas become vulnerable under anthropogenic impacts from industry, agriculture,
aquaculture, urban development and domestic waste (Charpentier, et al. 2005; Marieke et al., 2008; Li
et al., 2010). The wetland area greatly decreased in the past 50 years due to wetland reclamation,
population pressure, water diversion, dam construction, pollution, resource over-excavation,
biological invasion, desertification, climate change, and the misguiding policies (Chen, 2002;
Augusteijn and Warrender, 1998).
Flood control value of wetlands is not completely understood, but there is growing evidence that they
can play an important role in flood reduction. Storage of runoff in wetlands average is about 12 inches
per wetland-surface acre and can be four times that amount. It is important to note that water from
drained wetlands is that part of runoff that man can control. With an average annual loss of crops,

`
7
transportation facilities and property of $100,000,000 in North Dakota, even a small reduction in
flooding can result in substantial social and economic benefits (Cernohous, 1979).
In managing flood problems, planners and policy makers have to understand the factors which affect
the flood risk. The emergence of flood in urban area can be caused by river, coast, rainfall,
groundwater overflow and the artificial system fault (Jha et al., 2012). The cause of flood in urban
area is resulted from the combination of meteorological and hydrological events, such as the
sedimentation formed in the bottom of river and extreme flow. Nevertheless, this hazard-side factor is
not the only one causing the flood. The unplanned and uncontrolled city growth can increase the flood
risks because the process can place the human life to be potentially exposed by hazard in some
regions (Jha et al., 2012). This understanding is important in formulating the approach and solution in
reducing the damages and losses caused by flood therefore the planners and policy makers are able to
meet the need, urgencies and priority in implementing the flood risk measures.
Flood risk management is a process in controlling the problems about the risks caused by flood
events. Plate (2002) argued that flood risk management needs to be seen in a wider perspective, in
which planners and policy maker’s role to integrate the flood risk in planning system which comprises
sustainable measures. This concept is based on the magnitude of hazard and vulnerability factors
which change from time to time and result in the increasing of flood risk problems which are caused
by the development process, such as rainfall volume and intensity which get higher due to the climate
change and land use change and decrease the capacity of catchment area in absorbing the rain water
(Jha et al.m 2012; Nicholls et al., 1999). Even Plate (2002) explained that systems and actions in
managing flood risks which have been applied are not potentially able to cope the increasing of the
factor of hazard and vulnerability which is important for the planning aspect in managing the long-
term flood risk problems.
Integrated approach in managing the urban flood risks is the combination of management actions
which is either structural or the nonstructural (Brody et al., 2009). The structural actions aim to reduce
the flood risks by controlling the water flow from outside and inside the urban residential area. Brody
et al., (2009) and Correia et al. (1999) explained that the structural approach is referring to physical
development to control the flood or protect human settlements, which is implemented by building the
wall and dikes along the sea side and river side, artesian well, water channel, and retaining wall.
Moreover, in reducing the flood risks, the structural approach can be implemented by modifying the
environment structure through the development of dikes along the river side, channel and soil
improvement. Such various technics will be effective if it is used correctly as in the documentations
about the success story of Thames River management, sea protection in Netherlands and river
management system in Japan.
Some solutions in managing the flood risk applied in urban area were still used the structural
approach to control the hazard of flood (Correia et al., 1999; Nicholls et al., 1999; Plate, 2002). Risk
reduction solution was implemented by using the classical technic approach where flood problems can
be solved by using the hydrology methods such as the studies about flood hazard and the solution
about infrastructure development (i.e., the development of canals, water channels, huge dikes and so
forth) (Plate, 2002). However, Jha et al., (2012 ) and Holway and Burby (1993) argued that even the
structural approach still has some limitations, such as: (1) overcapacity flood will spill over and
significantly damage the structural of dikes design, (2) structure such as channels and dikes can
increase the level of river, increase the flood level and water velocity in downstream area by retaining
the waterway and natural flood plain which shorten the flood time in upstream area and cause bigger
flood in downstream area, (3) structural solution can offer temporal safety to public, (4) structural
actions often spend more financial cost, (5) the development of dam and the other structure of flood
control contribute to induce negative impact to environment. The 2013 flood disaster in Jakarta
showed that the structural approaches such as river normalization and the development of huge canal
undertaken by the provincial government of SCR of Jakarta, were still not able to solve the risk
problems (Sagala et al., 2013a).
As perfect as any structural actions were used, the integrated and non-structural approach are still
needed to reduce the flood risk. Non-structural actions cover various preventive measures or

`
8
adjustments to reduce the flood risks through modifying the vulnerability of development activities
which cause the damage in flood plain. This thing covers the prediction of flood event, early warning
system, flood disaster insurance, preparation and emergency plan and the regulation of land use to
control development (Correia et al., 1999; Hansson et al., 2008). The non-structural actions do not
necessarily need big investment in advance, however it depends on human understanding about the
threats of flood and reliable forecasting systems as in emergency evacuation plan will not function if
they were no prior warning. Moreover, the realization of this effort needs comprehensive approach
with support from institution capacity and public participation, especially in society order and
complex urban neighborhood problems (Pearce, 2003).
3. Methodology
This study uses the spatial correlation approach. In this context, the spatial correlation approach refers
to the effort to find the relation between two or more phenomenon which located spatially. Spatial
autocorrelation is the correlation among the values of a single variable strictly attributed to their
relatively close locational positions on a two-dimensional (2D) surface, introducing a deviation from
the independent observations assumption of classic statistics. Spatial autocorrelation exists because
real-world phenomena are typified by orderliness, (map) pattern, and systematic concentration, rather
than randomness (Griffith, 2009).
There are two groups of methodology used in this study, data collection method and data analysis
method. Data collection is conducted to gather the information required that contribute to the insights
analysis. To collect data and information, observation and interviews are conducted. The observation
is aimed to gather the physical condition of houses in the residential areas of Bumi Sriwijaya Indah,
Municipal Officers (Pemkot) Residence, and Patra Residence, Polygon Residence and Pulokerto
Residence. Since the location of Pemkot and Patra Residence is close, both of the residential areas are
later grouped into one residential area so there will be four groups of residential areas in this study.
Bumi Sriwijaya (BSI) Residence comprises three smaller residential areas, e.g. Bumi Sriwijaya Indah
Residence, Griya Sejahtera Residence and The Residential Area of Macan Lindungan. The Pemkot
Residence comprises two smaller residential areas, e.g. Palembang State Officers Residential Area
and Patra Sriwijaya Residence. The Polygon residence comprises three smaller residential areas, e.g.
Bukit Sejahtera Residence, Putri Kembang Dadar Residence and The Residential Area of Tanjung
Rawo. The Pulokerto Residence in this study only covers the Griya Asri Residence.
There are 26 respondents interviewed in this study which consist of six respondents from each
residential area. The interview was conducted in March 2014. The respondents are the residents in
those four residential areas. The interview is aimed to collect additional information about the land
use changes and flood coverage changes phenomenon in the past which those people experienced.
They were asked about the history of the land use changes and the condition when flood happened.
Figure 1 Example of Multi Layers Operations
Source: Raju, 2006
Actually, there are two kind of maps which provided in this study: (1) maps of land use in each
residential area and (2) maps of flood coverage in each area. For the land use maps, the maps are
available in 2001 and 2011 maps, while for the flood coverage maps, the 2004 and 2012 maps are
available. Intersecting those maps is done to produce the direction of the land use and flood coverage.

`
9
Figure 2 Location of The Observed Residential Areas in Palembang Urban Area
Source: Analysis, 2014
4. Findings
There are four groups of residential areas observed in this study. Each residential area has its unique
situations, either in physical or socio-economic aspect. Table follow presents the description of those
residential areas.
Table 1 Physical Aspect of Observed Residential Area BSI Pemkot Pulokerto Polygon
Elevation 5 mdpl 7-8 mdpl 6 mdpl 7 mdpl
Total Area 6 Ha 32 Ha 25 Ha 80 Ha
Housing Unit ±170 ±3350 ±1500
In general, all of the observed residential areas are inhabited by the medium to low income family
with various jobs, such as state officers, entrepreneur and so forth. Some houses and neighborhood
infrastructure are improves as the response to the flood event that frequently happen, such as elevating
the floor of the house, deepening the drainage channel and building a small embankment. Even
though, as the impact of the frequent flood events, some of the houses are rented by the owner or even
abandoned.
There are two main intersecting activity in this study: (1) intersecting the land use map and (2)
intersecting the flood coverage map. In this section the intersecting of land use is presented first per
residential area.
Figure 3 Land Use Changes in Bumi Sriwijaya Indah Residence in 2001 and 2011
Source: Analysis, 2014

`
10
Housing development in BSI Residence was identified to be massively conducted in the last ten years
in the residential area. The increasing rate of residential area reached 71.35% from 2001 to 2011. The
opposite thing happened to the changes of proportion of both wetland and dry land. Those land had
decreased respectively 24.33% and 8.44% from 2001 to 2011. This phenomenon showed that about
266,574 square meters of wetland and 26,311 square meters of dry land were converted into housing
areas.
Figure 4 Land Use Changes in Pemkot and Patra Residential Areas in 2001 and 2011
Source: Analysis, 2014
For both housing in Pemkot and Patra residential areas, there had been massive housing development
conducted in the last 10 years. Based on the picture above, both areas in 2001 comprised wetland and
dry land and almost of them were turned into housing areas by the year of 2011. Compared with the
other three residential areas, the increasing rate of housing growth in Pemkot and Patra combined
were the highest at the increasing rate of 658.76%. Moreover, in these areas, factories were also
developed and increased at 3.76% rate from 2001 to 2011. On the other hand, wetland and dry land
decreased with the rate of 27.06% and 6.44% respectively. This phenomenon showed that about
222,752 square meters of wetland and 82,891 square meters of dry land were converted into built
areas e.g., housing areas and factories.
Figure 5 Land Use Changes in Pulokerto Residence in 2001 and 2011
Source: Analysis, 2014
Massive housing development in Pulokerto Residence was conducted from 2001 to 2011 at the
increasing rate of 54.60%. Moreover there have been factories development conducted in that time
line with the increasing rate of 81.12%, the highest rate among all residential areas in this study. On
the other hand, wetland and dry land had decreased from 2001 to 2011 with the rate of 17.62% and
10.05% respectively. This shows that from 2001 to 2011, there had been wetland and dry land with
the area of 150.550 square meters and 52,949 converted into housing areas and factories.
`
11
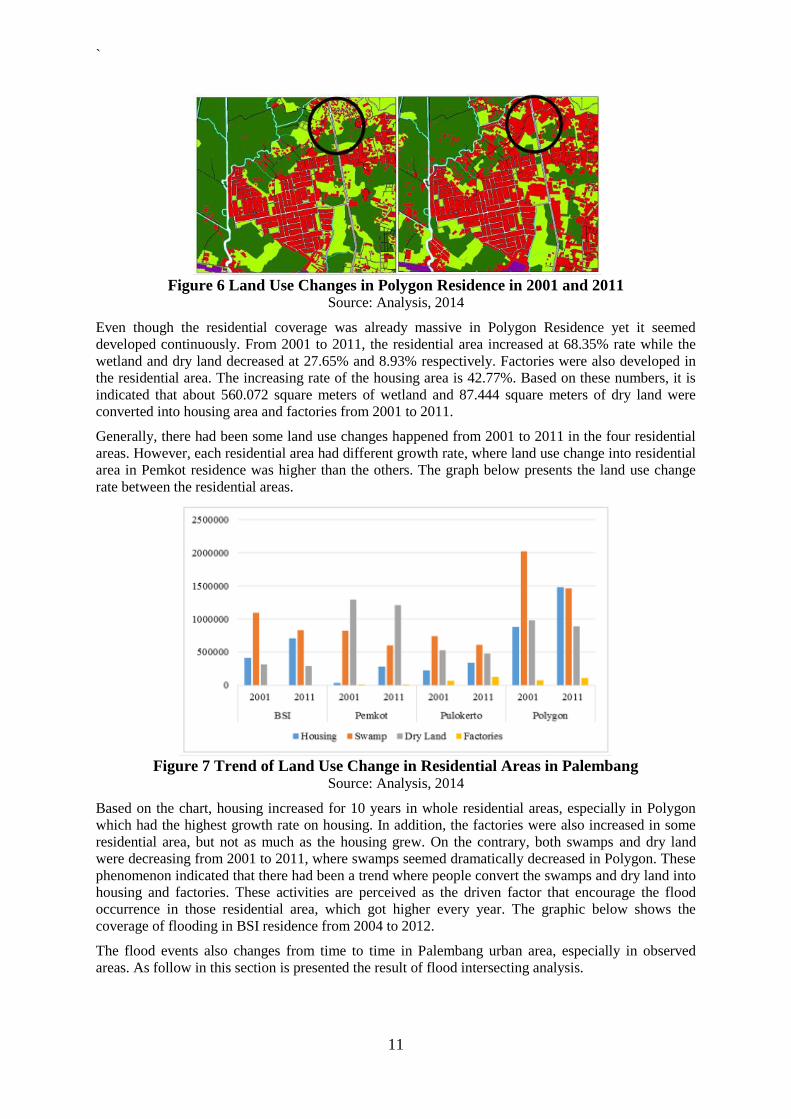
Figure 6 Land Use Changes in Polygon Residence in 2001 and 2011
Source: Analysis, 2014
Even though the residential coverage was already massive in Polygon Residence yet it seemed
developed continuously. From 2001 to 2011, the residential area increased at 68.35% rate while the
wetland and dry land decreased at 27.65% and 8.93% respectively. Factories were also developed in
the residential area. The increasing rate of the housing area is 42.77%. Based on these numbers, it is
indicated that about 560.072 square meters of wetland and 87.444 square meters of dry land were
converted into housing area and factories from 2001 to 2011.
Generally, there had been some land use changes happened from 2001 to 2011 in the four residential
areas. However, each residential area had different growth rate, where land use change into residential
area in Pemkot residence was higher than the others. The graph below presents the land use change
rate between the residential areas.
Figure 7 Trend of Land Use Change in Residential Areas in Palembang
Source: Analysis, 2014
Based on the chart, housing increased for 10 years in whole residential areas, especially in Polygon
which had the highest growth rate on housing. In addition, the factories were also increased in some
residential area, but not as much as the housing grew. On the contrary, both swamps and dry land
were decreasing from 2001 to 2011, where swamps seemed dramatically decreased in Polygon. These
phenomenon indicated that there had been a trend where people convert the swamps and dry land into
housing and factories. These activities are perceived as the driven factor that encourage the flood
occurrence in those residential area, which got higher every year. The graphic below shows the
coverage of flooding in BSI residence from 2004 to 2012.
The flood events also changes from time to time in Palembang urban area, especially in observed
areas. As follow in this section is presented the result of flood intersecting analysis.

`
12
Figure 8 Flood Coverage in Bumi Sriwijaya Indah Residence from 2004 to 2012
Source: Analysis, 2014
There had been flood coverage change happened between 2004 and 2014 in BSI Residence. Based on
the figure above, there are some changes with the depth of the inundation which got deeper in 2012
compared to 2004. From the total 124 Ha area of study in the BSI residential area, the coverage of un-
inundated land seemed a little bit increasing with the rate of 9.76% from 2004 to 2014. On the other
hand, the coverage of flood with the inundation level of 0-15 centimeters was increasing 30.27%. On
the contrary, the flood coverage of 16-50 centimeters was decreasing 65.89% from 2004 to 2010.
However, those loose number became worse since it turned into a deeper inundation with the level of
50-100 centimeters or equal to knee to waist of normal adult. This level of inundation covered 52.54%
of total area of inundation in 2012. This 50-100 centimeters inundation had not existed in 2004, yet
the 16-50 centimeters inundation already covered 84.62% of all flood area and it only shared 28.92%
coverage in 2012.
Figure 9. Flood Coverage in Pemkot and Patra Residential Area from 2008 to 2012
Source: Analysis, 2014
The coverage of flood inundation in the Pemkot and Patra Residential area seemed to expand from
2008 to 2012. Although the proportion of un-inundated land and 0-15 cm flood inundation were
decreasing 11.65% and 33.89% respectively, the medium level inundation with the depth of 16-50 cm
was increasing on the same time 27.99%. In 2012, the level of inundation got higher as the flood level
of 50-100 cm was emerging while in 2008 the highest inundation was only 16-50 cm. By the
proportion, the un-inundated land and 015 cm inundation were decreasing while the 16-50 cm was
increasing. The new level of inundation, 50-100 cm, only shared 8.63% of total area in 2012.
`
13
Figure 10 Flood Coverage in Pulokerto Area from 2004 to 2012
Source: Analysis, 2014
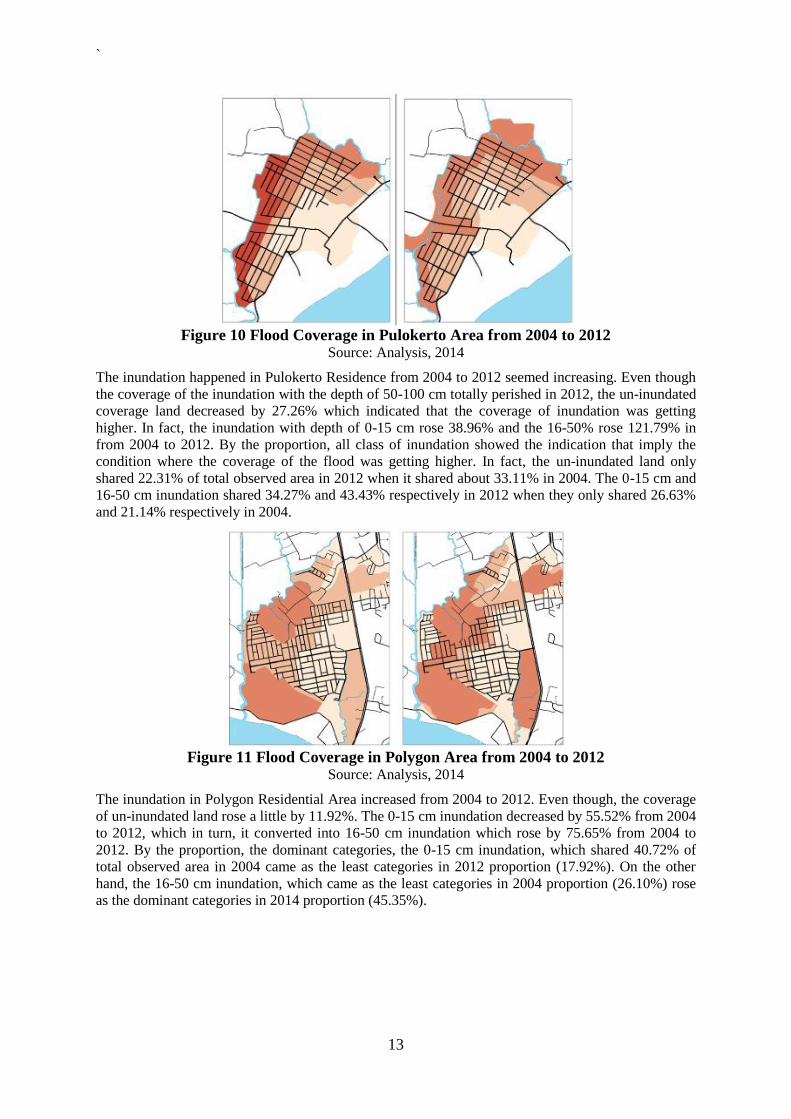
The inundation happened in Pulokerto Residence from 2004 to 2012 seemed increasing. Even though
the coverage of the inundation with the depth of 50-100 cm totally perished in 2012, the un-inundated
coverage land decreased by 27.26% which indicated that the coverage of inundation was getting
higher. In fact, the inundation with depth of 0-15 cm rose 38.96% and the 16-50% rose 121.79% in
from 2004 to 2012. By the proportion, all class of inundation showed the indication that imply the
condition where the coverage of the flood was getting higher. In fact, the un-inundated land only
shared 22.31% of total observed area in 2012 when it shared about 33.11% in 2004. The 0-15 cm and
16-50 cm inundation shared 34.27% and 43.43% respectively in 2012 when they only shared 26.63%
and 21.14% respectively in 2004.
Figure 11 Flood Coverage in Polygon Area from 2004 to 2012
Source: Analysis, 2014
The inundation in Polygon Residential Area increased from 2004 to 2012. Even though, the coverage
of un-inundated land rose a little by 11.92%. The 0-15 cm inundation decreased by 55.52% from 2004
to 2012, which in turn, it converted into 16-50 cm inundation which rose by 75.65% from 2004 to
2012. By the proportion, the dominant categories, the 0-15 cm inundation, which shared 40.72% of
total observed area in 2004 came as the least categories in 2012 proportion (17.92%). On the other
hand, the 16-50 cm inundation, which came as the least categories in 2004 proportion (26.10%) rose
as the dominant categories in 2014 proportion (45.35%).

`
14
Figure 12 Trend of Flood Coverage Change in Residential Area of Palembang
Source: Analysis, 2014
Based on the Figure 10. The BSI and Polygon Residential Area have deeper inundation than the
others. The figure shows that BSI residence area suffered from the inundation with the depth of 50-
100 cm which emerged dramatically in 2012. Pemkot residential area, on the other hand, did not show
any significant inundation change, yet dramatically increasing of the 16-50 cm depth inundation still
took into consideration to be solve. The Pulokerto residential area has a more significant change,
indicated by two opposing groups of bar charts which concluded that the coverage of inundation was
getting wider in general. The Polygon residential area also suffered from the inundation that got
deeper from 2004 to 2012.
As the two main information sources are already collected, the description of both land use trend and
flood coverage trend seem to be spatially clear. Based on both trends, there is a significant similarity
appear between each phenomenon for each group of residential area. Generally, the land use change
phenomenon on each group of residential area shows that there is a trend where housing and factories
development try to convert the dry land and wetland into housing and factory areas, which can rise a
threat for the residential and factory activities themselves since the development disturb the natural
system of water balance in the environment where those activities happen. On the other hand, the
flood coverage change phenomenon also show the same trend, where the coverage got wider and
deeper from 2004 to 2012. Comparing these two phenomenon, adjusted with the theoretical and
empirical prior works, it can be proposed that the land use change has contribute to the phenomenon
of flooding in the residential area.
Spatial correlation through the technic of intersection will helps to determine the unit of flood
coverage changes as the result of land use changes in residential areas in Palembang. By undertaking
double map overlaying, first, overlay the similar phenomenon in each residential group and then
overly the land use map with the flood map, in order to produce the unit of the causing factor (land
use change) and the impact factor (flood coverage).
5. Discussion
This study aims to support the idea that the land use changes have significantly contributed to widen
and deepen the flood coverage in the built up area, which in this case refers to residential area and
factories area. This idea come from the real condition where Palembang as the well-known dominated
wet land area have grown into a huge built area, such as residential area and commercial areas (Sagala
et al 2013b). The massive developments have sacrificed the wetland by stockpiled it which obviously
disturbs the balance of water system in the area and can lead to flooding. As the anticipated threat
predicted, the flooding in urban area in Palembang has become real and grown wider and deeper from
time to time.
Based on the analysis in the previous section, there have been some significant land use changes in
four observed residential areas. Results show that the housing and factories development grew
192.48% aggregately. On the other hand, the wet land and dry land decrease 17.83%. Meanwhile, the

`
15
flood coverage change analysis shows the similar pattern. Based on the analysis, aggregately, the total
area of un-inundated land decreased about 4.31% and the total area of inundated land increased
8.02%. By using the comparison between the growth rates of housing development with inundation
coverage in the same residential area, it is concluded that for 1% aggregate the housing and factories
development rise, the inundated area will get wider 0.04%. If this comparison is identified in
residential group level, there will be some differences in results. Pulokerto residence and Pemkot
residence have direct proportion with the aggregate result, while the other two show the opposite
result. For every land use changes in Pemkot and Pulokerto Residential Areas, there will be an
increasing rate of flood coverage in those areas for 0.02% and 0.42% respectively. BSI and Polygon
residential area on the other hand, will have a decreasing rate of flood coverage by 0.01% and 0.06%
respectively if the land use changes happen in those area by 1%.
In a general perspective, those residential areas already proofed that land use changes lead to the
emergence of inundation, which in this case is inundation in residential area. This hypothesis is
relevant to Pemkot and Pulokerto residential area situation, while it seem a little bit different for BSI
and Polygon Residential Area where land use changes does not seem to contribute to flood coverage
changes. Some factors have been identified which can cause this situation. Based on the observation,
it seems that in these two residential areas have done some preventive measures to reduce the risks
from flood inundation, such as elevating the pavement of the house, elevating the height of the houses
and deepening the drainage channel. Of course, both Pemkot and Pulokerto residential areas have
done the same measures, but it still applied bigger in BSI and Polygon rather than in Pemkot and
Pulokerto. Still, these for residential areas still suffered from inundation which got wider each period.
Some previous studies support the findings of this study, especially in providing the additional
insights about the different phenomenon happen in Palembang urban area. Actually, the Palembang
Municipality has produced some policies related to land use control in the area, such as the permit in
wetland reclamation for the development of Bukit Sejahtera Elite Residence or Polygon and
Jakabaring Sport City area in 2004, Regional Regulation No. 11 Year 2012 About Wetland and
Governor Regulation No. 5 Year 2013 about the Activity Control in Upstream Area. Moreover, the
government also issues the policy which encourages the structural approach by developing the
retention pond as the flood control in built area, the development of plaster on Musi River, the
normalization of Musi River and the development of the catchment area by using the green open
space. These measures are believed to follow the study conducted by Brody et al. (2009) which
explained the form of strategies integration by combining the structural and non-structural approach in
reducing the flood risks in urban area and Beatley (2009) and Jha et al., (2012) which supports the
idea of mainstreaming the land use management in development planning process in urban area.
This study has contributed to support the empirical results where land use change can contribute to the
change of flood inundation in urban area. Study objects, which in this case is residential areas located
along main river, show that trend of land use change can result in different impact of flood coverage.
As a half of study object indicate a direct proportion of land use change with flood coverage change,
the rests are shows the opposite. Therefore, there is a need to identify other factors that can contribute
to this result as this study only focus to the comparison between the land use and flood coverage
changes. However, the results of this study are useful to explain such phenomenon. The result of this
study can also be extended by applying them to similar phenomenon in urban area. In addition, other
external factors can be taken into consideration. In this study, the history of flood events and land use
changes are the main consideration with some addition coming from some literature review. This
study can be seen as a replicable study as long as the specific factors are sufficient enough to be
accounted into the analysis.
This study provides the description about the model of land use changes along with the flood
coverage changes as the effect of it. The main findings explain that there are some tendencies where
the land use change contributes to flood coverage changes and others engaged other factors to
understand the relationship between these two. Palembang urban area is not only known for its past
dominated wetland, but also for its proximity to Musi River, the biggest river in the province. Based
on the fact that land use changes were massively undertaken in the area, flood events grew as the
major natural phenomenon happened all the years. This study provides the insights through some

`
16
spatial models that there are some indications that the land use changes phenomenon in Palembang
residential area had contribute to the emergence of flood in the area.
Reference
Adelekan, I.O. (2010) Vulnerability of poor urban coastal communities to flooding in Lagos, Nigeria.
Environment and Urbanization, 22(2): 433-450.
An, S. and Wang, L. (2014) Wetland Restoration: Shanghai Dalian Lake Project. Springer Belin
Heidelberg, 45-62
Airoldi L, and Beck WM. (2007) Loss, status and trends for coastal marine habitats of Europe.
Oceanogr, Marine Biologu Annual Review;45: 345-405.
Augusteijn MF, Warrender CE. (1998) Wetland classification using optical and radar data and neural
network classification. Int J Remote Sens 19: 1945-1560.
Birkmann, J., Garschagen, M., Kraas, F. and Quang, N., (2010) Adaptive urban governance: new
challenges for the second generation of urban adaptation strategies to climate change.
Sustainability Science, 5(2): 185-206.
Brock MA, Smith RB, Jarman PJ.(1999) Drain it, dam it; alteration of water regime in shallow
wetlands on the New England Tableand of New Sout Wales, Australis. Wetlands Eco
Manage;7 : 37-46.
Brody, S.D., Zahran, S., Highfield, W.E., Bernhardt, S.P. and Vedlitz, A., (2009) Policy learning for
flood mitigation: A longitudinal assessment of the community rating system in Florida. Risk
Analysis, 29(6): 912-929.
Bruland GL. (2008) Coastal wetlands: function and role in reducing impact of land-based
management. In Fares, A. and A. I. Al-Kai. Coastal Watershed Manaement. WaIT Press.
Southampton, UK,p. 85-124.
Cenohous, L. (1979) The Role of Wetlands in Provising Flood Control Benefit. U.S. Fish and
Wildlife Service – Bismarck Area Office, Bismarck, North Dakota.
Charpentier A, Grillas P, Lescuyer F, Coulet E, Auby I. (2005) Spatio-temporal dynamics of a Zoestra
noltii dominated community over a period of fluctuating salinity in a shallow lagoon. Southern
France. Estuar Coast Shelf S 64: 307-315.
Chen X. (2002) Using remote sensing and GIS to analyze land cover change and its impacts on
regional sustainable development. Int J Remote Sens 23: 107-124.
Correia, F.N., Da Silva, F.N. and Ramos, I., (1999) Floodplain management in urban developing
areas. Part I. Urban growth scenarios and land-use controls. Water Resources Management,
13(1): 1-21.
Coumou, D. and Rahmstorf, S., (2012) A decade of weather extremes. Nature Climate Change, 2(7):
491-496.
Dahliani, D., (2012) Konsep Pengolahan Tapak Permukiman di Lahan Rawa, Banjarmasin. Lanting
Journal of Architecture, 1(2): 96 – 105.
Griffifth, D.A. (2009) Spatial Autocorrelation. Elsevier Inc.
Guhathakurta, P., Sreejith, O. and Menon, P., (2011) Impact of climate change on extreme rainfall
events and flood risk in India. Journal of Earth System Science, 120(3): 359-373.
Firman, T., (2009) The continuity and change in mega-urbanization in Indonesia: A survey of
Jakarta–Bandung Region (JBR) development. Habitat International, 33(4): 327-339
Hansson, K., Danielson, M. and Ekenberg, L., (2008) A framework for evaluation of flood
management strategies. Journal of Environmental Management, 86(3): 465-480.
Holway, J.M. and Burby, R.J., (1993) Reducing Flood Losses Local Planning and Land Use Controls.

`
17
Journal of the American Planning Association, 59(2): 205-216.
IFRC, (2010) World Disaster Report 2010: Focus On Urban Risk, International Federation of Red
Cross and Red Crescent Societies, Geneva.
Ivan S, Sonja L, Mladen J, Esad P. (2008) Mechanism of land-sea interactions – the distribution of
metal and sedimentary organic matter in sediments of a riverdominated Mediterranean karstic
estuary. Estuat Coast Shelf S 80: 12-20.
Jha, A. K., Bloch, R. and Lamond, J., (2012). Cities and flooding: a guide to integrated urban flood
risk management for the 21st century. World Bank Publcation.
Jia, H., Ma, H. and Wei, M., (2011) Urban wetland planning: A case study in the Beijing central
region. Ecological Complexity, 8(2): 213-221.
Jones, G.W., (2002) Southeast Asian Urbanization and The Growth of Mega-Urban Region. Journal
of Population Research, 19(2): 119 -136.
Khaliesh, H., Widiastuti, I. and Budi, S.B., (2012) Karakteristik Permukiman Tepian Sungai
Kampung Beting di Pontianak: Dari Rumah Lanting ke Rumah Tiang. In: A.S. Wibowo, I.
Widiastuti, H.E. Kusuma and D. Larasati (Editors), Temu Ilmiah IPLBI 2012. Ikatan Peneliti
Lingkungan Binaan Indonesia, Bandung, 3 - 4 November 2012.
Kim, D.G., Kim, S.J. and Ahn, T.J., (2010) Wetland Construction: Flood Control and Water Balance
Analysis. Environmental Engineering Research (EER), 15(4): 197-205.
Marieke AR, Reinold P, Hendrik JV, Julie DP. (2008) Remotely sensed seasonality in the spatial
distribution of sea-surfaced suspended particulate matter in the southern North Sea. Esthar
Coast Shelf S 80: 103-113.
Murod, C. and Hanum, M., (2012) Evaluasi Citra Kota Palembang Sebagai Kota Air Tempo Doeloe
dan Masa Kini. In: J. Adiyanto, T. Lusetyowati, A. Siswanto and W. Fransiska (Editors),
Palembang: Masa Lalu, Kini, dan Masa Depan. Program Arsitektur Universitas Sriwijaya,
Palembang, 17 November.
Nicholls, R.J., Hoozemans, F.M. and Marchand, M., (1999) Increasing flood risk and wetland losses
due to global sea-level rise: regional and global analyses. Global Environmental Change, 9:
S69-S87.
Lantz, V., Boxall, P.C., Kennedy, M. and Wilson, J., (2013) The valuation of wetland conservation in
an urban/peri urban watershed. Regional Environmental Change: 1-15.
Li QS, Wu ZF, Chu B, Zhang N, Cai SS, Fang JH. (2007) Heavy metals in coastal wetland sediments
of the Pearl Rover Estuary, China. Environ Pollut 149(2): 158-164.
Li Y, Zhu X, Sun X, Wang F. (2010) Landscape effects of environmental impact on bay-area
wetlands under rapid expansion and development policy; A case study of Lianyungang, China.
Landscape Urban Plan; 94(3-4): 218-227.
Mekvichai, B., (2008) Vulnerable Cities: Realities, Innovations, and Strategies. In: T. Kidokoro
(Editor), The Vulnerable City: Coping with Disasters. Springer, Tokyo.
Partoyo and Shrestha, R.P., (2013) Monitoring farmland loss and projecting the future land use of an
urbanized watershed in Yogyakarta, Indonesia. Journal of Land Use Science, 8(1): 59-84.
Pearce, L., (2003) Disaster management and community planning, and public participation: how to
achieve sustainable hazard mitigation. Natural hazards, 28(2-3): 211-228.
Plate, E.J., (2002) Flood risk and flood management. Journal of Hydrology, 267(1): 2-11
Pulungan, C., (2009) Fauna Ikan dari Sungai Tenayan, Anak Sungai Siak, dan Rawa di Sekitarnya,
Riau. Berkala Perikanan Terubuk, 37(2): 78-90.
Raju, P.L.N., (2006). Fundamental of Geographical Information System.

`
18
Razafindrabe, B.H., Kada, R., Arima, M. and Inoue, S., (2012) Analyzing flood risk and related
impacts to urban communities in central Vietnam. Mitigation and Adaptation Strategies for
Global Change: 1-22.
Rowe, S.T. and Villarini, G., (2013) Flooding associated with predecessor rain events over the
Midwest United States. Environmental Research Letters, 8(2): 024007.
Sa'ad, A., Sabiham, S., Sutandi, A., Sumawinata, B. and Ardiansyah, M., (2010) Perubahan
Penggunaan Lahan Pasang Surut Setelah Reklamasi di Delta Berbak, Jambi. Jurnal Hidrolitan,
1(3): 37 - 46
Sagala, S., Lassa, J., Yasaditama, H. and Hudalah, D., (2013a) The evolution of risk and vulnerability
in Greater Jakarta: contesting government policy in dealing with a megacity’s exposure to
flooding. IRGSC Reseach Working Paper, 2.
Sagala, S., Dodon, Wimbardana, R. and Lutfiana, D. (2013b): Alih Fungsi Lahan Rawa dan
Kebijakan Pengurangan Risiko Bencana Banjir: Studi Kasus Kota Palembang. Edited by
Herryal Anwar, Perspectif terhadap Kebencanaan dan Lingkungan di Indonesia: Studi Kasus
dan Pengurangan Dampak Risikonya, Volume 2. LIPI.
Stedman S, Dahl TE. Status and trends of wetlands in the coastal watersheds of the Eastern United
States 1998 to 2001. National Oceanic and Atmospheric Administration, National Marine
Fisheries Services and U.S. Departement of the Inferior, Fish and Wildlife Service 2008.
Tobias CR, Harvey JW, Anderson IC. (2001) Quantifying groundwater discharge through friging
wetlands to estuaries: Seasonal variability, methods comparison, and implication for wetland-
estuary exchange. Limnol Oceanogr 46(3): 604-615.
Trenberth, K.E., (2012) Framing the way to relate climate extremes to climate change. Climatic
Change, 115(2): 283-290.
Wang, H.-W., Kuo, P.-H. and Shiau, J.-T., (2013) Assessment of climate change impacts on flooding
vulnerability for lowland management in southwestern Taiwan. Natural Hazards, 68(2): 1001-
1019.

`
19


![[WeGO e-Government Program]City Paper Presentation : Bandung(Indonesia)](https://img.pdfslide.us/doc/110x75/55c4c252bb61ebfb1d8b481a/wego-e-government-programcity-paper-presentation-bandungindonesia.jpg)