Embed Size (px)
Citation preview

Spatial Profiles of Sediment Denitrification at the Ground Water – Surface Water Interface in Cobb Mill Creek on the Eastern Shore of Virginia
Holly Sue Galavotti Charlottesville, Virginia
B.S., James Madison University, 1998
A Thesis Presented to the Graduate Faculty of the University of Virginia
In Candidacy for the Degree of Master of Science
Department of Environmental Sciences
University of Virginia May, 2004
_____________________________
_____________________________
_____________________________
_____________________________

i
ABSTRACT
Intensive use of nitrogenous fertilizers on agricultural fields has contaminated the
shallow, unconfined Columbia aquifer on the Eastern Shore of Virginia, which contains
high NO3- levels at 10-20 mg N L-1, which are above USEPA drinking water limits of 10
mg N L-1. In a small, low-relief stream in one watershed, Cobb Mill Creek (CMC), on
the Eastern Shore, which is fed almost exclusively from the surrounding sandy aquifer,
the stream NO3- concentrations of 1-2 mg N L-1 are considerably lower under base flow
conditions. Synthesis of hydrological and biogeochemical ground water and stream data
collected at the experimental hillslope draining to Cobb Mill Creek indicated that high
concentrations of NO3- were maintained along deep, oxidized ground water flow paths
approximately greater than two meters deep and discharge vertically into the stream. The
NO3- was not removed until the pore water reached the ground water- surface water
interface approximately 20 cm below the streambed. The objectives of this research were
to determine the contribution of, and controls on denitrification in removing NO3- at the
ground water/ surface water interface. Vertical and lateral profiles of NO3- levels,
total organic carbon, redox potential (platinum electrode potential), and denitrification
potential rates (acetylene block method) were measured in intact cores collected from the
streambed. Vertical profiles showed a decrease of 8.27 mg NO3--N L-1 or 84.24%
between the open channel and 60 cm below the stream sediment surface in cores taken on
July 11, August 4, August 26, and October 26, 2003. The greatest decrease in NO3-
occurred in the top 20 cm of the stream sediments. In these shallow sediments, conditions
of high organic matter content, low redox potential, and available NO3- promoted high

ii
denitrification rates. Organic matter content was significantly positively correlated to
potential denitrification rates for all four sampling events. The results of this research
indicate that denitrification is responsible for NO3- removal from the discharging ground
water, and reducing conditions stimulated by surface-derived organic matter drive the
reaction. Along lateral profiles, increased total organic matter and increased potential
denitrification at depths greater than 20 cm below the stream sediment surface were
found only along the right bank facing downstream in all sampling dates. Due to the
curvature of the stream at the sampling reach, organic matter deposited into the stream
from the surrounding riparian forest may be consolidated and buried specifically along
the right bank of the stream.
The average denitrification potential rates were 661, 567, and 16.8µmol N m-2 h-1
in the stream sediments on July 11, August 4, and October 26, 2003, respectively. The
lowest denitrification rate was observed in October due to lower temperatures. The rates
observed this study are similar to denitrification rates observed in other studies in the
literature. While denitrification rates in Cobb Mill Creek sediments were spatially and
temporally variable, denitrification was a significant NO3- sink at the ground water-
surface water interface. Riparian buffers surrounding streams supply an important input
of organic matter that fuels denitrification. The maintenance of riparian buffers with
organic-rich soils is essential for natural remediation of NO3- concentrations in streams
sediments, to prevent nutrient enrichment of downstream environments.
TABLE OF CONTENTS
ABSTRACT......................................................................................................................... i LIST OF FIGURES ........................................................................................................... iv LIST OF TABLES.............................................................................................................. v

iii
INTRODUCTION .............................................................................................................. 1 Nitrate Contamination on the Eastern Shore of Virginia ................................................ 1 Nitrate Transformations................................................................................................... 3 Characteristics of the Ground Water- Surface Water Interface....................................... 7 Variability at the Ground Water- Surface Water Interface.............................................. 9 Spatial Profiles of Solutes at the Ground Water- Surface Water Interface ................... 10 Preliminary Assessment at Cobb Mill Creek ................................................................ 12 Research Objectives ...................................................................................................... 13
METHODS ....................................................................................................................... 14 Field Site Description .................................................................................................... 14 Determination of the Hydrological Gradient................................................................. 16 Experimental Design to Determine Spatial Profiles in the Stream Sediments.............. 17 Mini Drive Point Piezometer......................................................................................... 18 Sampling and Analysis of Solutes ................................................................................. 20 Denitrification Potential ................................................................................................ 22 Mass Balance between the Potential Nitrate Removal Rate by Denitrification and the Observed Nitrate Loss Rate........................................................................................... 25
RESULTS ......................................................................................................................... 28 Ground Water Flow Paths to Cobb Mill Creek ............................................................. 28 Ground Water and Stream Nitrate Concentrations........................................................ 31 Chemical Analysis of the Pore Water from Stream Sediments..................................... 34 Total Organic Matter Content........................................................................................ 41 Platinum Electrode Potential ......................................................................................... 43 Potential Denitrification Rate ........................................................................................ 45 Lateral Profiles across the Streambed ........................................................................... 48 Mass Balance................................................................................................................. 53
DISCUSSION................................................................................................................... 57 Hydrological Gradients and Ground-water Nitrate Concentrations .............................. 57 Vertical Profiles in Stream Sediments........................................................................... 60 Lateral Profiles in Stream Sediments ............................................................................ 68 Temporal Variation........................................................................................................ 70 Conceptual Model.......................................................................................................... 70
CONCLUSION................................................................................................................. 72 REFERENCES ................................................................................................................. 73 Appendix A: Piezometer and Well Locations .................................................................. 78 Appendix B: Ground Water Solute Concentration ........................................................... 81 Appendix C: Denitrification Potential Assay ................................................................... 83

iv
LIST OF FIGURES
Figure 1. Preliminary ground water and stream nitrate concentrations collected in October 2000..…………………………………………………………....13
Figure 2. Map showing location of field site at Cobb Mill Creek on the Eastern
Shore of Virginia near Oyster, VA……………………………………....15 Figure 3. Location of Piezometer and Well Nests at CMC………………………..17 Figure 4. Experimental design showing cross section locations in CMC………….19 Figure 5. Standard curve to determine N2O Production…………………………....24 Figure 6. Water table gradients along the hillslope down to CMC……………..…28 Figure 7. Ground water and stream NO3
--N concentrations collected in piezometers on October 26, 2003……………………………………………….…….34
Figure 8. Mapview of piezometer locations and NO3
--N concentrations……...…..36 Figure 9. Depth profiles of pore water nitrate collected from Intact Cores………..37 Figure 10. Depth profiles of average NO3
--N and Cl- concentrations in cores.…...40 Figure 11. Comparison of depth profiles of NO3
--N collected in Cores and MDPP..41 Figure 12. Depth profiles of organic matter collected in intact cores…………..…..44 Figure 13. Depth profiles of platinum electrode potential in intact cores……..…….44 Figure 14. Cross-section view of sediment colors in intact sediment cores………....46 Figure 15. Depth profiles of average DNT, TOC, and NO3
--N in intact cores...……48 Figure 16. Lateral profiles of DNT, TOC, and NO3
--N in cores on July 11, 2003.....51 Figure 17. Lateral profiles of DNT, TOC, and NO3
--N in cores on August 4, 2003..52 Figure 18. Lateral profiles of DNT, TOC, and NO3
--N in cores on August 26, 200.53 Figure 19. Lateral profiles of DNT, TOC, and NO3
--N in cores on October 26, 2003 ………………….…………………………………………..……………54

v
LIST OF TABLES
Table 1. Vertical head gradients determined in nested piezometers on the hillslope and in Cobb Mill Creek…..………………………………………………30
Table 2. Longitudinal head gradients determined in stream piezometers…………31 Table 3. Ground water NO3
--N concentrations collected in nested piezometers from Fall 2002- Winter 2003…………………………………………………..33
Table 4. NO3
--N, Cl-, and SO42- concentrations collected in intact sediment cores on
July 11, August 4, August 26, and October 26, 2003…………………...39 Table 5. NO3
--N, Cl-, and SO42- concentrations collected in MDPP on July 11,
August 4, and October 26, 2003…………………………….……...……41 Table 6. Correlation matrix of DNT, TOC, and NO3
--N………………………….49 Table 7. Vertical mass balance comparing potential and observed nitrate loss rates
……………………………….…………………………………………...58 Table 8. Lateral mass balance comparing potential and observed nitrate loss rates
……………………………………………………………………………59 Table 9. Comparison of CMC total denitrification rates with other studies…....…71 Table 10. Comparison of depth profile of CMC denitrification rates with those found
by Pfenning & McMahon (1996)…………………………………….......71

1
INTRODUCTION
Nitrate Contamination on the Eastern Shore of Virginia
Intensive use of nitrogenous fertilizers on agricultural land has led to extensive
contamination of water supplies throughout the United States (Winter, 1998).
Agricultural fields on upland soils fill the drainage waters with fertilizers flowing to
streams. Nitrate contamination of ground water and surface water is widespread because,
as an anion, nitrate is very mobile in the environment. High concentrations of nitrate in
surface waters can lead to eutrophication, which contributes to the extensive growth of
aquatic plants, depletion of oxygen, fish kills, and degradation of aquatic environments
(Winter, 1998). There are also potential health hazards for humans and some animals if
nitrate is consumed in sufficient quantities, such as fatal levels of anoxia in the blood
stream called methemaglobinemia. In addition, the presence of nitrate and nitrite in food
materials could increase the likelihood of the formation of carcinogenic nitrosamines
(Delwiche, 1976). It has also been proposed that the flux of N2O gas due to reduction of
nitrate from agricultural and adjacent land by denitrification is one of the major
contributors to atmospheric N2O on a global scale. Since N2O is a chemically unreactive
gas, it can reach the stratosphere by transport and diffusion and may affect the destruction
of the stratospheric ozone layer. Fertilizer use and an increase in the amount of grassland
and cultivated land make up about 90% of the anthropogenic N2O source. N2O accounts
for 4% of the greenhouse warming effect (Wagner-Riddle, 1996).
Nitrate contamination of ground water is a major concern for the agricultural
regions of the Eastern Shore of Virginia. All drinking water on the Eastern Shore is

2
derived from a high yielding multiaquifer system since there are no large surface water
supplies available. Total ground water use, including drinking water and withdrawal for
industry and irrigation, is estimated by the U.S. Geological Survey to be 5 Mgal/day.
About 25% of the population derives its water from the shallow, unconfined Columbia
aquifer, while the remainder draws water from the deeper Eastover-Yorktown confined
aquifer. Due to the presence of salts at depth, the Columbia and Yorktown-Eastover
aquifers constitute the entire freshwater system on the Eastern Shore of Virginia (U.S.
EPA, 1997).
Agriculture dominates the small peninsula of the Eastern Shore of Virginia, as it
accounts for approximately 50% of the land use (Reay, 2001). Typical crops planted are
soybeans, corn, and wheat or rye. In addition, tomatoes, cotton, and cucumbers are
regionally grown. The hydrogeology of the Eastern Shore facilitates the infiltration of the
nitrate from upgradient agricultural farms into the shallow ground water. The shallow
unconfined Columbia aquifer contains NO3- levels (10-20mg N L-1) (Chauhan and Mills,
2002) above USEPA drinking water limits (10 mg N L-1). The flat land surface,
dominated by well drained fine-sandy to sandy loam soils, facilitates ground water
contamination and the subsequent transport of nutrients to the streams, which ultimately
contributes to nutrient enrichment of the Chesapeake Bay and seaside lagoons. A small,
low relief stream, Cobb Mill Creek, on the seaside of the Eastern Shore is fed exclusively
from the surrounding sandy aquifer under base flow conditions. The NO3--N
concentrations of the stream are considerably lower (1-2 mg N L-1) than the contributing
ground water (Chauhan and Mills, 2002; Mills et al., 2002). This discrepancy between
high nitrate concentration in the discharging ground water and low nitrate concentrations

3
in stream water has prompted the examination of NO3- removal in the stream sediments
before the pore water discharges into Cobb Mill Creek.
Near-stream saturated zones are active sites of nitrogen cycling. Natural
attenuation of nitrate flowing from upland hillslopes through the ground water/ stream
water interface is determined by the interaction of the hydrologic flow-paths and the
biogeochemical characteristics of the sediment along that flow-path. This integrated
relationship is relatively unstudied with respect to nitrate transformations in riparian
zones (Cirmo & McDonnell, 1997). The research reported here contributes to
determining the controls of nitrate removal in the near-stream zone by investigating both
biogeochemical and hydrologic functioning. Removal of nitrate from the ground water
before it discharges into the stream is important to downstream estuaries.
Nitrate Transformations
Nitrate and ammonium are major components of fertilizer and manure.
Ammonium is readily transformed to nitrate under aerobic conditions by nitrifying
microbes (Winter, 1998). Nitrate is soluble in water and because of its solubility and
anionic form, it can easily leach through the soil and reach the water table, where it can
persist in shallow ground water for decades (Nolan, 1999). Nitrate does not form
coordination complexes with metals or sorb on inorganic or organic surfaces.
Transformations of nitrate are mostly biochemically mediated and its fate is dependent
upon reducing conditions and the amount of dissolved organic carbon present (Winter,
1998). In shallow, oxidized ground water in highly permeable sediment, nitrates can

4
travel long distances and can feed streams and flow downstream with little or no
retardation (Freeze & Cherry, 1979).
Stream riparian zones are areas of direct interaction between terrestrial and
aquatic systems involving exchanges of energy and matter (Hill, 1996). The riparian
ecotone can serve as a nutrient filter, removing up to 90% of nitrate from shallow ground
waters along its flow path across the riparian zone (Lowrance et al. 1984, Peterjohn &
Correll, 1984, Jacobs & Gilliam, 1985). Attenuation of NO3- concentrations occurs in
riparian zones through dilution, plant uptake, and microbial processes, particularly
denitrification. Dilution includes precipitation seeping though forest soils to the ground
water that contains less nitrate than seepage below an agricultural field. The amount of
recharge to an aquifer can influence nitrate concentrations on a seasonal basis. Dilution
of nitrate in discharging ground water can also occur when nitrate-poor stream water
mixes with nitrate rich ground water (Lowrance, 1992). Nitrogen is essential to life and
will be taken up for growth by plants, fauna, and microbes. Plant uptake can be very
effective in removing nitrate from the ground water, but its contribution depends upon
season (dormancy during the winter), vegetation type, and vegetation age (Hill, 1996).
Plant-root uptake of nitrate is maximal when the height of the water table is within reach
of the root zone during the growing season (Simmons, 1992). Vegetation uptake requires
the presence of a substantial fine root biomass at depth as the water table declines in the
summer. Information describing the vertical distribution and the seasonal dynamics of
fine root biomass in relation to water table fluctuations is lacking (Hill, 1996). Plants can
also immobilize nitrate by drawing nitrate through the roots by capillary action when the
water table is below the root zone. Microbial uptake of nitrate usually occurs in the

5
absence of inhibitory concentrations of NH4+ (Hill, 1996). Plant uptake and microbial
immobilization at the ground water- surface water interface is considered less significant
on long term nitrate uptake since nitrogen pools become saturated over time and
immobilized nitrogen is deposited back to the system by mineralization (Hedin, 1998).
Dissimilatory reduction of NO3- to NH4
+ is carried out by bacteria that can be either
obligate or facultative anaerobes, which can co-occur with denitrifiers (Hill, 1996).
Dissimilatory reduction of nitrate is minor in riparian areas where seasonally variable
ground water flows with high nitrate concentrations are in contact with sediments that are
not highly anaerobic because they are not permanently saturated (Hill, 1996). In
addition, loss of nitrate in riparian zones has not been associated with increased
concentrations of NH4+ in the ground water (Hill, 1996). Under anaerobic conditions,
microbial denitrification is generally considered the most important mechanism in
removing nitrate along the flow path to streams.
Denitrification is a microbial process in which heterotrophic, generally facultative
anaerobic bacteria, e.g. Paracoccus denitrificans, use nitrate (NO3-) and nitrite (NO2
-) as
electron acceptors in the oxidation of organic matter. Under hypoxic conditions, the
reaction follows the path: NO3- NO2
- N2O N2. When all dissolved oxygen in
ground water is consumed, denitrifiers oxidize organic matter and reduce nitrate
according to the following equation (Freeze & Cherry, 1979):
CH2O + 4/5 NO3- 2/5 N2(g) + HCO3
- + 1/5H+ + 2/5H2O (1)
Nitrous oxide (N2O) is a byproduct of the denitrification process that is released through
incomplete reduction of the NO3- to N2. N2O and N2 exist as dissolved gases in the
ground water. If the water moves into the unsaturated zone, some of the N2O and N2 will

6
be lost to off-gassing (Lamontagne, 1995). Measurements of denitrification rates have
generally been accomplished by measuring its products: N2O and N2 gases. An
alternative method of measuring denitrification by N2 production is necessary due to the
high background concentration of atmospheric and aqueous N2, which makes detecting
small increases of the gas due to denitrification difficult. Consequently, methods have
been developed in which acetylene (C2H2) is added to sediments, which inhibits the
enzymatic reduction of N2O to N2. Denitrification potential rates are determined based on
the production of N2O is measured instead of measuring direct N2 flux.
Sediment conditions influencing the uptake of nitrate by heterotrophic
denitrification include 1) hypoxic conditions, 2) the amount of organic matter available in
a consumable form, 3) pH, 4) the presence of nitrate, and 5) temperature. Dissolved
oxygen is thermodynamically preferred as a terminal electron acceptor over nitrate by
microbes, in that nitrate reduction is not expected to occur when dissolved oxygen (DO)
is present (Tesoriero et al., 2000). Denitrification ideally occurs in water with a decline in
redox potential (approximately Eh= +250 mV) at pH 7 and 25oC. At this redox potential,
the water contains no dissolved oxygen, and nitrate is used as the electron acceptor
(Freeze & Cherry, 1979) by those organisms capable of doing so. Organic carbon is the
most common electron donor, although reduced inorganic species may also act as
electron donors for denitrification for a small subset of autotrophs. Sulfur and less
commonly, ferrous iron (Fe2+) from pyrite (FeS2) oxidation can also be possible electron
donors for denitrification (Tesoriero et al., 2000) by the following mechanisms:
5FeS2 (pyrite) + 14 NO3- + 4H+ 5 Fe2+ + 7N2 + 10SO4
2- + 2H2O (2)
5Fe2+ + NO3- +7H2O 5FeOOH (goethite) + 1/2N2 + 9H+ (3)

7
The importance of organic carbon in controlling the occurrence of denitrification
in riparian zones is well documented (Starr & Gillham, 1993). The amount and type of
organic matter can affect denitrification, in that higher rates of denitrification have been
found to occur with more labile forms of organic matter (Pfenning & McMahon, 1996).
The availability of labile organic matter is also important for microbial respiration, which
consumes oxygen creating hypoxic conditions that allows denitrification to occur. In
areas adjacent to agricultural fields where there is a ready source of nitrate to the ground
water flow path, it is often organic matter content and redox conditions that limit
denitrification rates (Hedin, 1998). Finally, denitrification rates usually peak during the
spring, when there is a concurrence of high temperature and nitrate availability. Despite
high temperatures during the summer, nitrate concentration usually decreases due to
lower run off and increased macrophytic uptake (Pattinson et al., 1998).
Spatial gradients of biogeochemical regulators such as NO3-, O2, and organic
matter have shown to be steep in riparian zones, and processes such as denitrification can
be concentrated very close to the ground water/ stream water interface (Hedin, 1998).
The pattern of ground water redox zones near discharge areas is poorly known, but has a
major effect on the transformation of nitrate near the stream channel (Bohlke et al.,
2002).
Characteristics of the Ground Water- Surface Water Interface
In agricultural areas, such as the Cobb Mill Creek watershed, high levels of nitrate
occur along a shallow ground water hydrological flow path from the hillslope to the
stream, ultimately passing through the ground water- surface water interface. The

8
hyporheic zone is defined as the component of the ground water- surface water interface
surrounding a stream that contains water originating both from the neighboring aquifer
and stream water (at least 10%) (Hinkle, 2001; Triska, 1989). Based on previous
conservative tracer studies, Cobb Mill Creek is not thought to have a distinct hyporheic
zone (data not shown). The present study examines the ground water- surface water
interface extending beyond the hyporheic zone.
The ground water- surface water interface can display disproportionately high
rates of biogeochemical activity and serve as a control point within the riparian area by
affecting the amount and form of nutrients that are transported along the paths of nutrient
flux (Hedin, 1998). The ability to predict the extent to which the ground water/ stream
water interface will affect the nitrate flux depends on an understanding of how
biogeochemical processes are linked to hydrologic processes (Hedin, 1998). The
interaction of thermodynamic constraints on microbial communities and the input of
supplies of electron donors (oxidizable dissolved organic carbon) and electron acceptors
(NO3-) through subsurface flow paths control the transformation of nitrate (Hedin, 1998).
The terrestrial-aquatic interface is considered a “hot spot” of biogeochemical activity
attributed to its location where hydrological flow paths converge and consequently mix
essential substrates producing high reaction rates (McClain et al., 2003). Saturated
sediments beneath and beside streams, where there is a movement of upwelling deep
ground water carrying NO3-into shallow, organic-rich, reducing substrate are ideal sites
for high rates of denitrification (McClain et al., 2003).
Nitrogen transformations and retention ideally occur under reducing conditions
where the hydraulic residence time is great and where saturated conditions persist (Cirmo

9
& McDonnell, 1997). At the near-stream area, the water table is typically at, or near, the
surface for much of the year, and sediments are often saturated (Cirmo & McDonnell,
1997). Water movement through the ground water- surface water interface is slowed by
fine textured muds near the sediment surface. This resistance lends to increased residence
time for the discharging ground water (Mills et al., 2002).
From the direction of the open channel, there is a frequent input of readily
assimilated organic carbon by deposition and burial of particulate organic carbon in
reworked sediment, or by advection of dissolved organic carbon in the stream that flows
through the hyporheic zone (Hinkle, 2001). Near-stream zones that mix with surface
water organic carbon sources that are labile have been shown to support higher
denitrification rates than deeper streambed sediments (Pfenning & McMahon, 1996).
Variability at the Ground Water- Surface Water Interface
There can be great differences among the characteristics of the ground water-
surface water interface in different streams. The interaction between ground water and
surface water is dynamic in both time and space, and varies with spatially heterogenous
aquifer properties, stream-bed topography, and hydraulic gradients between the two
zones (Hinkle, 2001). There are also great differences between denitrification rates
within streams in which the chemistry of subsurface waters and ground water, microbial
processes, and hydrological flow paths can change over short distances of less than a
meter (Hedin, 1996). From a channel perspective, the depth and lateral extent of
advective exchange in the hyporheic zone are determined by geomorphological features
of the surface channel such as roughness, permeability, and pool-riffle sequence (Triska,

10
1993). The extent of hyporheic change can be determined by conservative tracer
experiments. High variation in tracer travel times can indicate heterogeneity of the
permeability of the sediments in the hyporheic zone (Triska, 1993).
Knowledge of the complexities of the biogeochemical interaction between ground
water and surface water in the hyporheic zone has evolved over the last two decades
(Hinkle, 2001). Along a stream reach, most of the water and dissolved nutrients usually
represents the upstream environment (Triska, 1993). But, there is also an incremental
input of ground water to the stream by two dominant flow paths of ground water. There
can be great variability along the hyporheic zone where there is a rapid upwelling of
deeper ground water in areas near the stream and a less rapid transport of shallow soil
water from inland environments toward the stream (Hedin, 1998). Ground water and
stream water can exchange both vertically in the subchannel and laterally at the banks
under the riparian zone. During hyporheic exchange, dissolved nutrients become
available to terrestrial biota and then to the stream channel community. Solutes can also
be transiently stored by physical geomorphology of the channel. Retention can span from
long term, as in the case of burial of particulates for years, or short term, as in the storage
of solutes in slow moving water (Triska, 1993).
Spatial Profiles of Solutes at the Ground Water- Surface Water Interface
Despite great heterogeneity, there are general physical, chemical, and biological
gradients between oxidized and reduced near-stream environments. Hedin (1996)
adopted a thermodynamic approach to evaluate the biogeochemical variability of the
ground water- surface water interface of a riparian wetland. Low oxygen conditions are

11
found in sediment layers with high organic matter content. Organic matter fuels
respiration, which consumes oxygen and creates hypoxic conditions. There is an expected
trend of decreasing dissolved organic carbon (DOC) under increasing oxidized conditions
due to its rapid consumption by aerobic respiration. Nitrate is typically higher in aerobic
interstitial water than either channel or ground water in that under low oxygen conditions
it is reduced by denitrification (Triska, 1993). With the discharge of aerobic, nitrate-rich
ground water to streams, vertical concentrations of nitrate can increase as a function of
depth within the stream-sediment environment, with much of the nitrate reduced close to
the ground water- stream water interface (Hedin, 1998). Ammonium concentrations also
typically increase in aerobic interstitial water. Under oxic conditions, nitrification
converts ammonium to nitrate. This process can act as a sink for oxygen, and as DO is
depleted, facultative anaerobes, like denitrifiers, can switch to nitrate as the terminal
electron acceptor in the oxidation of organic carbon (Triska, 1993). Heterogeneity in DO
can be caused by microbial metabolism in pockets of organic matter stored in stream
sediments, forming patches of an oxygen-depleted habitat surrounded by oxygenated
environment (Triska, 1993). High rates of denitrification activity have been found to
occur in localized “hot spots” that display a patchy distribution in soils and sediments
(Hill, 1996). Because the biogeochemical reactions are intimately linked to hydrological
flow paths within the ground water- surface water interface, understanding hydraulic
head and solute concentration distributions at a high resolution are important in
determining nutrient fluxes that control denitrification rates over these short distances
(Duff et al., 1998).

12
Preliminary Assessment at Cobb Mill Creek
The discrepancy between high nitrate concentrations in the stream sediments (10-
20 mg N L-1) and low nitrate concentrations in stream water (1-2 mg NO3--N L-1)
prompted the examination of NO3- removal in the stream sediments before the ground
water discharges into Cobb Mill Creek (Chauhan and Mills, 2002; Mills et al., 2002).
Along the experimental hillslope, fertilizer- derived nitrate is transported along ground
water flow paths from an upland agricultural field, through the riparian hillslope to the
ground water- surface water interface, and, thus, into Cobb Mill Creek. Stream and
ground water samples were collected from five stream-bank piezometer nests located
immediately adjacent to Cobb Mill Creek (N1-N6) and one in-stream piezometer nest
(S1) in October 2000 (Figure 1). All stream-bank piezometer nests were set back
approximately 0.5 m from the edge of the stream except for N3 and N4 which were about
1 m upslope along the bank. The distribution of NO3-N in the riparian zone near the
stream indicated that most of the nitrogen removal occurred in the last meter of stream
sediment before the ground water discharges to the stream. There was a substantial
decrease of NO3--N with elevation in the piezometer nests. Since the nitrate transported in
the ground water from the hillslope remained at high concentrations close to its discharge
point, it is suggested that the ground water remained oxic along its flow path. The thin
ground water- surface water ecotone seemed to be effective in the removal of nitrate.
Biological removal of nitrate at this interface requires hypoxic, organic rich sediments;
however, these sediments were surrounded by oxic stream and ground water.

13
mg NO3--N L-1
0 5 10 15 20 25 30
Elev
atio
n AS
L (m
)
0.0
0.2
0.4
0.6
0.8
1.0
1.2
1.4
N1N3N4 N5N6S1
stream sample
stream piezometer
bankside piezometers
stream bed elevation
Figure 1. Ground water and stream NO3
--N concentration collected in October 2000 from the stream bank immediately adjacent to Cobb Mill Creek.
Research Objectives
The objectives of this research were to determine the contribution of, and controls
on denitrification in removing nitrate at the ground water- surface water interface before
it reached the open channel of Cobb Mill Creek under base flow conditions. The major
hypothesis tested was that denitrification is the biogeochemical pathway that removes the
majority of ground water nitrate in the near stream environment. To address this
hypothesis, I investigated the following questions: 1) In the near stream zone, what are
the vertical and horizontal profiles of denitrification potentials? 2) Are the denitrification
potential profiles correlated to the concentration profiles of their biogeochemical
controllers such as NO3-, O2, and organic carbon in the near-stream environment?

14
METHODS
Field Site Description
The study site is located along a non-tidal portion of Cobb Mill Creek, a small
sandy-cobble first order stream in Northhampton County, on the Eastern Shore of
Virginia (Figure 2). The watershed is approximately 496 hectares, and it drains to
seaside lagoons. Agriculture is substantial within the watershed accounting for
approximately 34.2% of the land cover while 62.3% is forested (Chauhan, unpublished).
Downstream of the creek, land cover includes marshes that lead to the Sand Shoal
Channel. Cobb Mill Creek is surrounded by an oak - maple - pine riparian forest. Surface
relief is generally low, with slopes ranging from 0-2% over most of the watershed, with
greater slopes along regions immediately adjacent to the streams. Upland soils are
dominated by Bojac sandy loam, which is a well-drained soil with high permeability in
the subsoil and in the substratum. Molena loamy sand dominates along Cobb Mill Creek
(Soil Survey of Northhampton County, Virginia, 1989). These permeable soils are
underlain by the shallow, unconfined Columbia aquifer, which consists of an eastward
thickening wedge of unconsolidated sand and gravel (U.S. EPA, 1997). The sediments
were deposited on a crystalline bedrock platform, which has subsided since early
Cretaceous time. The Columbia aquifer is underlain by the Yorktown- Eastover confined
aquifer at a depth ranging from 8-20 meters below ground elevation (Richardson, 1992).
The deeper confined aquifer is recharged by water from the surficial aquifer. The
sediments of the Yorktown-Eastover aquifer generally consist of shelly sands while the

15
confining units are silts and clays. The total recharge to the Columbia aquifer (including
Accomack and Northhampton counties) is estimated to be 257 Mgal/day. Although most
of this recharge is discharged into either the Atlantic Ocean or the Chesapeake Bay, an
estimated 11 Mgal/day leaks through the first confining unit and into the upper portion of
the Yorktown-Eastover aquifer (U.S. EPA, 1997). This generally occurs along the narrow
Experimental hillslope
W at ershed Boundary
N
Figure 2. Map showing location of the experimental field site at Cobb Mill Creek on the Eastern Shore of Virginia near Oyster, VA.
zone called the “spine” in the center of the peninsula. The shallow, sandy unconsolidated
sediments of the Columbia aquifer allow for possible contaminants originating from
surrounding agricultural fields to leak to the Yorktown Eastover aquifers, especially
along the “spine” of the Delmarva Peninsula (Reay, 2001).

16
Determination of the Hydrological Gradient
During the summer of 2001, a series of shallow wells and piezometers were
installed in order to sample within and through the anaerobic portions of the riparian zone
along Cobb Mill Creek (Figure 3). Piezometers consist of 1-inch well casing with ports
in the sides near the capped bottom. Eleven piezometers nests were placed along and
near the stream bank and in the center of the streambed. Each nest contains one ground
water well screened across the water table, and, in most cases, three piezometers that
open at discrete points between 0.2 to 0.8 m below the water table. The clusters were
placed in a transect parallel to the stream and in two short transects up the hillslope
perpendicular to the stream. The nested design of the piezometers allows for
determination of both the horizontal and vertical components of the subsurface flow near
the stream. These piezometers were used to directly measure vertical head gradients and
as sampling ports to draw water from several depths for chemical analysis. The vertical
head gradient was determined for each piezometer nest. The gradient was determined by
dividing the difference in elevation above sea level (m) of the water level between
individual piezometers in the nest that were open at different depths (dh) by difference in
elevation above sea level (m) of the hole between the piezometers (dz). Negative vertical
head gradient (when the water level in the deeper piezometer is higher (close to 0masl)
than the water level in the shallower piezometer) indicated an upward flow of ground
water. The longitudinal gradient between two stream piezometers was also determined.
The gradient was determined by dividing the difference in elevation above sea level (m)
of the water level between the two piezometers that were open at approximately the same
depth (dh) by the longitudinal distance between the piezometers (dz). The ground water

17
wells were used to track changes of the water table elevation through time. The latitude,
longitude, and elevation of the piezometer nests and the streambed were located using a
total station referenced to permanent monuments located with Global Positioning System
(GPS). The general hydrological flow paths from the hillslope to the stream were
determined from the vertical head gradients and the water table elevation.
Experimental Design to Determine Spatial Profiles in the Stream Sediments
Vertical and horizontal distributions of water quality and denitrification potential
were measured along three cross sections in the stream sediments stretching across the
stream channel and down to approximately 60 centimeters below the sediment surface.
Figure 3. Location of piezometer and well nest along the hillslope and in Cobb Mill Creek. Contour line elevations depict elevation above sea level (m).

18
The three cross sections were positioned across the stream in line with the bank-side
piezometers, N1, N4, and N5 (Figure 4). Pore water samples used to determine vertical
and horizontal solute profiles were collected first near the sediment surface at
approximately 2 cm deep and then at 10-cm increments down to approximately 60 cm
below the sediment surface from intact sediment cores. Cores were spaced approximately
0.5 m apart. The cores were collected using PVC cylinders (5.1 cm inner diameter, 120
cm length) driven into the sediment. The cylinders were filled with stream water above
the intact sediment, sealed with a rubber stopper, and carefully removed from the
streambed. The bottom of each core was then sealed with an additional rubber stopper.
To prevent water leakage during transport, the stopper and the tube were sealed with a
thick bead of waterproof caulking (Plumber’s Goop®), which was held in place by a tight
wrapping of duct tape while it cured. In the laboratory, evenly spaced, ¾ inch ports were
drilled at 10-cm intervals along the length of each core tube. The ports allowed for
sampling of pore water and for determination of potential denitrification rates along a
vertical gradient. The solute concentrations and denitrification potential rates were
measured during four intensive sampling dates: July 11, August 3, August 28, and
October 23, 2003.
Mini Drive Point Piezometer
Spatial profiles of water quality in the streambed from the surface to a depth of
approximately 20 cm were determined at a 2.5-cm resolution using a mini drive point
sampler (Duff et al., 1998). Measurement of the spatial distributions of the solutes of
interest in highly permeable stream sediments requires close interval sampling without

19
North
1 2 3
4 5 6
7 98
Cross section 1
Cross section 2
Cross section 3
FLOW
Figure 4. Experimental Design: Intact sediment cores taken in three cross sections across Cobb Mill Creek, Oyster, VA.
disturbing natural mixing processes (Duff et al., 1998). Historically, diffusion
equilibrators and cores have been used to measure solutes in pore water. Diffusion
equilibrators are effective for evaluating pore water transported at low velocities,
primarily by diffusion (Duff et al., 1998). However, in permeable sediments, velocities
can be high. Cores can disturb natural gradients and redistribute pore water during
insertion and removal. Duff et al. (1998) devised a new method for collecting pore water
samples that was less destructive. The mini drive-point piezometer (MDPP) technique
collects pore water from streambed sediments at a 2.5-cm vertical resolution to a depth of
approximately 20 cm (depending on stream sediments) simultaneously without disturbing

20
the surrounding pore water. The sampler has six small diameter (1/8 inch) steel drive
points arranged in a 10-cm diameter circular array on a tripod. Steep vertical gradients at
a fine resolution have been measured with the MDPP in the top 20 cm of the streambed.
Below 20 cm, the vertical solute gradients seem to be more uniform in the streams
examined with the device (Duff et al., 1998).
Sampling and Analysis of Solutes
Ground water samples for dissolved inorganic constituents were collected with a
peristaltic pump from the wells and piezometers through silicone vinyl tubing to 25-mL
centrifuge tubes after purging for at least 3 well volumes. In the laboratory, samples were
filtered with a Gelman Sciences® 0.45 µm membrane filter using a vacuum pump. For
samples collected before May 2003, nitrate plus nitrite-nitrogen was determined by a
cadmium-reduction colorimetric method. A sample of 25 mL of the ground water was
shaken with approximately 0.2 mg of powdered cadmium for 5 minutes in 50-mL
centrifuge tubes to reduce nitrate to nitrite (Jones, 1984). The nitrite concentration was
determined by treating 10 mL of the reduced sample with 2.5 mL sulfanilic acid solution
(27.2 g of KHSO4 and 3.46 g of sulfanilic acid in 1L deionized water) for 10 minutes.
Next, the solution was coupled with 2.5 mL of N-(1-naphthyl) ethylenediamine (0.04%)
for 20 minutes to produce a highly colored azo dye. The final solution was measured by
a spectrophotometer at a wavelength of 550 nm (Montgomery & Dymock, 1961). A
series of standards, in which NO3- -N concentration was 0.1, 0.5, 1.0, 1.5, 3.0, and 6.0 mg
L-1, were run along with every set of samples. Results obtained from the standards were
used to determine ion concentrations in the samples.

21
Ground water samples collected after May 2003, were analyzed for nitrate,
chloride, and sulfate on a Dionex® Ion Chromatograph using a Gilson® 234 Autoinjector
and a Dionex IonPac AS4A® 4 x 250 mm Analytical Column. Samples were first filtered
with 0.45 µm disposable syringe filters. The eluent solution consisted of 1.44 mM
Na2CO3 and 1.36 mM NaHCO3 and was pumped at a flow rate of 2 mL min-1. The
regenerant solution used was 0.028 N H2SO4. The eluent and regenerant were pressurized
with helium gas with the valve pressure at approximately 70 psi. A series of standards in
which each ion concentration was 1.0, 5.0, and 10.0 mg L-1 were run along with every set
of samples. Results obtained from the standards were used to determine ion
concentrations in the samples.
Pore water samples were collected from intact sediment cores from each sampling
port using a 3-cm3 syringe and a 20-gauge needle. Pore water from both the intact cores
and the mini drive point piezometer were filtered with 0.45 µm disposable syringe filters
and analyzed for NO3-, and Cl-, and SO4
2- (by ion chromotography). Standards were used
to determine ion concentrations as described above. To determine sediment water
content, a portion of the sediment collected from the subsamples was dried overnight at
500oC and weighed. Total organic carbon in the bulk sediment was determined by weight
loss on combustion of the dried samples at 500oC for at least 5 hours. Separate intact
sediment cores were also collected to determine in situ redox potential measured by
platinum electrode potential (PtEP). An Accumet® Calomel reference electrode was held
in the surface water in the top of the core and a platinum wire was inserted into the
sediment through side ports at various depths. The reference electrode consisted of a

22
mercury/mercury (I) chloride reference element surrounded by gelled saturated KCl
solution and tipped with a porous polymer junction.
Sediment color can be very informative about the conditions at different depth
layers in the streambed. Most sediment colors are derived from the colors of iron oxides
(yellow, orange, and red) and organic matter (dark black or brown) that coat the surfaces
of soil particles (Brady and Weil, 1999). The sediment color pattern was investigated in
four cores taken to a depth of approximately 40 cm below the stream surface. The cores
were cut lengthwise and photographed. Because color changes when iron-containing
minerals in the sediment undergo oxidation and reduction reactions, sediment color can
indicate the oxygen conditions of the upwelling pore water. Under oxic conditions, iron
coatings are oxided and are typically high-chroma colors (red or brown), but prolonged
anaerobic conditions can cause the iron oxide coatings to become chemically reduced,
changing high-chroma colors to low-chroma (gray) colors.
Denitrification Potential
Potential denitrification rates were determined from N2O accumulation in
laboratory incubations of streambed sediments amended with acetylene (Tiedje, 1982).
The sediment samples were vertically distributed (2 cm below sediment surface and then
at 10 cm increments) along the length of the sediment cores and were collected using a
10-cm3 syringe. The sediments samples were placed in 60-mL serum bottles with 15 mL
of artificial ground water and capped with a septum and crimped shut with a metal cap.
Artificial ground water was made to consist of the following salts dissolved in 1 L of
deionized water: 60 mg MgSO4•7H2O, 36 mg NaHCO3, 36 mg CaCl2, 25 mg

23
CaSO4•2H2O. Nitrate was not added to the sediment slurries. In situ pore water in the
sample was the only source of nitrate. The sediment slurry was made anaerobic by
bubbling with N2 gas through a 22-gauge spinal needle for 5 minutes. Five percent
acetylene was injected into the sediment suspension with a 20-gauge needle. The bottles
were shaken on a rotary shaker and periodic samples of the headspace were withdrawn
for analysis. N2O production was determined on a Varian CP-3800® Gas Chromatograph
using a 63Ni electron capture detector and a HP- Plot Q silica capillary column (30 m in
length, 0.53 mm ID, 40 µm film thickness). The specific settings of the GC method
include:
Front Injector (type 1079) Oven: 50oC Flow/Pressure Setting: Front EFC 10.8 psi at constant flow Column Oven: 30oC ECD Detector Oven: 300oC The dry weight of the sediment was determined after the assay was completed. The
volume of sediment added to each serum bottle was also recorded. A control sample was
tested that included artificial ground water only, with no added sediment.
A standard curve was created for the determination of the mass of N2O produced
by denitrifying bacteria from measured peaks on the gas chromatograph (Figure 5). Pure
nitrous oxide was diluted with N2 gas to create three different concentrations (v/v): 1%,
1000 ppm, and 100 ppm. The peaks of five consecutive volumes (0.1 mL to 0.5 mL) of
the diluted standards, 100 ppm and 1000 ppm, were measured on the GC and used to
create the range of mass for the standard curve below. The area of the nitrous oxide peak
from the GC (mVolts*sec) was converted to mass of N2O in nmol using the ideal gas
law, where 1 mole = 22.4 liters or 1 mL = 0.0446 mmole = 44.6 µmol = 44600 nmole.

24
The minimal detectable mass was approximately 5 nmoles (1 mL of 100ppm standard).
This standard curve was used for all four sampling dates.
y = 8.0154xR2 = 0.9957
0
50
100
150
200
0 5 10 15 20 25
nmol N2O
Peak
Are
a (m
Vol
ts*s
ec)
Figure 5. Standard curve to determine mass of nitrous oxide (nmol) from peak area collected from the gas chromatograph.
Once the mass of the injection sample was determined, the concentration of the
injection sample was determined by dividing the mass (nmol) by the injection volume
(usually 0.5mL). The injection concentration was then used to determine the total N2O
production in the headspace and dissolved N2O in the liquid phase. Based on Tiedje
(1982), total N2O mass (M) can be calculated using the Bunsen absorption coefficient
according to the equation:
M = Cg (Vg + Vl α) (4)
where M is the total mass of N2O in the water plus gas phases (nmol), Cg is the
concentration of N2O in the gas phase (nmol/mL), Vg is the volume of gas phase (mL), Vl
is the volume of liquid phase (mL), and α is the Bunsen absorption coefficient. In the
present case, α =0.544 at 25 oC was used (Tiedje, 1982).

25
The potential denitrification rate was determined by dividing the total mass of
N2O produced in the serum bottles by the incubation time and the sample volume, in
which the rate was expressed in units of nmol N2O mL sediment-1 hr-1. In addition, the
dry weight of the sediment was determined to compare denitrification rates found in this
study to other studies in the literature (nmol N2O g DW-1 hr-1). Also, the denitrification
potential expressed as nmol N2O mL sediment-1 hr-1 was converted to µmol N m-2 h-1 to
compare the observed rates to those in other studies that express their rates in those units.
The conversion was done by multiplying the N2O production rate in the subsample
collected in each depth segment by the total area for that segment in the core (πr2h),
which resulted in the N2O production for the total volume of the sediment for each depth
segment. The N2O production for each depth segment was summed to determine the N2O
production along the entire length of the core. Finally, the units were converted to µmol
N m-2 h-1.
hrmmolNcmhcm
*mcm10
nmolN10molN 1
ONmolN 2mol*)(*)25.2(
hrsediment mL0N nmol
22
24
32
2 µµ=∗∗∗∏∗
∗∑ (5)
Mass Balance between the Potential Nitrate Removal Rate by Denitrification and the Observed Nitrate Loss Rate
First, the potential nitrate removal rate was determined based on the production of
N2O by denitrification in the sediment slurries in the acetylene block assay. The rate of
N2O production was converted to the rate of NO3- removal based on the assumption that
denitrification in the sediments was complete, such that all N2O would be converted to
N2. It was also assumed that the acetylene assay completely blocked N2 formation in the

26
denitrification process. Based on these assumptions, the N2 production in equation 1 can
be replaced by N2O production. Using the coefficients in equation 1, 2 mol of nitrate are
removed for every mol of N2O produced. Next, the volume of saturated sediment was
converted to a volume of pore water by multiplying the bulk volume by an average
porosity value of 0.35. The equation below (6) converts the rate of N2O production to the
potential rate of nitrate removal.
=∗∗∗∗∗∗∗ L
1000mlporewater 0.35ml
sediment 1mlg
1000mgmol
N 14gON mol
N 2molnmol10
1molhrsediment ml
ON nmol2
92
hr*L
mgNO3−
(6)
This potential nitrate removal rate was calculated for each depth segment and then
summed for all segments in the core.
Next, the observed decrease in nitrate concentration was converted to a loss rate
using the advection dispersion equation; however, dc/dt was replaced by R, which
represents a nitrate loss rate:
2
2
*xcD
xcu
dtdc
∂∂
+∂∂
∗−= , 2
2
*xcD
xcuR
∂∂
+∂∂
∗−= (7)
In this equation, u is the average linear velocity (3 × 10⁻⁴ cm sec-1) determined by
dividing the Darcy velocity (1.04 × 10⁻⁴ cm sec-1) by the porosity (0.35). The Darcy
velocity was determined by a laboratory biological simulation experiment in which the
flow rate was altered until the difference in output and input nitrate concentration
matched that of field conditions (Gu, unpublished data). Dispersion (D*(∂c2/∂x2)) in the
sediment was assumed to be negligible compared to the advective flow of discharging

27
ground water. To determine the observed nitrate loss rate along the length of the entire
core (∂c/∂x), the equation was rearranged. The advection equation was multiplied by dx
(8). Then, the equation was integrated (9), followed by taking the derivative and solved
for the nitrate concentration (c), which resulted in the line equation (10):
cuxR ∂∗−=∂* (8)
AcuRx += ** (9)
Bx
uRc +=
, (10)
where B is a constant. The concentration of nitrate at each depth segment in the cores was
graphed, and a linear regression line was fit to the data. The slope of the line (R⋅u-1) was
multiplied by the average linear velocity (u), which resulted in the observed nitrate loss
rate (R). Subsequently, the potential nitrate removal rate based on N2O production was
compared to the observed nitrate loss rate in the sediment cores.

28
RESULTS
Ground Water Flow Paths to Cobb Mill Creek
Sampling of the water table elevation, hydraulic head and nitrate concentrations in
the ground water well and piezometer nests along the hillslope and the stream began in
April 2001 and continued to October 2003. The slope of the water table elevation
followed the ground water surface contours along a lateral transect from the hillslope
(well N9) to the stream, except at bankside wells N3 and N1 (Figure 6). The water table
was generally level in the wells at the bank of the stream although these wells were on a
slope. The depths of the mean water table below ground level at hillslope positions N9,
N7, N3, and N1 were 1.80, 1.34, 0.93, and 0.56 meters, respectively.
Distance (m from Stream Piezometer, S1)
0 2 4 6 8 10 12 14
Elev
atio
n (m
ASL
)
0
1
2
3
4
Ground SurfaceMax Water TableMean Water TableMin Water Table
N1 N3 N7 N9
Figure 6. Water table gradients and the ground surface contour along a transect up the hillslope. The maximum, mean, and minimum water table depth from April 2000 to October 2003 is shown.

29
Vertical hydraulic head gradients were determined in the nested piezometers
along the hillslope and in the stream (Table 1). These gradients describe only shallow
ground-water flow (less than one meter). The stream piezometer nests, S1 and S2,
showed an upward hydrologic flow path from the ground water to the stream indicated by
a negative vertical head gradient. The bankside piezometer nests, N1 and N3, also
showed an upward flow of ground water for the majority of the sampling dates.
Alternately, vertical head gradients in the bankside piezometer nests, N4, N5, and N6
showed a less consistent pattern but indicated that more downward flow occurred in these
locations compared to N1 and N3, despite their close proximity. Vertical head gradients
at N7, located near the top of the hillslope, indicated that strong downward flow occurred
at this location. The negative head gradients in the stream piezometers indicated there
was a deeper flow path that discharged vertically into the stream. The data are consistent
with the classical conceptual model of subsurface flow discharging to a stream from a
hillslope (Hubbert, 1940). Longitudinal gradients were also determined between two
stream piezometers, S1A and S2B, which were placed at similar depths underground, 60
and 62 cm, respectively (Table 2). The piezometers were 8.4 meters apart. The vertical
head gradients were approximately a magnitude greater than the longitudinal head
gradients indicating that the upward advective flow of the discharging groundwater was
stronger than the downstream or longitudinal subsurface flow.

30
Table 1. Vertical head gradients for various sampling dates for nested piezometers at three depths in most cases (A: shallowest, B: mid C: deepest depth) along the hillslope (N1- N7) and in the stream (S1 and S2). For piezometer depths see Table A-2 in Appendix.
Date Piezometer 5/31/01 6/15/01 7/3/01 8/17/01 5/13/02 6/5/02 6/7/02 8/22/02
S1 A:B N/A -0.034 -0.073 -0.073 -0.050 -0.054 -0.038 -0.042 S2 A:B N/A N/A N/A 0.000 -0.071 -0.059 -0.065 -0.076 N1 A:B -0.003 -0.038 -0.038 -0.003 0.041 -0.228 -0.141 -0.038 N1 B:C -0.040 -0.012 -0.012 -0.040 -0.052 -0.061 -0.055 -0.055 N3 A:B -1.288 -1.401 -1.458 0.915 -0.017 -0.373 -0.260 -0.638 N3 B:C -0.131 -0.131 -0.101 -0.071 -0.042 -0.071 -0.024 -0.101 N4 A:B 0.579 0.579 0.711 -0.053 -0.053 -0.011 0.084 -0.053 N4 B:C -0.604 -0.658 -0.738 0.198 0.059 0.016 0.021 0.037 N5 A:B -0.767 -0.700 -0.700 -0.300 -0.020 -0.100 -0.073 0.167 N5 B:C -0.017 0.069 0.069 0.156 0.065 0.039 0.030 -0.017 N6 A:B 0.006 -0.108 -0.136 0.006 -0.011 0.040 -0.278 0.062 N6 B:C 0.023 0.023 0.023 0.138 0.121 0.023 0.339 -0.006 N7 A:B N/A 1.000 1.000 3.143 2.000 1.571 1.857 1.571 S1 A:B -0.057 -0.149 N/A -0.023 0.023 -0.073 -0.073 -0.103 S2 A:B -0.076 -0.059 N/A -0.088 -0.059 -0.088 -0.059 -0.059 N1 A:B -0.279 -0.203 -0.138 -0.186 -0.290 -0.021 -0.228 -0.193 N1 B:C 0.795 -0.046 -0.055 -0.040 -0.104 -0.069 -0.127 -0.127 N3 A:B -0.282 -0.328 -0.011 -0.096 -0.130 0.266 -0.311 -0.073 N3 B:C -0.089 -0.077 -0.089 -0.107 -0.161 0.524 -0.089 -0.042 N4 A:B -0.542 -0.032 -0.021 -0.047 -0.079 0.605 -0.105 0.105 N4 B:C 0.519 0.422 0.422 0.016 0.011 0.037 0.037 0.037 N5 A:B -0.100 -0.133 -0.107 -0.113 -0.167 -0.033 -0.167 -0.127 N5 B:C 0.091 0.043 0.048 0.074 0.048 0.026 0.048 0.039 N6 A:B 0.011 0.017 0.023 -0.006 -0.006 0.062 0.034 0.006 N6 B:C 0.046 0.000 -0.006 0.017 0.006 0.080 0.052 0.069 N7 A:B 1.000 1.429 1.000 1.286 1.000 1.000 1.714 2.000

31
Table 2. Longitudinal head gradients between two stream piezometers, S1A & S2B, at similar depths below the stream surface (60 and 62 cm, respectively) for various sampling dates. The piezometers are 8.4 m apart. Piezometer 8/17/01 5/13/02 6/5/02 6/7/02 8/22/02 9/17/02 S1A: S2B -0.008 -0.005 -0.006 -0.005 -0.005 -0.005 Piezometer 10/28/02 12/19/02 2/3/03 7/8/03 9/28/03 10/26/03 S1A: S2B -0.008 -0.004 -0.003 -0.005 -0.005 -0.007
Ground Water and Stream Nitrate Concentrations
The measured nitrate concentrations in the stream piezometers were generally
lower in the Fall 2002 than samples collected in the Summer -Winter of 2003 (Table 3).
The general pattern of increasing nitrate concentration with depth (decreasing elevation)
was illustrated in every sampling month. The exception to this trend was one piezometer
nest along the stream bank, N4. Nitrate concentrations were lower with depth in this case,
although the piezometers were placed at the same depth below ground as the adjacent
bank side piezometer nests. The general pattern was shown especially in the stream
sediments in which the nitrate concentration of the upwelling ground water that was
collected from stream piezometers was on average greater (9.01 mg NO3--N L-1) than the
open channel nitrate concentrations (2.77 mg NO3--N L-1).
Ground water sampling on October 26, 2003, illustrated the general pattern of
increasing nitrate with depth, again with the exception of nest 4 (Figure 7). The trend was
especially evident when comparing the deeper upwelling ground water collected from the
stream piezometers nests, S1 and S2, and the stream nitrate concentrations. The ground
water collected from the two piezometers at station S1 (40 and 62 cm below the stream

32Table 3. Nitrate Concentration (mg NO3--N L-1) of Groundwater collected from CMC Piezometer Nests for all Sampling Dates. Error is reported as standard error of the mean (SEM). Depth below ground surface is generally shown by piezometer letter: A: Shallowest B: Mid C: Deepest Depth. For piezometer depths see Table A-2 in Appendix A.
Method:
Piezometer 9/17/02SEM-
9/17/02 10/28/02SEM-
10/28/02 11/20/02SEM-
11/20/02 12/19/02SEM-
12/19/02 7/11/03SEM-
7/11/03 10/26/03SEM-
10/26/03 11/30/03SEM-
11/30/03 12/19/03SEM-
12/19/03
N1A 2.22 0.00 1.34 0.00 1.07 0.15 0.21 0.21 n/a n/a 3.11 0.07 4.81 0 2.40 0.35
N1B 5.54 0.14 1.53 0.10 4.28 0.05 2.67 0.48 n/a n/a 7.49 1.25 9.98 0 10.97 0.49
N1C 7.07 2.00 1.97 0.11 6.47 1.89 4.61 0.62 n/a n/a 10.69 0.33 11.92 0 13.05 0.13
N3A 6.93 0.00 1.76 0.33 1.25 0.08 6.33 0.00 n/a n/a 6.98 0.00 n/a n/a 6.56 0
N3B 7.02 0.92 1.88 0.13 1.51 0.25 1.99 0.60 n/a n/a 5.71 0.79 8.71 0.1 11.58 0
N3C 7.70 0.59 2.46 0.35 3.20 0.24 5.18 1.09 n/a n/a 9.47 0.59 11.91 0 13.93 0.1
N4A 6.31 0.00 n/a n/a 1.63 0.17 1.55 0.43 n/a n/a 2.26 1.27 1.34 0 4.25 0.5
N4B 3.46 0.00 2.99 0.28 0.71 0.19 0.13 0.07 n/a n/a 0.69 0.02 0.81 0 1.60 0.1
N4C 2.55 0.22 1.68 0.18 0.59 0.05 0.00 0.00 n/a n/a 0.37 0.13 0.14 0 0.41 0.1
N5A 4.16 0.00 1.32 0.17 2.86 0.83 1.03 0.12 n/a n/a 0.64 0.07 1.76 0 1.63 0
N5B 4.86 0.36 2.25 0.39 4.73 1.06 1.62 0.22 n/a n/a 0.75 0.02 2.94 0 7.68 0.1
N5C 4.11 0.00 3.14 0.46 3.14 0.12 1.80 0.77 n/a n/a 4.12 0.53 9.68 0.1 9.56 0
N6A 7.24 0.00 2.20 0.35 4.40 0.82 1.48 0.22 0.58 0.05 1.00 0.16 4.76 0 9.67 0.2
N6B 8.93 0.50 3.07 0.12 4.44 0.84 2.02 0.07 3.20 0.19 3.02 0.45 6.36 0 9.55 0
N6C 9.26 2.18 4.18 0.94 4.02 0.42 2.48 0.26 3.36 0.16 3.37 0.45 8.88 0.1 12.72 0.3
N7A 2.24 0.25 2.70 0.39 1.61 0.03 0.40 0.31 0.95 0.49 8.59 0.59 10.68 0.1 13.37 0.1
N7B 3.57 0.05 5.98 0.57 4.89 0.70 3.39 1.04 7.20 0.19 10.31 0.53 11.48 0 13.09 0
N10A n/a n/a 2.02 0.03 1.36 0.34 0.90 0.01 2.34 0.14 4.72 1.67 6.21 0 2.77 0.1
S1A 5.99 2.22 4.72 0.48 4.67 0.14 6.22 0.48 12.55 0.11 11.48 0.04 11.29 0 11.72 0.2
S1B 4.03 0.59 7.05 0.29 5.42 0.19 6.56 0.76 13.29 0.16 11.65 0.08 11.26 0 12.32 0
S2A 7.00 0.90 6.89 0.61 5.41 0.60 8.63 0.57 13.13 0.09 9.27 0.26 11.22 0 11.83 0.1
S2B 5.09 1.21 9.60 1.08 6.34 0.58 7.45 0.41 13.35 0.05 9.36 0.02 11.31 0 12.17 0Stream at Hillslope 2.74 0.03 2.67 0.41 5.46 0.24 5.36 0.14 1.91 0.00 1.37 0.02 2.20 0 2.50 0Stream at Culvert n/a n/a n/a n/a 2.50 0.21 3.62 0.13 n/a n/a 1.02 0.23 n/a n/a n/a n/a
Note: In addition, Stream at Exp Hillslope for August 4th, 2003 (1.72 mg NO3--N L-1 (SEM= 0.18)) and August 26th, 2003 (1.65 mg NO3
--N L-1 (SEM: 0.13)).
Cadmium Cadmium Cadmium Cadmium IO N CHRM IO N CHRM IO N CHRM IO N CHRM
34

33
mg NO3- -N L-1
0 2 4 6 8 10 12 14
Elev
atio
n of
hol
e of
Pie
zom
eter
(mA
SL)
0.0
0.2
0.4
0.6
0.8
1.0
1.2
1.4
1.6
1.8
N1N3 N4 N5N6N7N10S1S2
Stream
Figure 7. Nitrate concentration in ground water collected from piezometer nests on October 26, 2003 sediment surface) had nitrate concentrations of 11.48 and 11.65 mg NO3
--N L-1,
respectively. The ground water collected from the two piezometers at station S2 (60 and
88 cm below the stream sediment surface) had nitrate concentrations of 9.27 and 9.36 mg
NO3--N L-1, respectively. The stream nitrate concentration was 1.37 NO3
--N L-1. On this
sampling event, there was an average decrease of 9.14 mg NO3--N L-1 between the
upwelling pore water, which was collected from four points in the streambed
approximately 60 cm deep, and the stream.
The nitrate concentrations in the stream piezometers were generally greater than
the adjacent hillslope piezometers (Figure 8A). The nitrate concentrations of the shallow

34
bankside piezometers ranged from 1- 3 mg NO3--N L-1 on October 26, 2003. Farther up
the hillslope, the piezometers at a similar depth below ground also had low nitrate
concentrations at stations N10 (2- 5 mg NO3--N L-1), but higher nitrate concentrations at
station N7 (8.5-10 mg NO3--N L-1). The nitrate concentration of the stream was 1.37 mg
NO3--N L-1. The nitrate concentration of the stream piezometers ranged from 9-12 mg
NO3--N L-1. These nitrate concentrations at different positions along the hillslope were
used to determine the flow path of ground water that feeds the stream. The increased
nitrate concentrations along with the negative vertical head gradients of the stream
piezometers indicated that a deeper flow path led to the stream that may have traveled
beneath the agricultural field. This deeper flow path contained higher nitrate
concentrations than the shallow flow path that followed the ground contours.
The four piezometer nests that line up the hillslope formed a cross-sectional
transect that was perpendicular to the stream (Figure 8B). In this transect, the nitrate
concentration of the stream piezometer, S1, was four times larger than that of the open
channel. In the piezometers near the bank of the stream (N1&3), the nitrate concentration
increased with depth. The nitrate concentration of piezometer N7 was similar to the
stream piezometers and may originate from the agricultural field. The evidence
suggested two distinct ground water flow paths along the experimental hillslope.
Chemical Analysis of the Pore Water from Stream Sediments
The stream piezometers, S1 & S2, showed that the nitrate concentration of the inflowing
ground water ranged from 9-12 mg NO3--N L-1 at approximately 60-80 cm beneath the
stream bed, whereas the nitrate concentration in the stream was much lower, and ranged

35
Upland Agricultural FieldA
33 37 41 45 49
56
51
46
41
36
Nor
thin
g U
TM (y
+ 4
,127
,500
m)
N1S1
N3
N4
N7
N5S2
N6
N101 m 2 m 3 m 4 m
Easting UTM (x + 417,600m)
0.01
3.0
6.0
9.0
12.0
Nitrate concentrationmg N / L
34 36 38 40 42 44 46
2.0
1.0
0
-1.0
N1
N3
N7ShallowFlow
Deeper Flow
Ele
vatio
n (m
ASL
) of p
iezo
met
e r o
p eni
n g
Easting UTM (x + 417,600 m)
Upland Agricultural Field
B
Figure 8: A: Mapview of nitrate concentrations of samples collected October 26, 2003, from piezometers in the stream and along the hillslope at Cobb Mill Creek. Piezometers are represented by circles and stacked according to depth below ground. The top circle is the shallowest. Elevation lines in meters above sea level are approximate. B: Cross-sectional view of hillslope including suggested ground water flow paths based on observed nitrate concentrations.

36
from 1- 2 mg NO3--N L-1. This is a loss of approximately 90% of the upwelling nitrate.
The intact sediment cores taken in the stream sediments (approximately 60cm below the
stream bed) showed a similar pattern, with higher NO3--N concentrations in the deeper
sediments of the core and low nitrate concentration in shallow sediments less than 10 cm
deep (Figure 9). On July 11, 2003, there was a decrease of 10.03 mg NO3--N L-1,
mg NO3--N L-1
0 2 4 6 8 10 12 14
Dep
th(c
m b
elow
sed
imen
t sur
face
)
0
20
40
60
80
7/11/038/4/038/26/03 10/26/03
Fig. 9. Depth profiles of NO3--N concentration in cores from Cobb Mill Creek taken on
the dates indicated. Error bars represent 1 SEM (n=3 cores). Stream water values are
represented as the concentration at 0-cm depth.
representing an 81.53% loss of NO3- as the ground water discharged toward the stream.
In subsequent samples, there were similar NO3- losses of 80.3%, 91.6%, and 83.5% in the
top 40-60 cm of the sediments on August 4, August 26, and October 26, 2003,

37
respectively. On average, there was a loss of 84.24% of the NO3- over 55 cm in the intact
sediment cores. This result corresponds to the estimate of 90% nitrate loss when
comparing the nitrate concentrations in the stream piezometers and the open channel.
Whereas, the nitrate concentrations in the sediment pore water increased
substantially with depth in the cores, the chloride and sulfate concentrations decreased
with depth in all cores (Table 4). The greatest incremental difference was seen between
the stream concentrations and the first sediment depth analyzed. The chloride and sulfate
concentrations were generally stable beneath the shallow sediments (below 10 cm). The
chloride concentration in the stream channel ranged from 14.07- 31.99 mg Cl- L-1 and the
stream sulfate concentration ranged from 38.55- 58.97 mg SO42- L-1 (as SO4
2-) over all
the sampling dates.
Changes in the nitrate concentration in comparison to the chloride concentration
are indicative of the relative effects of biological transformations and uptake processes as
opposed to dilution of the discharge water (Lowrance, 1992). There was not a
corresponding decrease in chloride concentration in locations where there were steep
declines in nitrate, therefore the nitrate loss is assumed to be due to biological activity
(Figure 10).
Pore water samples were collected using the mini drive point piezometer (MDPP) in the
center of the stream channel on the same sampling dates as the intact sediment cores
(Table 5). Three profiles were collected on July 11 and August 4, 2003, and two profiles
were collected on October 26, 2003. Maximum sampling depths were 40 cm, 20cm, and
12 cm for the three dates, respectively. The solute profiles collected with the MDPP were
compared both to the profiles collected with the individual core taken in the same

38
Table 4: Concentration of dissolved inorganic anions (mg L-1) in pore water collected in sediment cores. Values are the mean of n cores. Error is reported as standard error of the mean (SEM).
Depth (cm) NO3
--N NO3
--N- SEM Cl- Cl- SEM SO4
2- SO42- SEM
7/11/03 (n=3 cores) 0 2.27 0.24 14.07 0.32 58.97 2.46 2 6.35 1.73 9.62 0.73 35.59 4.55 10 8.98 1.53 8.54 0.24 31.75 1.45 20 10.77 0.76 7.96 0.14 28.37 0.45 30 10.57 0.45 8.59 0.16 33.34 4.27 40 12.30 0 8.50 0 28.82 0
8/4/03 (n=9 cores) 0 1.74 0.04 19.48 0.14 38.55 0.34 2 1.26 0.29 19.13 0.70 38.14 3.11 10 2.59 1.03 22.41 2.25 41.89 5.26 20 4.22 1.58 17.29 0.66 36.12 4.67 30 2.93 0.85 16.53 1.27 41.51 4.17 40 6.44 1.44 17.19 1.26 44.42 9.83 50 5.97 1.60 20.88 3.21 30.74 0 80 6.40 0 14.35 0 31.64 0
8/26/03 (n=9 cores) 0 1.65 0.13 21.51 0.32 51.22 3.25 2 1.05 0.38 18.42 1.53 40.36 5.90 10 2.66 1.04 14.63 1.05 32.52 3.27 20 5.76 1.36 11.22 1.25 40.25 5.01 30 12.11 0.34 13.57 0.26 35.21 1.47 40 10.57 1.03 13.76 0.78 32.89 1.28 50 12.43 0 13.01 0 27.40 0 60 7.51 1.90 12.72 1.76 37.31 2.02 70 5.61 1.33 11.63 3.58 36.80 7.24
10/26/03 (n=8 cores) 0 1.69 0.18 31.99 2.00 49.70 1.06 2 2.52 1.00 20.81 3.50 36.05 5.00 10 5.81 1.29 19.37 2.45 26.73 3.65 20 7.83 1.74 17.03 1.94 25.28 2.00 30 10.18 0.75 19.74 3.17 25.20 1.68 40 10.29 0.37 16.68 1.23 23.54 0.81 50 9.47 0.60 18.37 1.27 26.02 1.52 60 9.27 1.48 20.82 1.42 26.90 4.29

39
7/11/03n= 4 cores
Concentration (mg L-1)
0 2 4 6 8 10 12 14 16
Dep
th(c
m b
elow
sedi
men
t sur
face
)0
20
40
60
80
Nitrate Chloride
8/4/03n= 9 cores
Concentration (mg L-1)
0 5 10 15 20 25 30
0
20
40
60
80
8/26/03n= 9 cores
Concentration (mg L-1)
0 5 10 15 20 25
Dep
th(c
m b
elow
sedi
men
t sur
face
)
0
20
40
60
80
10/26/03n= 8 cores
Concentration (mg L-1)
0 10 20 30 40
0
20
40
60
80
Figure 10: Profiles of average pore water nitrate and chloride concentrations in stream sediments collected with intact sediment cores on four sampling dates. Error bars are SEM. Lack of SEM bars indicate that only one sample was collected. location as the MDPP sample (in the center of the stream) and to the average of the intact
cores collected in all cross sections in the stream (Figure 11). In general, there was good
agreement between the nitrate concentrations in the pore water collected from the MDPP

40
and the intact cores. Chloride and sulfate concentration profiles were similar to the intact
core samples, showing generally decreasing concentrations with depth.
Table 5: Concentration of pore water anions collected with the mini drive point piezometer in CMC sediments. Error is reported as standard error of the mean (SEM).
Depth Cl- Cl- SEM NO3--N
NO3--N-
SEM SO42-
SO42--
SEM 7/11/2003 (n = 3 samples)
0 15.42 0.45 4.50 2.37 43.87 9.79 5 9.01 0.48 8.06 1.44 25.51 2.11
10 8.07 0.24 7.56 2.15 24.00 1.09 12.5 8.41 0.29 7.96 1.19 27.31 1.83
15 8.25 0 9.49 0 22.95 0 17.5 8.77 0 11.38 0 24.30 0
20 8.98 0.96 9.06 1.83 31.23 6.60 30 8.41 0 9.94 0 24.30 0 33 9.73 0 9.86 0 30.63 0 40 10.22 0 8.44 0 33.34 0
8/4/2003 (n = 3 samples) 0 16.47 1.97 1.72 0.18 28.05 2.26
2.5 14.88 0.71 1.93 0.81 26.86 2.16 5 14.53 0.67 1.88 1.16 24.17 1.82
7.5 12.58 0.11 1.50 0.91 17.59 5.21 10 12.97 0 3.00 2.75 14.60 10.76 15 13.10 0.36 2.23 1.14 24.17 0.79 20 13.07 0.49 1.62 1.53 30.30 8.52
10/26/2003 (n = 2 samples) 0 30.10 0 1.44 0 45.46 0
2.5 15.72 2.72 0.48 0.04 24.30 10.68 5 13.13 0.49 0.31 0 19.25 15.73
7.5 12.95 0.31 0.74 0.30 16.73 11.27 10 13.53 0.53 0.37 0 10.71 8.35
12.5 15.85 0 1.04 0 5.46 0

41
7/11/03
mg NO3- -N L-10 2 4 6 8 10 12 14
Dep
th b
elow
sedi
men
t sur
face
(cm
)
0
10
20
30
40
50
60
8/4/03
0 2 4 6 8 10 12 14
Dep
th b
elow
sedi
men
t sur
face
(cm
)
0
10
20
30
40
50
60
MDPPAvg of CoresIndividual Core in same Location
10/26/03
0 2 4 6 8 10 12 14
Dep
th b
elow
sedi
men
t sur
face
(cm
)
0
10
20
30
40
50
60
Figure 11: Profiles of NO3--N concentration determined with the mini drive point
piezometer (MDPP), individual core collected in the same location as the MDPP, and average of cores collected in all locations in the stream. Error bars are standard error of the mean (SEM). Lack of SEM bars indicate that only one sample was collected.

42
Total Organic Matter Content
Concentrations of total organic matter (determined by ignition) were
highest in the top 20 cm of the creek sediment and decreased with depth (Figure 12). The
maximum values (for all cores collected at all times) ranged from about 2% to 5.2% at 10
cm. Below 20 cm, the organic matter concentration decreased substantially to about
0.18% below 60 cm. The zone of maximum concentration of organic matter coincided
with the zone of observed maximum decreases in NO3--N concentration (Figure 8).
Total Organic MatterContent(Percent Ash Free Dry Weight)
0 2 4 6 8
Dep
th(c
m b
elow
sedi
men
t sur
face
)
0
20
40
60
80
7/11/038/4/038/26/0310/26/03
Fig. 12. Depth profiles of total organic matter content in intact cores taken on the dates indicated. Error bars represent 1 SEM (n=3, 9, 9, and 8 cores for sampling dates July, August 4, August 26, and October 26, 2003, respectively).

43
Platinum Electrode Potential
Redox status was estimated by measuring platinum electrode potential on August
26 and October 26, 2003 (Figure 13). The average of five cores is reported for samples
taken on August 26. In both sampling events, there was a distinct change in platinum
electrode potential at approximately 10 – 20 cm below the sediment surface with the
voltages reflecting a more oxidized environment below that point. The zone of low redox
potential corresponded to the zone of high organic matter content and low nitrate
concentrations. Dips in platinum electrode potential at various depths below 20 cm in the
three profiles were also found.
8/26/03n= 5 cores
Platinum Electrode Potential (mvolts)
240 260 280 300 320 340 360 380
Dep
th (c
m b
elow
sedi
men
t sur
face
)
0
10
20
30
40
50
60
10/26/03n= 2 cores
0 100 200 300 400
Fig. 13. Depth profiles of platinum electrode potential in cores from Cobb Mill Creek. Cores were taken on the dates indicated. Error bars represent 1 SEM.
Photographs of the sediment cores also showed thick black layers concentrated
near the stream-bed surface, 10- 20 cm deep (Figure 14). Based on the organic matter

44
Oxi
dize
d Ir
on C
oatin
g
Org
anic
Lay
er
Figu
re 1
4: S
tream
sedi
men
t cor
es fr
om C
MC
col
lect
ed O
ctob
er 2
6th, 2
003,
that
hav
e be
en c
ut in
hal
f to
disp
lay
the
orga
nic
mat
ter a
nd ir
on la
yers
alo
ng th
e de
pth
prof
ile.

45
content sediment profiles, the thick black layers most likely represent organic matter and
not reduced iron or sulfide coatings. Black ribbon-like pockets were also seen below this
depth and may represent buried organic matter. These buried pockets may support hot
spots of denitrification at depth if conditions are reducing in microsites. In two of the
cores collected, pockets of red sediment were evident below 30 cm, and may represent
oxidized iron coatings on the sediment. This oxidized iron state signifies aerobic pore
water conditions. This supports the suggestion that at depth, upwelling ground water was
aerobic, and reducing conditions were not reached until the pore water was closer to the
stream sediment surface. The fact that the red oxidized coatings were only seen in some
of the cores points to the great heterogeneity in the stream sediments.
Potential Denitrification Rate
The potential denitrification rate was determined by measuring N2O production
over time using the acetylene block method (Tiedje, 1982). Preliminary results indicated
that the N2O production was linear with time until the reactants were exhausted and then
production was constant with time. N2O increased linearly up to 4-5 hours. Then after a
24 hour period, N2O was still produced but at a slower rate, and following this period a
saturation level was reached. In order to determine maximum N2O production, headspace
samples were collected during the 4-5 hour window of linear maximum production.
On all four sampling dates, a pattern was evident in which the highest
denitrification potential corresponded to depths of greatest change in nitrate concentration
and high organic matter content (Figure 15). The zone of high denitrification rates
generally occurred at shallow depths less than 10 cm below the sediment surface. On July

46
8/4/03n= 9 cores
0 20 40 60 80 100
0
20
40
60
80
Organic matter (%)NO3--N (mg L-1pore water)
0 2 4 6 8 10 12 14
pot dnt rateorganic matternitrate
7/11/03n= 3 cores
0 20 40 60 80 100
Dep
th (c
m b
elow
sedi
men
t sur
face
)
0
20
40
60
80
0 2 4 6 8 10 12 14
8/26/03n= 9 cores
Denitrification Potential(nmol N2O ml -1)
0 20 40 60 80 100 120 140 160
Dep
th (c
m b
elow
sedi
men
t sur
face
)
0
20
40
60
80
0 2 4 6 8 10 12 14
10/26/03n= 8 cores
Denitrification Potential Rate(nmol N2O ml -1 hr-1)
0 1 2 3 4 5
0
20
40
60
80
0 2 4 6 8 10 12 14
Denitrification Potential Rate(nmol N2O ml -1 hr-1)
Denitrification Potential Rate(nmol N2O ml -1 hr-1)
Organic matter (%)NO3
--N (mg L-1pore water)
Fig. 15. Depth profiles of organic matter, nitrate, and denitrification potential rate in cores from Cobb Mill Creek. Cores were taken on the dates indicated. Error bars represent standard error of the mean (SEM). Denitrification potential is expressed as a rate (nmol N20 ml-1 hr-1) for all sampling dates except for August 26th in which only maximum N2O production was possible.

47
11 and August 4, the highest denitrification potential rate results were similar (80.93 and
62.39 nmol N2O mL sediment-1 hr-1, respectively) and occurred at a depth of 2 cm below
the stream sediment surface; and the second highest potential denitrification rates (28 and
26.14 nmol N2O mL sediment-1 hr-1, respectively) occurred at a depth of 10 cm below the
stream sediment surface. On August 26, denitrification potential was reported as the
maximum potential denitrification (N2O production) as opposed to a potential
denitrification rate due to technical difficulties with the gas chromatograph. Hourly rate
data could not be recorded. The highest potential denitrification (108.16 nmol N2O mL
sediment-1) occurred at a depth of 2 cm below the stream sediment surface, and the
second highest potential denitrification rate (26 nmol N2O mL sediment-1) occurred at a
depth of 10 cm below the stream sediment surface. On October 26, the potential
denitrification rates were much lower and occurred slightly deeper in the sediments. The
highest rate (2.63 nmol N2O mL sediment-1 hr-1) occurred at a depth of 10 cm below the
stream sediment surface, and the second highest potential denitrification rate (2.39 nmol
N2O mL sediment-1 hr-1) occurred at a depth of 20 cm below the stream sediment surface.
During all sampling dates, the greatest denitrification potential was found at
shallower depths (2-20 cm) beneath the stream sediment surface. The zone of high
denitrification potential was located with areas of high amounts of total organic matter,
low NO3- concentrations, and low platinum electrode potential determined with the
Spearman Test, which is nonparametric correlation analysis (Table 6). The significance
level (α) was adjusted for multiple correlations using the sequential bonferroni method
(Rice, 1989). There was a significant positive correlation between denitrification
potential and total organic matter in all sampling dates. The negative correlation between

48
Table 6: Correlation matrix of denitrification potential, organic matter content, platinum electrode potential (PtEP), and nitrate concentrations for all sampling dates. Correlation Spearman Test with sequential bonferroni correction.
Den. Pot- Den. Pot- Den. Pot- Organic Matter- Organic Matter PtEP NO3- NO3-
July 11 r = 0.62* r = -0.79* r = -0.59* P = 0.0075 n/d P = 0.0014 P = 0.0277 n =17 n =13 n =14
August 4 r = 0.44* r = -0.12 r = 0.08 P = 0.0007 n/d P = 0.5363 P = 0.6947 n =55 n =28 n =27
August 26 r = 0.48* r = -0.06 r = 0.06 r = -0.42* P = 0.0001 P = 0.7446 P = 0.7573 P = 0.0156 n =59 n =30 n =34 n =32
October 26 r = 0.46* r = -0.53* r = -0.66* P = 0.0010 n/d P = 0.0003 P < 0.0001 n =49 n =41 n =41
* significant at α = 0.05 (after sequential bonferroni correction); n/d: not determined
denitrification potential and PtEP found on August 26 was not found to be significant.
Correlation analysis between denitrification potential and PtEP for October 26 was not
performed since only two cores were collected. Denitrification potential was negatively
correlated with pore water nitrate concentration in two of the sampling dates, July 11 and
October 26. Total organic matter of the streambed sediments was negatively correlated to
both pore water nitrate concentrations and platinum electrode potential, except on August
4 (data not shown).
Lateral Profiles across the Streambed
Lateral profiles of pore water nitrate concentration, total organic matter, and
potential denitrification were examined in cross sections in the streambed to examine
areal variability of nitrate removal by denitrification and its controllers (Figures 16-19).

49
Crossection 1
Right Bank
Nitrate (mg NO3--N L-1)Organic Matter (% AFDW)
0 2 4 6 8 10 12
0
10
20
30
40
50
60
Denitrification Potential (nmol N2O ml sediment-1 hr-1)
0 20 40 60
Crosssection 1Left Bank
Nitrate (mg NO3--N L-1)Organic Matter (% AFDW)
0 2 4 6 8 10 12
Dep
th (c
m b
elow
sedi
men
t sur
face
)
0
10
20
30
40
50
60
Denitrification Potential(nmol N2O ml sediment-1 hr-1)
0 1 2 3 4 5
Crossection 2Right Bank
Nitrate (mg NO3--N L-1)Organic Matter (% AFDW)
0 2 4 6 8 10 12
0
10
20
30
40
50
60
Denitrification Potential (nmol N2O ml sediment-1 hr-1)
0 20 40 60 80 100 120 140
Organic MatterNitrateDenitrification
Crossection 2
Left Bank
Nitrate (mg NO3--N L-1)Organic Matter (% AFDW)
0 2 4 6 8 10 12
Dep
th b
elow
sedi
men
t sur
face
(cm
) 0
10
20
30
40
50
60
Denitrification Potential (nmol N2O ml sediment-1 hr-1)
0 10 20 30 40 50 60 70
Figure 16: Profiles of denitrification potential, nitrate concentration, and organic matter content of cores collected in CMC on July 11, 2003. Graphs are placed on the page to correspond to sampling locations of cores in the stream (see Figure 3). The graphs on the left show cores collected along the left bank and the graphs on the right show cores on the right bank.

50
Core #1
Nitrate (mg NO3--N L
-1)
Organic Matter (% AFDW)
0 2 4 6 8 10 12
0
10
20
30
40
50
60
0 5 10 15 20 25
Core #2
Nitrate (mg NO3--N L
-1)
Organic Matter (% AFDW)
0 2 4 6 8 10 12
0
10
20
30
40
50
60
0 10 20 30 40 50 60 70
Core #3
Nitrate (mg NO3--N L
-1)
Organic Matter (% AFDW)
0 2 4 6 8 10 12
0
10
20
30
40
50
60
0 1 2 3 4 5
Organic MatterNitrateDNT POT
Core #4
0 2 4 6 8 10 12
Dep
th
(cm
bel
ow se
dim
ent s
urfa
ce)
0
10
20
30
40
50
60
0 20 40 60 80
Core #5
0 2 4 6 8 10 12
0
10
20
30
40
50
60
0 20 40 60 80 100 120 140 160 180
Core #6
0 2 4 6 8 10 12
0
10
20
30
40
50
60
0 20 40 60 80 100 120
Core #7
0 2 4 6 8 10 12
Dep
th
(cm
bel
ow se
dim
ent s
urfa
ce)
0
10
20
30
40
50
60
Denitrification Potential (nmol N2O ml sediment -1 hr -1)
0 10 20 30 40 50
Core #8
0 2 4 6 8 10 12 14
0
10
20
30
40
50
60
Denitrification Potential (nmol N2O ml sediment -1 hr -1)
0.0 0.2 0.4 0.6 0.8 1.0 1.2 1.4 1.6
Core #9
0 2 4 6 8 10 12
0
10
20
30
40
50
60
Denitrification Potential (nmol N2O ml sediment -1 hr-1)
0 20 40 60 80 100
Dep
th
(cm
bel
ow se
dim
ent s
urfa
ce)
Figure 17: Profiles of denitrification potential, nitrate concentration, organic matter content, and of cores collected in CMC on August 4, 2003. Graphs are placed on the page to correspond to sampling locations of cores in the stream (see Figure 3. The graphs on the left show cores collected along the left bank and the graphs on the right show cores on the right bank.

51
Core #2
Nitrate (mg NO3--N L-1)Organic Matter (% AFDW)
0 2 4 6 8 10 12
0
20
40
60
DNT POT (nmol N2O ml sediment -1)
0 10 20 30 40 50 60
Core 1
Nitrate (mg NO3--N L-1)Organic Matter (% AFDW)
0 2 4 6 8 10 12
Dep
th(c
m b
elow
sedi
men
t sur
face
)
0
20
40
60
DNT POT (nmol N2O ml sediment -1)0 10 20 30 40 50
Pt EP
325 330 335 340 345 350 355 360 365
Organic MatterNitrateDNT POTEh
Core 3
Nitrate (mg NO3--N L-1)Organic Matter (% AFDW)
0 2 4 6 8 10 12 14 16 18
0
20
40
60
DNT POT (nmol N2O ml sediment -1)0 10 20 30 40 50 60
Pt EP180 200 220 240 260 280 300 320 340 360
Core 4
0 2 4 6 8 10 12
Dep
th(c
m b
elow
sedi
men
t sur
face
)
0
20
40
60
DNT POT (nmol N2O ml sediment -1)
0 100 200 300 400 500 600
Pt EP
240 260 280 300 320 340 360
Core 7
Nitrate (mg NO3--N L-1)Organic Matter (% AFDW)
0 2 4 6 8 10 12
Dep
th(c
m b
elow
surfa
ce se
dim
ent)
0
20
40
60
DNT POT (nmol N2O ml sediment -1)
0 20 40 60 80
Nitrate (mg NO3--N L-1)Organic Matter (% AFDW)
Core 5
Nitrate (mg NO3--N L-1)
Organic Matter (% AFDW)
0 2 4 6 8 10 12
0
20
40
60
DNT POT (nmol N2O ml sediment -1)
0 10 20 30 40 50 60
Pt EP
260 280 300 320 340 360 380 400 420
Core 6
Nitrate (mg NO3--N L-1)Organic Matter (% AFDW)
0 2 4 6 8 10 12
0
20
40
60
DNT POT (nmol N2O ml sediment -1)
0 20 40 60 80 100
Pt EP
220 240 260 280 300 320 340 360 380 400
Core 8
Nitrate (mg NO3--N L-1)Organic Matter (% AFDW)
0 2 4 6 8 10 12
0
20
40
60
DNT POT (nmol N2O ml sediment-1)
0 10 20 30 40 50
Core 9
Nitrate (mg NO3--N L-1)Organic Matter (% AFDW)
0 2 4 6 8 10 12
0
20
40
60
DNT POT (nmol N2O ml sediment -1)
0 10 20 30 40 50 60
Core 2
Figure 18: Profiles of denitrification potential, nitrate concentration, organic matter content, and PtEP of cores collected on August 26, 2003. Graphs are situated to correspond to sampling locations (Fig 3).

52
Core #1
Nitrate (mg NO3--N L-1)Organic Matter (% AFDW)
0 2 4 6 8 10 12
Dep
th(c
m b
elow
sed
imen
t sur
face
)
0
10
20
30
40
50
60
0 1 2 3 4 5
Core #2
Nitrate (mg NO3--N L-1)Organic Matter (% AFDW)
0 2 4 6 8 10 12
0
10
20
30
40
50
60
0 1 2 3 4 5
Organic MatterNitrateDNT POT
Core #3
Nitrate (mg NO3--N L-1)Organic Matter (% AFDW)
0 2 4 6 8 10 12 14 16 18
0
10
20
30
40
50
60
0 1 2 3 4 5
Core #4
0 2 4 6 8 10 12
Dep
th(c
m b
elow
sed
imen
t sur
face
)
0
10
20
30
40
50
60
0 1 2 3 4 5
Core #5
0 2 4 6 8 10 12
0
10
20
30
40
50
60
0 1 2 3 4 5
Core #7
0 2 4 6 8 10 12 14
Dep
th(c
m b
elow
sed
imen
t sur
face
)
0
10
20
30
40
50
60
Denitrification Potential (nmol N2Oml sediment-1hr-1)
0 1 2 3 4 5
Core #8
0 2 4 6 8 10 12
0
10
20
30
40
50
60
Denitrification Potential (nmol N2Oml sediment-1 hr-1)
0 1 2 3 4 5
Core #9
0 2 4 6 8 10 12 14
0
10
20
30
40
50
60
Denitrification Potential
(nmol N2O ml sediment-1 hr-1)
0 1 2 3 4 5
Figure 19: Profiles of denitrification potential, nitrate concentration, and organic matter content of cores collected in CMC on October 26, 2003. Graphs are placed on the page to correspond to sampling locations of cores in the stream (see Figure 3). The graphs on the left show cores collected along the left bank and the graphs on the right show cores on the right bank.

53
In general, increased total organic matter and increased potential denitrification were
found at depths greater than 20 cm below the stream sediment surface only in cores 3, 6,
& 9, which were taken along the right bank (facing downstream). Among all four
sampling events, core #3 (taken along the right bank in cross section one) had up to 17%
total organic matter at 20 cm (Figures 18 & 19) and up to 12% total organic matter at 30
cm below the sediment surface (Figure 18). In core #6 (taken along the right bank in
cross section two) there were also high amounts of organic matter found at depths greater
than 20 cm (Figures 17 & 18). On August 4, organic matter increased with depth to 11%
at 50 cm below the sediment surface in core #6, although denitrification potential was
greatest at 2 cm in this core (Figure 17). In core #9 (taken along the right bank in cross
section three) there were considerable amounts of organic matter also found at deeper
depths, up to 5% at 25 cm on October 26, and considerable potential denitrification was
found at 30 cm (Figure 19). Among all the sampling dates, the percent organic matter in
core #5 (taken in the center of the stream in cross section two) peaked at 6% at
approximately 20 cm (Figure 17-19). At all other sampling locations, total organic
content was less than 2% at depths greater than 20 cm, the location where the least
amount of potential denitrification occurred.
Mass Balance
The average potential NO3- removal rate (based on N2O production) was
compared to the average observed NO3- loss rate (based on calculations made with the
advection-dispersion equation) along the length of each core. In order to convert the
observed decreases in nitrate concentration into a nitrate loss rate, a linear trend line was

54
fit to the change in nitrate concentration along the length of the core. The slope of the line
(R u-1) was 0.15, 0.10, 0.16, and 0.13 for sampling dates July 11, August 4, August 26,
and October 26, 2003, respectively. Each slope was multiplied by the average linear
velocity (3.1*10-4 cm sec-1), which resulted in the observed nitrate loss rate (R) for each
sampling date. The mass balance was not calculated for sampling date August 26
because, due to technical difficulties, a potential denitrification rate could not be found.
On all sampling dates, the shallower depths (0-10 cm below the sediment
surface), where most of the denitrification occurred, contributed the most to the sum of
potential nitrate removal (Table 7). This observation corresponded with the fact that the
greatest observed pore water nitrate decrease also occurred in these shallow depths
(Figure 9). On July 11, the potential removal rate was 9.28 mg NO3- L-1 hr-1 compared to
the observed nitrate loss rate of 0.15 mg NO3- L-1 hr-1. On August 4, 10.07 mg NO3
- L-1
hr-1 was potentially removed compared to the observed nitrate loss rate of 0.11 mg NO3-
L-1 hr-1. On October 26, 0.40 mg NO3- L-1 hr-1 was potentially removed compared to the
observed nitrate loss rate of 0.12 mg NO3- L-1 hr-1. The potential nitrate removal rate was
sufficient to account for the observed nitrate loss; it was 60, 90, and 3 fold greater than
the “observed” nitrate loss rate for sampling dates July 11, August 4, and October 26,
respectively. The potential nitrate removal rate was lowest on October 26, 2003.
The potential nitrate removal rates for each depth increment in each single core were
summed to determine the maximum amount of denitrification potential at each sampling
location in the stream reach (Table 8). In most cases, there were nine sampling locations
in the stream (Figure 4). For all sampling dates, this potential rate was compared to the
observed nitrate loss rate along the length of the core to examine lateral patterns of

55
denitrification potential. Much variability existed between sampling dates considering
the relationship between the stream position and high denitrification potential rates. In
general, among all the sampling dates, the highest potential nitrate removal rate was
found in the middle of the stream in cross section two (in line with piezometer nest 4).
Table 7: Mass balance comparing potential NO3--N removal rates (based on N2O
production) to the observed NO3--N loss rate (based on advection equation) along the
length of the sediment cores.
Depth Pot DNT Rate NO3- Removal Rate Obs NO3
- Loss Obs NO3- Loss Rate
(cm) (nmol N2O ml-1 hr-1) (mg NO3--N L-1 hr-1) (slope) (mg NO3
--N L-1 hr-1) 7/11/03
2 80.93 6.47 10 26.95 2.16 20 5.23 0.42 30 2.83 0.23 40 0.00 0.00 50 0.00 0.00
Total 115.94 9.28 -0.14 0.15 8/4/03
2 62.39 4.99 10 26.14 2.09 20 16.49 1.32 30 7.72 0.62 40 5.67 0.45 50 4.29 0.34 60 3.21 0.26
Total 125.91 10.07 -0.10 0.11 10/26/03
2 2.63 0.21 10 2.39 0.19 20 0.00 0.00 30 0.00 0.00 40 0.00 0.00 50 0.00 0.00 60 0.00 0.00
Total 5.02 0.40 -0.11 0.12 In these cases, the denitrification potential rate was sufficient to account for the observed
nitrate loss. As shown in the vertical mass balance (Table 7), at most stream locations, the

56
denitrification potential rate was sufficient to account for the observed nitrate loss. There
was not a general pattern between positions in the stream and incidences where the
denitrification potential could not account for the observed nitrate loss rate.
Table 8: Comparison of Potential Nitrate Removal Rate and Observed Nitrate Loss Rate (gray column) (mg NO3
--N-1) for Cross section Profiles. Columns are placed on the page to correspond to sampling locations of cores in the stream (see Figure 4) in a downstream orientation starting at cross section 1. The columns on the left show cores collected on the left bank and columns on the right show cores collected on the right bank. Numbers in italics indicate stream positions where the potential nitrate removal rate was sufficient to account for the observed the nitrate loss rate.
Sampling Date
Total Potential Nitrate
Removal Rate
Total Observed
Nitrate Loss Rate
Total Potential Nitrate
Removal Rate
Total Observed
Nitrate Loss Rate
Total Potential Nitrate
Removal Rate
Total Observed
Nitrate Loss Rate
7/11/2003 Cross section 3 Cross section 2 15.67 0.22 5.25 0.28 Cross section 1 0 0.32 6.47 0.30 8/4/2003 Cross section 3 5.94 n/a 0.21 0.60 11.14 n/a Cross section 2 6.13 0.11 15.29 0.26 13.23 0.15 Cross section 1 1.82 0.03 4.89 n/a 0.48 0.23 10/26/2003 Cross section 3 0.09 0.23 0.17 0.13 0.62 0.19 Cross section 2 0 0.20 0.45 0.14 n/a n/a Cross section 1 0.21 0.17 0.46 0.20 0.05 0.15 Stream Position Left Bank
Middle
Right Bank

57
DISCUSSION
Hydrological Gradients and Ground-water Nitrate Concentrations
During base flow conditions in low order streams, such as Cobb Mill Creek, when
the majority of the stream flow is ground-water fed, it is expected that the stream water
chemistry should correspond to its ground-water source. The application of excess
fertilizers containing nitrate to some upland agricultural fields often does not to cause a
comparable rise in nitrate in adjacent streams (McClain et al., 2003). This discrepancy
between nitrate-rich discharging ground water and nitrate-poor stream water was
observed early in the current study. In order to determine the major location and
mechanism of nitrate removal along the ground water flow path, the water table profile,
vertical head gradients, and nitrate concentrations were determined along the
experimental hillslope and in the stream.
The water table was determined to be shallow (less than two meters below the
ground surface) and it followed the ground contours from the upland agricultural field,
down the hillslope to the stream, except at the bankside well closest to the stream where
the water table was level with the stream despite the sloping ground. The ground water
flow paths along the hillslope that deliver nitrate to the stream were determined by
coupling the nitrate data and the vertical head gradients in the shallow region of the
saturated zone (less than one meter deep). The local vertical head gradients of two of the
bankside piezometer nests, N1 and N3, indicated upward flow during all the sampling
dates. A consistent pattern of increasing nitrate concentrations with depth was found in
these two piezometer nests. Alternately, vertical head gradients in the adjacent bankside

58
piezometers, N4, N5, and N6, located slightly downstream, showed a less consistent
pattern over time but indicated that more downward flow occurred in these locations
compared to N1 and N3, despite their close proximity. Nitrate concentrations in bank side
piezometer nests N4, N5, and N6 were much lower compared to the other piezometers
nests. The pattern of increasing nitrate concentrations with depth was found in nests N5
and N6, but in nest N4, nitrate was found to decrease with depth, although these
piezometers were placed at approximately the same depth underground. Differences in
the vertical head gradients and nitrate concentrations in shallow piezometer nests in close
proximity to each other reflect the heterogeneity of local shallow ground water flows.
Vertical head gradients at N7, located higher on the hillslope, indicated that strong
downward flow occurs at this location, and therefore may be an important recharge area.
Nitrate concentrations were higher at this location. On the other hand, nitrate
concentrations were lower at another parallel hilltop location (about 18 meters upstream),
N10. Since only one piezometer was installed, a vertical head gradient could not be
established. The negative vertical head gradients in the stream piezometers suggested that
there was an upward flow of deeper ground water directly into the stream. The highest
nitrate concentrations were found one meter directly below the stream by pore water
collected by stream piezometers (9-11 mg NO3- L-1), while stream nitrate concentrations
were low (1-2 mg NO3- L-1).
In the Cobb Mill Creek watershed, a local ground-water flow system
predominates in which the topographic high is the agricultural field and the topographic
low is the stream. The hydrologic and chemical data in the Cobb Mill Creek study
suggest two distinct flow paths within the local flow system, which differ in nitrate

59
concentration. High concentrations of nitrate leach from the upland agricultural field and
flow along an oxidized deeper ground water flow path generally greater than two meters
below the water table and the nitrate discharges vertically towards the stream. The pore
water nitrate is removed at the ground water- surface water interface before the water
reaches the open stream channel. On the other hand, the ground water in the shallow
bankside piezometers was found to have lower nitrate concentrations suggesting a
shallower oxidized ground water flow path in which the nitrate most likely originates
from natural decomposition and deposition processes. These flow paths receive less
nitrate from the agricultural fertilizers. The nitrate transported by these shallow flow
paths are most likely discharged laterally into the stream at the stream bank and
contribute to the open channel nitrate concentration.
It is important to keep in mind that the hillslope cross section profile is based on
only four piezometer nests in one transect. More hillslope piezometers that are installed
deeper into the ground water will be necessary to establish the ground water flow paths
along the hillslope in a comprehensive manner. The vertical head gradients described in
this work only encompass a very shallow lens of the ground water (approximately one
meter deep) in the Cobb Mill Creek riparian zone. Variations in vertical head gradients in
the piezometers among sampling dates are due to changes in ground water and stream
elevation based on precipitation events. Further research is warranted to correlate changes
in local ground water flow paths due to precipitation events. Multiple deep piezometers
along the hillslope are needed to confirm the suggested deeper flow paths connecting the
agricultural field and the stream and relate them to the sources and sinks of nitrate along
that flow path.

60
Vertical Profiles in Stream Sediments
Concentration profiles of nitrate in pore water collected from intact sediment
cores taken in Cobb Mill Creek matched concentrations from water collected in the
stream piezometers and showed that nitrate concentrations generally increased with depth
in the sediment and were higher than the stream channel. The average of all cores taken
over the four sampling dates indicated a decrease of 8.27 mg NO3--N L-1 or 84.24%
between a point 60 cm below the sediment surface and the open channel. The change in
nitrate concentration was not uniform with depth in the sediments; the greatest nitrate
loss occurred in the top 20 cm. The distinct decrease in nitrate concentration in the top 20
cm in the sediments is especially evident on sampling dates July 11, August 26, and
October 26, 2003, whereas the decrease in nitrate appeared more linear August 4, which
is most likely due to technical problems of collecting pore water on that date. On
sampling dates August 4 and August 26, 2003, there was a slight increase of nitrate
concentration between sediments 2 cm deep and the open channel. This observation
supports the idea that nitrate was removed in the upwelling ground water and the
additional nitrate in the stream originated from lateral flow from the bank.
Although nitrate and chloride behave similarly in aqueous solutions in that they
do not sorb to particle surfaces, chloride does not undergo biological transformations and
therefore concentrations are not biologically controlled. The decrease of the nitrate
concentration in the shallow stream sediments did not correspond to a decrease in
chloride, suggesting that the nitrate loss is a biological process. Chloride and sulfate
concentrations were higher in the stream and decreased with depth in the stream
sediments. These anions may originate from the downstream estuary and Atlantic Ocean

61
through seawater spray reaching the stream during storms. With strong upward advective
ground water flow through the stream sediments, these anions most likely only enter the
shallow sediment by hyporheic exchange. However, it was found that the vertical head
gradients were approximately a magnitude greater than the longitudinal head gradients in
the stream sediments indicating that the advective flow of the discharging ground water
was stronger than the longitudinal in the streambed. Therefore, hyporheic exchange is
not a significant solute transport mechanism along the experimental reach. In addition,
hyporheic exchange was not shown to occur by previous tracer studies in the Cobb Mill
Creek sediments.
The nitrate concentration of the samples collected with the MDPP from depths
between the intact cores samples (collected at 10-cm intervals) showed some variability
but generally fell along the depth profile collected with the cores. The results of this study
concur with other studies, such as Duff et al. (1998), that suggest that using this technique
to collect high-resolution nitrate profiles is important when looking at heterogeneity of
denitrification, especially when considering microsites of biogeochemical activity close
to the stream sediment surface.
Along the examined depth profile, from the sediment surface down to
approximately 60 cm, it was found that the majority of the nitrate was lost in the top 20
cm. Furthermore, on all four sampling dates, the potential denitrification rates were
greatest in the top 20 cm of the stream sediments. The sediment conditions in this shallow
zone were conducive to stimulating denitrification; organic matter (as the electron donor)
was sufficient, the upwelling pore water nitrate-rich (as the electron acceptor), and the
low platinum electrode potential suggested adequate hypoxic oxygen levels. Depths

62
below this zone had on average less than 2% organic matter and higher platinum
electrode potential. Low platinum electrode potentials were also found at various depths
below 20 cm and these may represent microsites of low oxygen conditions rather than a
specific pattern. The measured profiles of organic matter and platinum electrode
potential were supported by physical observations of sediment color in intact cores cut
lengthwise. Thick black layers of organic matter were seen near the sediment surface.
Small pockets of organic matter were seen at depth; these pockets represent microsites of
anaerobic microbial activity. In some cores, red sediment was observed at depth. Such
coloration is associated with oxidized iron coatings in aquifer materials in the vicinity
(Dobson, R.W., 1997, Knapp, et al., 2002). This observation supports the suggestion that
at depth, upwelling ground water is aerobic and therefore nitrate flowing along that
subsurface path is conserved. As the water enters areas with increased organic matter,
anoxic conditions become more frequent promoting removal of nitrate from the water by
denitrification.
There was a significant positive correlation between denitrification potential and
total organic matter content for all sampling dates. Organic matter in the shallow
sediments serves two purposes. It fuels not only denitrification, but also oxygen
respiration. Oxygen respiration consumes oxygen and creates the hypoxic conditions
necessary for denitrification to occur. There was a negative correlation between
denitrification potential and PtEP on August 26, but it was not significant. This
correlation may be weak since the sample size was low (5 cores) due to technical
difficulties. Denitrification potential was significantly negatively correlated to pore water
nitrate concentrations in two of the sampling dates, July 11 and October 26. This

63
relationship is expected to be negative because as denitrification occurs, the nitrate is
reduced to nitrogen gas and its concentrations decrease. The lack of significance on the
other two sampling dates may be due to technical difficulties associated with collecting
sufficient pore water from the cores for analysis because of leaking cores and low
sediment porosity. Total organic matter was also significantly negatively correlated to
pore water nitrate concentrations on July 11, August 26, and October 26. This
relationship is consistent with the reasoning given above. In locations with available
organic matter, processes such as respiration consume oxygen and produce suitable
conditions for denitrifying activity, which in turn, decreases the nitrate concentrations.
The lack of significance on August 4 is likely due to low pore water sample size
associated with the collection procedure.
The premise that nitrate removal from the upwelling pore water in the stream
sediments is attributed to denitrification occurring mostly in the shallow sediments (top
20 cm) was further supported by the mass balance calculations. The mass balance
included the comparison between the potential denitrification rate converted to a potential
nitrate Removal rate versus the observed nitrate loss rate along the length of the intact
sediment cores. During all sampling dates, the vertical profiles showed that the majority
of the potential nitrate Removal occurred at the shallower depths (0-10 cm below the
sediment surface). This finding corresponded to the observation that the greatest pore
water nitrate loss rates also occurred in these shallow depths. The overall potential nitrate
Removal rate was not only sufficient to account for the observed nitrate loss rate but was
30, 105, and 2.9 times greater for sampling dates July 11, August 4, and October 26,
respectively. It is also important to consider not only the potential nitrate removal rate

64
based on the N2O production, but also the required rate of organic matter removal. Based
on the stoichiometry of the denitrification reaction (1), it would require a minimum
oxidation rate for organic carbon of 1.25 mm C/ mm N given that carbon is 12 mg/mm
and nitrogen is 14 mg/mm. The ratio of carbon to nitrogen is ((12*1.25)/14) = 15/14 or
about 1:1. Therefore, on sampling dates July 11, August 4, and October 16, the potential
denitrification rate reflected a loss of approximately 9.42, 10.07, 0.402 mg C L-1 hr-1,
respectively. This calculated loss of carbon is great but is most likely realistic when
considering the short incubation times of the laboratory incubations.
The discrepancy between potential rate and the observed rate may be due to
several factors derived from differences between the conditions in the incubation bottles
and field conditions. The sediment slurries used to determine the denitrification potential
rate were made completely anaerobic by bubbling with N2 gas to ensure that
denitrification would not be inhibited by mixing oxygenated water through the entire
slurry. These conditions likely do not match those in the stream sediments where there is
an upwelling of aerobic ground water and heterogenous distribution of anoxic zones due
to the distribution of organic matter. In addition, the sediment samples were mixed with
artificial ground water and shaken to distribute the acetylene. This action created more
surface area for contact between denitrifying bacteria, that are attached to the sediment
particles or suspended in solution, and organic matter, which should increase the
denitrification potential. Furthermore, the denitrification potential assay was carried out
at room temperature, which may be slightly higher than the in situ sediment temperature
allowing for faster rates. Whereas, in this study the denitrification potential assay most
certainly reflects an inflated rate, the linear velocity used to determine the observed

65
nitrate loss rate may also not reflect in situ conditions and may be an underestimate of the
flow rate. The Darcy velocity was determined by laboratory sediment column
experiments in which the flow rate was varied until the inflow and outflow nitrate
concentrations reflected field observations. Oxygen levels of the pore water in the
laboratory column may be a factor in controlling the change in nitrate and therefore
affecting the laboratory determined flow rate. Higher oxygen conditions in the column
than the in situ levels in the sediments would require a slower flow rate (higher residence
time) than exists in the field to hypoxic create conditions necessary to reduce the pore
water nitrate by denitrification.
On the other hand, the acetylene block assay has been found to underestimate
denitrification in previous studies in which the acetylene was only 50-70% effective in
blocking N2O reduction to N2 (Seitzinger, 1993). In addition, it has been found that
acetylene also blocks nitrification, so that it may reduce denitrification by decreasing the
supply of nitrate in systems where nitrification and denitrification are coupled (Watts,
2000). However, as with other studies, this limitation is not important in our Cobb Mill
Creek study because the major source of nitrate is the upwelling ground water from the
hill- slope adjacent to a fertilized agricultural field and not in situ nitrification of NH4+
released from decaying organic matter (Hill et al., 2000). Furthermore, determining
nitrogen removal by denitrification does not account for uptake by benthic plants and
microbes (Seitzinger et al., 2002). These are important considerations to keep in mind,
although the denitrification potential rates in our study were more than sufficient to
account for the observed nitrate loss rate.

66
Riparian zones separating agricultural fields and streams are an important control
point of nitrate along its subsurface flow path from the terrestrial to the aquatic ecosystem
(Hill, 1996). Up to 98% nitrate removal has been reported along this subsurface flow
through a riparian forest (Hill, 1996). It is also well documented that particularly the
narrow zone comprising the ground water/ stream water interface, often within a riparian
wetland, is the optimal location for nitrate transformations (Lowrance et al., 1984,
Peterjohn and Correll, 1984, Jacobs and Gilliam, 1985a,b, Cooper 1990, McDowell et al.
1992, Triska et al., 1993, Hedin, 1998). The results in the current study correspond to
these findings, given that even in the absence of a riparian wetland along the study reach,
approximately 85% of the nitrate was removed and the highest denitrification potential
was found at the ground water- stream sediment interface at Cobb Mill Creek. Hedin et
al. (1998) proposed that in order to understand and predict the locations of high rates of
biogeochemical function (in this case, denitrification) in riparian zones, the interaction
between microbes and variations in the supplies of electron donors and acceptors must be
known. Hedin et al. (1998) found that denitrification was restricted to a narrow zone at
20-40 cm deep near a stream bank where a lateral flow of pore water with high DOC
from organic surface sediment (electron donor) interacted with the vertical upwelling of
nitrate-rich ground water (electron acceptor). The results of the Cobb Mill Creek study
support a similar conclusion: that total organic matter is an important controller of the
denitrification rates, given that the highest rates were found at the location of the
intersection of upwelling nitrate-rich pore water with layers of organic matter near the
sediment surface. The deposition and burial of organic matter from the surrounding
riparian forest and shallow lateral ground water flow were important sources of organic

67
matter to the shallow stream sediments of Cobb Mill Creek. Using a similar acetylene
block method with sediment slurries, Pfenning and McMahon (1996) also found higher
rates of denitrification potential in surface stream sediments, receiving upwelling nitrate-
rich ground water while stream water maintained lower nitrate concentrations. The
surface sediments contained relatively high amounts of organic matter, compared to
deeper sediments. In addition, these researchers found lower rates of N2O production
occurred in buried sediments with less organic matter, but higher nitrate concentrations.
The form of the available organic matter is also an important factor in
determining denitrification rates. Labile organic matter availability is an important
control on denitrification rates in soils and sediments (Starr & Gillham, 1989). In Cobb
Mill Creek, some locations below 20 cm, especially along the right bank of the stream,
were found where nitrate-rich pore water intersects pockets of deeper organic matter, yet
lower potential denitrification was observed than in the shallower sediments. The
conditions at these locations may not be sufficiently reducing for the denitrifiers to
remove significant amounts of nitrate. Although organic matter can be transported in the
flow of upwelling ground water, the organic matter may not be in a labile form to act as
an electron donor either for respiration (creates reducing conditions) or for denitrification
to occur. The most labile form, dissolved organic carbon, was not measured in the Cobb
Mill Creek sediments. Yet, this conclusion is supported by many studies, including the
following. Pfenning & McMahon (1996) found higher denitrification rates occurred with
sediments amended with surface water derived fulvic acid as compared to ground water
derived fulvic acid or sedimentary organic carbon. The surface derived organic matter
was more labile, and more easily taken up by microbes. Hill & Sanmugadas (1985) found

68
the potential for nitrate removal in stream sediments at twenty-two sites in Southern
Canada was positively correlated with water- soluble content of the 0 – 5 cm sediment
depth (r = 0.82-89). Baker & Vervier (2004) determined through multiple linear
regressions, that denitrification rates were not predicted by dissolved organic carbon
content alone, but were best predicted by the concentration of low molecular weight
organic acids and the percent surface water in the alluvial sediments of the Garonne
River.
The denitrification rates reported in the current study at Cobb Mill Creek (range
16.91- 600 µmol N m-2 h-1) were comparable to other studies measuring denitrification in
stream and river sediments (range 0- 3214 µmol N m-2 h-1) (Table 9). Many of the studies
looking at nitrate loss by denitrification in stream sediments are based on shallow stream
sediments (0- 10 cm below the sediment surface). The study at Cobb Mill is one of the
few studies that has analyzed denitrification at greater depths in stream sediments.
Similar denitrification potential rates were found in the sediments at Cobb Mill Creek as
those found in the South Platt River, CO by Pfenning & McMahon (1996) at a depth of
60 cm below the sediment surface (Table 10). These two studies did confirm the fact that
shallow stream sediments are indeed a location where significant denitrification occurs.
Lateral Profiles in Stream Sediments
Results from lateral profiles of pore water nitrate concentration, total organic
matter, and potential denitrification show that in general, increased total organic matter
and increased potential denitrification at depths greater than 20 cm below the stream
sediment surface were only found along the right bank (facing downstream, cores 3, 6,

69
and 9) during all sampling dates. Allochthonous organic matter deposited into the stream
from the surrounding riparian forest may be consolidated and buried specifically along
the right bank of the stream due to the curvature of the stream at the sampling reach. High
nitrate concentrations at depths below 20 cm in some of these cores along the right bank
of the stream indicate that while high amounts of organic matter are present and some
potential denitrification was observed, the conditions may not be sufficiently reducing for
the denitrifiers to remove significant amounts of nitrate. The denitrification may occur
only in hot spots.
Tremendous spatial variability of potential nitrate Removal was shown by the
mass balance analysis for cores distributed laterally across the stream (Table 6). In
general, the highest potential nitrate Removal rate was found in the middle of the stream
in cross section two (in line with piezometer nest 4). Although the vertical profiles of
denitrification potential show more denitrification occurring at greater depths along the
right bank of the stream, there was not more total denitrification occurring at these
locations. Similarly shown in the vertical mass balance profiles, in most cases the
denitrification potential rate was sufficient to remove the observed nitrate loss at each
lateral location in the stream.
Similar areal variation in denitrification has been shown in other studies. In a
study of in situ denitrification activity (IDA) in sediments of the River Dorn, England,
there was no significant difference in IDA due to position in the cross-section, but it was
noted that high IDAs were found in areas of fine-grained sediment accumulation in
stream margins, especially on the outside of meander bends at points where there was no
distinct stream bank (Cooke and White, 1987).

70
Temporal Variation
The measured ground water nitrate concentrations in the stream piezometers were
generally half the concentration in the Fall 2002 of those samples collected in the
Summer-Winter of 2003. Nitrate concentrations might be expected to be higher in the fall
and winter since biotic uptake and microbial transformations decrease with lower
temperatures. The lower nitrate concentrations found in 2002 could be due to the drought
conditions of that Summer when slow discharge delivered less nitrate to the ground
water. It is also possible that the discrepancy may be attributed to the difference in
techniques of the colorimetric cadmium reduction method and ion chromatography. The
upper concentration limit may be incorrect in the colorimetric method since it was
discovered after testing that the color production was saturated and was not reflecting the
true nitrate concentration of the samples. Nitrate concentration was not linear with
absorbance at higher concentrations.
The potential denitrification rates were highest in the July sampling event, lower
in August, and an order of magnitude lower in October. This temporal variation may be
due to lower temperatures; denitrifiers are temperature sensitive although direct evidence
of temporal variation was not collected in this study. Pfenning, & McMahon (1996)
found that lowering incubation temperatures from 22 to 4oC in the laboratory sediment
slurries resulted in a 77% decrease in the N2O production rates.
Conceptual Model
Synthesis of the hydrological and chemical ground water and stream data led to
the development of a conceptual model to explain the discrepancy between high

71
concentrations of nitrate in the deeper ground water flow paths that discharge into the
stream, and the low nitrate concentrations found in open channel of Cobb Mill Creek. As
described above, it is proposed that a local oxygenated ground flow path determines the
nitrate concentration in the stream. Within this local system there is a deep and shallow
ground water flow path with differing nitrate concentrations. The shallow local flow path
is less than two meters deep and contains low nitrate concentrations (1-5 mg NO3- L-1)
originating most likely from natural decomposition or deposition processes. This shallow
local flow path discharges into the stream laterally through the stream bank and combines
with the upstream flow contributing to the stream nitrate concentration at approximately
1-2 mg NO3- L-1. The deeper flow path is greater than two meters deep and contained
higher nitrate concentrations (9- 12 mg NO3- L-1) originating from the agricultural field.
As pore water that contains nitrates leached from the agricultural field flows along the
deeper oxygenated ground water flow path, it undergoes little alteration in nitrate
concentration. The ground water discharges vertically upward into the stream sediment,
and the nitrate is not removed until it reaches the shallow stream sediments
approximately 20 cm below the sediment surface. In those 20 centimeters, the high
denitrification potential, high organic matter content, low redox potential, and decreasing
nitrate to chloride ratio lead to the conclusion that conditions at this depth in the stream
sediments are optimal for denitrifiers to reduce NO3- to N2. Our results indicate that,
while denitrification rates in Cobb Mill Creek sediments are spatially and temporally
variable, denitrification is a significant nitrate sink during transport from the nitrate
contaminated hillslope to the stream. Organic matter availability and reducing conditions
are critical factors influencing the observed spatial and temporal patterns.

72
CONCLUSION
Forested riparian buffers surrounding streams provide vital functions such as
assimilation of nutrients; provide habitat and shade to terrestrial and aquatic species; and
input organic matter. This input of organic matter to stream sediments fuels denitrifying
bacteria. The organic matter can be deposited both directly into the stream and to shallow
ground water, and can be subsequently laterally transferred to shallow sediments and
buried. The results of this research support several studies in the current literature that
conclude that organic carbon is of greatest significance in determining the ability of
ground water- surface water interface to remove nitrate by denitrification. In an
agricultural watershed, increasing denitrification rates in riparian zones such as those
encompassing Cobb Mill Creek on the Eastern Shore of Virginia is an important
management strategy to controlling aqueous nitrate concentrations. Enhancing nitrate
removal by directly supplying organic matter to stream sediments may cause problems to
downstream environments (Hedin, 1998). However, the maintenance of riparian buffers
with organic-rich soils that separate agricultural fields and streams is essential for natural
remediation of nitrate concentrations in streams in order to prevent nutrient enrichment of
downstream environments.

73
REFERENCES
Baker, M.A., Vervier P. (2004) Hydrological variability, organic matter supply and denitrification in the Garonne River ecosystem. Freshwater Biology. 49 (2): 181. Bragan, R.J., Starr, J.L., and Parkin, T.B. (1997) Shallow Ground water Denitrification Rate Measurement by Acetylene Block. Journal of Environmental Quality. 26: 1531-1538. Bohlke. J.K., Wanty, R., Tuttle, M., Delin, G., and Landon, M. (2002) Denitrification in the recharge area and discharge area of a transient agricultural nitrate plume in a glacial outwash sand aquifer, Minnesota. Water Resources Research. 38 (7): 10-26. Brady, N.C., and Weil, R.R. (1999) The Nature and Properties of Soils. Twelfth Edition. Prentice Hall, Inc., Upper Saddle River, New Jersey. Chauhan, M.J., and Mills, A.M. (2002) Modeling baseflow nitrate loading on the Eastern Shore of Virginia. In: Atlantic Estuarine Research Federation Spring Meeting, Lewes, DE. Christensen, P.B., Sorensen, J. (1988) Denitrification in sediment of lowland streams: Regional and seasonal variation in Gelaek and Rabis Baek, Denmark. FEMS Microbiology Ecology. 53: 335- 344. Cirmo, C.P., McDonnell, J.J. (1997) Linking the hydrologic and biogeochemical controls on nitrogen transport in near-stream zones of temperate-forested catchments: a review. Journal of Hydrology. 199: 88-120. Cobb, P.R.& Smith, D.W. (1989) Soil Survey of Northhampton County, Virginia. U.S.D.A., Soil Conservation Service, Virginia Polytechnic Institute and State University. Cooke, J.G. and White, R.E. (1987) Spatial distribution of denitrifying activity in a stream draining an agricultural catchment. Freshwater Biology. 18: 509- 519. Cooper, A.B. (1990) Nitrate depletion in the riparian zone and stream channel of a small headwater catchment. Hydrobiologia. 202: 13- 26. Cooper, A.B., Cooke, J.G. (1984) Nitrate loss and transformation in two vegetated headwater stream. New Zealand Journal of Marine and Freshwater Research. 19: 441- 450. Delwiche, C.C. and Bryan, B.A. (1976) Denitrification. Annual Review of Microbiology. 30: 241-262.

74
Dobson, R.W. (1997) Sulfate sorption in a shallow sandy aquifer. MS Thesis. University of Virginia. Duff, J.H., Triska, F.J., and OremLand, R.S. (1984) Denitrification associated with stream periphyton: Chamber estimates from undisturbed communities. Journal of Environmental Quality. 13: 514- 518. Duff, J.H., Murphy, F., Fuller, C.C., Triska, F.J., Harvey, J.W., and Jackman, A.P. (1998) A mini drivepoint sampler for measuring porewater solute concentrations in the hyporheic zone of sand-bottom streams. Limnology and Oceanography. 43: 1378-1383. Fraser, B.G. and Williams, D.D. (1998) Seasonal Boundary Dynamics of a Ground water- surface-Water Ecotone. Ecology, 79 (6): 2019- 2031. Freeze, R.A., and Cherry, J.A. (1979) Ground Water. Prentice-Hall, Inc. Englewood Cliffs, New Jersey. p.415. Hedin, L.O., von Fisher, J.C., Ostrom, J.C., Kennedy, B.P., Brown, M.G., and Robertson, G.P. (1998) Thermodynamic Constraints on Nitrogen Transformations and other biogeochemical processes at soil-stream interfaces. Ecology. 79 (2): 684-703. Hill, A.R. (1990) Ground water flow paths in relation to nitrogen chemistry in the near-stream zone. Hydrobiologia. 206: 39- 52. Hill, A.R. (1996) Nitrate removal in stream riparian zones. Journal of Environmental Quality. 25: 743-754. Hill, A.R., Sanmugadas, K. (1985) Denitrification rates in relation to stream sediment characteristics. Water Research. 19: 1579- 1586. Hill, A.R., Devito, K.J., Campangnolo, S., Sanmugadas, K. (2000) Subsurface denitrification in a forest riparian zone: Interactions between hydrology and supplies of nitrate and organic carbon. Biogeochemistry. 51: 193- 223. Hinkle, S.R., Duff, J.H, Triska, F.J., Laenan, A., Gates, E.B., Bencala, K.E., Wentz, D.A, & Silva, S.R. (2001) Linking hyporheic flow and nitrogen cycling near the Williamette River- a large river in Oregon, USA. Journal of Hydrology. 244: 157-180. Hubbert, M.K. (1940) The theory of ground water motion. Journal of Geology. 48 (8) pt. 1. 78-944. Jacobs, T.C. & Gilliam, J.W. (1985a) Headwater stream losses of nitrogen from two coastal plain watersheds. Journal of Environmental Quality, 14: 467-472.

75
Jacobs, T.C. & Gilliam, J.W. (1985b) Riparian losses of nitrate from agricultural drainage water. Journal of Environmental Quality, 14: 472-478. Jones, M.N. (1984) Nitrate reduction by shaking with Cadmium: Alternative to Cadmium Columns. Water Resources. 18 (5): 643-646. Knapp, E.W., Herman, J.S. Mills, A.L., and Hornberger, G.M. (2002) Changes in the sorption capacity of Coastal Plain sediments due to redox alterations of mineral surfaces. Applied Geochemistry. 17: 387-398. Lamontagne, M.G., Valiela, I. (1995) Denitrification Measured by a Direct N2 Flux method in Sediments of Waquoit, MA. Biogeochemistry. 31: 63-83. Lowrance, R.R., Todd R.L., & Asmussen, L.E. (1984) Nutrient Cycling in an agricultural watershed: I. Phreatic movement. Journal of Environmental Quality. 13: 22-27. Lowrance, R. (1992) Ground water Nitrate and Denitrification in a Coastal Plain Riparian Forest. Journal of Environmental Quality. 21: 401-405. McClain, M.E., Boyer, E.W., Dent, C.L., Gergel, S.E., Grimm, N.B., Groffman, P.M., Hart, S.C., Harvey, J.W., Johnston, C.A., Mayorga, E., McDowell, W.H., Pinay, G. (2003) Biogeochemical Hot Spots and Hot Moments at the Interface of Terrestrial and Aquatic Ecosystems. Ecosystems. 6: 301-312. McDowell, W.H., Bowden, W.B., Asbury, C.E. (1992) Riparian nitrogen dynamics in two geomorphologically distinct tropical rain forest watersheds: subsurface solute patterns. Biogeochemistry. 18: 53- 75. Mills, A.L., Hornberger, G.M., Herman, J.S, Chauhan, M.J., Galavotti, H.S. (2002) Hyporheic Zones in Coastal Streams: Filters for Removal of Agricultural Nitrate. In: Fall Meeting of the American Geophysical Union San Francisco, CA. Mills, A.L., Hornberger, G.M., Herman, J.S. NSF Proposal. Montgomery, H.A.C. & Dymock, J.F. (1961) Analyst 86: 414-416. Nolan, B.T. (1999) Nitrate Behavior in Ground Waters of the Southeastern United States. Journal of Environmental Quality. 28 (5): 1518-1527. Pattinson, S.N., Garcia-Ruiz, R., Whitton, B.A. (1998) Spatial and Seasonal Variation in Denitrification in the Swale-Ouse System, a River Continuum. The Science of the Total Environment. 210/211: 289-305. Peterjohn, W.T. & Correll, D.L. (1984) Nutrient Dynamics in an agricultural watershed: observations on the role of a riparian forest. Ecology. 65: 1466-1475.

76
Pfenning, K.S., McMahon, P.B. (1996) Effect of nitrate, organic carbon, and temperature on potential denitrification rates in nitrate-rich riverbed sediments. Journal of Hydrology. 187: 283-295. Pinay, G., Roques, L., & Fabre, A. (1993) Spatial and temporal patterns of denitrification in a riparian forest. Journal of Applied Ecology. 30: 581-591. Reay, W.G., Robinson, M.A., Lunsford, C.A. (2001) Ground Water Nitrogen Contributions to Coastal Waters of Virginia’s Eastern Shore: Indentification of High-Risk Discharge Regions and Remediation Strategies. http://www.epa.gov/OWOW/watershed/Proceed/reay.htmL. Rice, W.R. (1989) Analyzing Tables of Statistical Tests. Evolution. 43: 223- 225. Richardson, D. (1992) Hydrogeology and analysis of the ground water flow system of the Eastern Shore, Virginia. U.S. Geological Survey. Open File Report. 91-190. Robinson J.B., Whiteley, H.R. Stammers, W. Kaushik, N.K., Sain, P. (1979) The fate of nitrate in small streams and its management implications. In Proc 10th Annual Agric. Waste Manage. Conf. Cornell University. p. 247 259. Seitzinger, S.P. (1987) The effect of pH on the release of phosphorus from Potomac River Sediments. CBP/TRS 15. U.S. EPA, Chesapeake Bay Program. Annapolis. p. 54. Seitzinger, S.P. (1988) Denitrification in freshwater and coastal marine ecosystems: Ecological and geochemical significance. Limnology and Oceanography. 33 (4, part 2): 702-724. Seitzinger, S.P. (1993) Denitrification measurements in aquatic sediments: A comparison of three methods. Biogeochemistry. 23: 147- 167. Seitzinger, S.P. (in press) Benthic nutrient cycling and oxygen consumption in the Delaware estuary. In S.K. Majumdar et al. [eds.], Ecology and Restoration of the Delaware River Basin. Penn. Acad. Sci. Seitzinger, S.P. Styles, R.V., Boyer, E.W., Alexander, R.B., Billen, G., Howarth, R.W., Mayer, B., Breemen, N.V. (2002) Nitrogen retention in rivers: model development and application to watersheds in the northeastern U.S.A. Biogeochemistry. 57/58: 199-237. Simmons, R.C., Gold, A.J., Groffman, P.M. (1992) Nitrate Dynamics in Riparian Forests: Ground water Studies. Journal of Environmental Quality. 21: 659-665.

77
Starr, R.C., Gillham, R.W. (1989) Controls on denitrification in shallow unconfined aquifers. In: Contaminant Transport in Ground water. Kobus & Kinzelback (eds). p. 51-56. Starr, R.C., Gillham R.W. (1993) Denitrification and Organic Carbon Availability in two Aquifers. Ground Water. 31 (6): 934- 947. Steinhart, G.S., Likens, G.E., Groffman, P.M. (2000) Denitrification in stream sediments in five northeastern (USA) streams. Verh. Internat. Verein. Limnol. 27: 1331-1336. Tesoriero, A.J., Liebscher, H., Cox, S.E. (2000) Mechanism and rate of denitrification in an agricultural watershed: Electron and mass balance along ground water flow paths. Water Resource Research. 36 (6): 1545- 1559. Tiedje, J. M. (1982) Denitrification. In: A. L. Page (Ed.), Methods of Soil Analysis. Madison, WI: ASA-SSSA. Part 2. pp.1011-1026. Triska, F.J. Duff, J.H., & Avanzino, R.J. (1993) The role of water exchange between a stream channel and its hyporheic zone in nitrogen cycling at the terrestrial-aquatic interface. Hydrolobiologia. 251: 167-184. U.S. EPA, Federal Register: (April 9, 1997) Sole Source Aquifer Designation for the Columbia and Yorktown-Eastover Multiaquifer System. 62 (68). U.S. EPA (1983) Methods for Chemical Analysis of Water and Wastes, Method 353.2 EPA-600/4-79-020. U.S.E.P.A., Cincinnati, Ohio, USA. Wagner-Riddle, C., Thurtell, G.W., King, K.M., Kidd, G.E., & Beauchamp, E.G. (1996) Nitrous Oxide and Carbon Dioxide Fluxes from a Bare Soil Using a Micrometerological Approach. Journal of Environmental Quality. 25: 898-907. Watts, S.H., Seitzinger, S.P. (2000) Denitrification rates in organic and mineral soils from riparian sites: a comparison of N2 flux and acetylene inhibition methods. Soil Biology and Biochemistry. 32: 1383-1392. Williams, D.D. (1993) Nutrient and flow vector dynamics at the hyporheic-ground water interface and their effects on the interstitial fauna. Hydrobiologia. 251: 185-198. in (Fraser, B.G. & Williams, D.D. (1998) Seasonal Boundary Dynamics of a Ground water- surface-Water Ecotone. Ecology. 79 (6): 2019- 2031. Winter, T.C., Harvey, J.D, Franke, O.L., Alley, W.M. (1998) Ground water and Surface Water: A Single Resource. U.S. Geological Survey Circular 1139. Denver, Colorado.

78
Appendix A: Piezometer and Well Locations Table A-1: Locations of Piezometers (A,B,& C) and Wells (W) by Total Station referenced to permanent monuments located by Global Positioning System. Elevation measured at the ground surface adjacent to each nest (N#) and at the top of the riser of each piezometer and well.
Point Easting (X) Northing (Y) Long (X) Lat (Y) Elevation (ASL)
MLSW 417722.970 4127572.070 -75.9282 37.2911 7.782 MLSE 417740.260 4127554.310 -75.9281 37.291 7.843 HT Well 417698.340 4127551.770 -75.9285 37.2909 7.671 Hill Mon 417652.090 4127552.510 -75.929 37.2909 4.480 N9 417648.880 4127563.300 -75.9291 37.291 3.949 N9W 4.603 Still W 417635.340 4127565.830 -75.9292 37.2911 1.335 N3 417638.890 4127556.130 -75.9292 37.291 2.033 N3A 2.441 N3B 2.269 N3C 2.101 N3W 1.960 N1 417637.940 4127555.980 -75.9292 37.291 1.690 N1A 2.411 N1B 2.122 N1C 1.776 N1W 2.003 N4 417638.830 4127553.650 -75.9292 37.2909 1.988 N4A 2.458 N4B 2.268 N4C 2.081 N4W 2.156 N5 417638.460 4127547.820 -75.9292 37.2909 1.645 N5A 2.269 N5B 2.114 N5C 1.888 N5W 1.857

79
Appendix A: Piezometer and Well Locations
Table A-1: continued. N6 417636.710 4127544.650 -75.9292 37.2909 1.423 N6A 2.134 N6B 1.953 N6C 1.779 N6W 1.772 N7 417644.235 4127556.036 -75.9291 37.291 3.121 N7A 3.800 N7B 3.807 N7W 3.793 N8 417643.910 4127544.890 -75.9291 37.2909 2.888 N8W 3.418 N10 417650.090 4127536.800 -75.9291 37.2908 3.944 N10A 4.570 N10B 4.565 S2 417633.880 4127547.400 -75.9293 37.2909 0.987 S2A 1.925 S2B 1.755 S1 417636.400 4127555.810 -75.9292 37.291 0.878 S1A 1.811 S1B 1.550

80
Appendix A: Piezometer and Well Locations Table A-2: Elevations of Piezometer and Well Openings above Sea Level Piezometer number
Length fromtop of riser to hole (m)
Depth of riser aboveground (m)
Depth below ground (m)
Elevation above sea level (m)
Height of hole ASL
N1A 1.508 0.608 0.900 2.411 0.903 N1B 1.509 0.500 1.009 2.122 0.613 N1C 1.510 0.103 1.407 1.776 0.266 N1W 1.508 0.301 1.207 2.003 0.495 N3A 1.470 0.400 1.070 2.441 0.971 N3B 1.475 0.255 1.220 2.269 0.794 N3C 1.475 0.075 1.400 2.101 0.626 N3W 1.470 0.070 1.400 1.960 0.490 N4A 1.470 0.475 0.995 2.458 0.988 N4B 1.470 0.295 1.175 2.268 0.798 N4C 1.470 0.100 1.370 2.081 0.611 N4W 1.470 0.160 1.310 2.156 0.686 N5A 1.475 0.630 0.845 2.269 0.794 N5B 1.470 0.470 1.000 2.114 0.644 N5C 1.475 0.260 1.215 1.888 0.413 N5W 1.470 0.230 1.240 1.857 0.387 N6A 1.475 0.720 0.755 2.134 0.659 N6B 1.470 0.550 0.920 1.953 0.483 N6C 1.470 0.350 1.120 1.779 0.309 N6W 1.470 0.345 1.125 1.772 0.302 S1A 1.520 0.920 0.600 1.811 0.291 S1B 1.520 0.640 0.880 1.550 0.030 S2A 1.500 1.100 0.400 1.925 0.425 S2B 1.500 0.880 0.620 1.755 0.255 N7A 2.699 0.668 2.031 3.800 1.101 N7B 3.004 0.672 2.332 3.807 0.803 N7W 3.010 0.660 2.350 3.793 0.783 N8W 3.010 0.658 2.352 3.418 0.408 N9W 3.010 0.646 2.364 4.603 1.593 N10A 2.997 0.669 2.329 4.570 1.573 N10W 3.010 0.663 2.347 4.565 1.555 still (stage) 1.335

81
Appendix B: Ground Water Solute Concentration
Table B-1: Chloride concentration (mg Cl- L-1) of Ground Water collected from Piezometer Nests for all sampling dates. Depth below ground surface is generally shown by piezometer letter: A: Shallowest, B: Mid and C: Deepest Depth. Piezometer
ID 07/11/03 7/11/03 SEM 10/26/0310/26/03SEM 11/30/03
11/30/03 SEM 12/19/03
12/19/03 SEM
N1A n/a n/a 32.24 0.00 31.2 0.4 57.9 1.8 N1B n/a n/a 26.90 2.81 19.0 0.0 31.1 1.1 N1C n/a n/a 17.81 1.24 16.4 0.0 25.2 0.2 N3A n/a n/a 32.24 0 ns ns 52.8 0.3 N3B n/a n/a 31.23 1.01 22.2 0.9 30.0 0.5 N3C n/a n/a 20.00 1.73 17.3 0.1 26.5 0.0 N4A n/a n/a 28.53 0.03 25.4 0.2 35.1 0.7 N4B n/a n/a 26.98 0.14 25.7 0.1 35.9 0.2 N4C n/a n/a 31.38 0.86 26.8 0.1 33.9 0.1 N5A n/a n/a 32.24 0.00 36.9 0.9 47.8 0.0 N5B n/a n/a 32.24 0.00 31.2 0.2 36.4 0.7 N5C n/a n/a 46.30 7.10 25.8 0.1 28.3 0.0 N6A 36 0 127.78 5.56 18.8 0.0 26.6 0.1 N6B 29.8 0.46 69.44 16.92 17.3 0.1 27.0 0.1 N6C 30.73 0.18 83.06 5.70 19.1 0.4 26.3 0.2 N7A 19 0.4 16.98 0.29 17.3 0.1 29.2 0.3 N7B 13.07 0.29 16.72 0.15 16.0 0.1 23.9 0.1
N10A 14.07 0.97 20.50 2.99 16.1 0.1 24.4 0.2 S1A 13.53 0.07 12.24 0.06 11.4 0.0 18.7 0.8 S1B 13.87 0.13 12.72 0.08 11.3 0.0 17.5 0.0 S2A 12.33 0.64 136.67 5.36 12.5 0.0 16.8 0.0 S2B 12 0.12 195.28 0.73 14.2 0.0 17.4 0.0
Stream at Exp
Hillslope 23.6 0.12 30.47 0.00 23.4 0.0 27.0 0.1 Stream at Culvert n/a n/a 22.24 5.90 n/a n/a n/a n/a

82
Appendix B: Ground Water Solute Concentration
Table B-2: Sulfate concentration (mg SO42- L-1) of Ground Water collected from
Piezometer Nests for all sampling dates. Depth below ground surface is generally shown by piezometer letter: A: Shallowest, B: Mid and C: Deepest Depth. Piezometer
ID 07/11/03 7/11/03 SEM 10/26/0310/26/03SEM 11/30/03
11/30/03 SEM 12/19/03
12/19/03 SEM
N1A n/a n/a 29.28 0.47 32.4 0.7 42.6 1.2 N1B n/a n/a 24.62 1.53 19.1 0.0 22.6 0.5 N1C n/a n/a 18.54 1.06 16.9 0.0 19.3 0.3 N3A n/a n/a 33.81 0 ns ns 36.7 0.3 N3B n/a n/a 32.26 4.36 23.9 0.9 21.8 0.4 N3C n/a n/a 23.07 1.44 19.5 0.3 20.3 0.2 N4A n/a n/a 25.40 0.26 29.7 3.2 28.1 0.6 N4B n/a n/a 27.34 0.26 32.9 0.2 32.2 0.3 N4C n/a n/a 27.47 0.26 32.1 0.2 32.2 0.0 N5A n/a n/a 22.29 0.93 24.9 0.0 26.9 0.0 N5B n/a n/a 44.04 23.04 24.6 0.3 23.7 0.0 N5C n/a n/a 31.05 6.05 22.7 0.2 22.5 0.2 N6A 26.56 0.3 28.91 1.56 24.7 0.0 21.6 0.0 N6B 27.16 0 25.17 1.23 24.1 0.6 21.9 0.2 N6C 25.96 0.3 30.03 2.16 22.2 0.2 20.7 0.2 N7A 24.76 1.49 18.31 0.43 16.9 0.0 19.3 0.2 N7B 21.18 0.3 16.81 0.43 16.5 0.0 18.9 0.0
N10A 26.26 0.52 17.93 0.92 18.2 0.0 22.5 0.2 S1A 20.28 0.3 21.30 0.00 22.2 0.1 25.3 0.6 S1B 20.88 0 21.30 0.00 22.2 0.1 26.5 0.2 S2A 17.29 0 240.00 25.17 20.3 0.0 22.1 0.0 S2B 17.59 0.3 127.21 3.06 21.5 0.1 23.2 0.0
Stream at Exp
Hillslope 56.45 0.3 45.38 0.12 50.7 0.2 35.0 0.2 Stream at Culvert n/a n/a 34.53 9.61 n/a n/a n/a n/a

83
Appendix C: Denitrification Potential Assay
Table C-1: Denitrification Assay on July 11, 2003. Bold indicates data used for analysis. Core Depth
(cm) Time (hr)
Peak Area (mvolt*sec)
Convert peak
area to mass
(nmol)
Convert mass to Conc.
(nmol/0.5 mL)
Total N2O using
Bunsen Absorpion Coefficient
(nmol)
Volume of
sample (mL)
nmol N2O/ ml/hr
1 2 1.42 44.00 5.49 10.98 550.52 7 55.52 2 2.58 98.50 12.29 24.58 1232.42 7 68.15 2 17.63 293.00 36.55 73.11 3665.99 7 29.70 1 10 1.80 4.74 0.59 1.18 59.31 8.4 3.92 10 2.83 5.52 0.69 1.38 69.07 8.4 2.90 10 17.98 0.00 0.00 0.00 0.00 8.4 0.00 1 20 1.73 7.89 0.98 1.97 98.72 10 5.70 20 2.78 21.80 2.72 5.44 272.76 10 9.80 20 17.93 126.00 15.72 31.44 1576.50 10 8.79 1 30 1.25 0.00 0.00 0.00 0.00 11 0.00 30 2.45 0.00 0.00 0.00 0.00 11 0.00 30 17.53 5.81 0.72 1.45 72.69 11 0.38 2 10 1.85 0.00 0.00 0.00 0.00 8.8 0.00 10 2.88 0.00 0.00 0.00 0.00 8.8 0.00 10 18.02 17.20 2.15 4.29 215.20 8.8 1.36 2 20 1.08 0.00 0.00 0.00 0.00 10 0.00 20 2.32 0.00 0.00 0.00 0.00 10 0.00 20 17.42 0.00 0.00 0.00 0.00 10 0.00 2 30 1.32 0.00 0.00 0.00 0.00 8.6 0.00 30 2.52 0.00 0.00 0.00 0.00 8.6 0.00 30 17.60 0.00 0.00 0.00 0.00 8.6 0.00 3 2 0.40 28.50 3.56 7.11 356.59 9 99.05 2 0.80 120.00 14.97 29.94 1501.43 9 208.53 2 2.22 187.00 23.33 46.66 2339.73 9 117.28 2 3.20 270.00 33.69 67.37 3378.22 9 117.30 2 18.33 668.00 83.34 166.68 8357.96 9 50.65 3 10 1.97 101.00 12.60 25.20 1263.70 10 64.26 10 3.00 180.00 22.46 44.91 2252.14 10 75.07 10 18.13 681.00 84.96 169.92 8520.61 10 46.99 3 20 0.50 0.00 0.00 0.00 0.00 10 0.00 20 1.92 0.00 0.00 0.00 0.00 10 0.00 20 2.95 1.54 0.19 0.38 19.27 10 0.65 20 18.07 0.00 0.00 0.00 0.00 10 0.00

84
Table C-1: continued. Core Depth
(cm) Time (hr)
Peak Area (mvolt*sec)
Convert peak
area to mass
(nmol)
Convert mass to Conc.
(nmol/0.5 mL)
Total N2O using
Bunsen Absorpion Coefficient
(nmol)
Volume of
sample- mL
nmol N2O/ ml/hr
3 30 0.75 0.00 0.00 0.00 0.00 10.5 0.00 30 2.08 0.00 0.00 0.00 0.00 10.5 0.00 30 3.10 7.37 0.92 1.84 92.21 10.5 2.83 30 18.23 0.00 0.00 0.00 0.00 10.5 0.00 4 2 1.62 68.90 8.60 17.19 862.07 10 53.32 2 2.68 123.00 15.35 30.69 1538.97 10 57.35 2 17.82 348.00 43.42 86.83 4354.15 10 24.44 4 10 1.47 2.17 0.27 0.54 27.15 10 1.85 10 1.50 1.82 0.23 0.45 22.77 10 1.52 10 2.65 6.09 0.76 1.52 76.20 10 2.88 10 17.70 117.00 14.60 29.19 1463.89 10 8.27 4 20 0.58 0.00 0.00 0.00 0.00 9.6 0.00 20 0.92 0.00 0.00 0.00 0.00 9.6 0.00 20 1.55 0.00 0.00 0.00 0.00 9.6 0.00 20 2.02 0.00 0.00 0.00 0.00 9.6 0.00 20 3.05 0.00 0.00 0.00 0.00 9.6 0.00 20 18.18 0.00 0.00 0.00 0.00 9.6 0.00 4 30 1.18 0.00 0.00 0.00 0.00 10.2 0.00 30 2.38 0.00 0.00 0.00 0.00 10.2 0.00 30 17.47 0.00 0.00 0.00 0.00 10.2 0.00 4 40 1.55 0.00 0.00 0.00 0.00 9.4 0.00 40 2.67 0.00 0.00 0.00 0.00 9.4 0.00 40 17.75 0.00 0.00 0.00 0.00 9.4 0.00 4 50 1.08 0.00 0.00 0.00 0.00 10.5 0.00 50 2.27 0.00 0.00 0.00 0.00 10.5 0.00 50 17.38 0.00 0.00 0.00 0.00 10.5 0.00

85
Appendix C: Denitrification Potential Assay Table C-2: Denitrification Assay on August 4, 2003. Bold indicates data used in analysis Core Depth
(cm) Time (hr)
Peak Area (mvolt*sec)
Convert peak area to mass (nmol)
Convert Mass to Conc.
(nmol/0.5ml)
Total N2O using
Bunsen Absorpion coefficient
(nmol)
Dry weight (grams)
nmol N2O/(g)
dry weight/hr
nmol N2O/ml/
hr
1 4 1.87 16.9 2.11 4.22 211.45 16.47 6.88 11.33 3.00 47.5 5.93 11.85 594.32 16.47 12.03 19.81 3.30 59.9 7.47 14.95 749.46 16.47 13.79 22.71 4.12 65.2 8.13 16.27 815.78 16.47 12.03 19.82 24.07 148 18.46 36.93 1851.76 16.47 4.67 7.69 56.20 265 33.06 66.12 3315.66 16.47 3.58 5.90 92.48 227 28.32 56.64 2840.20 16.47 1.86 3.07
1 11 0.92 0 0.00 0.00 0.00 17.33 0.00 0.00 2.05 0 0.00 0.00 0.00 17.33 0.00 0.00 3.10 0 0.00 0.00 0.00 17.33 0.00 0.00 3.85 0 0.00 0.00 0.00 17.33 0.00 0.00 23.90 19.3 2.41 4.82 241.48 17.33 0.58 1.01 92.62 110 13.72 27.45 1376.31 17.33 0.86 1.49
1 21 1.70 0 0.00 0.00 0.00 15.05 0.00 0.00 3.13 0 0.00 0.00 0.00 15.05 0.00 0.00 3.90 0 0.00 0.00 0.00 15.05 0.00 0.00 23.95 0 0.00 0.00 0.00 15.05 0.00 0.00
1 31 1.75 0 0.00 0.00 0.00 15.44 0.00 0.00 3.05 0 0.00 0.00 0.00 15.44 0.00 0.00 3.78 0 0.00 0.00 0.00 15.44 0.00 0.00 23.87 0 0.00 0.00 0.00 15.44 0.00 0.00 92.58 0 0.00 0.00 0.00 15.44 0.00 0.00
1 41 1.78 0 0.00 0.00 0.00 11.08 0.00 0.00 3.23 0 0.00 0.00 0.00 11.08 0.00 0.00 4.07 0 0.00 0.00 0.00 11.08 0.00 0.00 24.03 0 0.00 0.00 0.00 11.08 0.00 0.00
1 51 2.25 0 0.00 0.00 0.00 18.19 0.00 0.00 3.18 0 0.00 0.00 0.00 18.19 0.00 0.00 4.02 0 0.00 0.00 0.00 18.19 0.00 0.00 24.00 0 0.00 0.00 0.00 18.19 0.00 0.00
2 2 4.05 190 23.70 47.41 2377.26 13.87 42.32 58.70 5.12 250 31.19 62.38 3127.98 13.87 44.08 61.13 22.97 324 40.42 80.84 4053.86 13.87 12.73 17.65

86
Table C-2 continued Core Depth Time Area mass
(nmol) Concentration
(nmol/ml) Total N2O
(nmol) Dry wt. (grams)
nmol N2O/(g)/hr
nmol N2O/ml/
hr 2 22 4.15 1.22 0.15 0.30 15.26 14.94 0.25 0.37 23.05 0 0.00 0.00 0.00 14.94 0.00 0.00
2 32 4.20 0 0.00 0.00 0.00 16.25 0.00 0.00 23.13 1.4 0.17 0.35 17.52 16.25 0.05 0.08
2 42 4.25 0 0.00 0.00 0.00 15.86 0.00 0.00 23.10 0 0.00 0.00 0.00 15.86 0.00 0.00
2 52 4.30 0 0.00 0.00 0.00 10.99 0.00 0.00 23.18 0 0.00 0.00 0.00 10.99 0.00 0.00
3 10 1.00 0 0.00 0.00 0.00 13.18 0.00 0.00 2.10 0 0.00 0.00 0.00 13.18 0.00 0.00 2.70 0 0.00 0.00 0.00 13.18 0.00 0.00 3.53 0 0.00 0.00 0.00 13.18 0.00 0.00 23.62 0 0.00 0.00 0.00 13.18 0.00 0.00
3 20 1.67 0 0.00 0.00 0.00 8.28 0.00 0.00 2.77 0 0.00 0.00 0.00 8.28 0.00 0.00 3.57 0 0.00 0.00 0.00 8.28 0.00 0.00 23.67 0 0.00 0.00 0.00 8.28 0.00 0.00
3 30 1.60 0 0.00 0.00 0.00 7.95 0.00 0.00 2.78 0 0.00 0.00 0.00 7.95 0.00 0.00 3.62 0 0.00 0.00 0.00 7.95 0.00 0.00 23.72 0 0.00 0.00 0.00 7.95 0.00 0.00
3 40 1.92 0 0.00 0.00 0.00 8.73 0.00 0.00 2.83 7.85 0.98 1.96 98.22 8.73 3.97 3.47 3.67 0 0.00 0.00 0.00 8.73 0.00 0.00 23.77 0 0.00 0.00 0.00 8.73 0.00 0.00 92.52 1.54 0.19 0.38 19.27 8.73 0.02 0.02
3 60 2.15 3.42 0.43 0.85 42.79 7.30 2.73 1.99 2.93 5.89 0.73 1.47 73.70 7.30 3.44 2.51 3.72 5.77 0.72 1.44 72.19 7.30 2.66 1.94 23.82 66.8 8.33 16.67 835.80 7.30 4.81 3.51 92.45 92.3 11.52 23.03 1154.85 7.30 1.71 1.25
4 4 4.35 261 32.56 65.12 3265.61 12.97 57.88 75.07 23.23 502 62.63 125.26 6280.98 12.97 20.84 27.03
4 10 4.40 0 0.00 0.00 0.00 14.31 0.00 0.00 23.28 0 0.00 0.00 0.00 14.31 0.00 0.00
4 18 4.58 0 0.00 0.00 0.00 13.63 0.00 0.00 23.52 3.9 0.49 0.97 48.80 13.63 0.15 0.21
4 26 4.43 5.27 0.66 1.31 65.94 19.56 0.76 1.49 23.32 22.9 2.86 5.71 286.52 19.56 0.63 1.23

87
Table C-2 continued Core Depth Time Area mass
(nmol)Concentration(nmol/ml) Total N2O
(nmol) Dry wt. (grams)
nmol N2O/(g)/hr
nmol N2O/ml/
hr 4 36 4.48 0 0.00 0.00 0.00 11.68 0.00 0.00 23.38 2.74 0.34 0.68 34.28 11.68 0.13 0.15
4 46 5.07 0 0.00 0.00 0.00 13.73 0.00 0.00 22.33 0 0.00 0.00 0.00 13.73 0.00 0.00
4 56 4.53 0 0.00 0.00 0.00 18.92 0.00 0.00 23.42 0 0.00 0.00 0.00 18.92 0.00 0.00
5 2 3.80 488 60.88 121.77 6105.81 14.54 110.51 160.68 22.70 408 50.90 101.80 5104.86 14.54 15.47 22.49
5 9 3.85 90.7 11.32 22.63 1134.83 13.20 22.33 29.48 22.75 238 29.69 59.39 2977.84 13.20 9.92 13.09
5 18 3.90 2.97 0.37 0.74 37.16 11.42 0.83 0.95 22.78 42.4 5.29 10.58 530.51 11.42 2.04 2.33
5 29 3.95 0 0.00 0.00 0.00 15.41 0.00 0.00 22.90 24.6 3.07 6.14 307.79 15.41 0.87 1.34
5 39 4.02 0 0.00 0.00 0.00 14.97 0.00 0.00 22.95 4.58 0.57 1.14 57.30 14.97 0.17 0.25
5 49 4.07 0 0.00 0.00 0.00 17.60 0.00 0.00 23.00 1.13 0.14 0.28 14.14 17.60 0.03 0.06
5 59 4.10 0 0.00 0.00 0.00 14.79 0.00 0.00 23.05 0 0.00 0.00 0.00 14.79 0.00 0.00
5 69 4.15 0 0.00 0.00 0.00 15.05 0.00 0.00 23.08 0 0.00 0.00 0.00 15.05 0.00 0.00
5 79 4.20 0 0.00 0.00 0.00 17.36 0.00 0.00 23.13 0 0.00 0.00 0.00 17.36 0.00 0.00
6 2 1.60 148 18.46 36.93 1851.76 17.25 67.09 115.74 2.77 251 31.31 62.63 3140.49 17.25 65.80 113.51 34.23 699 87.21 174.41 8745.83 17.25 14.81 25.55 70.90 492 61.38 122.76 6155.86 17.25 5.03 8.68
6 12 1.65 20.8 2.60 5.19 260.25 15.34 10.28 15.77 2.67 29 3.62 7.24 362.85 15.34 8.87 13.61 34.15 45.7 5.70 11.40 571.79 15.34 1.09 1.67
6 22 1.70 12 1.50 2.99 150.14 14.77 5.98 8.83 2.83 22 2.74 5.49 275.26 14.77 6.58 9.72 34.38 24.9 3.11 6.21 311.55 14.77 0.61 0.91
6 32 1.82 16.2 2.02 4.04 202.69 12.50 8.93 11.16 2.88 22.5 2.81 5.61 281.52 12.50 7.81 9.76 34.42 268 33.44 66.87 3353.19 12.50 7.79 9.74
6 42 1.87 14.5 1.81 3.62 181.42 17.19 5.65 9.72 2.93 29.7 3.71 7.41 371.60 17.19 7.37 12.67 34.48 303 37.80 75.60 3791.11 17.19 6.40 10.99
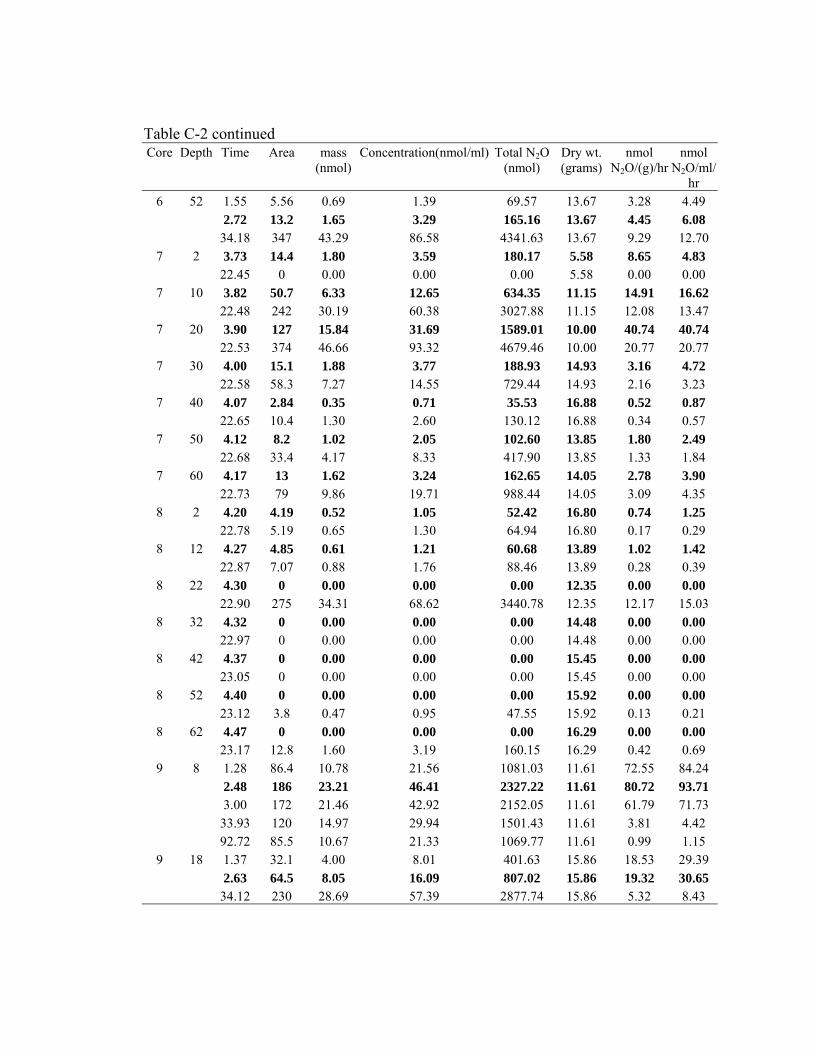
88
Table C-2 continued Core Depth Time Area mass
(nmol)Concentration(nmol/ml) Total N2O
(nmol) Dry wt. (grams)
nmol N2O/(g)/hr
nmol N2O/ml/
hr 6 52 1.55 5.56 0.69 1.39 69.57 13.67 3.28 4.49 2.72 13.2 1.65 3.29 165.16 13.67 4.45 6.08 34.18 347 43.29 86.58 4341.63 13.67 9.29 12.70
7 2 3.73 14.4 1.80 3.59 180.17 5.58 8.65 4.83 22.45 0 0.00 0.00 0.00 5.58 0.00 0.00
7 10 3.82 50.7 6.33 12.65 634.35 11.15 14.91 16.62 22.48 242 30.19 60.38 3027.88 11.15 12.08 13.47
7 20 3.90 127 15.84 31.69 1589.01 10.00 40.74 40.74 22.53 374 46.66 93.32 4679.46 10.00 20.77 20.77
7 30 4.00 15.1 1.88 3.77 188.93 14.93 3.16 4.72 22.58 58.3 7.27 14.55 729.44 14.93 2.16 3.23
7 40 4.07 2.84 0.35 0.71 35.53 16.88 0.52 0.87 22.65 10.4 1.30 2.60 130.12 16.88 0.34 0.57
7 50 4.12 8.2 1.02 2.05 102.60 13.85 1.80 2.49 22.68 33.4 4.17 8.33 417.90 13.85 1.33 1.84
7 60 4.17 13 1.62 3.24 162.65 14.05 2.78 3.90 22.73 79 9.86 19.71 988.44 14.05 3.09 4.35
8 2 4.20 4.19 0.52 1.05 52.42 16.80 0.74 1.25 22.78 5.19 0.65 1.30 64.94 16.80 0.17 0.29
8 12 4.27 4.85 0.61 1.21 60.68 13.89 1.02 1.42 22.87 7.07 0.88 1.76 88.46 13.89 0.28 0.39
8 22 4.30 0 0.00 0.00 0.00 12.35 0.00 0.00 22.90 275 34.31 68.62 3440.78 12.35 12.17 15.03
8 32 4.32 0 0.00 0.00 0.00 14.48 0.00 0.00 22.97 0 0.00 0.00 0.00 14.48 0.00 0.00
8 42 4.37 0 0.00 0.00 0.00 15.45 0.00 0.00 23.05 0 0.00 0.00 0.00 15.45 0.00 0.00
8 52 4.40 0 0.00 0.00 0.00 15.92 0.00 0.00 23.12 3.8 0.47 0.95 47.55 15.92 0.13 0.21
8 62 4.47 0 0.00 0.00 0.00 16.29 0.00 0.00 23.17 12.8 1.60 3.19 160.15 16.29 0.42 0.69
9 8 1.28 86.4 10.78 21.56 1081.03 11.61 72.55 84.24 2.48 186 23.21 46.41 2327.22 11.61 80.72 93.71 3.00 172 21.46 42.92 2152.05 11.61 61.79 71.73 33.93 120 14.97 29.94 1501.43 11.61 3.81 4.42 92.72 85.5 10.67 21.33 1069.77 11.61 0.99 1.15
9 18 1.37 32.1 4.00 8.01 401.63 15.86 18.53 29.39 2.63 64.5 8.05 16.09 807.02 15.86 19.32 30.65 34.12 230 28.69 57.39 2877.74 15.86 5.32 8.43

89
Table C-2 continued Core Depth Time Area mass
(nmol)Concentration(nmol/ml) Total N2O
(nmol) Dry wt. (grams)
nmol N2O/(g)/hr
nmol N2O/ml/
hr 9 28 1.40 16.6 2.07 4.14 207.70 17.87 8.30 14.84 2.58 30.8 3.84 7.69 385.37 17.87 8.35 14.92 34.05 257 32.06 64.13 3215.56 17.87 5.28 9.44
9 38 1.45 0 0.00 0.00 0.00 15.28 0.00 0.00 2.53 0 0.00 0.00 0.00 15.28 0.00 0.00 33.97 220 27.45 54.89 2752.62 15.28 5.30 8.10 34.02 221 27.57 55.14 2765.13 15.28 5.32 8.13
9 48 1.50 0 0.00 0.00 0.00 17.10 0.00 0.00 2.80 0 0.00 0.00 0.00 17.10 0.00 0.00 34.28 2.44 0.30 0.61 30.53 17.10 0.05 0.09

90
Appendix C: Denitrification Potential Assay Table C-3: Denitrification Assay on August 26, 2003. Rates not determined on this date
Core Depth Peak Area (mvolt*sec)
Convert peak area to mass
(nmol)
Convert mass to concen.
Divide by 0.5ml
(nmol/ml)
Total N2O using
Bunsen Absorpion coefficient
(nmol)
Dry weight (grams)
nmol N2O/gram
of dry sediment
nmol Total
N2O/ml
1 2 31.4 3.92 7.83 392.87 8.23 47.74 39.29 6 0 0.00 0.00 0.00 13.94 0.00 0.00 16 0 0.00 0.00 0.00 15.36 0.00 0.00 26 1.4 0.17 0.35 17.52 15.27 1.15 1.75 36 0 0.00 0.00 0.00 16.36 0.00 0.00 46 1.38 0.17 0.34 17.27 11.42 1.51 1.73 56 7.11 0.89 1.77 88.96 15.32 5.81 8.90 66 5.55 0.69 1.38 69.44 15.54 4.47 6.94
2 2 26 3.24 6.49 325.31 14.75 22.05 32.53 12 7.8 0.97 1.95 97.59 14.75 6.62 9.76 22 3.45 0.43 0.86 43.17 14.75 2.93 4.32 32 0 0.00 0.00 0.00 14.75 0.00 0.00 42 1.03 0.13 0.26 12.89 14.75 0.87 1.29 52 0 0.00 0.00 0.00 14.75 0.00 0.00 62 0 0.00 0.00 0.00 14.75 0.00 0.00
3 2 13.3 1.66 3.32 166.41 14.75 11.28 16.64 10 0 0.00 0.00 0.00 14.75 0.00 0.00 20 0 0.00 0.00 0.00 14.75 0.00 0.00 30 15.2 1.90 3.79 190.18 14.75 12.89 19.02 40 12.7 1.58 3.17 158.90 14.75 10.77 15.89 50 4.05 0.51 1.01 50.67 14.75 3.44 5.07
4 1 395 49.28 98.56 4942.21 14.23 347.41 494.22 10 0 0.00 0.00 0.00 14.87 0.00 0.00 20 17.4 2.17 4.34 217.71 13.81 15.77 21.77 30 3.2 0.40 0.80 40.04 13.42 2.98 4.00 40 0 0.00 0.00 0.00 16.31 0.00 0.00 50 1.6 0.20 0.40 20.02 16.98 1.18 2.00 60 6.45 0.80 1.61 80.70 13.93 5.80 8.07
5 1 39.8 4.97 9.93 497.97 15.14 32.89 49.80 10 9.71 1.21 2.42 121.49 11.51 10.56 12.15 20 10.2 1.27 2.55 127.62 12.83 9.95 12.76 30 3.46 0.43 0.86 43.29 16.13 2.68 4.33 40 0 0.00 0.00 0.00 13.60 0.00 0.00 50 7.98 1.00 1.99 99.85 16.14 6.19 9.98 60 0 0.00 0.00 0.00 15.58 0.00 0.00 70 4.15 0.52 1.04 51.92 15.24 3.41 5.19

91
Table C-3 continued
Core Depth Area Mass (nmol)
Concentration
(nmol/ml) Total N2O
(nmol)
Dry weight (grams)
nmol N2O/gram
nmol Total
N2O/ml6 8 10.9 1.36 2.72 136.38 12.75 10.70 13.64 18 68.8 8.58 17.17 860.82 14.17 60.75 86.08 28 28 3.49 6.99 350.33 10.57 33.16 35.03 38 53.1 6.62 13.25 664.38 13.21 50.30 66.44 48 0 0.00 0.00 0.00 14.83 0.00 0.00 58 5.56 0.69 1.39 69.57 17.42 3.99 6.96
7 1 63.7 7.95 15.89 797.01 14.70 54.21 79.70 11 41.8 5.21 10.43 523.00 17.16 30.48 52.30 21 0 0.00 0.00 0.00 15.93 0.00 0.00 31 0 0.00 0.00 0.00 16.93 0.00 0.00 41 0 0.00 0.00
0.00
0.00 0.00 0.00
0.00
0.00 13.33 0.00 0.00 51 1.31 0.16 0.33 16.39 19.52 0.84 1.64 61 1.82 0.23 0.45 22.77 15.83 1.44 2.28 71 1.05 0.13 0.26 13.14 18.11 0.73 1.31
8 2 35.9 4.48 8.96 449.18 14.75 30.45 44.92 8 33.7 4.20 8.41 421.65 14.75 28.58 42.17 18 1.31 0.16 0.33 16.39 14.75 1.11 1.64 28 9.28 1.16 2.32 116.11 14.75 7.87 11.61 38 0 0.00 0.00 14.75 0.00 0.00 48 0 0.00 0.00 0.00 14.75 0.00 0.00 58 0 0.00 0.00 0.00 14.75 0.00 0.00 68 0 0.00 0.00 0.00 14.75 0.00 0.00
9 1 0 0.00 0.00 12.07 0.00 0.00 10 0 0.00 0.00 12.51 0.00 20 14.7 1.83 3.67 183.93 11.93 15.42 18.39 30 45 5.61 11.23 563.04 15.53 36.26 56.30 40 9.25 1.15 2.31 115.74 15.38 7.52 11.57 50 0 0.00 0.00 0.00 16.14 0.00 60 7.87 0.98 1.96 98.47 17.07 5.77 9.85

92
Appendix C: Denitrification Potential Assay Table C-4: Denitrification Assay on October 26, 2003. Bold indicates data in analysis
Core Depth Time (hrs) Peak Area (mvolt*sec)
Convert peak area to mass (nmol)
Convert mass to concen. Divide by
0.5ml (nmol/ml)
Total N2O using
Bunsen Absorpion coefficient
(nmol)
Total N2O/10ml of
sat sed/hr
1 2 4 8.57 1.07 2.14 107.23 2.68 6.5 8.67 1.08 2.16 108.48 1.67 22 28.8 3.59 7.19 360.34 1.64 68 126 15.72 31.44
0
0 0.00 0.00
5.32
22 11.53
22 4
0.00 0.00
4 0.00 0.00
1576.50 2.32 1 9 4 0 0.00 0.00 0.00 0.00 22 0 0.00 0.00 0.00 0.00
1 19 4 0 0.00 0.00 0.00 0.00 22 0 0.00 0.00 0.00 0.00
1 29 4 0.00 0.00 0.00 0.00 22 0 0.00 0.00 0.00 0.00
1 39 4 0 0.00 0.00 0.00 0.00 22 0 0.00 0.00 0.00 0.00
1 49 4 0 0.00 0.00 0.00 0.00 22 0 0.00 0.00 0.00 0.00
1 59 4 0.00 0.00 0.00 0.00 22 0 0.00 0.00
2 2 4 17 2.12 4.24 212.70 6.5 27.1 3.38 6.76 339.07 5.22 67.1 8.37 16.74 839.55 3.82 68 92.4 23.06 1156.10 1.70
2 12 4 1.44 0.18 0.36 18.02 0.45 6.5 2.6 0.32 0.65 32.53 0.50 23 11.2 1.40 2.79 140.13 0.61 68 35.2 4.39 8.78 440.42 0.65
2 0 0.00 0.00 0.00 0.00 22 0 0.00 0.00 0.00 0.00
2 32 4 0 0.00 0.00 22 0 0.00 0.00 0.00 0.00
2 42 4 0 0.00 0.00 0.00 0.00 22 0 0.00 0.00 0.00 0.00
2 52 0 0.00 0.00 0.00 0.00 22 0 0.00 0.00

93
Table C-4 continued
Core Depth Time Area mass
(nmol) Concentration
(nmol/ml) Total N2O
(nmol) nmol
N2O/ml/hr3 2 4 1.92 0.24 0.48 24.02 0.60 6.5 1.26 0.16 0.31 15.77 0.24 23 1.03 0.13 0.26 12.89 0.06
0 0.00 0.00 0.00
22
0.98 0.00
48
0.00 0.00
0.00
22
12 6.5 1.04
8.76 0.00
5 0
0.00 0.00 0.00
1.18
68 0 0.00 0.00 0.00 0.00 3 8 4 0.00 0.00 0.00 0.00 22 0 0.00 68 0 0.00 0.00 0.00 0.00
3 18 4 0 0.00 0.00 0.00 0.00 0 0.00 0.00 0.00 0.00
3 28 4 0 0.00 0.00 0.00 0.00 22 7.89 1.97 98.72 0.45
3 38 4 0 0.00 0.00 0.00 22 0 0.00 0.00 0.00 0.00
3 4 0 0.00 0.00 0.00 0.00 22 0 0.00 0.00 0.00 0.00
4 2 4 0.00 0.00 0.00 4 5 4 0 0.00 0.00 0.00 22 0 0.00 0.00 0.00 0.00
4 15 4 0 0.00 0.00 0.00 0.00 22 0 0.00 0.00 0.00 0.00
4 25 4 0 0.00 0.00 0.00 0.00 22 0 0.00 0.00 0.00
4 35 4 0 0.00 0.00 0.00 0.00 22 0 0.00 0.00 0.00 0.00
4 45 4 0 0.00 0.00 0.00 0.00 0 0.00 0.00 0.00 0.00 5 2 4 14.4 1.80 3.59 180.17 4.50 6.5 17.1 2.13 4.27 213.95 3.29 22 36 4.49 8.98 450.43 2.05 68 40.3 5.03 10.06 504.23 0.74
5 4 3.37 0.42 0.84 42.17 1.05 8.36 2.09 104.60 1.61 22 35.1 4.38 439.17 2.00
5 22 4 0 0.00 0.00 0.00 22 1.5 0.19 0.37 18.77 0.09
42 4 0 0.00 0.00 0.00 0.00 22 0.00 0.00 0.00 0.00
5 52 4 0 0.00 0.00 0.00 22 0 0.00 0.00
7 2 4 3.76 0.47 0.94 47.04 6.5 8.61 1.07 2.15 107.73 1.66 22 24.4 3.04 6.09 305.29 1.39

94
Table C-4 continued
Core Depth Time Area mass
(nmol) Concentration
(nmol/ml) Total N2O
(nmol) nmol
N2O/ml/hr 7 32 4 0 0.00 0.00 0.00 0.00 22 0 0.00 0.00 0.00 0.00
7 42 4 0 0.00 0.00 0.00 0.00 22 0 0.00 0.00 0.00 0.00
7 52 4 0 0.00 0.00 0.00 0.00 22
6.72 0.84 1.68
40.3 5.03 0.00
35 4 0 0
0.00 0.00
22 4
2.25 182.67
4.52 9.03
0.00 0.15
9
0.00 0.00 0.00
0 0.00 0.00 0.00 0.00 8 5 4 84.08 2.10 6.5 8.23 1.03 2.05 102.97 1.58 22 21.8 2.72 5.44 272.76 1.24 68 10.06 504.23 0.74
8 15 4 0 0.00 0.00 0.00 22 13.1 1.63 3.27 163.91 0.75
8 25 4 0 0.00 0.00 0.00 0.00 22 0 0.00 0.00 0.00 0.00
8 0.00 0.00 0.00 0.00 22 0.00 0.00 0.00 0.00
8 45 4 0 0.00 0.00 22 0 0.00 0.00 0.00 0.00
8 55 4 0 0.00 0.00 0.00 0.00 0 0.00 0.00 0.00 0.00
9 2 6.5 0.81 1.62 81.33 2.03 6.5 9.03 1.13 112.98 1.74 23 14.6 1.82 3.64 0.79 68 23.5 2.93 5.86 294.03 0.43
9 12 4 18.1 2.26 4.52 226.47 5.66 6.5 28.2 3.52 7.04 352.84 5.43 22 36.2 452.93 2.06
9 22 4 0 0.00 0.00 0.00 22 2.62 0.33 0.65 32.78
32 4 0 0.00 0.00 0.00 0.00 22 0 0.00 0.00 0.00 0.00
9 42 4 0 0.00 0.00 0.00 0.00 22 0 0.00 0.00 0.00
9 52 4 0 0.00 0.00 22 0 0.00 0.00 0.00 0.00