Embed Size (px)
Citation preview

Spatial Planning in Fisheries &
Integrated Agriculture-Aquaculture (IAA)
Shwu Jiau Teoh & GeoCoP WorldFish
CGIAR-CSI Community Meeting 2020

Spatial Planning in Fisheries
• Monitoring small-scale fisheries
• Planning for reservoir culture-based fisheries

An Integrated Data Pipeline for Small-scale Fisheries
• Timor-Leste first national digital
catch monitoring system
• Install >300 solar-powered
tracking devices on fishing boats
• Track boat movements and
characterize the distribution of
fishing pressure across space
Big Data Inspire Challenge Winner 2018; Scale Up Runner 2019 (WorldFish & PDS) Tilley et al. (2019)

https://worldfish.shinyapps.io/peskAAS/
Dashboard for
Automated Analytics System for Small-Scale Fisheries in Timor-Leste (PeskAAS)
Seasonal Change in Water Surface Area of Reservoirs
Wet Season
(≈80ha)
Dry Season
(≈25 ha)
• Reservoirs get inundated during raining season,
and drawn down occurs during the dry season.
• The duration of use for culture-based fisheries
(the cultivable period) may be reduced in
accordance with water availability.
Paun Sia
Reservoir
(21°45‘ 38.16"N,
86°47‘ 25.08"E)
Odisha-WorldFish Project in partnership with Fisheries and Animal Resources
Development Department (F&ARD) of the Government of Odisha, India
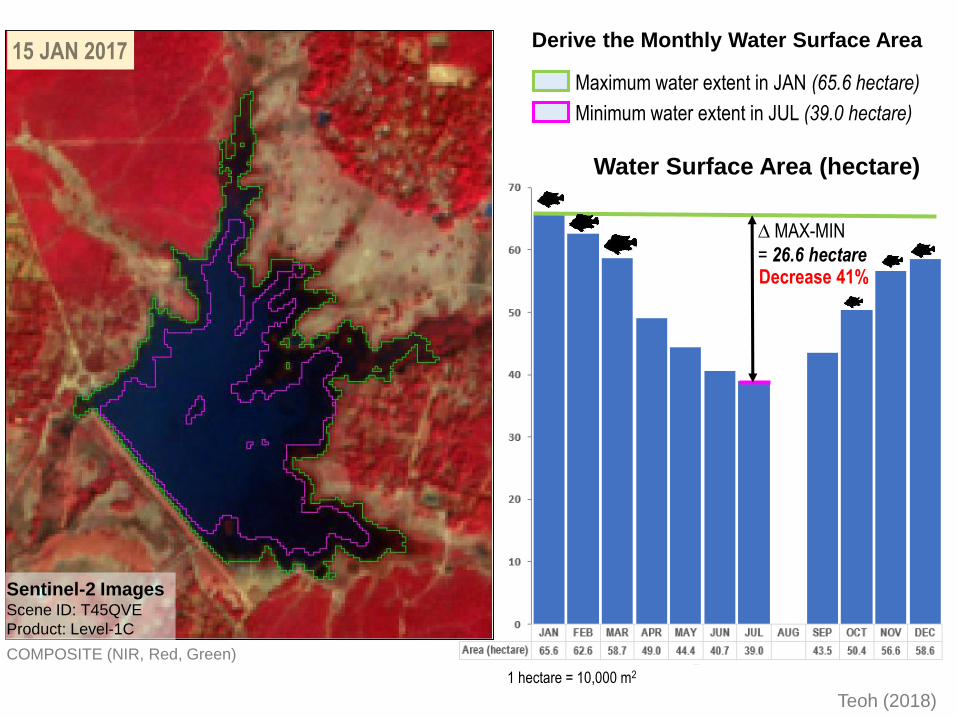
Water Surface Area (hectare)
Maximum water extent in JAN (65.6 hectare)
Minimum water extent in JUL (39.0 hectare)
1 hectare = 10,000 m2
∆ MAX-MIN
= 26.6 hectareDecrease 41%
Derive the Monthly Water Surface Area
Sentinel-2 ImagesScene ID: T45QVE
Product: Level-1C
COMPOSITE (NIR, Red, Green)
Teoh (2018)
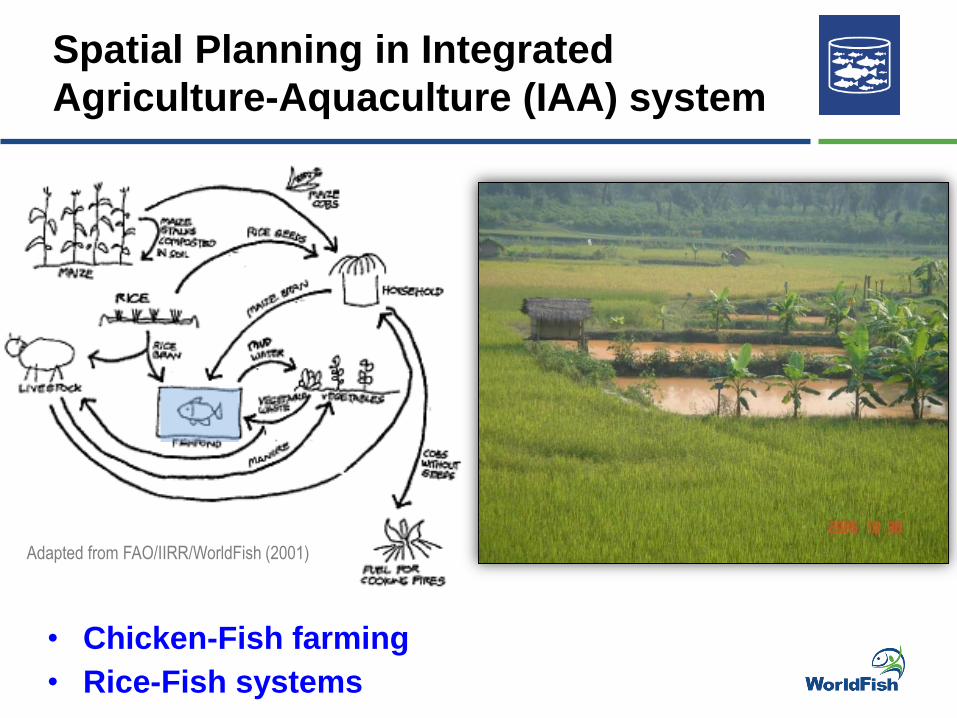
Spatial Planning in Integrated
Agriculture-Aquaculture (IAA) system
• Chicken-Fish farming
• Rice-Fish systems
Adapted from FAO/IIRR/WorldFish (2001)
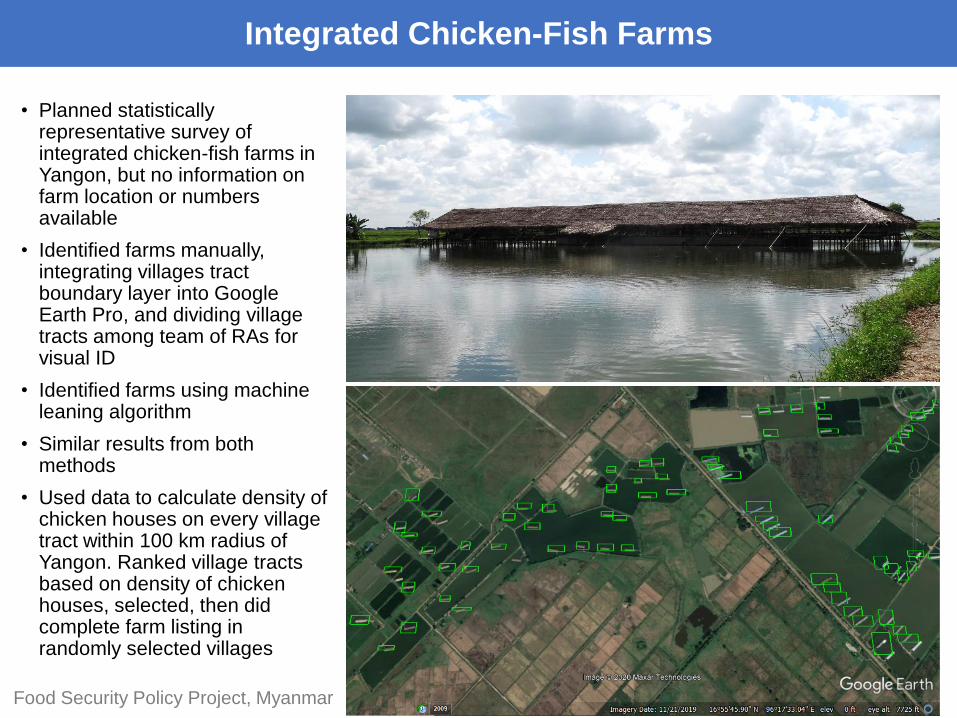
• Planned statistically representative survey of integrated chicken-fish farms in Yangon, but no information on farm location or numbers available
• Identified farms manually, integrating villages tract boundary layer into Google Earth Pro, and dividing village tracts among team of RAs for visual ID
• Identified farms using machine leaning algorithm
• Similar results from both methods
• Used data to calculate density of chicken houses on every village tract within 100 km radius of Yangon. Ranked village tracts based on density of chicken houses, selected, then did complete farm listing in randomly selected villages
Integrated Chicken-Fish Farms
Food Security Policy Project, Myanmar
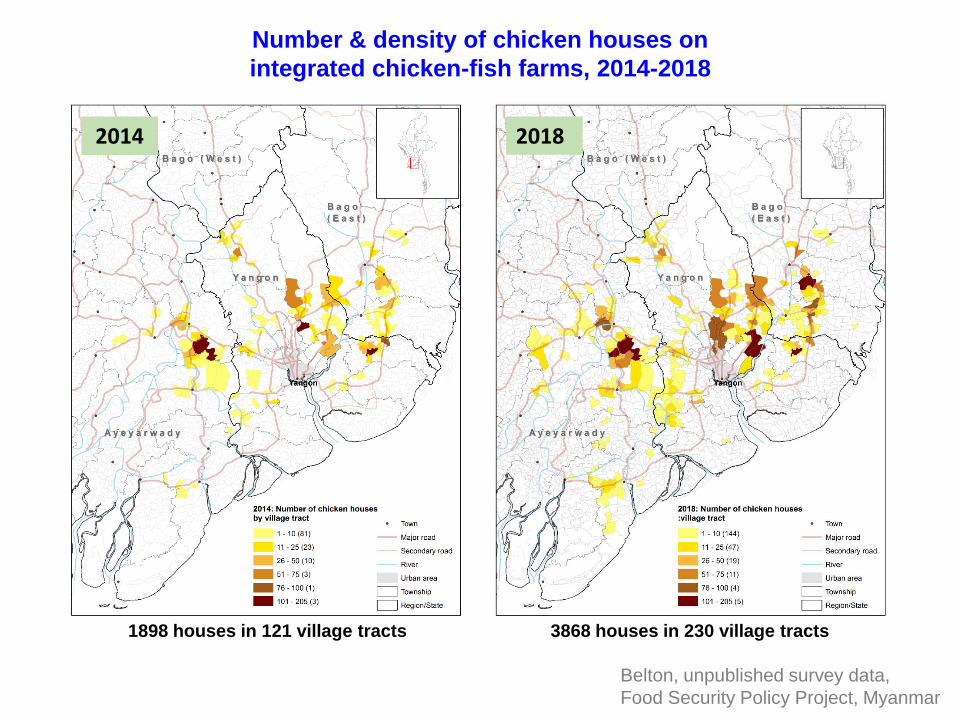
Number & density of chicken houses on
integrated chicken-fish farms, 2014-2018
3868 houses in 230 village tracts
Belton, unpublished survey data,
Food Security Policy Project, Myanmar
1898 houses in 121 village tracts
2014 2018
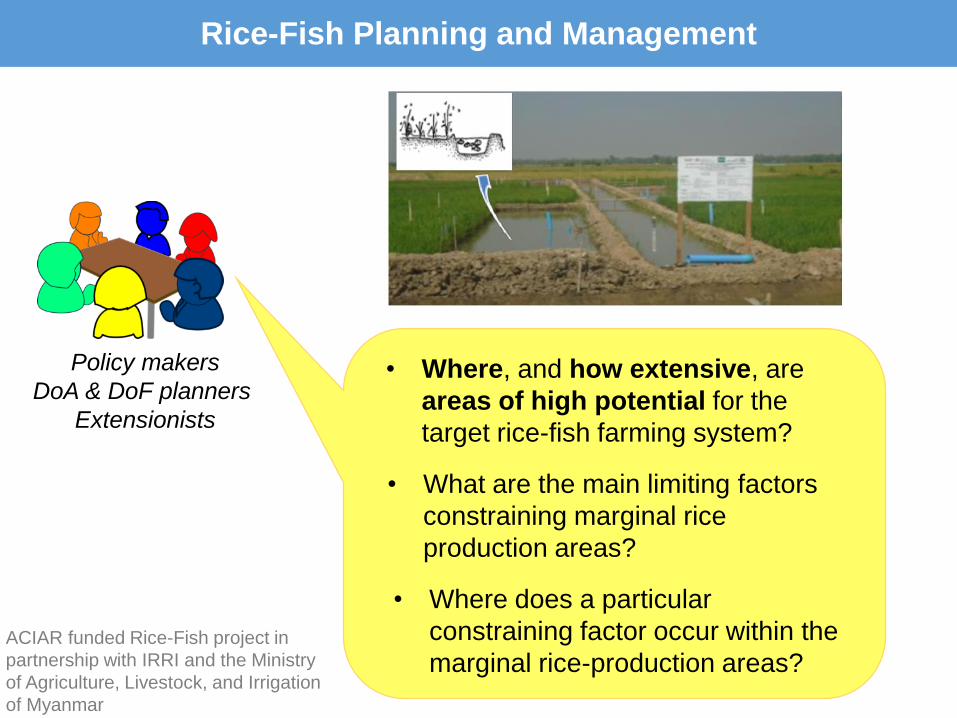
Policy makers
DoA & DoF planners
Extensionists
• Where, and how extensive, are
areas of high potential for the
target rice-fish farming system?
• Where does a particular
constraining factor occur within the
marginal rice-production areas?
• What are the main limiting factors
constraining marginal rice
production areas?
Rice-Fish Planning and Management
ACIAR funded Rice-Fish project in
partnership with IRRI and the Ministry
of Agriculture, Livestock, and Irrigation
of Myanmar

Scales/levels of analysis
Spatial Analysis and Estimating Potential
Global to National
Sub-national
Levels-1 and 2
Farms /
farm clusters
Estimating Potential
Zoning
Site Selection
Plan strategically for development
& eventual management
Regulate development; minimize
competing & conflicting uses;
maximize complementary uses
of land & water
Reduce risk;
optimize production
Resolution
Low
Moderate
High
Results
Broad,
indicative
Directed,
moderately
detailed
Specific,
fully
detailed
90 m
30 m
15 m
<10 msingle cell
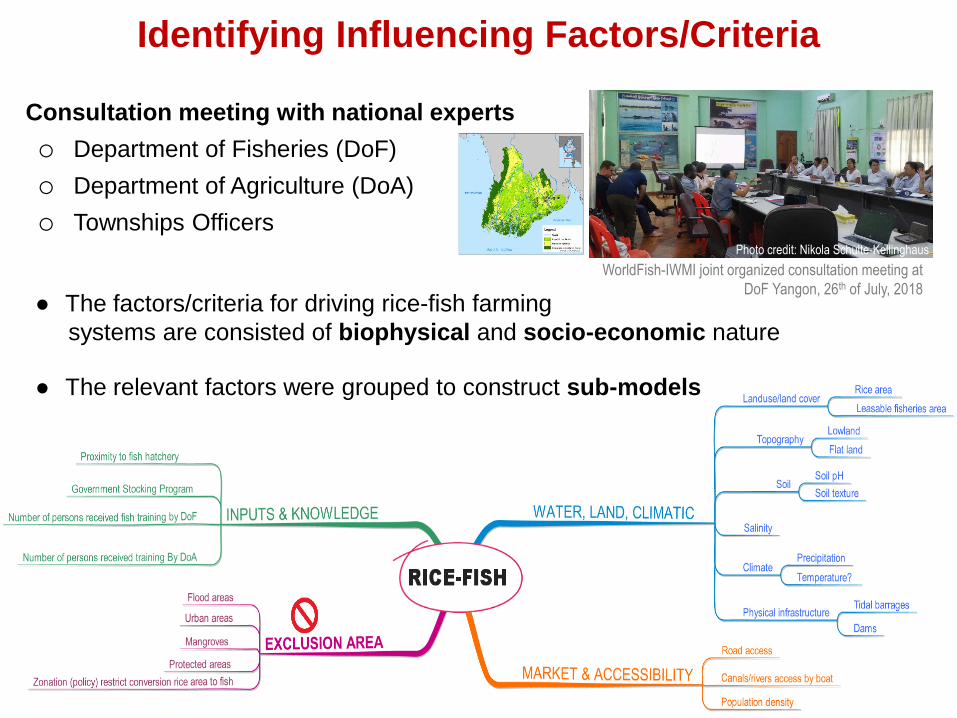
Consultation meeting with national experts
o Department of Fisheries (DoF)
o Department of Agriculture (DoA)
o Townships Officers
Identifying Influencing Factors/Criteria
Photo credit: Nikola Schulte-Kellinghaus
WorldFish-IWMI joint organized consultation meeting at
DoF Yangon, 26th of July, 2018● The factors/criteria for driving rice-fish farming
systems are consisted of biophysical and socio-economic nature
● The relevant factors were grouped to construct sub-models
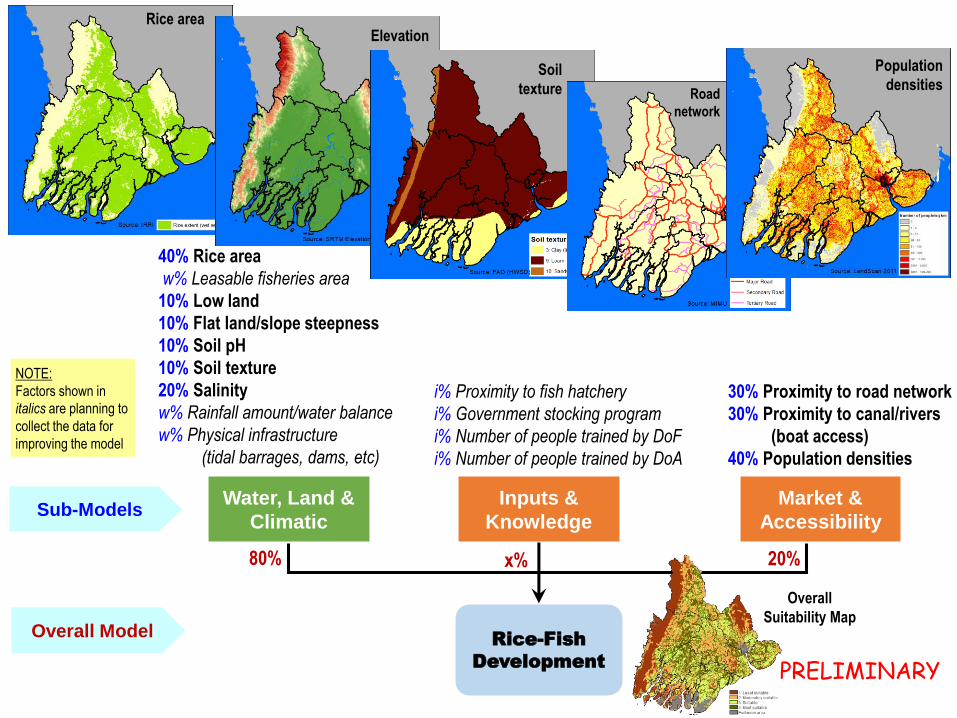
Market &
Accessibility
Inputs &
Knowledge
Water, Land &
ClimaticSub-Models
40% Rice area
w% Leasable fisheries area
10% Low land
10% Flat land/slope steepness
10% Soil pH
10% Soil texture
20% Salinity
w% Rainfall amount/water balance
w% Physical infrastructure
(tidal barrages, dams, etc)
i% Proximity to fish hatchery
i% Government stocking program
i% Number of people trained by DoF
i% Number of people trained by DoA
30% Proximity to road network
30% Proximity to canal/rivers
(boat access)
40% Population densities
Rice-Fish
Development
Overall Model
80% x% 20%
Rice area
Overall
Suitability Map
PRELIMINARY
Elevation
Soil
texture Road
network
Population
densities
NOTE:
Factors shown in
italics are planning to
collect the data for
improving the model
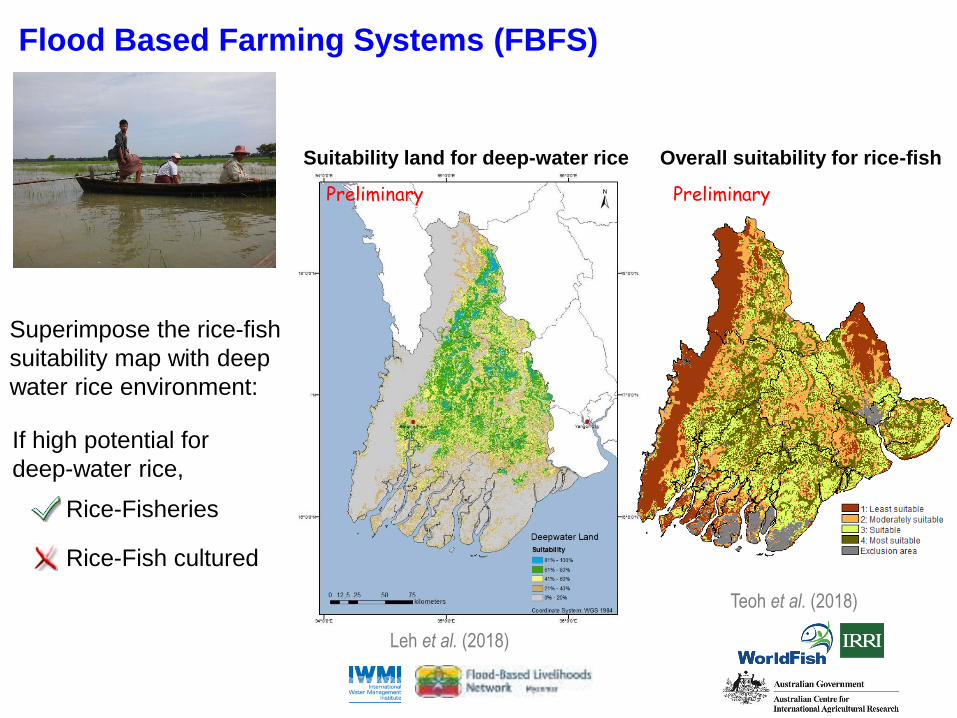
Suitability land for deep-water rice Overall suitability for rice-fish
Superimpose the rice-fish
suitability map with deep
water rice environment:
Leh et al. (2018)
Preliminary Preliminary
Flood Based Farming Systems (FBFS)
Teoh et al. (2018)
Rice-Fish cultured
Rice-Fisheries
If high potential for
deep-water rice,
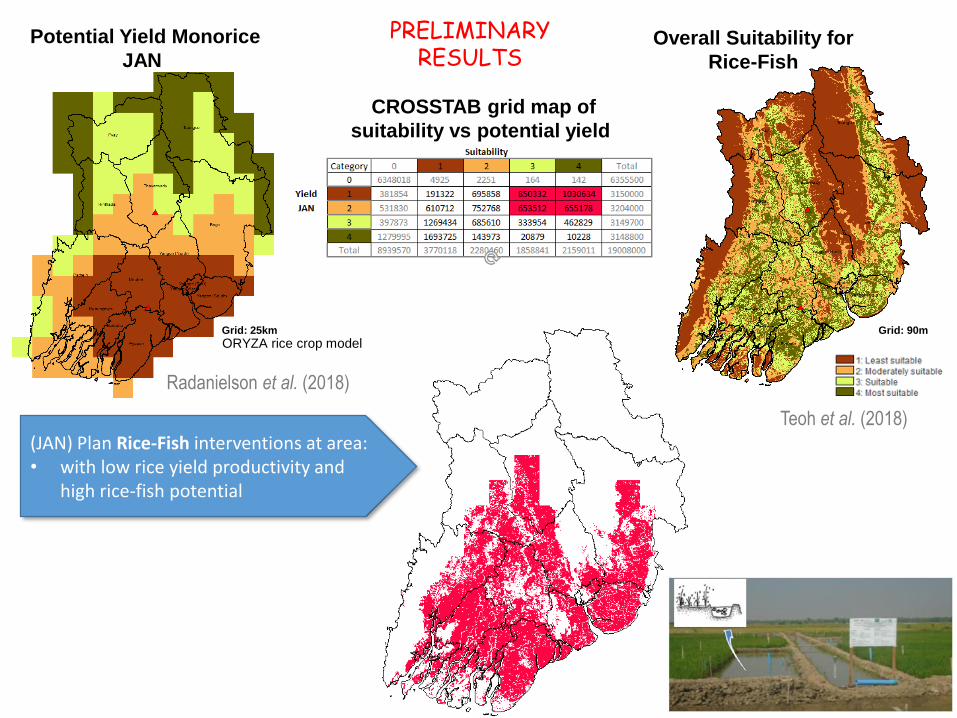
Potential Yield Monorice
JAN Overall Suitability for
Rice-Fish
(JAN) Plan Rice-Fish interventions at area:• with low rice yield productivity and
high rice-fish potential
Grid: 25km Grid: 90m
PRELIMINARYRESULTS
CROSSTAB grid map of
suitability vs potential yield
Radanielson et al. (2018)
Teoh et al. (2018)
ORYZA rice crop model
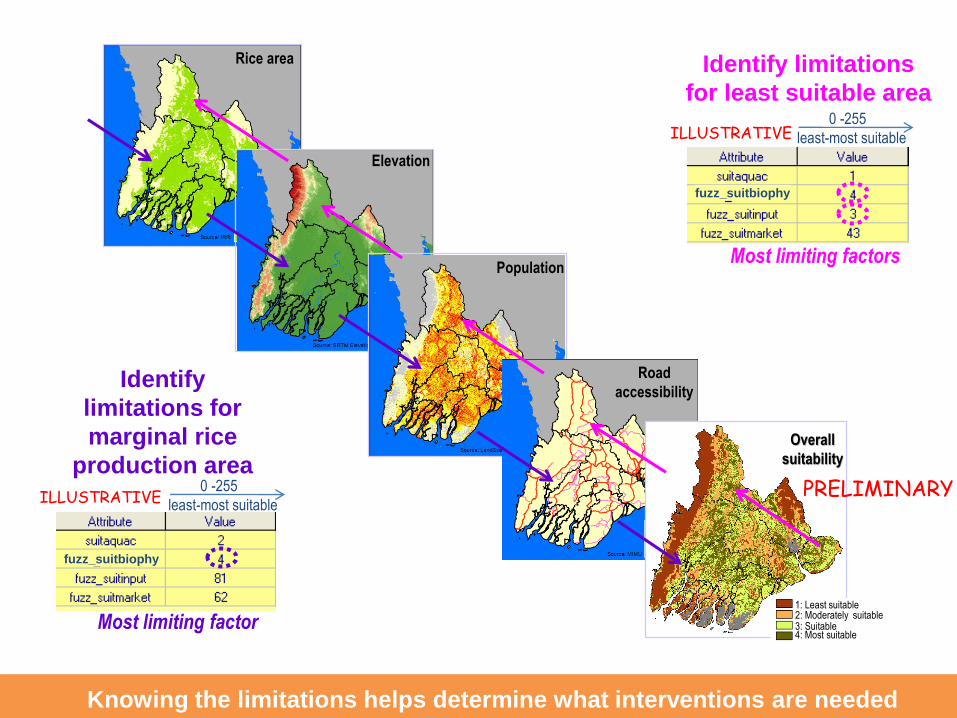
Knowing the limitations helps determine what interventions are needed
Rice area
Elevation
Population
Road
accessibility
Overall
suitability
1: Least suitable
4: Most suitable
2: Moderately suitable3: Suitable
PRELIMINARY
Identify limitations
for least suitable area
Identify
limitations for
marginal rice
production area
Most limiting factor
0 -255
least-most suitable
fuzz_suitbiophy
ILLUSTRATIVE
Most limiting factors
0 -255
least-most suitable
fuzz_suitbiophy
ILLUSTRATIVE

Thank You