Embed Size (px)
Citation preview
1
Postprint
This is an Accepted Manuscript of an article published in [Dis Aquat Organ] available online July 22, 2013 at http://www.int-res.com/abstracts/dao/v105/n2/p127-138/
Please cite as:
Paul-Pont, I., Dhand, N. K., & Whittington, R. J. (2013). Spatial distribution of mortality in Pacific oysters Crassostrea gigas: reflection on mechanisms of OsHV-1 transmission. Dis Aquat Organ, 105(2), 127-138. DOI: 10.3354/dao02615.
Spatial distribution of mortality in Pacific oysters Crassostrea gigas: reflection on mechanisms of OsHV-1 transmission
Ika Paul-Pont*, Navneet K Dhand, Richard J Whittington
Faculty of Veterinary Science, The University of Sydney, 425 Werombi Road, Camden, NSW 2570, Australia
* Corresponding author, Email: [email protected]
Abstract
The ostreid herpesvirus (OsHV-1) has the potential to devastate Crassostrea gigas culture in Australia as it has done in many other countries, highlighting the need for a better understanding of disease expression and transmission. The aim of this study was to assess the spatial distribution of OsHV-1 associated mortalities in one of only two infected areas in Australia, Woolooware Bay (Botany Bay New South Wales). In October 2011, healthy sentinel Pacific oysters were placed in three different locations at three different tidal levels and OsHV-1 associated mortalities were closely monitored over 7 months. The outbreak started in November 2011 and the disease remained active until April 2012. Three major mortality events were detected. Rather than being a propagating epizootic, it appeared that most oysters were infected from the same environmental source. The distribution of OsHV-1 associated mortalities was spatially clustered, highly variable and clearly dependent on the age of oysters and their position in the water column. Non-random distribution of mortalities at macro scale (sites several km apart) and micro scale (within rearing trays), and vertical clustering patterns in the water column are discussed in relation to mechanisms of transmission in water. We hypothesise that OsHV-1 may be carried through water by particles, possibly plankton.
Key words: Crassostrea gigas, Ostreid herpesvirus 1, summer mortalities, spatial distribution, plankton, disease transmission
Introduction
Summer mortalities of oysters Crassostrea gigas may be due to multifactorial interactions between the environment, pathogens and the physiological status of the host and were first recorded in the United States and Japan in the early 60s (Mori 1979, Perdue et al. 1981). The first identification of herpes-like virus infection associated with major summer mortality events of spat and juveniles was reported in France in 1993 (Renault et al. 1994, Renault 1998). This virus was classified as the first member of the family Malacoherpesviridae, and was called Ostreid herpesvirus 1 (OsHV-1) after its genome was completely sequenced (Davidson et al. 2005, 2009). Since then, massive mortalities of
2
spat and juvenile Pacific oysters associated with OsHV-1 have been reported in France, United Kingdom, Jersey, Ireland, Spain, Netherlands and the United States (Renault et al. 1994, Renault & Novoa 2004, Friedman et al. 2005, Schikorski et al. 2011a). The most severe disease events are specifically associated with a virulent variant of the virus, OsHV-1 µVar (Segarra et al. 2010). In 2010, high mortalities of farmed and wild Pacific oysters were recorded for the first time in both New Zealand and Australia in association with OsHV-1 (Anon 2011). Renault et al. (2012) demonstrated that a variant virus infecting Pacific oyster in New Zealand was related to the variant µVar but showed some significant differences in terms of sequences. In Australia, detailed sequencing is still required to determine the identity of the OsHV-1 variant(s) present since 2010. Therefore, the term “OsHV-1” as a species name including the different forms of variants will be employed in this study.
Despite the impact that OsHV-1 has on the Pacific oyster, the most economically important shellfish in the world (FAO 2006), little information is available about disease epidemiology in open marine environments (Garcia et al. 2011). Disease outbreaks occur in summer, preferentially in sheltered locations (Renault 2011). Water temperature plays a key role but does not fully explain the pattern of mortalities. Several studies also suggest the role of some Vibrio species on disease expression (Burge et al. 2007, Sauvage et al. 2009, Saulnier et al. 2011, Pernet et al. 2012). The distribution of outbreaks in Europe suggested that the disease spread with the movement of animals from infected areas (Peeler et al. 2012). There is also some evidence that boat movements, biofouling and the introduction of materials may play a role in the spread of the disease (Anon 2011). The spatial distribution of mortalities between and within bays is still poorly understood (Peeler et al. 2012, Pernet et al. 2012). Indeed, the lack of knowledge about the role of hydrodynamics and other environmental/biological forces on OsHV-1 spread, at small and large scales, constitutes one of the main knowledge gaps to implement efficient control mechanisms to prevent the spread of the disease. Moreover, data on the existence of potential vectors for OsHV-1 transmission in open marine systems are lacking. In Australia the presence of OsHV-1 is restricted to two estuaries in New South Wales (NSW) where it is now considered to be endemic: Port Jackson and Wooloware Bay/Georges River. It is unknown how the virus arose or arrived in the country. Consequently, particular efforts are required to understand how the disease transmits and spreads in a natural environment. Indeed, improving knowledge about OsHV-1 transmission could help limit the impact of the disease on the oyster industry.
The aim of the present work is to assess the spatial distribution of OsHV-1 associated mortalities in one of the only two infected areas in Australia, Woolooware Bay (Botany Bay NSW) across a range of spatial scales during the Australian summer 2011/2012.
Material and methods
1. Study site
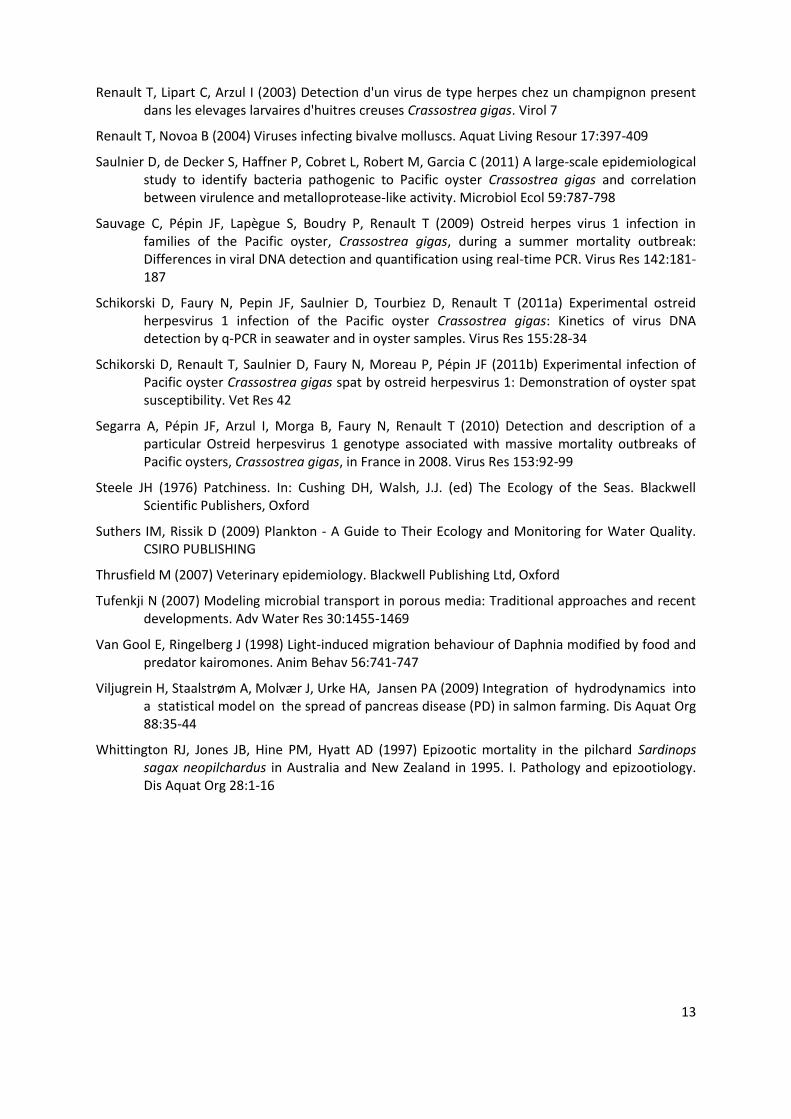
Woolooware Bay is located on the southern shore of Botany Bay, approximately 16 kilometres from the centre of Sydney (New South Wales – Australia) (Figure 1). This shallow estuarine area is constituted by mud flats creating an excellent nutrient-rich area for the growth of mangroves and saltmarsh communities. Woolooware Bay used to be one of the most important areas for the native Sydney Rock oyster (Saccostrea glomerata) in NSW. Parasitic disease outbreaks decimated a major part of the industry in this area and the Sydney Rock oyster was progressively replaced by the Pacific oyster Crassostrea gigas from 1991. As a consequence of the OsHV-1 outbreak in 2010, the farming of C. gigas ceased almost completely and the remaining population in the Bay is almost exclusively constituted by small populations of wild individuals.
The experiment was set up in three different oyster leases located up to 1000m apart from each other (Figure 1).
3
2. Experimental design
Healthy oysters (n=8500) were sampled from the Hawkesbury River, free of any clinical signs of disease and tested negative for OsHV-1 using the TaqMan assay developed by Martenot et al. (2010). All oysters used during this study correspond to hatchery single seed oysters and came from two distinct batches: SPL11D (spat 2-3 month old) and SPL10GSD (adults 12 month old). Both batches were harvested from the same location (Porto Bay) in the Hawkesbury River. From October 2011, oysters were transferred to Woolooware Bay and placed at sites A, B and C (Figure 1). Oysters comprised 4250 adults (12 month old; size 77.9 ± 1.0 mm length (mean ± SE)) and 4250 spat (2-3 month old; size 28.4 ± 0.9 mm length (mean ± SE)). These were divided randomly and used in two experiments conducted in parallel across the three oyster leases. The different systems used in experiments 1 and 2 are schematically presented in figure 2. For logistic reasons, experiment 1 started on the 20th of October 2011 whereas experiment 2 began on the 24th November 2011.
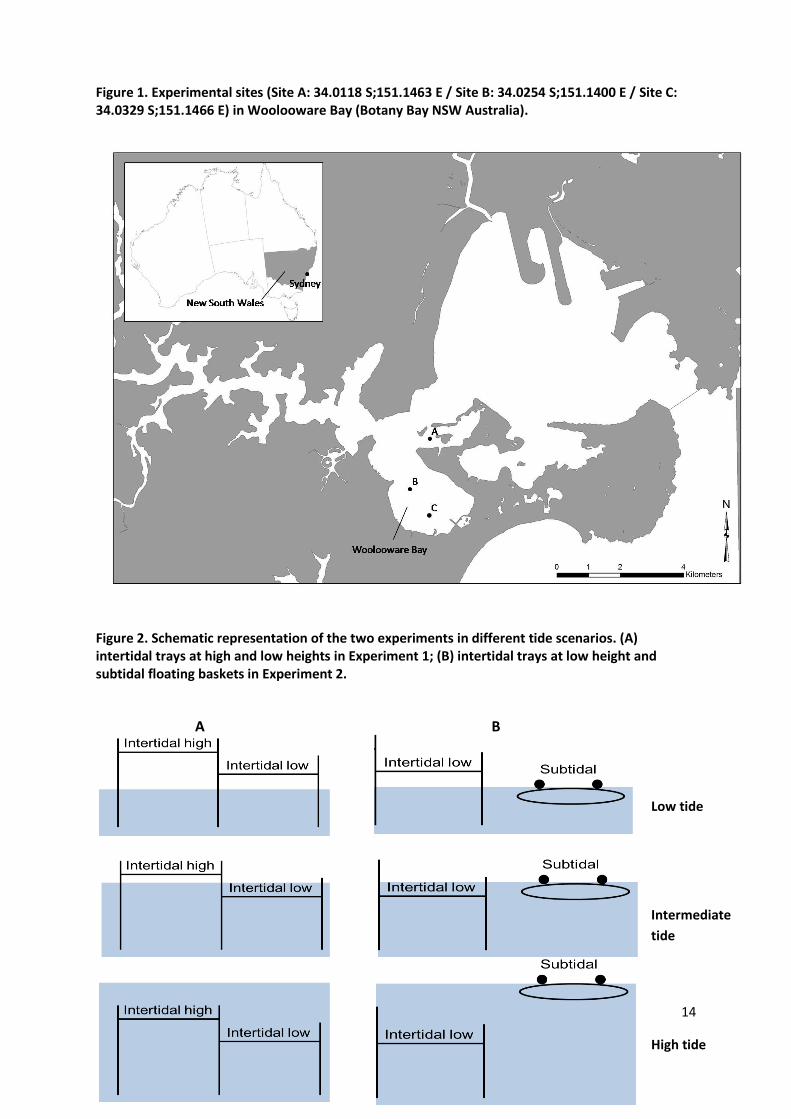
a. Experiment 1: Effect of heights on oyster mortality using intertidal cultivation systems This experiment was designed to compare the mortality rates as a function of the depth of intertidal trays in the water column leading to different immersion times and air/UV/heat exposures. Adult oysters and spat were placed intertidally in plastic trays (2m x 1m) fixed on wooden racks at a standard height commonly used by local oyster farmers, and at a height 300 mm above standard rack height (Figure 2A). For the purpose of this study, the standard and higher heights will be called “low” and “high”, respectively in this manuscript. The experimental design thus led to 4 treatments per site: high adult, high spat, low adult and low spat.
The initial stocking density was 320 oysters per tray. With two trays per treatment, this corresponded to 640 oysters per treatment (high adult, low adult, high spat, low spat) per site (A, B, C). Regular random sampling of 25 to 50 live oysters per treatment per site was performed weekly to fortnightly from October 2011 until May 2012 for OsHV-1 detection (data not shown). In addition, dead oysters were systematically removed from trays and were not replaced. Therefore, the total number of oysters and the stocking density declined over time. This was taken into consideration when calculating the cumulative mortality (see section “mortality data” below).
b. Experiment 2: Effect of cultivation system (subtidal versus intertidal ) on oyster mortality The aim of this second experiment was to compare the mortality rates among spat and adult oysters placed in two contrasting cultivation systems: intertidal trays fixed on wooden racks (standard height-low) and subtidal floating baskets (Figure 2B). These structures lead to different immersion/emersion patterns and absolute position in the water column. Both spat (S1) and adult oysters (A1) were used for this experiment.
The initial stocking density was lower in experiment 2 than in experiment 1 as the size of each floating basket did not allow more than 15 adults per basket. Consequently, 15 oysters were placed in each floating basket with two basket replicates per age class (spat/adult) per site (A, B and C). Additionally, 30 oysters of each age class (spat/adult) were placed in one intertidal tray at each site. Therefore, the total number of oysters at the beginning of the experiment (24th November 2011) was 360. No sampling was performed during this experiment but dead individuals were systematically removed from trays and baskets. In contrast to experiment 1, dead batches of spat were replaced by later transfers of healthy individuals in order to keep live naive animals and determine the window of infection for OsHV-1 disease. In total, two additional batches of healthy spat (n=180 x 2, called “S2” and “S3”) were deployed in trays and baskets on the 20th December 2011 and 16th March 2012.
3. Mortality data
4
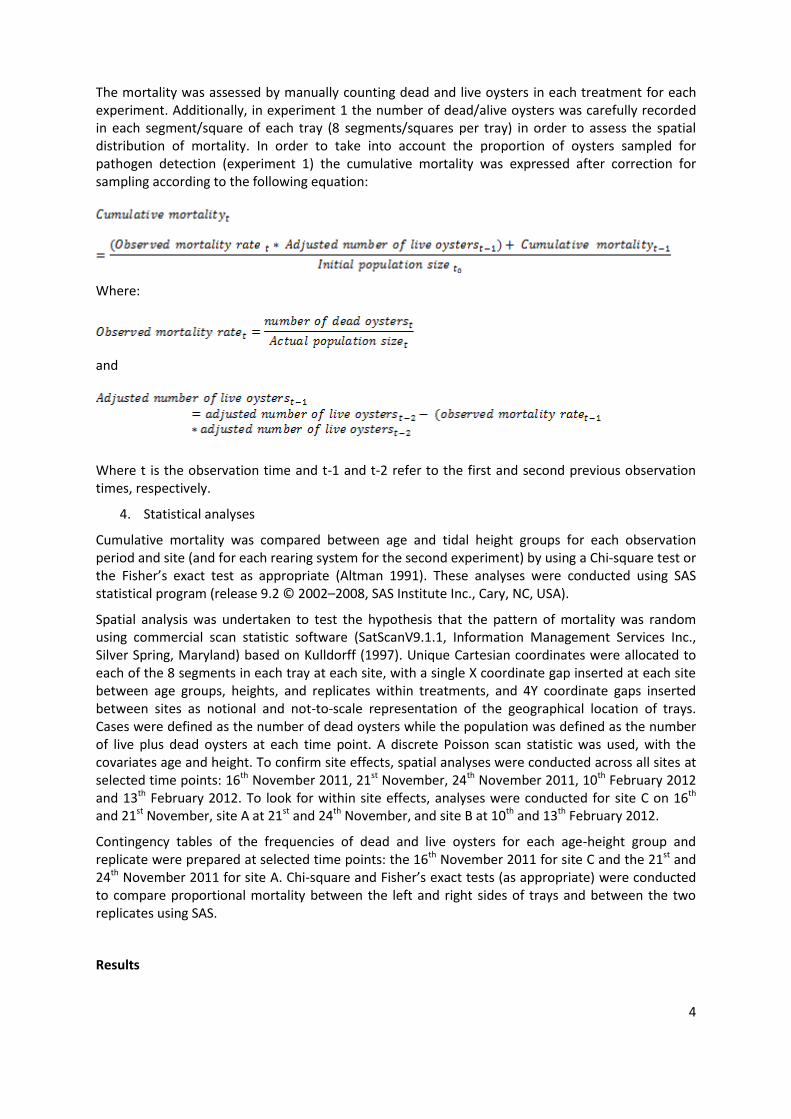
The mortality was assessed by manually counting dead and live oysters in each treatment for each experiment. Additionally, in experiment 1 the number of dead/alive oysters was carefully recorded in each segment/square of each tray (8 segments/squares per tray) in order to assess the spatial distribution of mortality. In order to take into account the proportion of oysters sampled for pathogen detection (experiment 1) the cumulative mortality was expressed after correction for sampling according to the following equation:
Where:
and
Where t is the observation time and t-1 and t-2 refer to the first and second previous observation times, respectively.
4. Statistical analyses
Cumulative mortality was compared between age and tidal height groups for each observation period and site (and for each rearing system for the second experiment) by using a Chi-square test or the Fisher’s exact test as appropriate (Altman 1991). These analyses were conducted using SAS statistical program (release 9.2 © 2002–2008, SAS Institute Inc., Cary, NC, USA).
Spatial analysis was undertaken to test the hypothesis that the pattern of mortality was random using commercial scan statistic software (SatScanV9.1.1, Information Management Services Inc., Silver Spring, Maryland) based on Kulldorff (1997). Unique Cartesian coordinates were allocated to each of the 8 segments in each tray at each site, with a single X coordinate gap inserted at each site between age groups, heights, and replicates within treatments, and 4Y coordinate gaps inserted between sites as notional and not-to-scale representation of the geographical location of trays. Cases were defined as the number of dead oysters while the population was defined as the number of live plus dead oysters at each time point. A discrete Poisson scan statistic was used, with the covariates age and height. To confirm site effects, spatial analyses were conducted across all sites at selected time points: 16th November 2011, 21st November, 24th November 2011, 10th February 2012 and 13th February 2012. To look for within site effects, analyses were conducted for site C on 16th and 21st November, site A at 21st and 24th November, and site B at 10th and 13th February 2012.
Contingency tables of the frequencies of dead and live oysters for each age-height group and replicate were prepared at selected time points: the 16th November 2011 for site C and the 21st and 24th November 2011 for site A. Chi-square and Fisher’s exact tests (as appropriate) were conducted to compare proportional mortality between the left and right sides of trays and between the two replicates using SAS.
Results
5
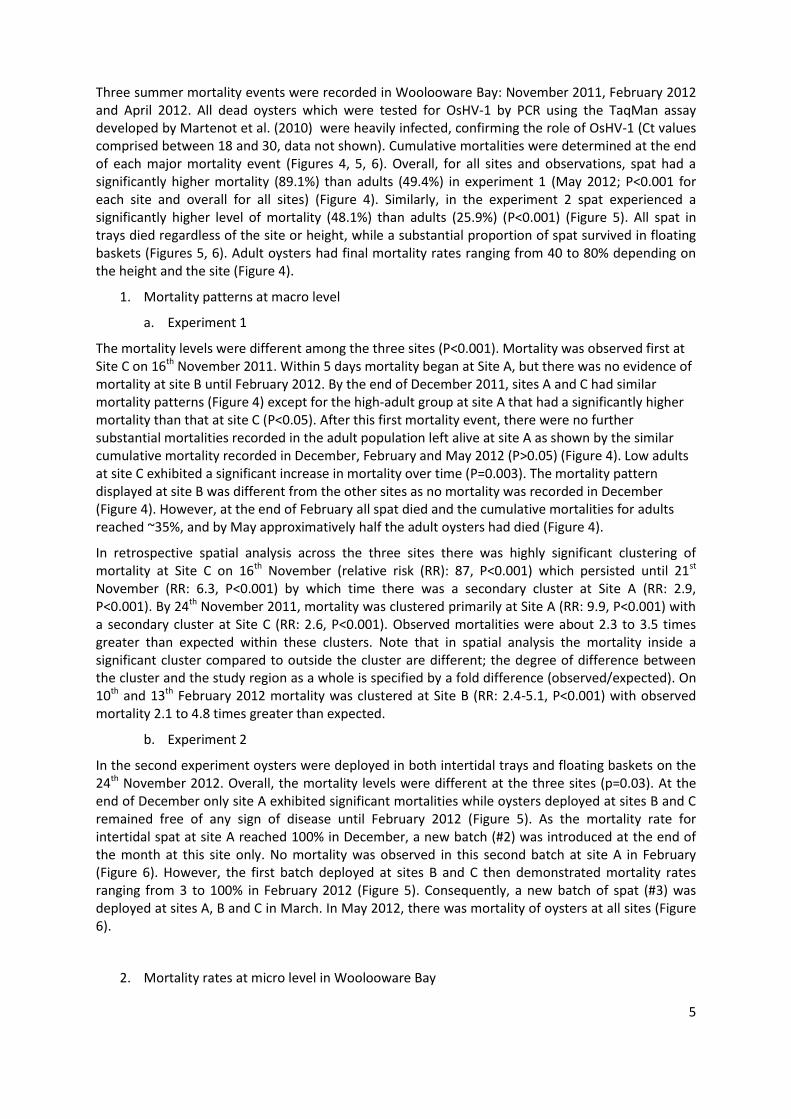
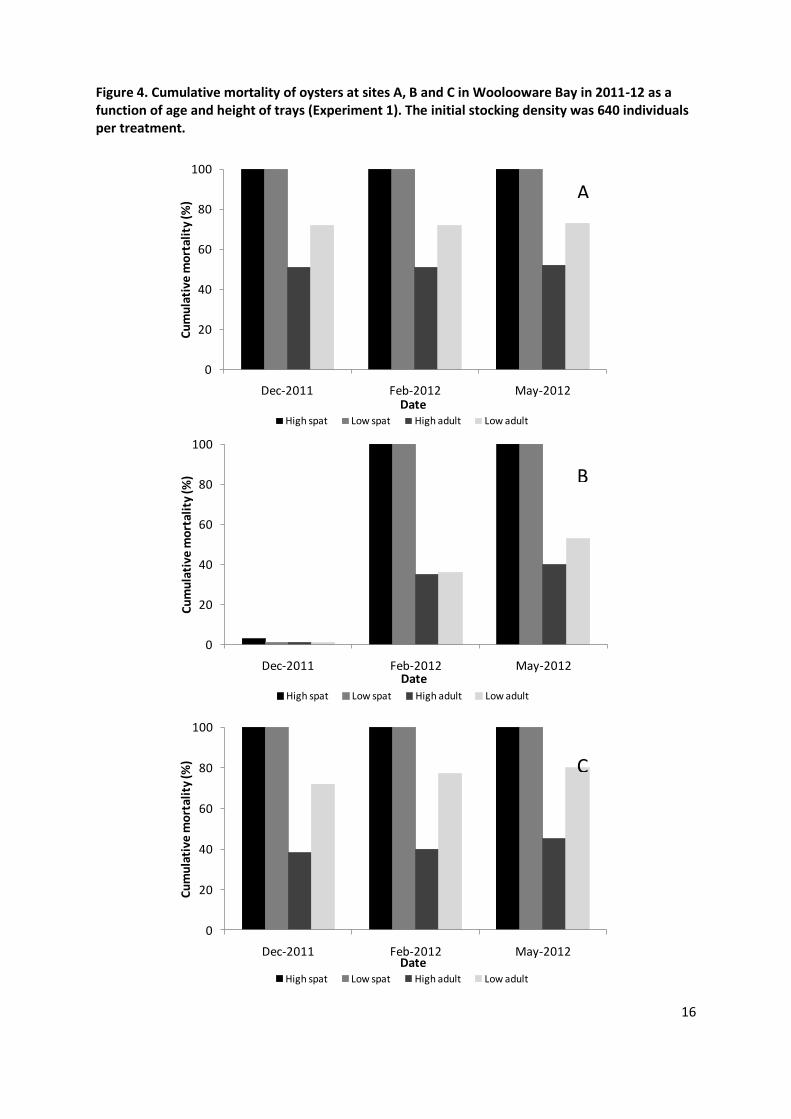
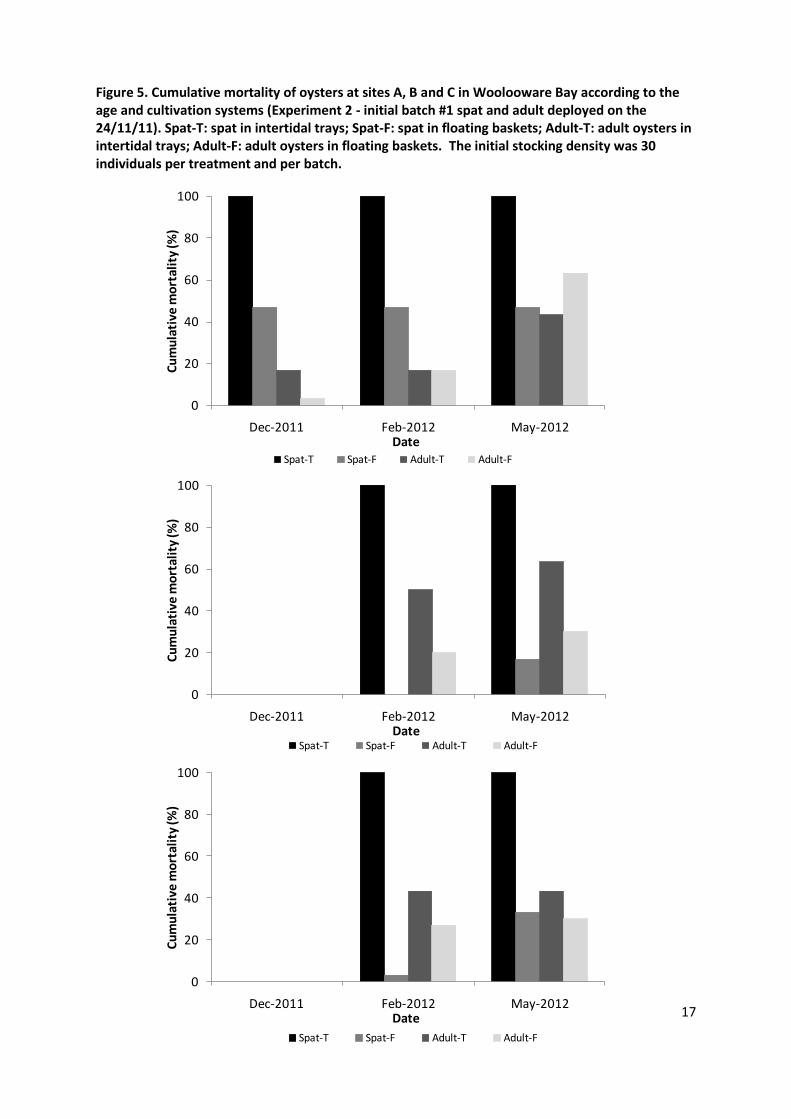
Three summer mortality events were recorded in Woolooware Bay: November 2011, February 2012 and April 2012. All dead oysters which were tested for OsHV-1 by PCR using the TaqMan assay developed by Martenot et al. (2010) were heavily infected, confirming the role of OsHV-1 (Ct values comprised between 18 and 30, data not shown). Cumulative mortalities were determined at the end of each major mortality event (Figures 4, 5, 6). Overall, for all sites and observations, spat had a significantly higher mortality (89.1%) than adults (49.4%) in experiment 1 (May 2012; P<0.001 for each site and overall for all sites) (Figure 4). Similarly, in the experiment 2 spat experienced a significantly higher level of mortality (48.1%) than adults (25.9%) (P<0.001) (Figure 5). All spat in trays died regardless of the site or height, while a substantial proportion of spat survived in floating baskets (Figures 5, 6). Adult oysters had final mortality rates ranging from 40 to 80% depending on the height and the site (Figure 4).
1. Mortality patterns at macro level
a. Experiment 1
The mortality levels were different among the three sites (P<0.001). Mortality was observed first at Site C on 16th November 2011. Within 5 days mortality began at Site A, but there was no evidence of mortality at site B until February 2012. By the end of December 2011, sites A and C had similar mortality patterns (Figure 4) except for the high-adult group at site A that had a significantly higher mortality than that at site C (P<0.05). After this first mortality event, there were no further substantial mortalities recorded in the adult population left alive at site A as shown by the similar cumulative mortality recorded in December, February and May 2012 (P>0.05) (Figure 4). Low adults at site C exhibited a significant increase in mortality over time (P=0.003). The mortality pattern displayed at site B was different from the other sites as no mortality was recorded in December (Figure 4). However, at the end of February all spat died and the cumulative mortalities for adults reached ~35%, and by May approximatively half the adult oysters had died (Figure 4).
In retrospective spatial analysis across the three sites there was highly significant clustering of mortality at Site C on 16th November (relative risk (RR): 87, P<0.001) which persisted until 21st November (RR: 6.3, P<0.001) by which time there was a secondary cluster at Site A (RR: 2.9, P<0.001). By 24th November 2011, mortality was clustered primarily at Site A (RR: 9.9, P<0.001) with a secondary cluster at Site C (RR: 2.6, P<0.001). Observed mortalities were about 2.3 to 3.5 times greater than expected within these clusters. Note that in spatial analysis the mortality inside a significant cluster compared to outside the cluster are different; the degree of difference between the cluster and the study region as a whole is specified by a fold difference (observed/expected). On 10th and 13th February 2012 mortality was clustered at Site B (RR: 2.4-5.1, P<0.001) with observed mortality 2.1 to 4.8 times greater than expected.
b. Experiment 2
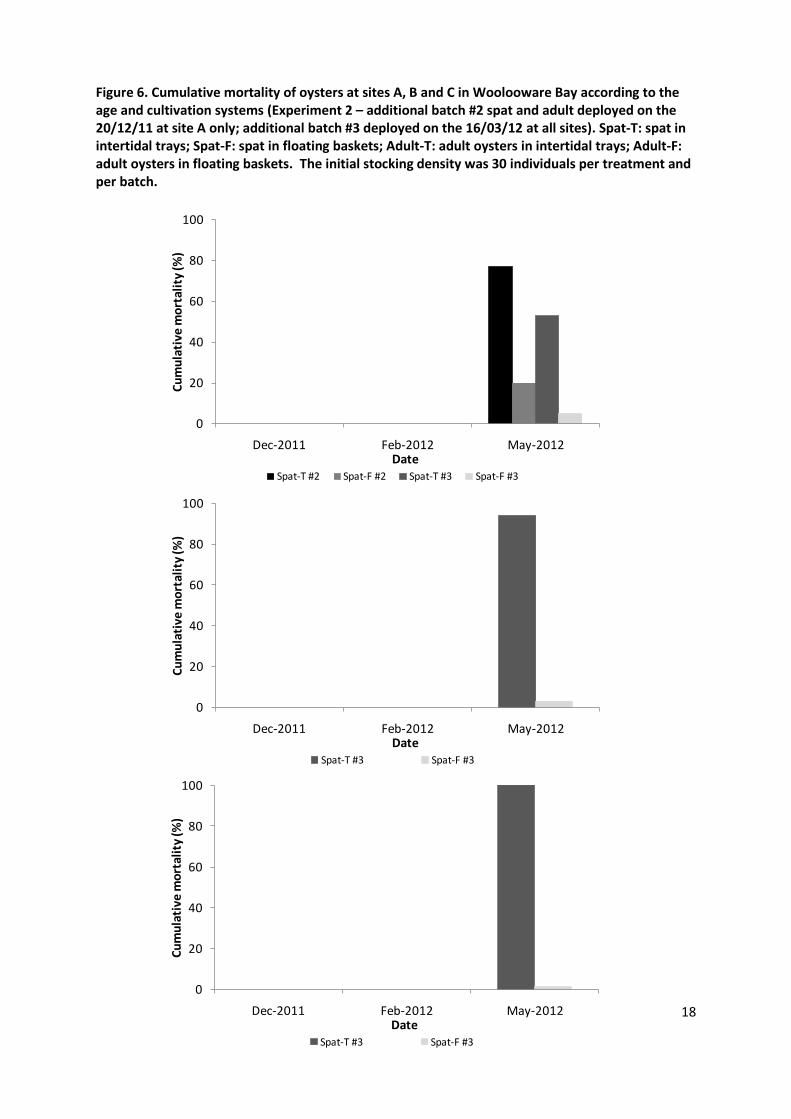
In the second experiment oysters were deployed in both intertidal trays and floating baskets on the 24th November 2012. Overall, the mortality levels were different at the three sites (p=0.03). At the end of December only site A exhibited significant mortalities while oysters deployed at sites B and C remained free of any sign of disease until February 2012 (Figure 5). As the mortality rate for intertidal spat at site A reached 100% in December, a new batch (#2) was introduced at the end of the month at this site only. No mortality was observed in this second batch at site A in February (Figure 6). However, the first batch deployed at sites B and C then demonstrated mortality rates ranging from 3 to 100% in February 2012 (Figure 5). Consequently, a new batch of spat (#3) was deployed at sites A, B and C in March. In May 2012, there was mortality of oysters at all sites (Figure 6).
2. Mortality rates at micro level in Woolooware Bay
6
a. Variation of mortality between and within trays
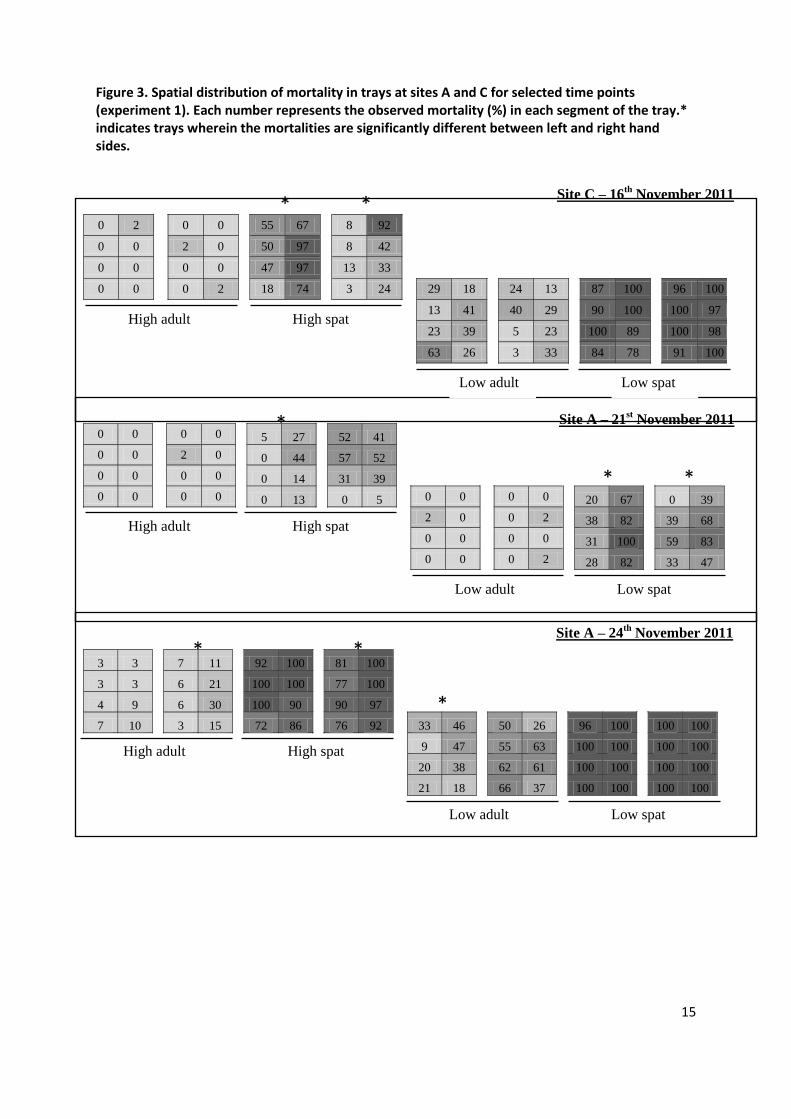
During November 2011, the mortality distribution within every segment (n=8 segment per tray) of each tray (n=8 tray per site) was closely observed at sites A and C. Spatial analysis revealed non-random distribution of mortality with important clusters between and within trays (Figure 3). Within site C on 16th November the mortality was different between replicates and was clustered in parts of trays, with clusters identified among both spat and adults (RR: 2.1, P<0.001), and observed mortalities were 2.0 to 2.4 times higher than those expected. By 21st November the mortality was uniform at site C. Within Site A on 24th November mortality was clustered between and in parts of trays (RR: 1.6 to 2.5, P<0.001) and observed mortalities in the clusters were 1.5 to 2.4 times those expected. At Site B on 10th and 13th February 2012 mortalities were uniform. Chi-square analyses revealed that mortalities were significantly different between left and right sides of trays at sites A and C (Figure 3).
b. Variation of mortality among oysters exposed to different strata of the water column
The position of trays and floating baskets relative to strata of the water column at three tide levels is illustrated in Figure 2. Adult oysters kept at lower height had a significantly higher mortality than those kept at a higher levels at Site A and C at all three time points (all P<0.001) (Figure 4). As the outbreak started later at site B a significant difference in mortality between low and high trays was observed only in May 2012 (P<0.001). In the second experiment, there was a significantly lower mortality in oysters kept in baskets (18%) than those kept in trays (60.9%) (P<0.05). All spat from the initial batch (#1) died in trays at all sites while the mortality rate remained relatively low in floating baskets (17-47% depending on the site) (Figure 5). This observation was consistent for all additional batches of spat (#2 and #3) at all sites (Figure 6). As the absolute mortality rate was lower for adult oysters than for spat, the difference between subtidal and intertidal systems for this age class was less outstanding and only significant at site B in February and May 2012 (P<0.05) (Figure 5).
Discussion
OsHV-1 causes a disease of international significance which has halved production of Pacific oysters in major producing countries such as France and New Zealand (Anon 2011). Observations about the origins of epizootics and the mode of transmission of OsHV-1 may be important in devising future strategies for disease control. The present work demonstrated that the distribution of OsHV-1 associated mortalities in Woolooware Bay, one year after the first occurrence of the disease at this location, was clustered (i.e. not uniform or random), highly variable in time and space, and clearly dependent on the age of oysters. Indeed, a greater sensitivity of young age classes of oysters to OsHV-1 (micro-variant and classical strain) has already been demonstrated in several studies (Renault et al. 1994, Burge et al. 2006, 2007, Miossec et al. 2009, Dégremont et al. 2010, Dégremont 2011, Garcia et al. 2011, Schikorksi et al. 2011a) and was confirmed by the present work. It was consistent among cultivation systems, sites and over time. Substantial differences in mortality were observed at macro scale among three sites which were < 2 km apart from each other. Additionally, non-random distribution at micro scale, i.e. within oyster trays, and vertical clustering patterns in the water column, were observed.
A great deal of useful information can be derived from an understanding of the mechanisms of transmission of a disease (Thrusfield 2007). Did the outbreak of OsHV-1 associated mortality in Woolooware Bay arise from a common point source (i.e. infection derived from a source which is common to all individuals) or was it propagating (i.e. the first cases in oysters are the source of infection for subsequent cases in oysters) (Thrusfield 2007). To help answer this question examples were sought from the literature, but there were few published studies of natural transmission mechanisms in marine animal virology. In 1995 and 1998 a herpesvirus caused massive propagating
7
epizootics of mortality in pilchards Sardinops sagax neopilchardus, a schooling pelagic fish, in Australia (Whittington et al. 1997). The epizootic wave was successfully modeled using parameters of relatively close contact between individual fish, and suggested that a diseased individual infected 3 to 5 others (Murray et al. 2001a, 2001b). Similarly, propagating epizootics of viral haemorrhagic septicaemia virus (a rhabdovirus) in schooling herring (Clupea pallasii) follow fish-to-fish transmission (Herschberger et al. 2011). In the present study, while mortality in Woolooware Bay started almost concomitantly (within 5 days) at sites A and C in experiment 1 suggesting either a simultaneous point source for the virus or a rapid dispersion of infective viral particles between sites, there was no sign of mortality at site B during the same period (November 2011). The clustered mortality pattern was also observed during the second mortality event in February 2012 (Figure 5). The effects of hydrodynamics and wind play an important part in disease spread in fish and shellfish in open aquatic systems (Pernet et al. 2012, Kristoffersen et al. 2009, Viljugrein et al. 2009). In Woolooware Bay tidal flows from sites A and C pass through site B. As there was no progressive wave of mortality from site A to B to C or from site C to B to A during three OsHV-1 events in the summer of 2011/2012, spread of the disease due to tidal flow in and out of the bay is insufficient to explain the distribution of mortality.
Substantial spatial differences were also observed at a micro level with non-uniform and non-random distribution of mortality among and within the cultivation systems at each site. The significant clusters of mortality between two tray replicates and among square divisions within a single tray (Figure 3) suggest that OsHV-1 is not uniformly distributed in the seawater even at a local scale, leading to different exposures of individuals which lie quite close together.
Based on these observations it is reasonable to conclude that oyster to oyster transmission within a tray of oysters was not important, and neither was direct spread of the virus due to water currents/tidal flows carrying infective material from infected oysters on one lease to naive oysters on another lease. The outbreak was most likely to be a point source epizootic, where infections of most animals were derived from exposure to a common environmental source, where there were different degrees of exposure at different locations (macro scale – sites, and micro scale – trays), with limited local transmission from animal to animal. It has been reported that natural reservoir hosts, as well as moribund and dead infected oysters, are likely to release OsHV-1 virions into the seawater leading to horizontal transmission (Renault 2011). When this study was conducted there was no commercial Crassostrea gigas cultivation in Woolooware Bay. There is a wild population of Pacific oysters but it has not been assessed since the outbreak of OsHV-1 mortality in Woolooware Bay which began in November 2010 and affected both wild and cultivated C. gigas (Anon 2011). Therefore, the contribution of this remnant population of wild C. gigas as a reservoir of OsHV-1 to explain spatial differences at macro-scale remains uncertain.
The effect of oyster stock and genetics on OsHV-1 (micro-variant and classical strain) associated mortalities has been demonstrated (Burge et al. 2006, 2007, Degremont et al. 2011). This is particularly significant when comparing mortality rates of wild oysters from multiple parentages and hatchery reared oysters which have less genetic variation. In the present study single seed oysters from defined broodstock were obtained from a hatchery and possessed clear parentage, but genetic variations between individuals must have existed and could have played a role in the difference in mortality observed between adults and spat as these were from different spawning batches. However, the spatial effects observed in this study cannot be explained by genetic differences as oysters used in the trial were randomly allocated among replicates, treatments and sites and more than 600 oysters were used per treatment per site. Similarly, differences in environmental parameters such as temperature, salinity, food quality/quantity or water quality may have influenced the spatial patterns of OsHV-1 disease expression between the three sites in Woolooware Bay (Berthelin et al. 2000, Peeler et al. 2012). However, these factors were unlikely to have operated within sites due to their small scale. On the hand, micro-hydrodynamics could have played a role in the mortality patterns at micro-scale, i.e. in oyster trays. Physical disturbances due to the presence
8
of rearing structures are obvious, well documented and lead to complex interactions with the water column (Forrest et al. 2009). Several studies revealed that oyster farms influence the quantity of suspended particle matter (organic matter, phytoplankton, zooplankton, larvae, bacteria, detritus) as it flows through the structures due to their intense filtration activity (Hawkins et al. 1998, Forrest et al. 2009). Therefore, it seems reasonable to expect that the attributes of the cultivation structure (the number, density and design of trays, their orientation in relation to currents and water flows, their depth) associated with the filtration activity and the qualitative selection capacity of oysters may have influenced the circulation of water and therefore the accessibility to viral particles in the water (Dumbauld et al. 2009).
At micro-scale (within sites), the vertical distribution of mortality also showed an interesting pattern as oysters exposed to different strata of the water column presented contrasting mortality rates. A significant decrease in cumulative mortality was demonstrated for adults placed in intertidal trays at high height in comparison with low height. This observation was consistent between sites (Figure 4) and may be explained by a lower immersion time leading to a lower exposure to viral particles in the water. Similar conclusions were reached in France and Ireland after observation of reduced mortality when oysters were placed higher on the shore (Peeler et al. 2012).
The low mortality rate of spat placed in floating baskets, in comparison with the spat placed in adjacent intertidal cultivation systems, cannot be explained by a reduced immersion time as these oysters were constantly immersed. However, this could be related to the viability / infectivity of the virions in the water. As OsHV-1 is an enveloped virus it is also reasonable to imagine that higher exposure to high temperature and sunlight (UV) in the first centimetres of the water column than in the subjacent water layers may have significantly damaged the virus by destroying its lipid-containing envelope (Renault 2011). Indeed, as water density decreases as temperature increases, warm water overlies colder water and creates stable horizontal gradients that resist vertical mixing (Suthers & Rissik 2009). Alternatively it is possible that oysters present in the superficial layer of water might not have been exposed to a quantity of virions sufficient to induce disease. This could be due to valve opening and feeding activities (i.e. oyster physiology) being reduced due to the cultivation structure. Cote et al. (1994) explained that the low energetic reserves in oysters placed in Australian baskets might be due to the fact that they were more exposed to shocks caused by wave and wind action thus causing reduced valve opening and feeding activities. Although the floating baskets used in the present study were quite different from the Australian baskets, intensive observations from the field clearly demonstrated that the floating systems were subjected to shocks and heavy movements caused by waves and wind at all sites in Woolooware bay.
Overall these findings lead to a very significant question about the mode of transmission of OsHV-1 in water. It has already been demonstrated in experimental studies in aquaria that OsHV-1 can be a waterborne infection transmitted between infected and healthy individuals through cohabitation (Schikorski et al. 2011b). Sauvage et al. (2009) analysed seawater samples from an artificial pond during a mortality outbreak and were able to detect a significant quantity of viral DNA (103 viral DNA copies L-1). However, whether OsHV-1 transmission mainly involves waterborne free virus or virus attached to or engulfed by particles is unknown and data on the existence of potential vectors for OsHV-1 transmission in natural environments are lacking. Herpes-like particles have been detected previously in unicellular organisms (thraustochytrid-like organism, Schizochytrium sp.) from the York River estuary (Virginia, USA) (Kazama & Schornstein 1972, 1973). More recently, enveloped OsHV-1-like virions were detected in a marine fungoid protist which was present in experimental rearing tanks containing Pacific oyster larvae. The protist was observed free in the water and also phagocytised inside cells of larval oysters (Renault et al. 2003). These findings suggest that marine unicellular organisms may play a role as vectors for transmission of OsHV-1 in natural environments (Renault 2011). However, the argument should not be restricted to unicellular life forms, as inanimate suspended particles and metazoans in the plankton may also be vectors. It is well known that viruses, like other microbes, attach to particles in the environment through complex reversible
9
and irreversible interactions, and so their fate and transport is associated with that of the particles (Tufenkji 2007, Dhand et al. 2009). Previous studies also revealed that plankton affect viral ecology in the natural environment and may play a role in the transmission of finfish viruses (Faisal & Winters 2011, Minamoto et al. 2011). These published studies and field observations suggest that OsHV-1 could be associated with particles. The epidemiological observations from the present study are consistent with this idea.
The hypothesis that the dispersion and transmission of OsHV-1 could involve particles including plankton acting as a vector could explain the patchy distribution of mortality. Note that in this paper the term “plankton” is used in its broad sense, i.e. ranging from minute bacteria to microscopically visible phytoplankton, larger zooplankton and small invertebrate larvae. It is well recognised that plankton organisms are not distributed uniformly throughout the water but have a non-random and patchy distribution in both time (day/night, summer/winter) and space (horizontal and vertical) across a wide range of spatial scales (from < 10 cm to > 1km) (Cassie 1959, Steele 1976, Malone & McQueen 1983, Botlvoskoy & Mazzoni 1988, Breitburg et al. 1995, Suthers & Rissik 2009, Benoit-Bird & MacManus 2012). Malone & McQueen (1983) investigated zooplankton communities in lakes and demonstrated that they were all patchy in terms of both vertical and horizontal distributions, and the patches tended to be comprised of unique groups of species. If OsHV-1 was carried by specific plankton cells, this could reasonably explain the clusters of mortality at macro scale, the non-progression of mortality from site A to B to C, and the clusters within sites over time. Additionally, this hypothesis could also explain the vertical pattern of mortality observed in this study. Vertical clustering of planktonic organisms is well known and is due to biological (competition, predation, gregariousness, rheotactism) as well as physical factors (thermal stratification, salinity, light exposure, O2:CO2 ratio) and is highly dependent on species, sex, age, habitat type and season (Cassie 1958, Malone & McQueen 1983, Van Gool & Ringelberg 1998, Reinfelds & Williams 2012). Considering the hypothesis of a planktonic vector for OsHV-1, a deeper position of this vector in the water column for biological or physical reasons would lead to less exposure of the oysters in floating baskets near the surface in comparison with oysters placed at a fixed intertidal position.
The potential role of oyster physiology and feeding behaviour on OsHV-1 associated mortality is also interesting to contemplate. If OsHV-1 is associated with a particulate vector it is possible that size preferences for feed may influence the exposure of oysters of different sizes/ages, and hence influence mortality patterns.
There are a number of limitations in the present study. No plankton or water samples were collected to validate the plankton hypothesis. Thus, the present study aims to stimulate research about the mode of transmission of OsHV-1 in natural environments. While we observed strong vertical clustering of mortality consistent with a hypothesis of a planktonic vector, this might be disrupted by strong wind or wave action causing mixing of strata, in which case the mortality pattern may not show such vertical patterns. For this reason, the present study will be repeated to observe mortality patterns associated with different seasonal weather patterns. In addition, more detailed investigations are required to clarify the roles of potential mechanisms (micro-hydrodynamics / plankton patchiness / oyster physiology) on the strong clustering pattern of OsHV-1 associated mortalities at macro and micro scales.
Conclusion
OsHV-1 associated mortality in C. gigas in Woolooware Bay in 2011-2012 followed the pattern of a point source epizootic. Beyond the influence of oyster ages on mortality rates, the clustering of mortality was clearly demonstrated in time and space at large scale (bay level) as well as very small scale (site level, tray level, vertically). Is there one hypothesis that can explain these observations? A planktonic vector that enhances transmission and spread of OsHV-1 could explain the observed
10
patterns. However, as no plankton sampling was performed to validate or invalidate this hypothesis, it is evident that further work is required to clarify the possible involvement of a vector for OsHV-1 transmission. High frequency water samples using appropriate plankton nets and water samplers before, during and after an outbreak at different tide cycles and time (day/night) will be required to investigate this question. PCR and in situ hybridization will constitute relevant tools to detect and observe OsHV-1 DNA in the water samples and, if found, its potential carrier. Further work on viral RNA activity will be also required to determine the infective status of the virus. The importance of such a study is that it may be possible to ameliorate the impact of OsHV-1 by disturbing the spatial distribution of a vector around an oyster farm, or by placing oysters in a husbandry system designed to avoid the vector.
Acknowledgements
This study was funded by the Fisheries Research and Development Corporation, the University of Sydney and the Sydney Metropolitan Catchment Management Authority. The authors would like to thank Brian Jones for sharing his expertise on plankton and Michael Ward for advice on spatial data analysis. A special acknowledgement is due to the oyster farmers Bob, Len and Ted Drake, Rob Moxham, John Stubbs and Bruce Alford for their invaluable support in the field and their knowledge that significantly improved the design of this trial.
References
Altman DG (1991) Practical statistics for medical research. London: Chapman and Hall.
Anon (2011) International OsHV-1 μVar Workshop, Cairns, Queensland, Australia 9-10 July 2011. Fisheries Research and Development Corporation, Canberra.
Benoit-Bird KJ, McManus MA (2012) Bottom-up regulation of a pelagic community through spatial aggregations. Biol Lett 8:813-816
Berthelin C, Kellner K, Mathieu M (2000) Storage metabolism in the Pacific oyster (Crassostrea gigas) in relation to summer mortalities and reproductive cycle (West Coast of France). Comp Biochem Physiol - B Biochem Mol Biol 125:359-369
Boltovskoy D, Mazzoni HE (1988) The effects of sampling gear and environmental conditions on the abundance estimates of freshwater zooplankton. Rev Hydrobiol Trop 21:21-34
Breitburg DL, Palmer MA, Loher T (1995) Larval distributions and the spatial patterns of settlement of an oyster reef fish: responses to flow and structure. Mar Ecol-Prog Ser 125:45-60
Burge CA, Judah LR, Conquest LL, Griffin FJ, Cheney DP, Suhrbier A, Vadopalas B, Olin PG, Renault T, Friedman CS (2007) Summer seed mortality of the Pacific oyster, Crassostrea gigas Thunberg grown in Tomales Bay, California, USA: The influence of oyster stock, planting time, pathogens, and environmental stressors. J Shellfish Res 26:163-172
Burge CA, Griffin FJ, Friedman CS (2006) Mortality and herpesvirus infections of the Pacific oyster Crassostrea gigas in Tomales Bay, California, USA. Dis Aquat Org 72:31-43
Cassie M (1958) Apparatus for investigating spatial distribution of plankton. New Zeal J Sci 1:436-448
Cassie M (1959) An experimental study of factors inducing aggregation in marine plankton. New Zeal J Sci 2:339-365
Cote J, Himmelman JH, Claereboudt MR (1994) Separating effects of limited food and space on growth of the giant scallop Placopecten magellanicus in suspended culture. Mar Ecol-Prog Ser 106:85-92
11
Davison AJ, Eberle R, Ehlers B, Hayward GS, McGeoch DJ, Minson AC, Pellett PE, Roizman B, Studdert MJ, Thiry E (2009) The Order Herpesvirales. Virol Div News ArchVirol 154:171-177
Davison AJ, Trus BL, Cheng N, Steven A, Watson MS, Cunningham C, Le Deuff RM, Renault T (2005) A novel class of herpesvirus with bivalve hosts. J GenVirol 86:41-53
Dégremont L (2011) Evidence of herpesvirus (OsHV-1) resistance in juvenile Crassostrea gigas selected for high resistance to the summer mortality phenomenon. Aquaculture 317:94-98
Dégremont L, Boudry P, Ropert M, Samain JF, Bédier E, Soletchnik P (2010) Effects of age and environment on survival of summer mortality by two selected groups of the Pacific oyster Crassostrea gigas. Aquaculture 299:44-50
Dhand NK, Toribio JA, Whittington RJ (2009) Adsorption of Mycobacterium avium subsp. paratuberculosis to soil particles. Appl Environ Microbiol 75, 5581-5585
Dumbauld BR, Ruesink JL, Rumrill SS (2009) The ecological role of bivalve shellfish aquaculture in the estuarine environment: A review with application to oyster and clam culture in West Coast (USA) estuaries. Aquaculture 290:196-223
Dundon WG, Arzul I, Omnes E, Robert M, Magnabosco C, Zambon M, Gennari L, Toffan A, Terregino C, Capua I, Arcangeli G (2011) Detection of Type 1 Ostreid Herpes variant (OsHV-1 μvar) with no associated mortality in French-origin Pacific cupped oyster Crassostrea gigas farmed in Italy. Aquaculture 314:49-52
Faisal M, Winters AD (2011) Detection of Viral Hemorrhagic Septicemia Virus (VHSV) from Diporeia spp. (Pontoporeiidae, Amphipoda) in the Laurentian Great Lakes, USA. Parasites and Vectors 4:2
FAO (2006) http://www.fao.org/fishery/culturedspecies/Crassostrea_gigas/en
Forrest BM, Keeley NB, Hopkins GA, Webb SC, Clement DM (2009) Bivalve aquaculture in estuaries: Review and synthesis of oyster cultivation effects. Aquaculture 298:1-15
Friedman CS, Estes RM, Stokes NA, Burge CA, Hargove JS, Barber BJ, Elston RA, Burreson EM, Reece KS (2005) Herpes virus in juvenile Pacific oysters Crassostrea gigas from Tomales Bay, California, coincides with summer mortality episodes. Dis Aquat Org 63:33-41
Garcia C, Thébault A, Dégremont L, Arzul I, Miossec L, Robert M, Chollet B, François C, Joly JP, Ferrand S, Kerdudou N, Renault T (2011) Ostreid herpesvirus 1 detection and relationship with Crassostrea gigas spat mortality in France between 1998 and 2006. Vet Res 42
Hawkins AJS, Smith RFM, Tan SH, Yasin ZB (1998) Suspension-feeding behaviour in tropical bivalve molluscs: Perna viridis, Crassostrea belcheri, Crassostrea iradelei, Saccostrea cucculata and Pinctada margarifera. Mar Ecol Prog Ser 166:173-185
Hershberger PK, Gregg JL, Grady CA, Hart LM, Roon SR, Winton JR (2011) Factors controlling the early stages of viral haemorrhagic septicaemia epizootics: low exposure levels, virus amplification and fish-to-fish transmission. J Fish Dis 34:893-899
Kazama FY, Schornstein KL (1972) Herpes-type virus particles associated with a fungus. Science 177:696-697
Kazama FY, Schornstein KL (1973) Ultrastructure of a fungus herpes type virus. Virol 52:478-487
Kristoffersen AB, Viljugrein H, Kongtorp RT, Brun E, Jansen PA (2009) Risk factors for pancreas disease (PD) outbreaks in farmed Atlantic salmon and rainbow trout in Norway during 2003-2007. Prev Vet Med 90:127-136
12
Kulldorff M (1997) A spatial scan statistic. Communications in Statistics - Theory Methods 26:1481-1496
Le Deuff RM, Renault T, Gérard A (1996) Effects of temperature on herpes-like virus detection among hatchery-reared larval Pacific oyster Crassostrea gigas. Dis Aquat Org 24:149-157
Malone BJ, McQueen DJ (1983) Horizontal patchiness in zooplankton populations in two Ontario kettle lakes. Hydrobiol 99:101-124
Martenot C, Oden E, Travaillé E, Malas JP, Houssin M (2010) Comparison of two real-time PCR methods for detection of ostreid herpesvirus 1 in the Pacific oyster Crassostrea gigas. J Virol Methods 170:86-89
Minamoto T, Honjo MN, Yamanaka H, Tanaka N, Itayama T, Kawabata Z. (2011) Detection of cyprinid herpesvirus-3 DNA in lake plankton. Res Vet Sci 90:530-532
Miossec L, Le Deuff RM, Goulletquer P (2009) Alien species alert: Crassostrea gigas (Pacific oyster). ICES Cooperative Research Report, Book 299
Mori K (1979) Effects of artificial eutrophication on the metabolism of the Japanese oyster Crassostrea gigas. Mar Biol 53:361–369
Murray AG, O'Callaghan M, Jones B (2001a) A model of transmission of a viral epidemic among schools within a shoal of pilchards. Ecol Model 144:245-259
Murray AG, O'Callaghan M, Jones B (2001b) Simple models of massive epidemics of herpesvirus in Australian (and New Zealand) pilchards. Environ Int 27:243-248
Peeler EJ, Allan Reese R, Cheslett DL, Geoghegan F, Power A, Thrush MA (2012) Investigation of mortality in Pacific oysters associated with Ostreid herpesvirus-1μVar in the Republic of Ireland in 2009. Prev Vet Med 105:136-143
Perdue JA, Beattie JH, Chew KK (1981) Some relationships between gametogenic cycle and summer mortality phenomenon in the Pacific oyster (Crassostrea gigas) in Washington State. J Shellfish Res 1:9–16
Pernet F, Barret J, Le Gall P, Corporeau C, Dégremont L, Lagarde F, Pépin JF, Keck N (2012) Mass mortalities of Pacific oysters Crassostrea gigas reflect infectious diseases and vary with farming practices in the Mediterranean Thau lagoon, France. Aquaculture Environ Int 2:215-237
Reinfelds I, Williams S (2012) Threshold flows for the breakdown of seasonally persistent thermal stratification: Shoalhaven river below Tallowa dam, New South Wales, Australia. River Res Appl 28:893-907
Renault T, Moreau P, Faury N, Pepin JF, Segarra A, Webb S (2012) Analysis of clinical ostreid herpesvirus 1 (Malacoherpesviridae) specimens by sequencing amplified fragments from three virus genome areas. Journal of Virology 86:5942-5947
Renault T (2011) Viruses Infecting Marine Molluscs. In: Hurst CJ (ed) Studies in Viral Ecology: Animal Host Systems, Book 2. John Wiley & Sons, Inc., Hoboken, NJ, USA, p 153-175
Renault T (1998) Infections herpétiques chez les invertébrés: Détection de virus de type herpès chez les mollusques bivalves marins. Virol 2:401-403
Renault T, Le Deuff RM, Cochennec N, Maffart P (1994) Herpesviruses associated with mortalities among Pacific oyster, Crassostrea gigas, in France - comparative study. Rev Med Vet 145:735-742
13
Renault T, Lipart C, Arzul I (2003) Detection d'un virus de type herpes chez un champignon present dans les elevages larvaires d'huitres creuses Crassostrea gigas. Virol 7
Renault T, Novoa B (2004) Viruses infecting bivalve molluscs. Aquat Living Resour 17:397-409
Saulnier D, de Decker S, Haffner P, Cobret L, Robert M, Garcia C (2011) A large-scale epidemiological study to identify bacteria pathogenic to Pacific oyster Crassostrea gigas and correlation between virulence and metalloprotease-like activity. Microbiol Ecol 59:787-798
Sauvage C, Pépin JF, Lapègue S, Boudry P, Renault T (2009) Ostreid herpes virus 1 infection in families of the Pacific oyster, Crassostrea gigas, during a summer mortality outbreak: Differences in viral DNA detection and quantification using real-time PCR. Virus Res 142:181-187
Schikorski D, Faury N, Pepin JF, Saulnier D, Tourbiez D, Renault T (2011a) Experimental ostreid herpesvirus 1 infection of the Pacific oyster Crassostrea gigas: Kinetics of virus DNA detection by q-PCR in seawater and in oyster samples. Virus Res 155:28-34
Schikorski D, Renault T, Saulnier D, Faury N, Moreau P, Pépin JF (2011b) Experimental infection of Pacific oyster Crassostrea gigas spat by ostreid herpesvirus 1: Demonstration of oyster spat susceptibility. Vet Res 42
Segarra A, Pépin JF, Arzul I, Morga B, Faury N, Renault T (2010) Detection and description of a particular Ostreid herpesvirus 1 genotype associated with massive mortality outbreaks of Pacific oysters, Crassostrea gigas, in France in 2008. Virus Res 153:92-99
Steele JH (1976) Patchiness. In: Cushing DH, Walsh, J.J. (ed) The Ecology of the Seas. Blackwell Scientific Publishers, Oxford
Suthers IM, Rissik D (2009) Plankton - A Guide to Their Ecology and Monitoring for Water Quality. CSIRO PUBLISHING
Thrusfield M (2007) Veterinary epidemiology. Blackwell Publishing Ltd, Oxford
Tufenkji N (2007) Modeling microbial transport in porous media: Traditional approaches and recent developments. Adv Water Res 30:1455-1469
Van Gool E, Ringelberg J (1998) Light-induced migration behaviour of Daphnia modified by food and predator kairomones. Anim Behav 56:741-747
Viljugrein H, Staalstrøm A, Molvær J, Urke HA, Jansen PA (2009) Integration of hydrodynamics into a statistical model on the spread of pancreas disease (PD) in salmon farming. Dis Aquat Org 88:35-44
Whittington RJ, Jones JB, Hine PM, Hyatt AD (1997) Epizootic mortality in the pilchard Sardinops sagax neopilchardus in Australia and New Zealand in 1995. I. Pathology and epizootiology. Dis Aquat Org 28:1-16
14
Figure 1. Experimental sites (Site A: 34.0118 S;151.1463 E / Site B: 34.0254 S;151.1400 E / Site C: 34.0329 S;151.1466 E) in Woolooware Bay (Botany Bay NSW Australia).
Figure 2. Schematic representation of the two experiments in different tide scenarios. (A) intertidal trays at high and low heights in Experiment 1; (B) intertidal trays at low height and subtidal floating baskets in Experiment 2.
Low tide
Intermediate
tide
High tide
A B
15
Figure 3. Spatial distribution of mortality in trays at sites A and C for selected time points (experiment 1). Each number represents the observed mortality (%) in each segment of the tray.* indicates trays wherein the mortalities are significantly different between left and right hand sides.
0 2 0 0
55 67
8 92
0 0 2 0
50 97
8 42
0 0 0 0
47 97
13 33
0 0 0 2
18 74
3 24
29 18
24 13
87 100
96 100
13 41
40 29
90 100
100 97
23 39
5 23
100 89
100 98
63 26
3 33
84 78
91 100
0 0 0 0
5 27
52 41
0 0 2 0
0 44
57 52
0 0 0 0
0 14
31 39
0 0 0 0
0 13
0 5
0 0 0 0
20 67
0 39
2 0 0 2
38 82
39 68
0 0 0 0
31 100
59 83
0 0 0 2
28 82
33 47
3 3
7 11
92 100
81 100
3 3
6 21
100 100
77 100
4 9
6 30
100 90
90 97
7 10
3 15
72 86
76 92
33 46
50 26
96 100
100 100
9 47
55 63
100 100
100 100
20 38
62 61
100 100
100 100
21 18
66 37
100 100
100 100
High adult High spat
Low adult Low spat
High adult High spat
High adult High spat
Low adult Low spat
Low adult Low spat
* *
*
* *
*
*
* Site A – 24
th November 2011
Site A – 21st November 2011
Site C – 16th
November 2011
16
0
20
40
60
80
100
Dec-2011 Feb-2012 May-2012
Cu
mu
lati
ve m
ort
alit
y (%
)
DateHigh spat Low spat High adult Low adult
0
20
40
60
80
100
Dec-2011 Feb-2012 May-2012
Cu
mu
lati
ve m
ort
alit
y (%
)
DateHigh spat Low spat High adult Low adult
0
20
40
60
80
100
Dec-2011 Feb-2012 May-2012
Cu
mu
lati
ve m
ort
alit
y (%
)
DateHigh spat Low spat High adult Low adult
Figure 4. Cumulative mortality of oysters at sites A, B and C in Woolooware Bay in 2011-12 as a function of age and height of trays (Experiment 1). The initial stocking density was 640 individuals per treatment.
A
B
C
17
Figure 5. Cumulative mortality of oysters at sites A, B and C in Woolooware Bay according to the age and cultivation systems (Experiment 2 - initial batch #1 spat and adult deployed on the 24/11/11). Spat-T: spat in intertidal trays; Spat-F: spat in floating baskets; Adult-T: adult oysters in intertidal trays; Adult-F: adult oysters in floating baskets. The initial stocking density was 30 individuals per treatment and per batch.
A
B
C
0
20
40
60
80
100
Dec-2011 Feb-2012 May-2012
Cu
mu
lati
ve m
ort
alit
y (%
)
DateSpat-T Spat-F Adult-T Adult-F
0
20
40
60
80
100
Dec-2011 Feb-2012 May-2012
Cu
mu
lati
ve m
ort
alit
y (%
)
DateSpat-T Spat-F Adult-T Adult-F
0
20
40
60
80
100
Dec-2011 Feb-2012 May-2012
Cu
mu
lati
ve m
ort
alit
y (%
)
Date
Spat-T Spat-F Adult-T Adult-F
18
Figure 6. Cumulative mortality of oysters at sites A, B and C in Woolooware Bay according to the age and cultivation systems (Experiment 2 – additional batch #2 spat and adult deployed on the 20/12/11 at site A only; additional batch #3 deployed on the 16/03/12 at all sites). Spat-T: spat in intertidal trays; Spat-F: spat in floating baskets; Adult-T: adult oysters in intertidal trays; Adult-F: adult oysters in floating baskets. The initial stocking density was 30 individuals per treatment and per batch.
A
B
C
Batch #2 not deployed at this site
Batch #2 not deployed at this site
No mortality
detected in batch #2
0
20
40
60
80
100
Dec-2011 Feb-2012 May-2012
Cu
mu
lati
ve m
ort
alit
y (%
)
DateSpat-T #2 Spat-F #2 Spat-T #3 Spat-F #3
0
20
40
60
80
100
Dec-2011 Feb-2012 May-2012
Cu
mu
lati
ve m
ort
alit
y (%
)
DateSpat-T #3 Spat-F #3
0
20
40
60
80
100
Dec-2011 Feb-2012 May-2012
Cu
mu
lati
ve m
ort
alit
y (%
)
DateSpat-T #3 Spat-F #3