Embed Size (px)
Citation preview

Spatial mapping of the biologiceffectiveness of scanned particlebeams: towards biologically optimizedparticle therapyFada Guan1*, Lawrence Bronk2*, Uwe Titt1, Steven H. Lin2,3, Dragan Mirkovic1, Matthew D. Kerr1,X. Ronald Zhu1, Jeffrey Dinh2, Mary Sobieski4, Clifford Stephan4, Christopher R. Peeler1, Reza Taleei1,Radhe Mohan1 & David R. Grosshans2,3
1Departments of Radiation Physics, 2Experimental Radiation Oncology, 3Radiation Oncology, The University of Texas MD AndersonCancer Center, Houston, Texas, U.S.A., 4Center for Translational Cancer Research, Texas A&M Health Science Center, Institute ofBiosciences and Technology, Houston, Texas, U.S.A.
The physical properties of particles used in radiation therapy, such as protons, have been well characterized,and their dose distributions are superior to photon-based treatments. However, proton therapy may alsohave inherent biologic advantages that have not been capitalized on. Unlike photon beams, the linear energytransfer (LET) and hence biologic effectiveness of particle beams varies along the beam path. Selectiveplacement of areas of high effectiveness could enhance tumor cell kill and simultaneously spare normaltissues. However, previous methods for mapping spatial variations in biologic effectiveness aretime-consuming and often yield inconsistent results with large uncertainties. Thus the data needed toaccurately model relative biological effectiveness to guide novel treatment planning approaches are limited.We used Monte Carlo modeling and high-content automated clonogenic survival assays to spatially map thebiologic effectiveness of scanned proton beams with high accuracy and throughput while minimizingbiological uncertainties. We found that the relationship between cell kill, dose, and LET, is complex andnon-unique. Measured biologic effects were substantially greater than in most previous reports, andnon-linear surviving fraction response was observed even for the highest LET values. Extension of thisapproach could generate data needed to optimize proton therapy plans incorporating variable RBE.
I nterest in particle therapy, particularly proton therapy, has been increasing. The number of treatment centersin the United States alone is expected to double over the next 5–10 years. Although initial clinical results arepromising, the rapid expansion of particle therapy is controversial given its high cost and the need for
randomized trials to assess the clinical benefits of proton therapy compared with standard photon (X-ray) basedtreatments1–3.
Currently the widespread interest in proton therapy is driven by the physical properties of particle therapy,which allow greater sparing of normal tissues from excess radiation. The relevant physical properties stem fromthe fact that protons and other charged particles continuously lose energy as they traverse through tissue, with therate of energy loss increasing as the particles slow. This phenomenon results in a dose deposition profile in whichdoses are low at the entrance into tissue, higher near the end of the range, and drop to near zero abruptlythereafter. The highest point of the dose deposition curve is known as the Bragg peak. In principle, these physicaldose-deposition characteristics of particle therapy offer significant potential to enhance the therapeutic ratiocompared with conventional modes of radiation therapy.
Although the physical properties of particles such as protons are well understood, much remains to be learnedof their unique biologic effects. A large amount of research has demonstrated that particles generally have higherrelative biological effectiveness (RBE) than photons (which by definition have an RBE of 1 when produced byCobalt-60) towards the end of their range. This increased RBE indicates that particles are more biologicallyeffective at inducing cell death than are photons, which underscores their potential for treating radiation-resistanttumors4,5. Heavier particles, such as carbon ions, have a significantly higher RBE than photons, with typical valuesranging between 2 and 4 depending on the location along the beam path6,7. Protons, being relatively light particles,
OPEN
SUBJECT AREAS:BIOLOGICAL
TECHNIQUES
RADIOTHERAPY
Received1 October 2014
Accepted18 March 2015
Published18 May 2015
Correspondence andrequests for materials
should be addressed toD.R.G. (dgrossha@
mdanderson.org) orR.M. (rmohan@
mdanderson.org)
* These authorscontributed equally to
this work.
SCIENTIFIC REPORTS | 5 : 9850 | DOI: 10.1038/srep09850 1
have an RBE closer to that of photons. In the current clinical practiceof proton therapy, the RBE is assumed to have a generic, spatiallyinvariant, constant value of 1.18.
This assumption has been justified based on numerous in vitro andin vivo experiments carried out under relatively limited conditionsusing older delivery techniques (e.g., high doses per fraction, passivescattering)8. Although numerous, existing experimental data tend tobe inconsistent and involve large uncertainties, a factor that is oftenused to justify the continued use of averaged RBE value of 1.19. Evenwith high uncertainties and inconsistencies, many experiments haveshown that the RBE of proton beams can vary considerably along thebeam path and as a function of dose, but these potential variations inRBE are not accounted for in clinical treatment planning sys-tems10–12. Thus, the concept of a generic RBE value for proton ther-apy is increasingly coming under scrutiny. Deeper understanding ofthe unique biologic effects of protons, combined with advances inplanning delivery techniques, could considerably expand the thera-peutic index of proton therapy.
Further, as delivery modalities progress, the opportunity arises tocapitalize on the RBE variability of both protons and other ions.Historically, most clinical particle treatments were delivered withpassive scattering technology, where a thin beam is scattered laterallyand modulated longitudinally to produce a volume of uniform dose,comprising superposition of multiple Bragg peaks into what isknown as the spread-out Bragg peak (SOBP)11. This volume isshaped by introducing materials into the beam to conform it tothe three-dimensional shape of the target. In this delivery method,the highest-intensity Bragg curves contribute most of the dose to theformation of the distal edges of beams, which commonly lie withinnormal tissues beyond the target tumor volume.
Newer techniques use magnetically scanned thin pristine beams(‘‘beamlets’’) of particles with sequences of energies to produce dosedistribution patterns to plan and deliver the most advanced form ofparticle therapy, intensity-modulated particle therapy (IMPT).IMPT involves sophisticated optimization techniques to adjustintensities and energies of incident pristine beams to balance theneed to deliver maximum doses to tumor targets while maximallysparing nearby normal tissues.
IMPT has the potential to exploit the higher RBE of protons orother particles around the Bragg peak by preferentially placing themost biologically effective portions of the beam inside the targetvolume and away from normal structures. This is in contrast tocurrent delivery techniques, in which the treatment is optimizedsolely to create a uniform dose in the target volume without consid-eration of the varying biological effectiveness of the particles in thebeam. This preferential placement approach could significantlyincrease the differential between doses to target vs. normal tissues.However, the incorporation of variable RBE into IMPT optimizationrequires that accurate models be developed for computing RBE as afunction of dose per fraction, linear energy transfer (LET), and tissuetype, which in turn would require large amounts of accurate data onRBE. Unfortunately, data for developing these models are limitedand have been difficult to obtain because of numerous complicatingfactors such as adequate access to beam time, non-standardized irra-diations, variations in experimental techniques and reporting as wellas the large span of reported biologic responses9,13.
In a recent comprehensive review, Paganetti systematically ana-lyzed hundreds of published clonogenic data points to determine arelevant proton RBE9. That review stated that although the use of anRBE of 1.1 is acceptable for large clinical SOBPs, the literature doessupport increased RBE values of 1.15 at the center, 1.35 at the distaledge, and 1.7 at the distal falloff of an SOBP. Equally as important, thereview highlights the large spread of the existing clonogenic data andsuggests a need for experimental protocol standardization in addi-tion to more complete reporting of fit parameters and errors.Although clearer data reporting is relatively straightforward, the
ideal experimental protocol will require optimization owing to themultitude of complicating factors in a clonogenic assay alone thatcould contribute to the observed data spread.
In this report, we describe our combined use of basic particlephysics and minimization of biological uncertainty to design ahigh-throughput system for improving the accuracy of the acquiredbiologic data as a function of dose and LET. We report preliminaryresults generated with actively scanned monoenergetic proton beamsas a demonstration of the potential of such an approach. We anticip-ate that this method will continue to evolve to address multipleexperimental needs, not only for proton biology but also for similarexperiments with other ion species.
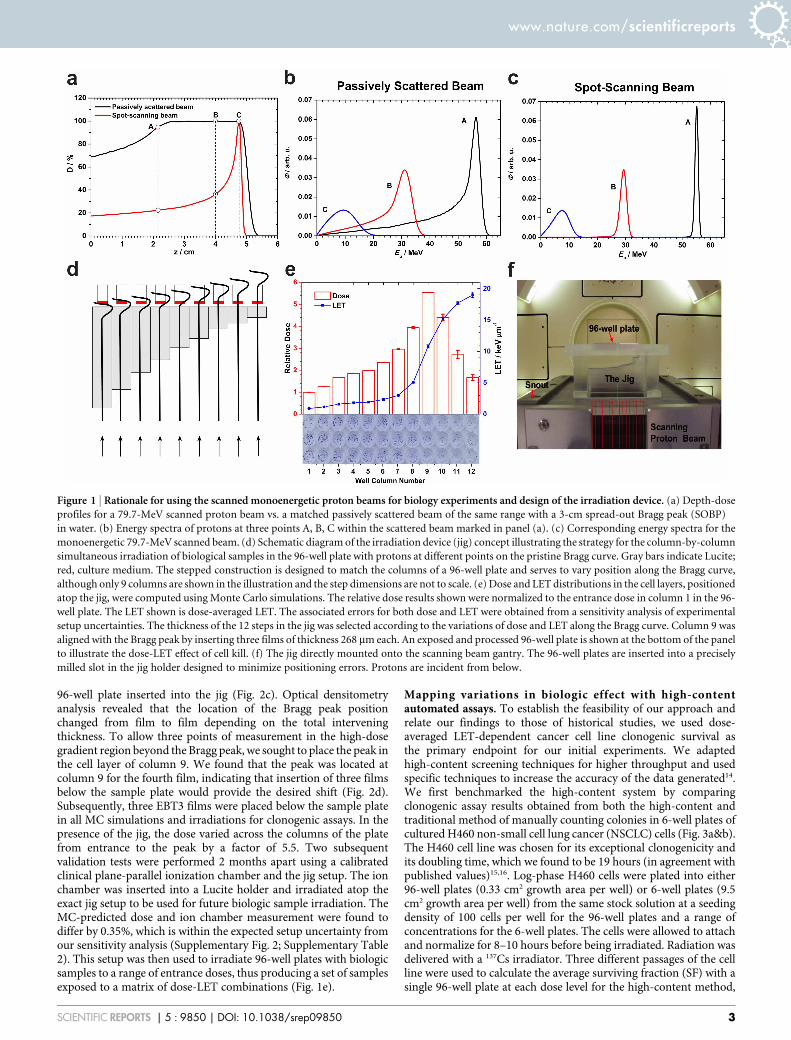
ResultsMonte Carlo–based design of a customized device to accuratelyand efficiently map biologic effects. The spatial energy spectra,and hence the LET spectra, of a therapeutic proton beam dependon several factors including incident energy, SOBP width, andposition of measurement within the SOBP as well as the machine-specific hardware used for scattering and range modulation. Wecompared the calculated energy spectra between passively scatteredand scanned beams at three matched locations along the beam pathsand found substantial differences between the two delivery methods(Fig. 1a–c). The broad energy spectra of passively scattered beams,particularly the long low-energy tails, could introduce significantuncertainty in the relationship between biological effect and LET.
To minimize the breadth of the energy and LET spectra, and tofacilitate correlations of biologic effect with LET and dose, wedeveloped a system using monoenergetic scanned proton beams.Because LET increases as a function of depth along the Bragg curve,first slowly and then rapidly, we used Monte Carlo (MC) simulationsto design an apparatus (jig) to attenuate proton energy in a stepwisefashion from the incident energy to the end of the range (schematic-ally illustrated in Fig. 1d). We chose 96-well plates to allow thesimultaneous irradiation of biologic samples to multiple dose-LETcombinations and automated plate processing. The irradiation jigwas designed by grouping the 96 wells into 12 columns of 8 wellseach, such that each of the columns are simultaneously exposed to adifferent combination of dose and LET, thus enabling the acquisitionof 12 times the amount of data from a single exposure. All of the wellsin a column are intended to receive the same dose-LET combination(Fig. 1e). The resulting design can be considered a multi-step rangeshifter consisting of 12 steps. The thickness of steps varies from 0 to amaximum value producing protons of increasing LET; the thickeststeps irradiate the cells with the portion of the Bragg curve from justbefore to just beyond the Bragg peak. The jig was custom-fabricatedfrom Lucite and directly mounts into the snout of the scanning beamgantry. The biologic sample plate is placed on top of the jig with thebeam directed upwards (Fig. 1f). The thickness of the material inter-posed in the proton beam path initially varies in large steps and thenin increasingly finer increments as the end of the proton rangeapproaches and at points beyond. This approach was taken toincrease the resolution in regions of high dose and LET gradients.MC calculations indicated that the jig did not appreciably alter theprofiles of the energy spectra (Supplementary Fig. 1).
Validation of spatial accuracy and irradiation of samples. To verifythe precision of the jig setup and radiation delivery in relation to theBragg curve, a scan pattern consisting of 441 spots of a 79.7-MeVproton beam was generated to form a 20 3 20 cm2 field. The field wasfound to be uniform over an area of 12 3 13 cm2, large enough tocover the biological sample area of 10.8 3 7.2 cm2 (Fig. 2a&b). Therespective column doses to a simulated cell layer were also found tobe within the statistical uncertainty of the MC simulations (6,1%).To determine the location of the Bragg peak, we exposed a stack oftwelve EBT3 films (each 268 mm thick) placed on top of an empty
www.nature.com/scientificreports
SCIENTIFIC REPORTS | 5 : 9850 | DOI: 10.1038/srep09850 2
96-well plate inserted into the jig (Fig. 2c). Optical densitometryanalysis revealed that the location of the Bragg peak positionchanged from film to film depending on the total interveningthickness. To allow three points of measurement in the high-dosegradient region beyond the Bragg peak, we sought to place the peak inthe cell layer of column 9. We found that the peak was located atcolumn 9 for the fourth film, indicating that insertion of three filmsbelow the sample plate would provide the desired shift (Fig. 2d).Subsequently, three EBT3 films were placed below the sample platein all MC simulations and irradiations for clonogenic assays. In thepresence of the jig, the dose varied across the columns of the platefrom entrance to the peak by a factor of 5.5. Two subsequentvalidation tests were performed 2 months apart using a calibratedclinical plane-parallel ionization chamber and the jig setup. The ionchamber was inserted into a Lucite holder and irradiated atop theexact jig setup to be used for future biologic sample irradiation. TheMC-predicted dose and ion chamber measurement were found todiffer by 0.35%, which is within the expected setup uncertainty fromour sensitivity analysis (Supplementary Fig. 2; Supplementary Table2). This setup was then used to irradiate 96-well plates with biologicsamples to a range of entrance doses, thus producing a set of samplesexposed to a matrix of dose-LET combinations (Fig. 1e).
Mapping variations in biologic effect with high-contentautomated assays. To establish the feasibility of our approach andrelate our findings to those of historical studies, we used dose-averaged LET-dependent cancer cell line clonogenic survival asthe primary endpoint for our initial experiments. We adaptedhigh-content screening techniques for higher throughput and usedspecific techniques to increase the accuracy of the data generated14.We first benchmarked the high-content system by comparingclonogenic assay results obtained from both the high-content andtraditional method of manually counting colonies in 6-well plates ofcultured H460 non-small cell lung cancer (NSCLC) cells (Fig. 3a&b).The H460 cell line was chosen for its exceptional clonogenicity andits doubling time, which we found to be 19 hours (in agreement withpublished values)15,16. Log-phase H460 cells were plated into either96-well plates (0.33 cm2 growth area per well) or 6-well plates (9.5cm2 growth area per well) from the same stock solution at a seedingdensity of 100 cells per well for the 96-well plates and a range ofconcentrations for the 6-well plates. The cells were allowed to attachand normalize for 8–10 hours before being irradiated. Radiation wasdelivered with a 137Cs irradiator. Three different passages of the cellline were used to calculate the average surviving fraction (SF) with asingle 96-well plate at each dose level for the high-content method,
Figure 1 | Rationale for using the scanned monoenergetic proton beams for biology experiments and design of the irradiation device. (a) Depth-dose
profiles for a 79.7-MeV scanned proton beam vs. a matched passively scattered beam of the same range with a 3-cm spread-out Bragg peak (SOBP)
in water. (b) Energy spectra of protons at three points A, B, C within the scattered beam marked in panel (a). (c) Corresponding energy spectra for the
monoenergetic 79.7-MeV scanned beam. (d) Schematic diagram of the irradiation device (jig) concept illustrating the strategy for the column-by-column
simultaneous irradiation of biological samples in the 96-well plate with protons at different points on the pristine Bragg curve. Gray bars indicate Lucite;
red, culture medium. The stepped construction is designed to match the columns of a 96-well plate and serves to vary position along the Bragg curve,
although only 9 columns are shown in the illustration and the step dimensions are not to scale. (e) Dose and LET distributions in the cell layers, positioned
atop the jig, were computed using Monte Carlo simulations. The relative dose results shown were normalized to the entrance dose in column 1 in the 96-
well plate. The LET shown is dose-averaged LET. The associated errors for both dose and LET were obtained from a sensitivity analysis of experimental
setup uncertainties. The thickness of the 12 steps in the jig was selected according to the variations of dose and LET along the Bragg curve. Column 9 was
aligned with the Bragg peak by inserting three films of thickness 268 mm each. An exposed and processed 96-well plate is shown at the bottom of the panel
to illustrate the dose-LET effect of cell kill. (f) The jig directly mounted onto the scanning beam gantry. The 96-well plates are inserted into a precisely
milled slot in the jig holder designed to minimize positioning errors. Protons are incident from below.
www.nature.com/scientificreports
SCIENTIFIC REPORTS | 5 : 9850 | DOI: 10.1038/srep09850 3
or with 6 replicates for each dose per experiment for the traditionalmethod. After irradiation, the cells were allowed to grow untilsufficient colony formation was observed in the control conditions(5 days for the high-content system and 10–12 days for thetraditional method) and then fixed and stained. Scoring, either bymanual counting for the traditional method or with an IN CellAnalyzer 6000 for the high-content system (Fig. 3b), showed goodcorrelation between techniques, with a non-statistically significantdifference between the curves (P50.315, extra sum-of-squares F test;Fig. 3c).
We next processed plates for exposure to protons using the jig.Exponentially growing H460 cells were detached, automaticallycounted, diluted, and plated into 96-well plates. Plates were seededat 100 cells per well from the same stock solution using an automatedplater. After either photon (137Cs) or proton irradiation, plates werecultured until colony formation, at which time they were stained andprepared for readout and subsequent survival analysis. The results ofour high-content proton experiment revealed that irradiation withincreasing LETs resulted in a marked decrease in cell survival(Fig. 3d). This trend was either obscured or not present at the lowerLET values in the plateau region of the Bragg curve, but it was espe-cially pronounced for the LET values at and beyond the Bragg peak(Fig. 3d). Data fitting found that the SF at a dose of 2 Gy (SF2) for theH460 cells was 0.40 for the lowest LET tested (0.9 keV/mm) and 0.29for protons with an LET of 10.8 keV/mm at the Bragg peak. Beyond theBragg peak, in high-LET areas, we found still lower SF2 values of 0.10for 15.2 keV/mm, 0.021 for 17.7 keV/mm, and 0.0037 for 19.0 keV/mm.
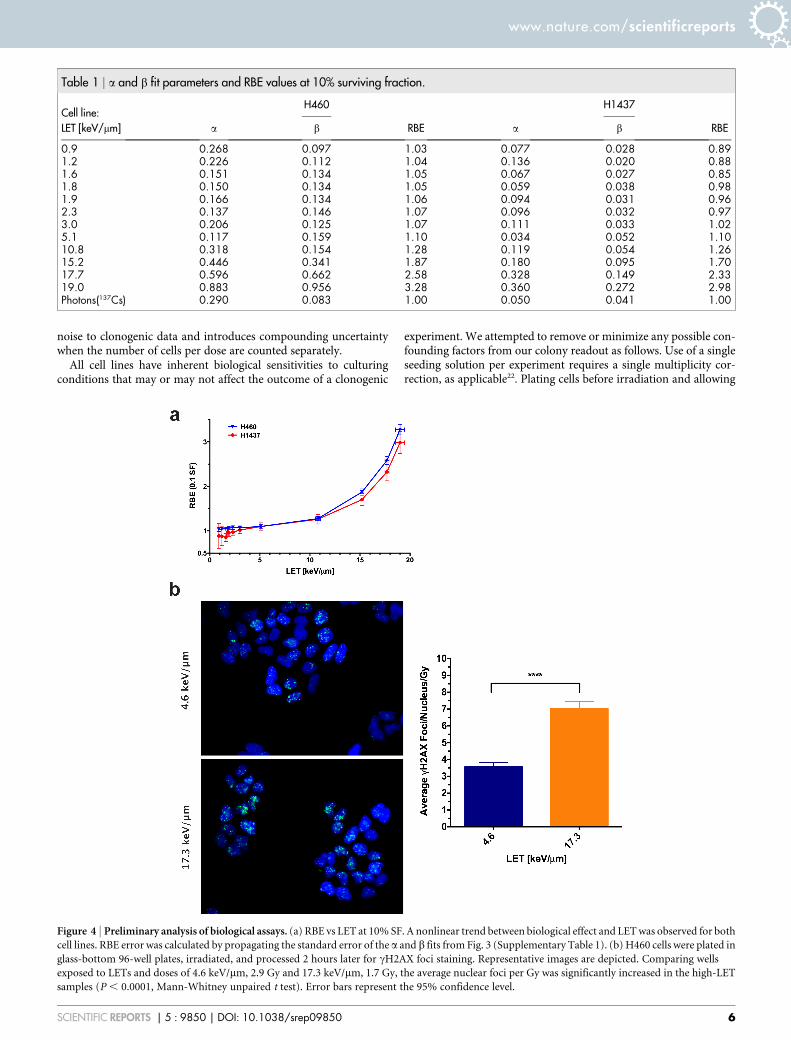
These initial results with the H460 cell line prompted us to furtherassess our method. To obtain higher-dose data we used the p53-mutant NSCLC line, H1437, which is resistant to apoptosis17. Asubsequent experiment with H1437 cells corroborated the trend seenwith the H460 cells (Fig. 3e). Calculated SF2s were between 0.70 and0.79 for the low LETs tested (0.9 to 5.1 keV/mm), 0.63 for 10.8 keV/mm, 0.47 for 15.2 keV/mm, 0.29 for 17.7 keV/mm, and 0.16 for 19.0keV/mm using the data fits to the H1437 dataset. Table 1 containsdetailed information on the a and b fit parameters and the recordedRBE values at 10% SF vs. 137Cs for the clonogenic survival plots.Plotting the RBE vs. LET for the two cell lines revealed a nonlinearresponse over the tested range where the RBE scaled in a biphasicmanner (Fig. 4a).
To demonstrate the applicability of the developed system for usewith assays other than clonogenic survival, we next compared DNAdouble-strand break induction (measured as cH2AX foci formation)between low- and high-LET regions in the H460 cells. As predicted,in high-LET regions, more foci were present 2 hours after irradiation(Fig. 4b). The overall dose-averaged number of cH2AX foci pernucleus was found to be significantly lower at 3.57 6 0.25 for 4.6keV/mm protons versus an average of 7.02 6 0.44 foci per nucleus at17.3 keV/mm (P , 0.0001, Mann-Whitney unpaired t test).
DiscussionWe found that an integrated physics and biology approach, coupledwith high-throughput techniques, can be used to systematically mapbiologic responses to actively scanned proton beams as a function of
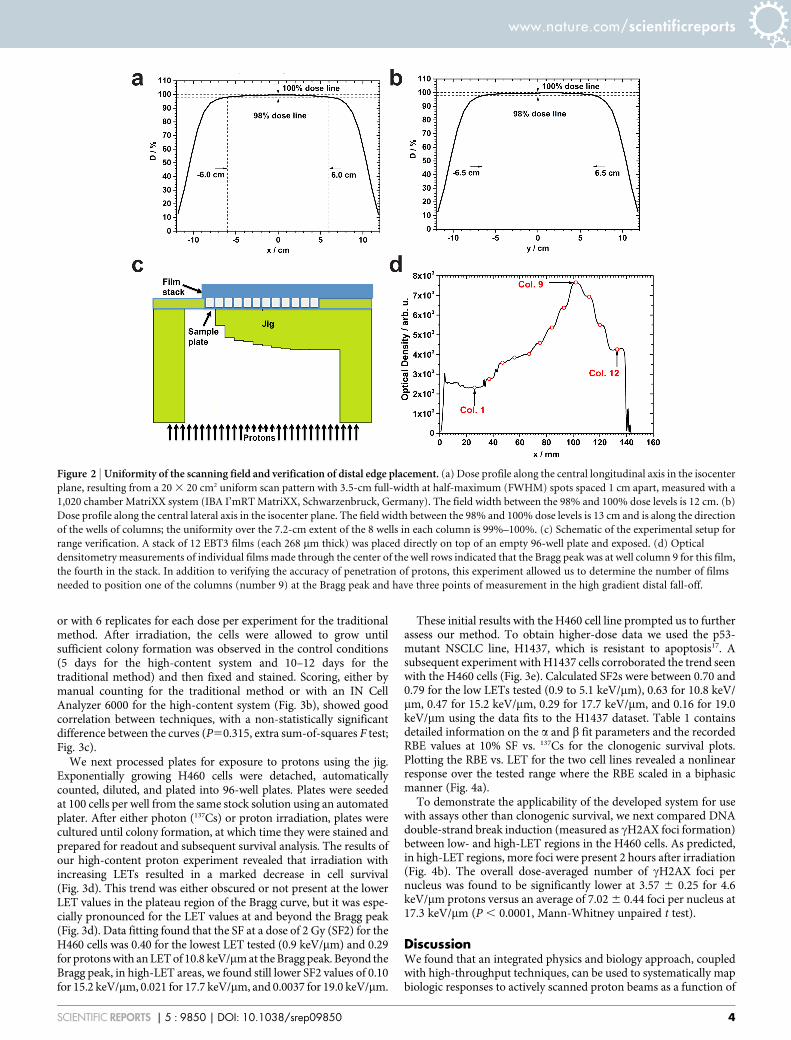
Figure 2 | Uniformity of the scanning field and verification of distal edge placement. (a) Dose profile along the central longitudinal axis in the isocenter
plane, resulting from a 20 3 20 cm2 uniform scan pattern with 3.5-cm full-width at half-maximum (FWHM) spots spaced 1 cm apart, measured with a
1,020 chamber MatriXX system (IBA I’mRT MatriXX, Schwarzenbruck, Germany). The field width between the 98% and 100% dose levels is 12 cm. (b)
Dose profile along the central lateral axis in the isocenter plane. The field width between the 98% and 100% dose levels is 13 cm and is along the direction
of the wells of columns; the uniformity over the 7.2-cm extent of the 8 wells in each column is 99%–100%. (c) Schematic of the experimental setup for
range verification. A stack of 12 EBT3 films (each 268 mm thick) was placed directly on top of an empty 96-well plate and exposed. (d) Optical
densitometry measurements of individual films made through the center of the well rows indicated that the Bragg peak was at well column 9 for this film,
the fourth in the stack. In addition to verifying the accuracy of penetration of protons, this experiment allowed us to determine the number of films
needed to position one of the columns (number 9) at the Bragg peak and have three points of measurement in the high gradient distal fall-off.
www.nature.com/scientificreports
SCIENTIFIC REPORTS | 5 : 9850 | DOI: 10.1038/srep09850 4
dose and LET. In developing this method, we attempted to reducesources of uncertainty while simultaneously increasing data output.
Clonogenic assays have been used to assess cellular reproductiveintegrity after an insult for more than 50 years18,19. Evolution of theexact method and understanding of the assay has produced a richamount of relevant literature to draw upon. For each of our experi-ments, cultured cell concentrations were determined by using an
automated cell counter, and all plates were seeded at a constantdensity from a single stock solution within 10–15 minutes of oneanother by using an automated plater. Use of a single seeding solu-tion was intended to reduce potential errors in cell counting oncolony formation. Even at the ideal theoretical limit of cell countingaccuracy, the associated counting error for a standard cell solution isapproximately 15%–30%20,21. This fact alone contributes intrinsic
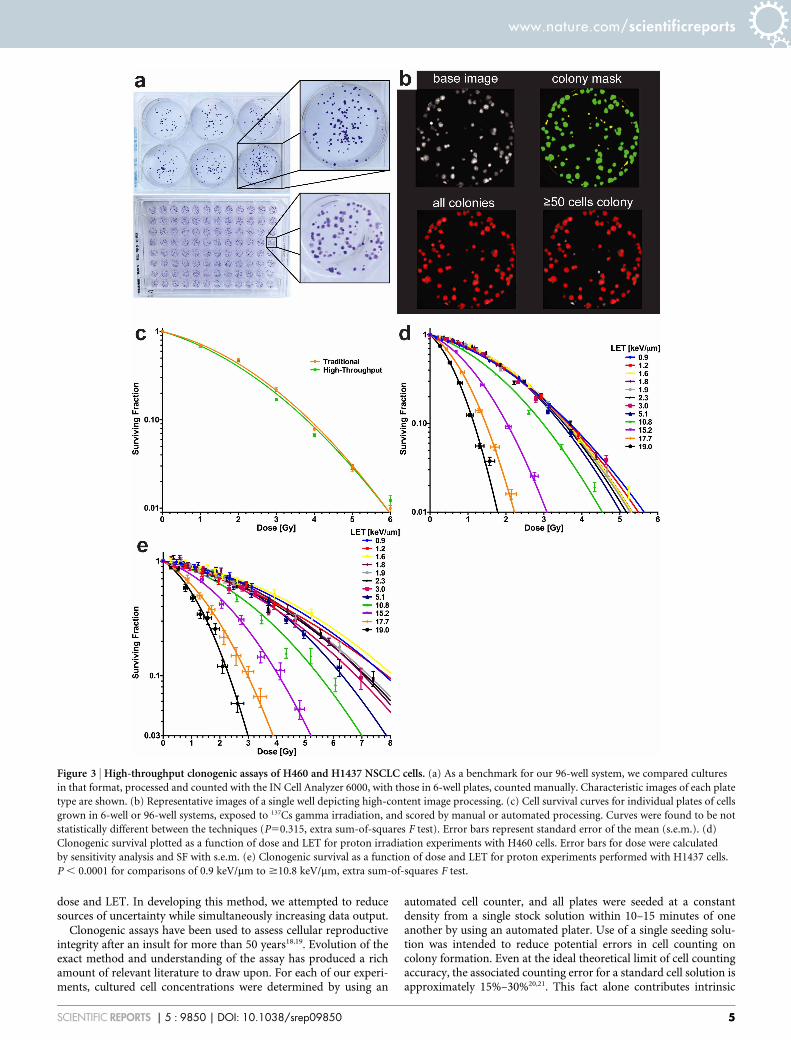
Figure 3 | High-throughput clonogenic assays of H460 and H1437 NSCLC cells. (a) As a benchmark for our 96-well system, we compared cultures
in that format, processed and counted with the IN Cell Analyzer 6000, with those in 6-well plates, counted manually. Characteristic images of each plate
type are shown. (b) Representative images of a single well depicting high-content image processing. (c) Cell survival curves for individual plates of cells
grown in 6-well or 96-well systems, exposed to 137Cs gamma irradiation, and scored by manual or automated processing. Curves were found to be not
statistically different between the techniques (P50.315, extra sum-of-squares F test). Error bars represent standard error of the mean (s.e.m.). (d)
Clonogenic survival plotted as a function of dose and LET for proton irradiation experiments with H460 cells. Error bars for dose were calculated
by sensitivity analysis and SF with s.e.m. (e) Clonogenic survival as a function of dose and LET for proton experiments performed with H1437 cells.
P , 0.0001 for comparisons of 0.9 keV/mm to $10.8 keV/mm, extra sum-of-squares F test.
www.nature.com/scientificreports
SCIENTIFIC REPORTS | 5 : 9850 | DOI: 10.1038/srep09850 5
noise to clonogenic data and introduces compounding uncertaintywhen the number of cells per dose are counted separately.
All cell lines have inherent biological sensitivities to culturingconditions that may or may not affect the outcome of a clonogenic
experiment. We attempted to remove or minimize any possible con-founding factors from our colony readout as follows. Use of a singleseeding solution per experiment requires a single multiplicity cor-rection, as applicable22. Plating cells before irradiation and allowing
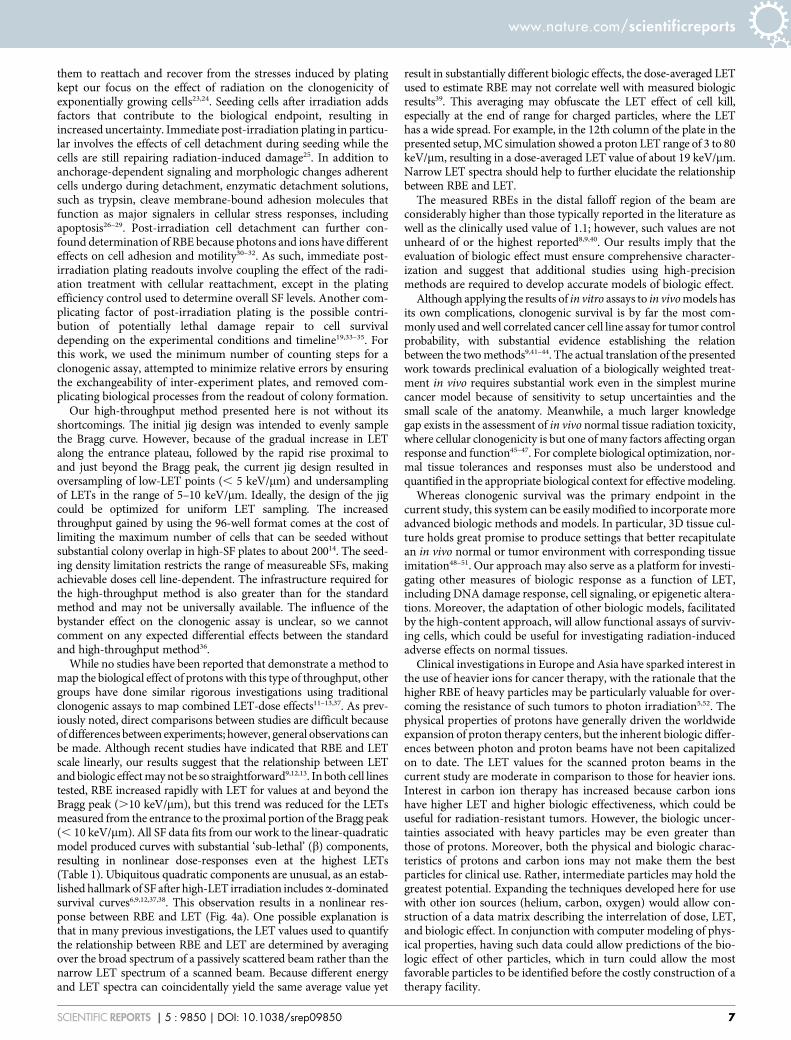
Table 1 | a and b fit parameters and RBE values at 10% surviving fraction.
Cell line:H460 H1437
LET [keV/mm] a b RBE a b RBE
0.9 0.268 0.097 1.03 0.077 0.028 0.891.2 0.226 0.112 1.04 0.136 0.020 0.881.6 0.151 0.134 1.05 0.067 0.027 0.851.8 0.150 0.134 1.05 0.059 0.038 0.981.9 0.166 0.134 1.06 0.094 0.031 0.962.3 0.137 0.146 1.07 0.096 0.032 0.973.0 0.206 0.125 1.07 0.111 0.033 1.025.1 0.117 0.159 1.10 0.034 0.052 1.1010.8 0.318 0.154 1.28 0.119 0.054 1.2615.2 0.446 0.341 1.87 0.180 0.095 1.7017.7 0.596 0.662 2.58 0.328 0.149 2.3319.0 0.883 0.956 3.28 0.360 0.272 2.98Photons(137Cs) 0.290 0.083 1.00 0.050 0.041 1.00
Figure 4 | Preliminary analysis of biological assays. (a) RBE vs LET at 10% SF. A nonlinear trend between biological effect and LET was observed for both
cell lines. RBE error was calculated by propagating the standard error of the a and b fits from Fig. 3 (Supplementary Table 1). (b) H460 cells were plated in
glass-bottom 96-well plates, irradiated, and processed 2 hours later for cH2AX foci staining. Representative images are depicted. Comparing wells
exposed to LETs and doses of 4.6 keV/mm, 2.9 Gy and 17.3 keV/mm, 1.7 Gy, the average nuclear foci per Gy was significantly increased in the high-LET
samples (P , 0.0001, Mann-Whitney unpaired t test). Error bars represent the 95% confidence level.
www.nature.com/scientificreports
SCIENTIFIC REPORTS | 5 : 9850 | DOI: 10.1038/srep09850 6
them to reattach and recover from the stresses induced by platingkept our focus on the effect of radiation on the clonogenicity ofexponentially growing cells23,24. Seeding cells after irradiation addsfactors that contribute to the biological endpoint, resulting inincreased uncertainty. Immediate post-irradiation plating in particu-lar involves the effects of cell detachment during seeding while thecells are still repairing radiation-induced damage25. In addition toanchorage-dependent signaling and morphologic changes adherentcells undergo during detachment, enzymatic detachment solutions,such as trypsin, cleave membrane-bound adhesion molecules thatfunction as major signalers in cellular stress responses, includingapoptosis26–29. Post-irradiation cell detachment can further con-found determination of RBE because photons and ions have differenteffects on cell adhesion and motility30–32. As such, immediate post-irradiation plating readouts involve coupling the effect of the radi-ation treatment with cellular reattachment, except in the platingefficiency control used to determine overall SF levels. Another com-plicating factor of post-irradiation plating is the possible contri-bution of potentially lethal damage repair to cell survivaldepending on the experimental conditions and timeline19,33–35. Forthis work, we used the minimum number of counting steps for aclonogenic assay, attempted to minimize relative errors by ensuringthe exchangeability of inter-experiment plates, and removed com-plicating biological processes from the readout of colony formation.
Our high-throughput method presented here is not without itsshortcomings. The initial jig design was intended to evenly samplethe Bragg curve. However, because of the gradual increase in LETalong the entrance plateau, followed by the rapid rise proximal toand just beyond the Bragg peak, the current jig design resulted inoversampling of low-LET points (, 5 keV/mm) and undersamplingof LETs in the range of 5–10 keV/mm. Ideally, the design of the jigcould be optimized for uniform LET sampling. The increasedthroughput gained by using the 96-well format comes at the cost oflimiting the maximum number of cells that can be seeded withoutsubstantial colony overlap in high-SF plates to about 20014. The seed-ing density limitation restricts the range of measureable SFs, makingachievable doses cell line-dependent. The infrastructure required forthe high-throughput method is also greater than for the standardmethod and may not be universally available. The influence of thebystander effect on the clonogenic assay is unclear, so we cannotcomment on any expected differential effects between the standardand high-throughput method36.
While no studies have been reported that demonstrate a method tomap the biological effect of protons with this type of throughput, othergroups have done similar rigorous investigations using traditionalclonogenic assays to map combined LET-dose effects11–13,37. As prev-iously noted, direct comparisons between studies are difficult becauseof differences between experiments; however, general observations canbe made. Although recent studies have indicated that RBE and LETscale linearly, our results suggest that the relationship between LETand biologic effect may not be so straightforward9,12,13. In both cell linestested, RBE increased rapidly with LET for values at and beyond theBragg peak (.10 keV/mm), but this trend was reduced for the LETsmeasured from the entrance to the proximal portion of the Bragg peak(, 10 keV/mm). All SF data fits from our work to the linear-quadraticmodel produced curves with substantial ‘sub-lethal’ (b) components,resulting in nonlinear dose-responses even at the highest LETs(Table 1). Ubiquitous quadratic components are unusual, as an estab-lished hallmark of SF after high-LET irradiation includesa-dominatedsurvival curves6,9,12,37,38. This observation results in a nonlinear res-ponse between RBE and LET (Fig. 4a). One possible explanation isthat in many previous investigations, the LET values used to quantifythe relationship between RBE and LET are determined by averagingover the broad spectrum of a passively scattered beam rather than thenarrow LET spectrum of a scanned beam. Because different energyand LET spectra can coincidentally yield the same average value yet
result in substantially different biologic effects, the dose-averaged LETused to estimate RBE may not correlate well with measured biologicresults39. This averaging may obfuscate the LET effect of cell kill,especially at the end of range for charged particles, where the LEThas a wide spread. For example, in the 12th column of the plate in thepresented setup, MC simulation showed a proton LET range of 3 to 80keV/mm, resulting in a dose-averaged LET value of about 19 keV/mm.Narrow LET spectra should help to further elucidate the relationshipbetween RBE and LET.
The measured RBEs in the distal falloff region of the beam areconsiderably higher than those typically reported in the literature aswell as the clinically used value of 1.1; however, such values are notunheard of or the highest reported8,9,40. Our results imply that theevaluation of biologic effect must ensure comprehensive character-ization and suggest that additional studies using high-precisionmethods are required to develop accurate models of biologic effect.
Although applying the results of in vitro assays to in vivo models hasits own complications, clonogenic survival is by far the most com-monly used and well correlated cancer cell line assay for tumor controlprobability, with substantial evidence establishing the relationbetween the two methods9,41–44. The actual translation of the presentedwork towards preclinical evaluation of a biologically weighted treat-ment in vivo requires substantial work even in the simplest murinecancer model because of sensitivity to setup uncertainties and thesmall scale of the anatomy. Meanwhile, a much larger knowledgegap exists in the assessment of in vivo normal tissue radiation toxicity,where cellular clonogenicity is but one of many factors affecting organresponse and function45–47. For complete biological optimization, nor-mal tissue tolerances and responses must also be understood andquantified in the appropriate biological context for effective modeling.
Whereas clonogenic survival was the primary endpoint in thecurrent study, this system can be easily modified to incorporate moreadvanced biologic methods and models. In particular, 3D tissue cul-ture holds great promise to produce settings that better recapitulatean in vivo normal or tumor environment with corresponding tissueimitation48–51. Our approach may also serve as a platform for investi-gating other measures of biologic response as a function of LET,including DNA damage response, cell signaling, or epigenetic altera-tions. Moreover, the adaptation of other biologic models, facilitatedby the high-content approach, will allow functional assays of surviv-ing cells, which could be useful for investigating radiation-inducedadverse effects on normal tissues.
Clinical investigations in Europe and Asia have sparked interest inthe use of heavier ions for cancer therapy, with the rationale that thehigher RBE of heavy particles may be particularly valuable for over-coming the resistance of such tumors to photon irradiation5,52. Thephysical properties of protons have generally driven the worldwideexpansion of proton therapy centers, but the inherent biologic differ-ences between photon and proton beams have not been capitalizedon to date. The LET values for the scanned proton beams in thecurrent study are moderate in comparison to those for heavier ions.Interest in carbon ion therapy has increased because carbon ionshave higher LET and higher biologic effectiveness, which could beuseful for radiation-resistant tumors. However, the biologic uncer-tainties associated with heavy particles may be even greater thanthose of protons. Moreover, both the physical and biologic charac-teristics of protons and carbon ions may not make them the bestparticles for clinical use. Rather, intermediate particles may hold thegreatest potential. Expanding the techniques developed here for usewith other ion sources (helium, carbon, oxygen) would allow con-struction of a data matrix describing the interrelation of dose, LET,and biologic effect. In conjunction with computer modeling of phys-ical properties, having such data could allow predictions of the bio-logic effect of other particles, which in turn could allow the mostfavorable particles to be identified before the costly construction of atherapy facility.
www.nature.com/scientificreports
SCIENTIFIC REPORTS | 5 : 9850 | DOI: 10.1038/srep09850 7
ConclusionCurrently, in proton treatment planning, variable biological effec-tiveness is not formally accounted for; only physical properties areconsidered. Newer delivery technologies, such as spot scanning,allow the delivery of individually heterogeneous treatment fields byusing techniques such as IMPT. In principle, optimization of IMPTcould incorporate variable biological effectiveness to produce dosedistributions in which protons with high biological effectivenesspreferentially deposit dose in the tumor and the ones that passthrough normal tissues are preferentially of low biological effective-ness. However, the substantial uncertainties associated with existingRBE data may preclude the development of accurate biologic modelsfor use in such applications. By incorporating data generated usingsystems such as that described here, development of more accuratemodels and optimization of IMPT based on RBE may be feasible. Intheory, this could enhance the therapeutic potential of particle ther-apy for numerous types of cancer.
MethodsDesigning an irradiation device with Monte Carlo simulation. We used acalibrated and experimentally validated MC system based on the Geant4 toolkit todesign the experimental device53,54. Three versions of Geant4 (9.5.p02, 10.0 and 10.1),with the pre-packaged FTFP_BERT (version 1.3 and 2.0) physics list, were tested andno differences were found for therapeutic proton simulations. The characteristicsof proton beams entering the nozzle (e.g., energy, angular, and spatial spread) werefine-tuned so that the computed depth dose and beamlet profiles matched thecorresponding measured data55. The thickness of each step of the irradiation jig(Fig. 1f) was selected from a 79.7-MeV spot-scanning beam depth-dose and depth-LET distribution curves in a Lucite phantom. The device was fabricated with a high-accuracy (63 mm) milling machine. The original template was a cuboid block(21319311 cm3) of Lucite.
Monte Carlo Dose and LET calculations in biological samples. A 5-mm cell layer ineach well in the 96-well plate was considered to be the target for dose and LETcalculations. Biologic effect is commonly assumed to be a function of dose-averagedLET (LETd), which was the case in this report as well. The number of primary sourceprotons was set to 1.1x10⁹ to ensure that the statistical uncertainty in the calculateddose and LET values in the wells was 6,1%. LET was calculated on a step-by-stepbasis in the particle tracking process. The energy deposition e over each proton step lwithin the cell layer was scored. Because of the stochastic nature of energy depositionby ionizing radiations, e/l was treated as a random variable form of LET. Theprobability distribution of e/l was scored during the simulation to evaluate thestatistical uncertainty of LET calculation. In calculating LETd, e was treated as thedose weighting factor of each e/l of protons for each cell layer. A dynamic MCtechnique was used to simulate magnetic steering of the proton beamlet56. All MCsimulations were carried out on our institutional high-performance computingcluster and the Lonestar cluster at the Texas Advanced Computational Center.
Comparison of energy spectra for matching scattered and scanned proton beams.To illustrate the importance of using the scanning beam in contrast with the previouspractice of using passively scattered beams, we selected a passively scattered beam of120 MeV, which was broadened laterally with scatterers to form an 18 3 18 cm2 fieldand modulated longitudinally by a range modulation wheel to form an SOBP 3 cmwide. Finally, the beam was passed through the range shifter to achieve a range equalto that of the 79.7-MeV spot-scanning beam that we used for the biology experiments.Three points at depths of 2.15 cm, 4.0 cm, and 4.75 cm (positions A, B and C inFig. 1a–c and Supplementary Fig. 1) along the beam path were selected to calculateand compare the proton kinetic energy spectra.
Hitachi proton therapy system. Proton irradiation was done with the scanning beamgantry of the synchrotron and the Hitachi ProBeat delivery system (Hitachi, Ltd.,Tokyo, Japan) at the Proton Therapy Center in Houston57. This delivery system canprovide 94 discrete energies ranging from 72.5 MeV to 221.8 MeV55,58. It uses a step-and-shoot scanning technique in which the beamlet stops at a specified point anddelivers the specified number of monitor units and then moves to the next position.
Beam characteristics and scan patterns. The above-mentioned monoenergeticscanning beam of 79.7 MeV (range 4.8 cm in water and 4.1 cm in Lucite), with a spotof size 3.3 cm full-width-at-half-maximum in air at isocenter, was used for protonirradiation55. A 20 3 20 cm2 area was scanned uniformly. It had a 12 3 13 cm2
uniform high-dose region to ensure the wells in the plate periphery were sufficientlyfar from the penumbra to be affected by the lateral fall-off at the field edges(Fig. 2a&b). The spacing between spots was set to 1 cm in the isocenter plane. The spotintensity can be set to between 0.005 and 0.04 monitor units; we chose the maximumvalue for this study.
We used the rotational gantry with beam incident upon the bottom of the platefrom below to minimize uncertainties arising from variability in the thickness of the
fluid layer above the cells, setup, and scattering from well walls. Different incidentdose levels were achieved by using multiple repaintings of the target plates with thescan patterns. The incident dose per repainting is determined through a calibrationprocess described below. The relative dose levels per column in the 96-well plate werealways maintained (Fig. 1e) to be the same for all irradiation experiments.
System calibration and verification. We calibrated the system by using a calibratedplane-parallel ion chamber irradiated under reference conditions that excluded thejig. The dose at the calibrated chamber position under identical conditions was alsocalculated by MC simulations. The doses calculated in wells by MC simulations werenormalized to the dose at the reference point. The calibration factor determined inthis way led to the delivery of 2.6 cGy 6 0.1% per painting (requiring 17.64 monitorunits) to the cell layer in column 1 in the presence of the jig. Each time before a set ofcell irradiation experiments were done, quality assurance was done to ensure that thespecified dose levels would be delivered.
Positioning of the experimental devices. The geometric setting of the devices andsamples was identical for all experiments. The jig, with the three films on top of it, isinserted into a holder, which is placed in the last downstream snout slot. The snoutend was set to the same value, 9.1 6 0.1 cm, for each irradiation, such that the top ofthe jig, where the biologic samples sit, was positioned at the isocenter plane (verifiedby laser cross markers from two orthogonal directions).
Sensitivity analysis of experimental setup uncertainties. The Lucite jig, three EBT3films, and well plate bottom constitute the energy-attenuating components forprotons before the cell layer. Hence, the MC-calculated accuracy of the delivered doseand LET values depends on the thickness, chemical composition, and density of thesematerials, especially for wells located near the end of the beam’s range.
Notably, given the geometry we use and the uniformity of the field of irradiation,the accuracy of the dose delivered to the samples is insensitive to small changes inposition longitudinally or laterally relative to the beam. It is almost entirely a functionof precision of the thicknesses of the jig steps, well plate, films, and the accuracy of theknowledge the material densities and compositions. Because we used the same jig andfilms for all experiments, they do not contribute to random uncertainties, but theymay contribute to systematic uncertainties. However, since the jig was fabricated witha high-accuracy milling machine and the vendor-quoted uncertainty in film thicknessis very small (Supplementary Table 2), the overall systematic uncertainty in dose wasestimated to be negligible. However, the scattering properties of the jig were verifiedby measuring the dose and range of the transmitted beam using with films and ionchamber and comparing the results with MC simulations.
Because large numbers of plates were used, manufacturing variability in thethickness of the well bottom and its composition could contribute non-negligibleuncertainty to dose in the high-gradient distal fall-off region. The chamber and MCsimulations each contributed less than 61% to uncertainty.
Parameters used for estimating uncertainties are given in Supplementary Table 2.The nominal density of the jig material and 96-well plate material was set to 1.19 and1.09 g/cm3 59,60. The estimated uncertainties, dominated by the random component,are given in Supplementary Table 3. The highest uncertainties correspond to the high-dose gradient at the distal edge.
The MC-calculated dose and LET using the nominal value were treated as the meanvalues (Fig. 1e). The average deviation from the nominal with lower and upper rangesof setups was treated as the uncertainty in the nominal value to yield the uncertaintyin dose and LET values (error bars in Fig. 1e, Supplementary Table 3). The effect ofuncertainties on protons energy spectra in three of the columns of the 96-well plateare depicted in Supplementary Fig. 2.
Biologic sample preparation, irradiation, and processing. H460 and H1437NSCLC cells were cultured in RPMI 1640 medium with 10% fetal bovine serum and1% penicillin-streptomycin-L-glutamine at 37uC and 5% CO2. Cells were countedusing an automated cell counter and seeded at concentrations ranging from 100–2000cells per well for the standard 6-well clonogenic assay and at 100 cells per well whenusing the 96-well format. Plating reproducibility was ensured by using a BioTekMultiFlo FX Microplate Dispenser for automated and rapid cell plating. Cells wereallowed to attach and stabilize in culture for 8–10 hours before irradiation. Plates werebrought into the treatment room one at a time for irradiation and immediatelyreturned to culture after exposure. Control plates were handled identically totreatment plates but not irradiated. Two plates per dose level were irradiated,resulting in 16 replicates per LET-dose combination. After colonies formed (at 5 daysfor the H460 cells and 7 days for H1437 cells), cells were fixed and stained with 0.5%crystal violet in methanol. High-content automated laser confocal analysis with an INCell Analyzer 6000 was used to identify viable colonies containing $50 cells. Briefly,using a 4 3 objective, four overlapping fields per well were obtained and the GEDeveloper v1.9 software used to create a composite. Colonies and cells were identifiedwith masks generated from object filters. Cells were linked to colonies, and onlycolonies containing 50 or more cells were scored. The excitation wavelength was 640nm (red) and the emission wavelength was 706 nm (Cy5). The 4 3 lens has a 0.20numerical aperture. The IN Cell uses a 5.5-Mp sCMOS camera (2560 3 2160 pixels)with a 6.5-mm pixel size. We defined the limit of detection for a clonogenic screenassay as 1 colony per well or an SF of 1/(cells plated*plating efficiency). Dose levelswhere the aggregate SF was lower than the limit were omitted from analysis. SFs wereanalyzed by normalizing the number of counted colonies at a given dose by the plating
www.nature.com/scientificreports
SCIENTIFIC REPORTS | 5 : 9850 | DOI: 10.1038/srep09850 8
efficiency and by fitting the obtained data to a linear-quadratic model using weightednon-linear regression.
Dose-LET-dependent cH2AX foci formation after proton irradiation was exam-ined by plating cells into a glass-bottom microplate, irradiating them using the high-throughput system, and returning to culture. Two hours after irradiation, cells werefixed with 4% paraformaldehyde in phosphate buffered saline (PBS). The fixative wasremoved and cells were washed in PBS 3 times before permeabilization with 0.5%Triton X-100/PBS. Permeabilized cells were then blocked with a 5% goat serum/0.3%Triton X-100/PBS solution. For primary labeling, the cells were incubated with amurine cH2AX antibody (1:1000, clone JBW301, EMD Millipore) in 1% bovineserum albumin (BSA)/0.1% Triton X-100/PBS. Cells were then washed 3 times with0.1% Triton X-100/PBS and incubated with AlexaFluor 488-labeled goat anti-mouseantibody in 1% BSA/0.1% Triton X-100/PBS (1:1000, Life Technologies). The cellswere washed again with 0.1% Triton X-100/PBS before mounting medium was addedwith the fluorescent dye 4’,6-diamidino-2-phenylindole (DAPI). Plates were imagedon an Olympus IX81 microscope using a 40x water immersion objective. The averagenumber of cH2AX foci per nucleus was determined by using CellProfiler (BroadInstitute) to identify DAPI-labeled nuclei as image masks and quantify the number ofassociated cH2AX foci. Images having the same average and median number of fociper nucleus matching the respective condition’s overall pooled value were selected asthe representative images.
Statistical analyses. Statistical analyses were done using GraphPad Prism 6.0. SF dataare shown on a semilog scale as mean 6 standard error of the mean. Data were fitusing a weighted (1/Y)-nonlinear regression to the linear-quadratic model. The extrasum-of-squares F test was used to compare clonogenic survival curves as a function ofLET. The cH2AX foci data are shown as mean 695% confidence interval. Theaverage numbers of cH2AX foci for each condition were tested for statisticalsignificance by the Mann-Whitney unpaired t test. RBE standard deviations werecalculated by propagating the standard error of the a and b fits.
1. Schulz-Ertner, D. & Tsujii, H. Particle radiation therapy using proton and heavierion beams. J Clin Oncol 25, 953–964, doi:10.1200/JCO.2006.09.7816 (2007).
2. Allen, A. M. et al. An evidence based review of proton beam therapy: the report ofASTRO’s emerging technology committee. Radiother Oncol 103, 8–11,doi:10.1016/j.radonc.2012.02.001 (2012).
3. Wedenberg, M. & Toma-Dasu, I. Disregarding RBE variation in treatment plancomparison may lead to bias in favor of proton plans. Med Phys 41, 091706,doi:10.1118/1.4892930 (2014).
4. Halperin, E. C. Particle therapy and treatment of cancer. Lancet Oncol 7, 676–685,doi:10.1016/s1470-2045(06)70795-1 (2006).
5. Combs, S. E. et al. Comparison of carbon ion radiotherapy to photon radiationalone or in combination with temozolomide in patients with high-grade gliomas:explorative hypothesis-generating retrospective analysis. Radiother Oncol 108,132–135, doi:10.1016/j.radonc.2013.06.026 (2013).
6. Schardt, D., Elsaesser, T. & Schulz-Ertner, D. Heavy-ion tumor therapy: Physicaland radiobiological benefits. Reviews of Modern Physics 82 doi:10.1103/RevModPhys.82.383 (2010).
7. Burigo, L., Pshenichnov, I., Mishustin, I. & Bleicher, M. Comparative study of RBEand cell survival fractions for 1H, 4He, 12C and 16O beams using Geant4 andMicrodosimetric Kinetic model. arXiv preprint arXiv;1403.7929 (2014).
8. Paganetti, H. et al. Relative biological effectiveness (RBE) values for proton beamtherapy. Int J Radiat Oncol Biol Phys. 53, 407–421. (2002).
9. Paganetti, H. Relative biological effectiveness (RBE) values for proton beamtherapy. Variations as a function of biological endpoint, dose, and linear energytransfer. Phys Med Biol 59, R419–472, doi:10.1088/0031-9155/59/22/R419(2014).
10. Britten, R. A. et al. Variations in the RBE for Cell Killing Along the Depth-DoseProfile of a Modulated Proton Therapy Beam. Radiat Res 13, 13 (2012).
11. Calugaru, V. et al. Radiobiological characterization of two therapeutic protonbeams with different initial energy spectra used at the Institut Curie ProtonTherapy Center in Orsay. Int J Radiat Oncol Biol Phys 81, 1136–1143,doi:10.1016/j.ijrobp.2010.09.003 (2011).
12. Chaudhary, P. et al. Relative Biological Effectiveness Variation AlongMonoenergetic and Modulated Bragg Peaks of a 62-MeV Therapeutic ProtonBeam: A Preclinical Assessment. Int J Radiat Oncol Biol Phys, doi:10.1016/j.ijrobp.2014.05.010 (2014).
13. Britten, R. A. et al. Variations in the RBE for cell killing along the depth-doseprofile of a modulated proton therapy beam. Radiat Res 179, 21–28, doi:10.1667/RR2737.1 (2013).
14. Lin, S. H. et al. A high content clonogenic survival drug screen identifies mekinhibitors as potent radiation sensitizers for KRAS mutant non-small-cell lungcancer. J Thorac Oncol 9, 965–973, doi:10.1097/JTO.0000000000000199 (2014).
15. Lee, S. J., Lee, H. J. & Moon, D. H. Quantitative analysis of thymidine kinase 1 and5’(3’)-deoxyribonucleotidase mRNA expression: the role of fluorothymidineuptake. Anticancer Res 31, 2135–2139 (2011).
16. Carmichael, J., DeGraff, W. G., Gazdar, A. F., Minna, J. D. & Mitchell, J. B.Evaluation of a tetrazolium-based semiautomated colorimetric assay: assessmentof chemosensitivity testing. Cancer Res 47, 936–942 (1987).
17. Lai, S. L., Perng, R. P. & Hwang, J. p53 gene status modulates the chemosensitivityof non-small cell lung cancer cells. J Biomed Sci 7, 64–70, doi:25431 (2000).
18. Puck, T. T. & Marcus, P. I. Action of x-rays on mammalian cells. J Exp Med 103,653–666 (1956).
19. Franken, N. A., Rodermond, H. M., Stap, J., Haveman, J. & van Bree, C.Clonogenic assay of cells in vitro. Nat Protoc 1, 2315-2319, doi:10.1038/nprot.2006.339 (2006).
20. Chamberlain, A. C. & Turner, F. M. Errors and Variations in White-Cell Counts.Biometrics 8, 55–65, doi:10.2307/3001526 (1952).
21. Willen, E. A simplified method of phytoplankton counting. British PhycologicalJournal 11, 265–278, doi:10.1080/00071617600650551 (1976).
22. Gerweck, L. E., Dullea, R., Zaidi, S. T., Budach, W. & Hartford, A. Influence ofexperimental factors on intrinsic radiosensitivity assays at low doses of radiation:cell multiplicity. Radiat Res 138, 361–366 (1994).
23. Voger, E. A. & Bussian, R. W. Short-term cell-attachment rates: a surface-sensitivetest of cell-substrate compatibility. J Biomed Mater Res 21, 1197–1211,doi:10.1002/jbm.820211004 (1987).
24. Twentyman, P. R. Timing of assays: an important consideration in thedetermination of clonogenic cell survival both in vitro and in vivo. Int J RadiatOncol Biol Phys 5, 1213–1220 (1979).
25. Wu, R. C. & Schonthal, A. H. Activation of p53-p21waf1 pathway in response todisruption of cell-matrix interactions. J Biol Chem 272, 29091–29098 (1997).
26. Lewis, J. M., Truong, T. N. & Schwartz, M. A. Integrins regulate the apoptoticresponse to DNA damage through modulation of p53. Proc Natl Acad Sci U S A99, 3627–3632, doi:10.1073/pnas.062698499 (2002).
27. Kang, M. A., So, E. Y. & Ouchi, T. Deregulation of DNA damage response pathwayby intercellular contact. J Biol Chem 287, 16246–16255, doi:10.1074/jbc.M111.337212 (2012).
28. Kapiszewska, M., Reddy, N. M. & Lange, C. S. Trypsin-induced changes in cellshape and chromatin structure result in radiosensitization of monolayer Chinesehamster V79 cells. Int J Radiat Biol 60, 635–646 (1991).
29. Huang, H. L. et al. Trypsin-induced proteome alteration during cell subculture inmammalian cells. J Biomed Sci 17, 36, doi:10.1186/1423-0127-17-36 (2010).
30. Ogata, T. et al. Particle irradiation suppresses metastatic potential of cancer cells.Cancer Res 65, 113–120 (2005).
31. Akino, Y. et al. Carbon-ion beam irradiation effectively suppresses migration andinvasion of human non-small-cell lung cancer cells. Int J Radiat Oncol Biol Phys75, 475–481, doi:10.1016/j.ijrobp.2008.12.090 (2009).
32. Suetens, A. et al. Dose- and time-dependent gene expression alterations inprostate and colon cancer cells after in vitro exposure to carbon ion and X-irradiation. J Radiat Res, doi:10.1093/jrr/rru070 (2014).
33. van Bree, C. et al. G0 cell cycle arrest alone is insufficient for enabling the repair ofionizing radiation-induced potentially lethal damage. Radiat Res 170, 184–191,doi:10.1667/RR0845.1 (2008).
34. Barendsen, G. W., Van Bree, C. & Franken, N. A. Importance of cell proliferativestate and potentially lethal damage repair on radiation effectiveness: implicationsfor combined tumor treatments (review). Int J Oncol 19, 247–256 (2001).
35. Little, J. B. Factors influencing the repair of potentially lethal radiation damage ingrowth-inhibited human cells. Radiat Res 56, 320–333 (1973).
36. Baskar, R. Emerging role of radiation induced bystander effects: Cellcommunications and carcinogenesis. Genome Integr 1, 13, doi:10.1186/2041-9414-1-13 (2010).
37. Belli, M. et al. Inactivation of human normal and tumour cells irradiated with lowenergy protons. Int J Radiat Biol 76, 831–839 (2000).
38. Belli, M. et al. RBE-LET relationships for cell inactivation and mutation inducedby low energy protons in V79 cells: further results at the LNL facility. Int J RadiatBiol 74, 501–509 (1998).
39. ICRU Report 86, Quantification and Reporting of Low-Dose and otherHeterogeneous Exposures. Journal of the ICRU 11, 51–60 (2011).
40. Petrovic, I. et al. Response of a radioresistant human melanoma cell line along theproton spread-out Bragg peak. Int J Radiat Biol 86, 742–751, doi:10.3109/09553002.2010.481322 (2010).
41. Freedman, V. H. & Shin, S. I. Cellular tumorigenicity in nude mice: correlationwith cell growth in semi-solid medium. Cell 3, 355–359 (1974).
42. Fiebig, H. H., Maier, A. & Burger, A. M. Clonogenic assay with established humantumour xenografts: correlation of in vitro to in vivo activity as a basis foranticancer drug discovery. Eur J Cancer 40, 802–820, doi:10.1016/j.ejca.2004.01.009 (2004).
43. Scholz, C. C., Berger, D. P., Winterhalter, B. R., Henss, H. & Fiebig, H. H.Correlation of drug response in patients and in the clonogenic assay with solidhuman tumour xenografts. Eur J Cancer 26, 901–905 (1990).
44. Fertil, B. & Malaise, E. P. Intrinsic radiosensitivity of human cell lines is correlatedwith radioresponsiveness of human tumors: analysis of 101 published survivalcurves. Int J Radiat Oncol Biol Phys 11, 1699–1707 (1985).
45. Michalowski, A. A critical appraisal of clonogenic survival assays in the evaluationof radiation damage to normal tissues. Radiother Oncol 1, 241–246 (1984).
46. Hall, E. J. & Giaccia, A. J. Radiobiology for the radiologist. 6th edn, (LippincottWilliams & Wilkins, 2006).
47. Wilkens, J. J. & Oelfke, U. Optimization of radiobiological effects in intensitymodulated proton therapy. Med Phys 32, 455–465 (2005).
48. Tibbitt, M. W. & Anseth, K. S. Hydrogels as extracellular matrix mimics for 3D cellculture. Biotechnol Bioeng 103, 655–663, doi:10.1002/bit.22361 (2009).
49. Griffith, L. G. & Swartz, M. A. Capturing complex 3D tissue physiology in vitro.Nat Rev Mol Cell Biol 7, 211–224, doi:10.1038/nrm1858 (2006).
www.nature.com/scientificreports
SCIENTIFIC REPORTS | 5 : 9850 | DOI: 10.1038/srep09850 9
50. Howes, A. L., Richardson, R. D., Finlay, D. & Vuori, K. 3-Dimensional culturesystems for anti-cancer compound profiling and high-throughput screeningreveal increases in EGFR inhibitor-mediated cytotoxicity compared to monolayerculture systems. PLoS One 9, e108283, doi:10.1371/journal.pone.0108283 (2014).
51. Chambers, K. F., Mosaad, E. M., Russell, P. J., Clements, J. A. & Doran, M. R. 3Dcultures of prostate cancer cells cultured in a novel high-throughput cultureplatform are more resistant to chemotherapeutics compared to cells cultured inmonolayer. PLoS One 9, e111029, doi:10.1371/journal.pone.0111029 (2014).
52. Mizoe, J. E. et al. Phase I/II clinical trial of carbon ion radiotherapy for malignantgliomas: combined X-ray radiotherapy, chemotherapy, and carbon ionradiotherapy. Int J Radiat Oncol Biol Phys 69, 390–396, doi:10.1016/j.ijrobp.2007.03.003 (2007).
53. Agostinelli, S. et al. Geant4—a simulation toolkit. Nuclear Instruments andMethods in Physics Research Section A 506, 250–303 (2003).
54. Allison, J. et al. Geant4 developments and applications. IEEE TRANSACTIONSON NUCLEAR SCIENCE 53, 270-278 (2006).
55. Zhu, X. R. et al. Commissioning dose computation models for spot scanningproton beams in water for a commercially available treatment planning system.Med Phys 40, 041723, doi:10.1118/1.4798229 (2013).
56. Paganetti, H. Four-dimensional Monte Carlo simulation of time-dependentgeometries. Phys Med Biol 49, N75-81 (2004).
57. Smith, A. et al. The M. D. Anderson proton therapy system. Med Phys 36,4068–4083 (2009).
58. Gillin, M. T. et al. Commissioning of the discrete spot scanning proton beamdelivery system at the University of Texas M.D. Anderson Cancer Center, ProtonTherapy Center, Houston. Med Phys 37, 154–163 (2010).
59. Haynes, W. M. CRC Handbook of Chemistry and Physics, 95th Edition. (CRCPress, 2014).
60. Berger, M. J., Coursey, J. S., Zucker, M. A. & Chang, J. ESTAR, PSTAR, andASTAR: Computer Programs for Calculating Stopping-Power and Range Tablesfor Electrons, Protons, and Helium Ions (version 1.2.3). [Online] Available: http://physics.nist.gov/Star [2014, July 23]National Institute of Standards andTechnology, Gaithersburg, MD. (2005).
AcknowledgmentsWe thank Mr. Paul Wisdom for fabricating the high-throughput irradiation device, Dr.Narayan Sahoo for aiding in the system calibration and verification, Christine Wogan forher editorial assistance and Dr. Howard Thames for lending his statistical expertise.
Author contributionsF.G. designed the irradiation device, performed and analyzed data from the MonteCarlo experiments, interpreted findings, and wrote the manuscript. L.B. designed,performed, and analyzed findings from all biologic experiments, interpreted resultsand wrote the manuscript. U.T. conceptualized the design of the device, analyzedMonte Carlo computations, and interpreted experimental results. S.H.L. designed thehigh-content clonogenic assay, participated in the conceptual adaption of the jig, andperformed biologic experiments. D.M. conceptualized the design of the device,oversaw Monte Carlo computations, and conducted film irradiation experiments.M.D.K. performed the system calibration and verification, participated in theirradiation of biologic samples, and oversaw sample processing. X.R.Z. participated inthe system calibration and verification and quality assurance of the irradiationexperiments. J.D. participated in the irradiation of biologic samples. M.S. and C.S.developed and refined the high-content system and analyzed results. C.R.P. and R.T.performed and analyzed Monte Carlo calculations and assisted with the generation andmodeling of biologic data. R.M. and D.R.G. defined the original problem and theimportance and strategy for solving; co-supervised the project; participated in thedesign, performance, analyses and interpretation of all experiments; and led thewriting of the manuscript.
Additional informationSupplementary information accompanies this paper at http://www.nature.com/scientificreports
Competing financial interest: The authors declare no competing financial interests.
Grant support: This work was supported in part by Cancer Center Support (Core) GrantCA016672 to The University of Texas MD Anderson Cancer Center.
How to cite this article: Guan, F. et al. Spatial mapping of the biologic effectiveness ofscanned particle beams: towards biologically optimized particle therapy. Sci. Rep. 5, 9850;DOI:10.1038/srep09850 (2015).
This work is licensed under a Creative Commons Attribution 4.0 InternationalLicense. The images or other third party material in this article are included in thearticle’s Creative Commons license, unless indicated otherwise in the credit line; ifthe material is not included under the Creative Commons license, users will needto obtain permission from the license holder in order to reproduce the material. Toview a copy of this license, visit http://creativecommons.org/licenses/by/4.0/
www.nature.com/scientificreports
SCIENTIFIC REPORTS | 5 : 9850 | DOI: 10.1038/srep09850 10