Embed Size (px)
Citation preview

Spatial distribution of heterotrophic bacteria in the northeast Atlantic
(POMME study area) during spring 2001
Melilotus Thyssen,1 Dominique Lefevre,1 Guy Caniaux,2 Josephine Ras,3
Camila I. Fernandez,4 and Michel Denis1
Received 17 August 2004; revised 14 January 2005; accepted 18 May 2005; published 22 July 2005.
[1] Heterotrophic bacteria abundances, total chlorophyll a (Tchla), and nitrateconcentrations were determined during the spring cruise (23 March–13 April 2001) of theProgramme Ocean Multidisciplinaire Meso Echelle (POMME) in the northeastern Atlanticbetween 39.0�–44.5�N and 16.6�–20.6�W. Sampling covered a grid of 81 stationsregularly spaced. Three bacteria subpopulations (HNA1, HNA2, and LNA) were resolvedby flow cytometry on the basis of their nucleic acid content, after staining with SYBRGreen II (molecular probes), and by their scatter properties. The bacterial distribution wasinvestigated down to 600 m depth. HNA2 were essentially observed in the upper 200 mand were not present at all stations. HNA1 dominated in the surface layer and werepositively linked to Tchla. This relationship exhibited some heterogeneity due to thelatitudinal evolution of the phytoplankton bloom and the seasonal thermocline formationalready occurring in the south. In contrast, LNA dominated the bacterial subgroups below100mdepth, and their distribution bore the fingerprint of the geostrophic current field and themesoscale features identified in the study area, i.e., cyclonic and anticyclonic eddies andfrontal structures.
Citation: Thyssen, M., D. Lefevre, G. Caniaux, J. Ras, C. I. Fernandez, and M. Denis (2005), Spatial distribution of heterotrophic
bacteria in the northeast Atlantic (POMME study area) during spring 2001, J. Geophys. Res., 110, C07S16,
doi:10.1029/2004JC002670.
1. Introduction
[2] Bacterial community in the open ocean plays animportant role in the carbon cycle by partially controllingthe flux of CO2 and its sequestration in deep waters throughthe demineralization of organic matter in the upper layer[Cho and Azam, 1988]. Indeed, bacteria have a great abilityto respond to increases of primary production rates byraising their bacterial growth efficiency [Gonzales et al.,2003]. As a consequence, on a small scale, bacterialdistribution and community structure are tightly linked todissolved organic matter availability [Long and Azam,2001]. The bacteria abundance is controlled by grazingpressure [Jurgens et al., 2000], temperature, pressure, hydro-dynamism and bottom-up control [Dufour and Torreton,1996; Billen et al., 1990]. There is competition with phyto-plankton for ammonia and phosphate in oligotrophic waters[Wheeler and Kirchman, 1998; Kirchman and Wheeler,1998].
[3] On a larger scale, heterotrophic bacteria biomass isthe most constant parameter observed in the oceans withrespect to the other heterotrophic and autotrophic groups [Liand Harrison, 2001], even if their abundance may vary withtemperature [Hoppe et al., 2002]. Bacteria community mayrepresent the main stock of carbon and nitrogen in theoceans [Fuhrman et al., 1989], and can exceed the autotro-phic biomass [Fuhrman, 1992]. Two main subgroups wereusually discriminated through flow cytometry analysis: highnucleic acid (HNA) and low nucleic acid (LNA) cells.Gasol et al. [1999] and Lebaron et al. [2001] observed thatthese two groups correspond to more and less active cellsrespectively. However, the situation might not be so clear-cut since, in different studies, some LNAwere found viable[Gregori et al., 2003] and able to divide twice as fast asHNA [Zubkov et al., 2001]. Jochem et al. [2004] showedthat LNA could be considered as an integral part of themicrobial food web, so that their contribution to productionand demineralization may be underestimated. Zubkov et al.[2001] observed as well a difference in the vertical distri-bution of these two bacterial subgroups, with a dominanceof LNA below the mixed layer depth.[4] Thus the determination of the bacteria community
structure through DNA content, abundance, spatial distri-bution is of importance when addressing their ecologicaland biological implication that can be assessed by flowcytometry [Li et al., 1995; Gasol et al., 1999; Troussellier etal., 1999; Lebaron et al., 2001; Zubkov et al., 2001; Gregoriet al., 2003].
JOURNAL OF GEOPHYSICAL RESEARCH, VOL. 110, C07S16, doi:10.1029/2004JC002670, 2005
1Centre d’Oceanologie de Marseille, Laboratoire de Microbiologie,Geochimie et Ecologie Marines, Centre National de la RechercheScientifique, UMR 6117, Universite de la Mediterranee, Marseille, France.
2Centre National de Recherche Meteorologique, Toulouse, France.3Laboratoire d’Oceanographie de Villefranche, Villefranche-sur-Mer,
France.4Centre d’Oceanologie de Marseille, Laboratoire d’Oceanographie et de
Biogeochimie, Marseille, France.
Copyright 2005 by the American Geophysical Union.0148-0227/05/2004JC002670$09.00
C07S16 1 of 16

[5] The winter mixed layer depth defined as the perma-nent thermocline, is of crucial importance in areas wherenutrients are depleted, the spring bloom intensity beingconditioned by the subsequent surface layer enrichmenttogether with the seasonal thermocline formation [Dutkiewiczet al., 2001; Siegel et al., 2002]. By advecting or convectingwatermasses [McGillicuddy andRobinson, 1997;Martin andRichards, 2001], mesoscale features contribute to changes inthe ocean biogeochemistry and in particular to the nutrientenrichment of the upper layer [Jenkins, 1988]. One of thebiological responses to these features results in a patchinessdistribution of the phytoplanktonic community [Martin,2003] that is well observed when using remote sensing. Thebacterial distribution is less documented due to the lack ofsampling at a mesoscale level and the use of flowcytometry is critical to achieve it due to its fast rateanalysis and easy use.[6] Oceanic circulation is likely to have a lasting impact
on bacteria rather than phytoplankton whose growth will behampered by the turbulence and the subsequent reduction ofexposure to light [Martin et al., 2001]. One of the objectivesof the Programme Ocean Multidisciplinaire Meso Echelle(POMME) spring cruise was to investigate the occurrenceof the spring bloom in connection with the mesoscalehydrodynamic features and the subducted waters. Eddiespresent in the study area were supposed to make thesubduction heterogeneous or enhancing it, and affect thespring bloom.
[7] In the present paper, we report on the spatial distri-bution of the bacterial community in the POMME studyarea, taking into account its hydrodynamic features. Datawere analyzed to establish to which extent the bacterialdistribution was mainly explained by the potential nutri-tional pool (Tchla and nitrate) or by the physical constraintssuch as geostrophic currents and mesoscale features. Resultsprovide evidence of the occurrence of both situations in thestudy area during spring 2001.
2. Materials and Methods
2.1. Study Area and Sample Collection
[8] In spring 2001, from 23 March to 13 April, thePOMME spring cruise on R/V L’Atalante, a contributionto the French POMME program, sampled a part of thePOMME study area located in the northeastern AtlanticOcean (Figure 1a), between 39.0�–44.5�N and 16.6�–20.6�W. Eighty one stations were occupied along sevennorth-south transects regularly spaced (0.7� of longitude(Figure 1b)). Each transect was defined by 12 stationsspaced by 0.7� of latitude, station 1 being located at16.6�E, 39.0�N. The sequence of the visited stations wassuch that the closest stations of a given one were occupiedin a time interval of less than 5 days.[9] Seawater samples were collected using a conductivity-
temperature-depth (CTD) probe (Seabird1 SBE 9) equippedwith an oxygen sensor (Seabird SBE 13) and a fluorometer
Figure 1. (a) Location of the study area in the northeastern Atlantic Ocean. (b) Stations occupied duringleg 1 of the 2001 Programme Ocean Multidisciplinaire Meso Echelle (POMME) spring cruise (23March–13 April), numbered in the order of their sampling. Labeled mesoscale features: A1 and A2,anticyclonic gyre; C4, cyclonic gyre. The study area was subdivided into six regions to minimize thenonsynopticity of the sampling when considering the relationships between bacteria, Tchla, and nitrate.
C07S16 THYSSEN ET AL.: BACTERIA IN THE NE ATLANTIC OCEAN
2 of 16
C07S16

(Seatech1) and mounted on a rosette of 21 Niskin bottles(12 dm3). For bacteria analysis by flow cytometry,seawater was sampled at 14 depths between 0 and 600 m.
2.2. Flow Cytometry
[10] Prefiltered (100 mm mesh size net) seawater sampleswere preserved with 2% paraformaldehyde [Troussellier etal., 1999] frozen onboard and stored in liquid nitrogen.Back in the laboratory, samples were thawed at roomtemperature and analyzed with a flow cytometer (CytoronAbsolute, ORTHO Diagnostic Systems) equipped with anair-cooled 488 nm argon laser. The sample and sheath rateswere 1 and 100 mm3 s�1 respectively.[11] For each cell, five optical parameters were recorded:
two diffraction parameters, namely forward angle scatter(related to the particle size) and right angle scatter (relatedto cell structure), and three fluorescence parameters measur-ing emissions in the red (�620 nm), orange (565–592 nm)and green (515–530 nm) wavelength ranges. Data werecollected and stored in list mode with the IMMUNOCOUNTsoftware (ORTHO Diagnostic Systems). This software pro-vides directly the cell concentration (cells mm�3) of theresolved subpopulations. Cluster analyses were run withWINLIST software (VERITY1 Software House).[12] Bacteria that required staining of their nucleic acids
to become fluorescent upon the 488 nm laser excitationwere labeled heterotrophic bacteria even though some ofthem might be photoheterotrophic [Kolber et al., 2000,2001]. This labeling was of common use until the recentdiscovery of this new component of the bacterial commu-nity and keeping its use makes easier comparisons withprevious works. For the staining of the bacteria nucleicacids, 1 cm3 seawater subsamples were supplemented with10 mm3 SybrGreen II (from the Molecular Probes1 solutiondiluted 1/5000 in final solution) and incubated 15 min in thedark before analysis. Counting reproducibility was betterthan 3.7% (CV, n = 23) over a range of concentrationextending one order of magnitude [Gregori et al., 2001].Flow cytometry does not give access to species identifica-tion (except in the case of in situ hybridization) and thesubpopulations resolved by flow cytometry may be com-posed of several species [Zubkov et al., 2001]. There is noreference to species in our work and the observed changesin the analyzed subpopulations properties may either occurwithin the same species or derive from changes in speciescomposition or both.
2.3. Total Chlorophyll a
[13] A volume of 2.7 dm3 of seawater was filtered on GF/F filters that where stored in liquid nitrogen for laboratoryanalysis. Total chlorophyll a (Tchla = chlorophyll a +divynil chlorophyll a + chlorophyllid a) was extracted with3 cm3 methanol and analyzed by high performance liquidchromatography (Agilent 1100 HPLC) which was config-ured to a reverse phase C8 Hypersil MOS column (dimen-sions: 3 � 100 mm, 3 mm pore size) and ThermoquestAS3000 autosampler [see Claustre et al., 2004]. Thedetection limit was 0.001 mg m�3.
2.4. Nitrate
[14] Samples for nitrate (NO3) analysis were collectedinto 20 cm3 polyethylene bottles that were prerinsed with
10% hydrochloric acid. Samples were analyzed immediatelyusing a Technicon1Auto Analyzer according to Treguer andLeCorre [1975].Nitrate detection limit was 0.050 mMwith anerror estimated at 0.040 mM.
2.5. Mixed and Euphotic Layer Depths andMesoscale Features
[15] The euphotic layer depth (ELD) was calculated fromTchla profiles using the model developed by Morel andMaritorena [2001] where Tchla content in the water columnwas obtained by integrating chl a over depth. ELD valueswere further refined through an iterative process describedby Morel and Berthon [1989]. The mixed layer depth(MLD) was derived from the depth where the verticaldensity difference with surface exceeded 0.02 kg m�3.[16] In order to study the impact of physical mesoscale
features on bacteria spatial distribution, geostrophic currentfields were used. CTD, expendable bathythermograph(XBT), and expandable conductivity-temperature-depth(XCTD) data sets were used in order to produce high-resolution temperature and salinity analyses which wereinterpolated vertically onto 65 vertical levels (5 m near thesurface and 300 m at depth) and then objectively analyzedonto a 5 km horizontal grid for all vertical levels. The firstguess of the analyses was derived from the temperature andsalinity [Levitus and Boyer, 1994; Levitus et al., 1994]climatology. At each point of the grid, the climatologywas corrected, following the procedure of de Mey andMenard [1989]. From these analyses, currents were com-puted at each level through the geostrophic approximationby using a level of no motion located near 1400 dbar as wasdone by Stramma [1984]. A detailed description of thisprocedure is described in a former article in the frame of thePOMME experiment [Fernandez et al., 2005a].
2.6. Multiple Correspondence Analysis
[17] The variability of the bacteria subpopulation distri-bution over the study area was investigated using a multicorrespondence analysis (MCA) [Benzecri, 1980;Greenacre,1984] under R package [Ihaka and Gentleman, 1996] (http://www.r-project.org). The MCA is a weighted principal com-ponent analysis of a contingency table based on the chi-squaredistance between categories of each variable. Thus itsummarizes relationships between quantitative data thatare qualitatively transformed through categorization, anddisplays them graphically in a space that has as fewdimension as possible.
3. Results
3.1. Hydrodynamical Situation
[18] A full description of physical features and hydrolog-ical properties of the investigated area is provided in thepresent issue [Assenbaum and Reverdin, 2005; Le Cann etal., 2005; Fernandez et al., 2005a].[19] Three main eddies (Figure 1b) were identified: a cold
core cyclonic eddy (C4, 42�N–19.5�W), a cold core anti-cyclonic eddy (A1, 43�N–18�W) and a warm core anticy-clonic eddy (A2, 40�N–19.5�W [see also Fernandez et al.,2005a]). Two frontal systems set the transition between thenorthern and southern areas [Fernandez et al., 2005a;Memery et al., 2005]. One was located between A2 and
C07S16 THYSSEN ET AL.: BACTERIA IN THE NE ATLANTIC OCEAN
3 of 16
C07S16

C4 on the western side of the study area whereas the otherwas positioned at about 41�N on the eastern side andcharacterized by the deepening of the 26.9 kg m�3 iso-pycnal. The area north of this front exhibited colder waters(sea surface temperature of about 13.5�C), high nitrateconcentrations [Fernandez et al., 2005a], and a deep mixedlayer (78 ± 54 m mean). In contrast, the area south of thisfront had a sea surface temperature reaching 16�C, nitrateconcentrations at the limit of detection, and stratified waterswith a shallow mixed layer (31 ± 24 m mean).
3.2. Bacterial Subpopulations
[20] The flow cytometry analyses distinguished threebacterial subpopulations on the basis of their nucleic acidstaining and side scatter signals. These subpopulations werelabeled LNA, HNA1 and HNA2 from their low and highnucleic acid contents respectively (Figure 2a). HNA1 andLNA reached maximal abundance values of 8.5 and 10.6 �105 cells cm�3 in surface waters respectively. HNA2bacteria were not present at every station and were essen-tially observed in surface waters. They exhibited highergreen fluorescence and higher side scatter signals thanHNA1 bacteria. HNA2 reached mean abundance values of3.8 104 ± 4.1 � 104 cells cm�3 with a maximal value of 3 �105 cells cm�3.[21] The overlapping of stained Prochlorococcus in the
green fluorescence versus side scatter cytograms wasaccounted for by using the red fluorescence that distin-guishes Prochlorococcus from heterotrophic bacteria asdefined here above (Figure 2b) [Sieracki et al., 1995].
3.3. Biological Impact on Bacterial Distribution
[22] The nonsynopticity of the sampling may inducesome confusion between the temporal shift of the phyto-plankton bloom and the bacterial development, generating
difficulties in interpreting the bacterial abundance distribu-tion. The study area was thus divided into six regions(Figure 1b) as a compromise between the nonsynopticityof the sampling and the latitudinal differences in hydrolog-ical and biological parameters. The Tchla, nitrate andbacteria integrate values were calculated over 300 m depth,corresponding to the limit of the Tchla sampling. Indeed,some low Tchla concentrations (<0.045 mg Chl a m�3)were observed at this depth at stations 12, 14, 17, 18, 24,and 77.[23] Areas 1 and 2 correspond to the northwest and north-
east parts of the grid (Figure 1b). Their main characteristicswere deep MLDs, high nutrient concentration (2140 ±242mmolNO3m
�2 (Figure 3b)), low sea surface temperature(�13�C), shallow isopycnal (26.9 kg m�3 at 73 m) and Tchlaintegrated values of 48.5 ± 10.7 mg Chl a m�2 (Figure 3a).The maximum average bacterial integrated abundance valueswere observed in this area (Table 1), with no significantdifference between area 1 and area 2 (Table 2). Area 3 waslocated at the western side of the central study area and wascharacterized by significantly (t test, p < 0.05) higher nutrientand lower Tchla contents: 2387 ± 601 mmol. NO3 m
�2 (t =1.98, n = 14) and 39.5 ± 8.6 mg Chl a m�2 (t = 2.54, n = 15)respectively as compared to 1986 ± 368 mmol. NO3 m
�2 (n =8) and 58.6 ± 7.65 mg Chl am�2 (n = 10), in the eastern siderespectively (Figures 3a and 3b). Area 4, situated in theeastern side of the central study area (41�–43�N), wasdelimited to the west by a longitudinal jet flowingbetween A1 and C4 [Fernandez et al., 2005a] and pre-sented the highest values of Tchla, up to 115 mg Chl a m�2
(station 39), near the frontal zone (�41.5�N (Figure 3a)).Bacteria were not significantly more abundant in area 4(Table 1) than in area 3 (Table 2); the observed smalldifference was mostly due to LNA that were significantlymore abundant in the area 4 (Tables 1 and 2). Area 5 included
Figure 2. (a) Green fluorescence (arbitrary units) versus side scatter (SWS, arbitrary units) cytogram.(b) Red versus green fluorescence cytogram. Prochlorococcus cells were subtracted from bacterial countsin Figure 2a by using their red fluorescence shown in Figure 2b.
C07S16 THYSSEN ET AL.: BACTERIA IN THE NE ATLANTIC OCEAN
4 of 16
C07S16
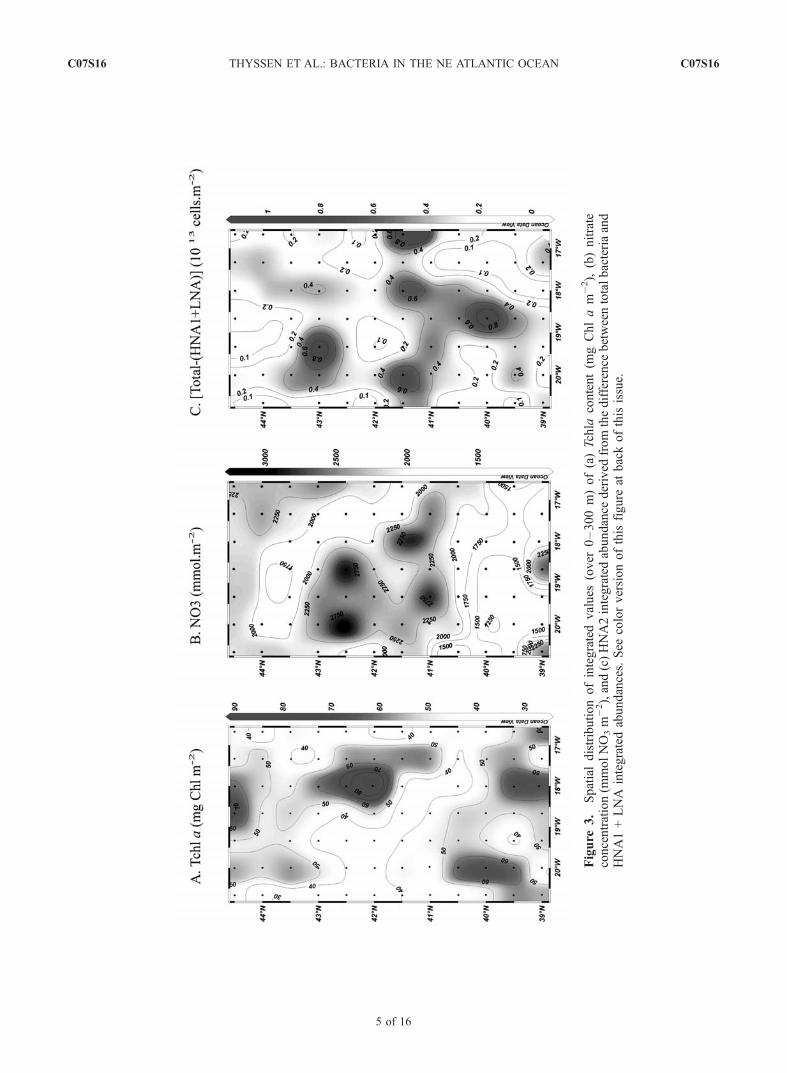
Figure
3.
Spatialdistributionofintegratedvalues
(over
0–300m)of(a)Tchla
content(m
gChlam
�2),
(b)nitrate
concentration(m
molNO3m
�2),and(c)HNA2integratedabundance
derived
from
thedifference
betweentotalbacteriaand
HNA1+LNA
integratedabundances.See
colorversionofthisfigure
atbackofthisissue.
C07S16 THYSSEN ET AL.: BACTERIA IN THE NE ATLANTIC OCEAN
5 of 16
C07S16
the anticyclonic eddy A2 (Figure 1b) and was characterizedby deeper isopycnal (26.9 kg m�3 at 230 m), high sea surfacetemperatures (�16�C) and high Tchla integrated values(mean 52.2 ± 10.2 mg Chl a m�2 (Figure 3a)) with amaximum Tchla concentration of 1.77 mg Chl a m�3 atstation 71 (20�W, 20 m depth). Area 6 occupied the south-eastern part of the grid and showed lower Tchla integratedvalues (mean 48.2 ± 12.4 mg Chl a m�2 (Figure 3a)).Globally, this southern region (areas 5 and 6) exhibitedthe lowest integrated concentrations of nutrients (1720 ±466mmol. NO3m
�2 (Figure 3b)). Bacteria were significantlyless abundant in the southeast corner than in the southwestcorner; in that case, the difference was due to HNA1 that weresignificantly more concentrated in the A2 area.[24] TheHNA2were not present down to 300mdepth at all
stations. Consequently, their contribution to the total inte-grated heterotrophic bacterial abundances was derived fromthe difference between total bacteria and HNA1 + LNAintegrated abundances (Figure 3c). They were mostly presentin the areas 1, 3 and at the eastern side of A2 in area 5(Figures 1b and 3c).3.3.1. Bacterial Abundances and Tchla Concentrationsin the Euphotic and Mixed Layers[25] Either when considering the whole study area or the
six zones into which it was subdivided, no significantrelationship was observed between abundances of bacterialsubpopulations and Tchla concentrations whether in themixed or the euphotic layer. The positive slope of theregression between log transformed concentrations of bac-teria and Tchla provides evidence for an increase in bacterialabundance following an increase in Tchla concentration[Buck et al., 1996; Cole et al., 1988; see also Li et al.,2004, and references therein]. Most of the analogous slopesreported in the literature are <1, but the related studiesconcerned the whole bacterial community. HNA1 exhibiteda slope �1 in the ELD of areas 1 and 2 and the MLD ofareas 2 and 4 (Table 3). Furthermore, slopes correspondingto HNA1 were always higher than that of LNA, except inthe MLD around A2 (area 5 (Table 3)).3.3.2. Integrated Tchla and Bacteria ConcentrationsOver the Euphotic and Mixed Layer[26] A significant relationship was found between the
MLD and the bacteria abundance integrated over it (r2 =0.8, n = 69, p < 0.01), which could be accounted for bylarge variations of the MLD (from 5 to 216 m, data notshown). Indeed, south of 41�N, the summer stratificationwas under progress, inducing an average MLD of 25.7 ±21.1 m, whereas it was 36.7 ± 24.6 m in the central area and91.6 ± 52.7 m north of 43�N,with a maximum value of 216mat 44.5�N–20�W. The regression between integrated totalbacteria abundances (cells m�2) and Tchla (mg Chl a m�2)was found to follow a power function within the MLD(Table 4). When considering separately integrated abun-dances of HNA1 and LNA, the regression was greater inthe central area between 41 and 43�N (r2 = 0.83 and 0.88
respectively, p < 0.01) than elsewhere (see Table 4). Thenorthern area was very rich in bacteria with a maximumintegrated abundance of 1.33 1013 cells m�2 and a smalldifference between HNA1 and LNA integrated abundances(0.45 and 0.69 1013 cells m�2 respectively for the deepestMLD (216 m; station 17: 44.5�N, 20�W)).[27] The depth of the euphotic layer did not exhibit such
large changes and averaged 52.5 ± 8 m. No relationship wasfound between bacteria and Tchla concentrations integratedover the euphotic layer.[28] We determined the ratios of integrated (over the
mixed and euphotic layers) vertical distributions of bacteria,Tchla, and nitrate (IB(MLD)/IB(ELD), IT(MLD)/IT(ELD),NO3(MLD)/NO3 (ELD) respectively) and plotted these ratiosas a function of the ratio (MLD/ELD) of the correspondinglayer depths (Figure 4).[29] When the MLD was deeper than the ELD (MLD/
ELD > 1), the ratios IB(MLD)/IB(ELD) and IT(MLD)/IT(ELD)
deviated below the bisecting line. This was more pro-nounced for the IT(MLD)/IT(ELD) ratio, because ELD wasderived from the Tchla vertical distribution. Stations withsuch ratios were located in the northern part of the studyarea. TheTchla concentration integrated over the upper 300mreached 78 mg chl a m�2 at station 15, well above theaverage value of 48.7 ± 13.68 mg chl a m�2. TheIB(MLD)/IB(ELD) ratios located below the bisecting linecorresponded to stations in the central area, particularlyaround A1 (stations 40, 42, 39).[30] For MLD/ELD values in the range 0.5–1, the
IB(MLD)/IB(ELD) ratios located above the bisecting linehighlight the fact that the mixed layer, though shallowerthan the euphotic layer, was concentrating an importantfraction of the bacteria. Some associated NO3(MLD)/NO3(ELD) ratios were located below the bisecting line,expressing the role of barrier played by the bottom of theMLD with respect to the biological community. Stationscorresponding to that situation were associated to strong jetsobserved around C4 and A2 (Figure 1b) [Fernandez et al.,2005a] and in the frontal zone separating these two eddies.[31] When MLD/ELD was <0.5, the mixed layer was
very shallow and the related stations were located in theregion of the A2 gyre (Figure 1b).3.3.3. Vertical Distribution of BacteriaSubpopulations (HNA1 and LNA)[32] When considering the whole study area the average
distributions of HNA1 and LNA appeared not significantlydifferent above 100 m and below 300 m depth (not shown)
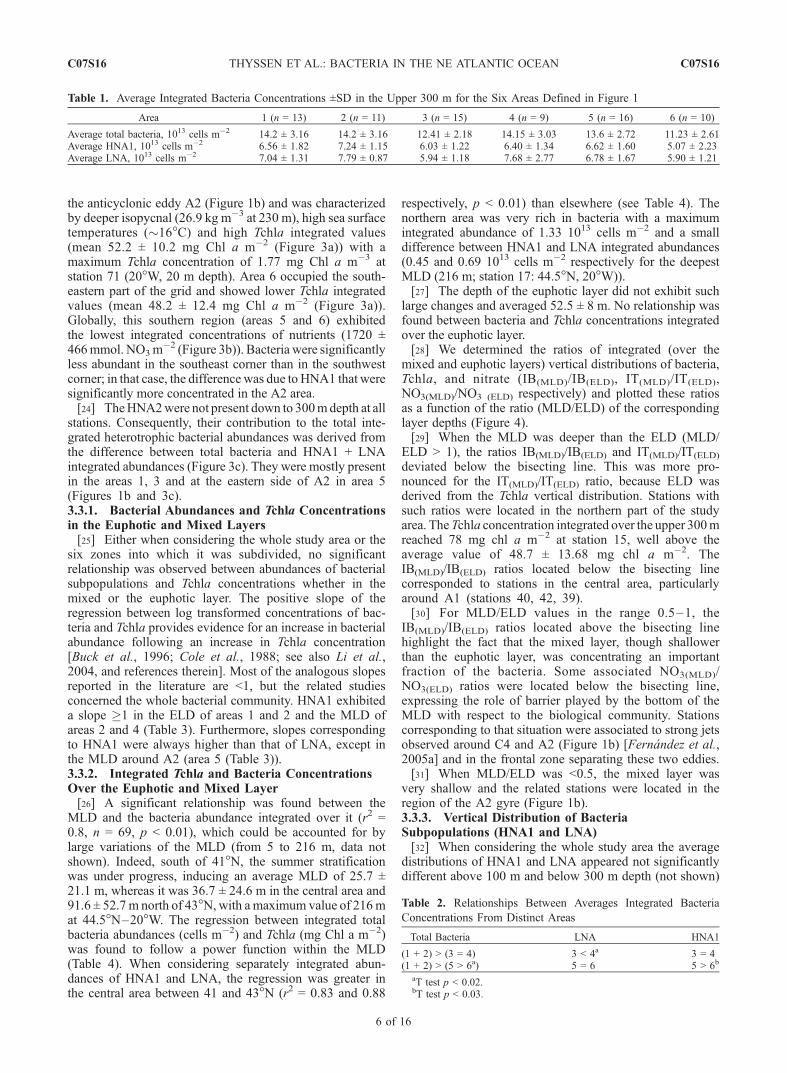
Table 1. Average Integrated Bacteria Concentrations ±SD in the Upper 300 m for the Six Areas Defined in Figure 1
Area 1 (n = 13) 2 (n = 11) 3 (n = 15) 4 (n = 9) 5 (n = 16) 6 (n = 10)
Average total bacteria, 1013 cells m�2 14.2 ± 3.16 14.2 ± 3.16 12.41 ± 2.18 14.15 ± 3.03 13.6 ± 2.72 11.23 ± 2.61Average HNA1, 1013 cells m�2 6.56 ± 1.82 7.24 ± 1.15 6.03 ± 1.22 6.40 ± 1.34 6.62 ± 1.60 5.07 ± 2.23Average LNA, 1013 cells m�2 7.04 ± 1.31 7.79 ± 0.87 5.94 ± 1.18 7.68 ± 2.77 6.78 ± 1.67 5.90 ± 1.21
Table 2. Relationships Between Averages Integrated Bacteria
Concentrations From Distinct Areas
Total Bacteria LNA HNA1
(1 + 2) > (3 = 4) 3 < 4a 3 = 4(1 + 2) > (5 > 6a) 5 = 6 5 > 6b
aT test p < 0.02.bT test p < 0.03.
C07S16 THYSSEN ET AL.: BACTERIA IN THE NE ATLANTIC OCEAN
6 of 16
C07S16

whereas between 100 and 300 m depth, HNA1 were lessabundant (maximal average difference of 13.5% at 150 mdepth) than LNA (t = �13.9, p < 0.001, n = 578). Below theMLD, LNA were more abundant than HNA1 (50.71 ±8.07% and 47.98 ± 8.06%, t = �6.34, p < 0.001, n =696). In Figure 5 are displayed the vertical average distri-butions of HNA1 and LNA abundances (Figures 5a, 5d, 5g,5j, 5m, and 5p), their relative percentages (Figures 5b, 5e,5h, 5k, 5n, and 5q) and the Tchla vertical distribution(Figures 5c, 5f, 5i, 5l, 5o, and 5r) for each of the six regionsdefined in Figure 1b. In the northern study area (areas 1 and2 of Figure 1b), the distributions of both subpopulationswere not significantly different in the upper 100 m(Figures 5a, 5b, 5d, and 5e), which can be accounted for bythe presence of large MLDs. In contrast, HNA1 percentagesin the upper 100 m were significantly higher than LNApercentages in the center west (area 3, t = 5.36, p < 0.01,n = 8 (Figures 5g and 5h)) and in the southwest (area 5; t =4.10, p < 0.01, n = 8 (Figures 5m and 5n)) while LNApercentages were significantly higher than HNA1 percen-tages in the southeast (area 6; t = 4.63, p < 0.01, n =8 (Figures 5p and 5q)). Between 100 and 300 m depth, LNAwere significantly more abundant than HNA1 (t = 10.4, p <0.01, n = 19) except for the center west (area 3 (Figure 5h)).Underneath the highest surface Tchla concentrations (centereast (area 4 (Figure 5k)) and southwest (area 5 (Figure 5n)),both subgroups were significantly distinct from each otherbetween 100 m to 400 m (t = 5.47 and t = 5.68 respectively,p < 0.001, n = 5), with maximal percentages for LNA.
3.4. Evidence of Physical and/or Biological Influenceon Integrated Bacteria Distributions
[33] Figure 6 displays the spatial distribution of integratedabundances of HNA1 and LNA over 300 m depth super-imposed on the upper layer geostrophic current field to-gether with the locations of the main cyclonic (C4) andanticyclonic structures (A1 and A2). The spring cruise wascharacterized by high geostrophic current values and astrong northward jet was observed along the eastern edgeof C4 and the western edge of A1 (�0.2 m s�1). Twosouthward jets were observed at the western edge of C4 andat the eastern edge of A1 (Figures 6a and 6b).
[34] The distribution of LNA integrated values was influ-enced by the main geostrophic currents, as suggested by thelow abundance values observed between C4 and A1 and thehigh abundance values on the eastern side of A2 (Figure 6a).The HNA1 integrated abundance values also matched thefingerprint of these currents to some extent, but the observedrelationship was less obvious in that case. Indeed, high valuesof HNA1 integrated abundances were observed at 42�N,encompassing the northward jet. Tchla was present in highconcentrations in this area as shown in Figure 3a. In the regionoccupied by A2, the distribution of HNA1 and LNA inte-grated values was bearing the anticyclonic signature.
3.5. Mesoscale Effect on Bacterial Distribution:Multiple Correspondence Analysis
[35] Two successive multiple correspondence analyses(MCA) were applied to provide and quantify evidence forthe mesoscale impact on bacterial distribution. The firstMCA included the whole data set: categorizing the nutrientvariables, the bacterial subpopulation variables, depth, tem-perature, density and fluorescence. Results did not revealany mesoscale impact on the bacterial community, essen-tially because of the occurrence of a Guttman effect (notshown), implying a major role of the first axis and all theother axes being a function of the first one, in agreementwith the previous correlation results.[36] In the second MCA, the number of parameters was
limited and we took advantage of the possible links ob-served between bacterial integrated distribution and geo-strophic currents delimiting the main hydrodynamicalfeatures (Figure 6a). To this purpose, the study area wasdivided into nine regions as depicted in Figure 7,corresponding roughly to hydrodynamical rather than bio-geochemical characteristics as previously done. These sub-divisions, based on a subjective visual compromise betweenbacteria distribution and hydrodynamical features, are asfollow: (1) NE and (2) NW in the northern area, (3) CW1and (4) CW2 representing the eastern and western side ofC4 respectively, (5) CE covering the center east andpartially including A1 and the frontal zone around41.5�N, (6) FR, the frontal zone separating C4 from A2,(7) A2W and (8) A2E the western and eastern sides of A2respectively and finally (9) SE, the southeast corner of thestudy area.
Table 3. Values of Slope and y Intercept of the Linear Regression
Between log10 (HNA1 or LNA Abundance) and log10 (Tchla
Concentration) Over the Mixed and Euphotic Layers of the Six
Regions Defined in Figure 1
log (bacteria) = a log (Tchla) + b
Area (Figure 1)
1 2 3 4 5 6
ELDHNA1Slope (a) 1.55 1.00 0.98 0.86 0.57 0.87y intercept (b) 5.94 5.83 5.80 5.66 5.64 5.54
LNASlope (a) 1.37 0.65 0.69 0.69 0.45 0.72y intercept (b) 5.91 5.72 5.63 5.60 5.56 5.56
MLDHNA1Slope (a) 0.58 1.13 0.82 1.13 0.41 0.67y intercept (b) 5.70 5.89 5.68 5.71 5.39 5.51
LNASlope (a) 0.49 0.87 0.51 0.93 0.47 0.50y intercept (b) 5.68 5.80 5.50 5.64 5.35 5.48
Table 4. Relationships Within the Mixed Layer of Different
Regions, Between Integrated Bacteria Abundance (IB) and
Integrated Tchla (IT)a
AreaBacteria
DistributionAverage MixedLayer Depth, m n
IB = a IT
r2a b
Study area IBTotal 70 8.09E+11 1.16 0.80North of 43�N IBHNA1 91.6 ± 52.7 23 5.23E+11 1.12 0.68
IBLNA 91.6 ± 52.7 23 4.04E+11 1.20 0.73Central area(41�–43�N)
IBHNA1 36.7 ± 24.6 21 7.37E+11 0.95 0.83
IBLNA 36.7 ± 24.6 21 7.59E+11 0.89 0.88South of 41�N IBHNA1 25.7 ± 21.1 25 2.18E+11 1.01 0.63
IBLNA 25.7 ± 21.1 25 5.01E+11 1.28 0.58aIBTotal, integrated total bacteria abundance; IBHNA1, integrated HNA1
abundance; IBLNA, integrated LNA abundance. IB is in cells m�2 and IT isin mg Chl a m�2.
C07S16 THYSSEN ET AL.: BACTERIA IN THE NE ATLANTIC OCEAN
7 of 16
C07S16

Figure
4.
Ratiosofverticaldistributionsintegratedover
themixed
andeuphoticlayersof(a)bacteria(IB(M
LD)/IB
(ELD)),
(b)Tchla
(IT(M
LD)/IT
(ELD)),and(c)nitrate(N
O3(M
LD)/NO3(ELD))as
afunctionoftheratioofthecorrespondinglayer
depths
(MLD/ELD).Values
observed
over
thebisectinglinemeansthat
theMLD
had
astronginfluence
even
iftheratioMLD/
ELD
<1.Conversely,values
appearingbelow
thebisectinglineassignastronger
weightto
theELD.
C07S16 THYSSEN ET AL.: BACTERIA IN THE NE ATLANTIC OCEAN
8 of 16
C07S16

[37] The large data set of bacterial abundance does notprovide evidence for a large variability that would differ-entiate biotic or abiotic factors. To study the mesoscaleimpact on the bacterial population, we used two approachesbased on (1) total bacterial abundances and (2) subgrouppercentages respectively. Therefore we determined six clas-ses of stations corresponding to values greater than theaverage ± standard deviation (extreme values) for eachdepth at each station (Table 5). Thus both MCAs wererun involving four factors each: (1) regions (Figure 7),Abdc >, Abdc200m> and Abdc< (Table 5) and (2) regions(Figure 7), HNA1>, LNA> and HNA2> (Table 5). Eachparameter of Table 5 was expressed by two modes (presentor absent). These modalities were organized in a disjunctivetable and then plotted after calculating their correspondences.
3.5.1. Contrasts in the Bacterial DistributionThrough Extreme Situations: The MCA Classes[38] The six classes described in Table 5 were contrasting
with the average bacterial distribution and provided evi-dence for abundance variability. Bacteria at stations belong-ing to Abdc> class (Table 5) were 29% more concentratedwhile bacteria at stations belonging to Abdc< class were25% less concentrated than the average bacterial concen-trations over the whole study area. Stations belonging toAbdc200m> were grouping the extreme values below 200 mdepth among those used to select Abdc> stations. Thesebacteria maximal abundances below 200 m essentiallycorresponded to LNA (1.72 � 105 cells cm�3 against0.793 � 105 cells cm�3 for the overall average value).HNA1 were also present in higher concentrations than the
Figure 5. Vertical abundance (106 cells cm�3) distribution of heterotrophic bacterial subpopulations andTchla concentration in the study area subdivided into six parts (see Figure 1b). Each graphic number isrelated to the region number used in Figure 1b. Dotted lines represent the average MLD of the region. Foreach of these divisions: (a, d, g, j,m, p) average vertical profiles ±SDofHNA1 andLNAabundances; (b, e, h,k, n, q) average vertical profiles ±SD of HNA1 and LNA relative abundance percentages; and (c, f, i, l, o, r)average vertical profiles ±SD of Tchla concentrations. Note that the depth scale for Tchla is different fromthat for bacteria.
C07S16 THYSSEN ET AL.: BACTERIA IN THE NE ATLANTIC OCEAN
9 of 16
C07S16

overall average (1.24 � 105 cells cm�3 against 0.75 �105 cells cm�3).[39] Stations belonging to the HNA1> class (Table 5)
were characterized by an average HNA1 abundance per-centage of 59.5% to be compared to 48.2% for the wholedata set and HNA1 made the major subpopulation in theupper 100 m (not shown). Below 100 m depth, HNA1 andLNA bacteria abundances were very close. Stations belong-ing to the LNA> class were characterized by an averageLNA abundance percentage of 61.0% compared to 49.7%for the whole data set. At these stations, LNA made thedominant subpopulation over the sampled water column,with a maximum percentage of 72.0% at 150 m depth (notshown).[40] The MLD was shallower at stations belonging to
the HNA1> class than at stations of the LNA> class (35.7 ±26.4 m (n = 294) against 46.7 ± 30.7 m (n = 274)respectively, t = 4.53, p < 0.001). The HNA1> stationsexhibited Tchla average contents in the upper 50 msignificantly higher than at LNA> stations (0.64 ± 0.09(n = 100) against 0.54 ± 0.05 mg Chl a m�3 (n = 105)respectively, t = 2.72, p < 0.01). No significant differencewas observed between HNA1> and LNA> stations regard-ing nitrate concentration values.
[41] Stations belonging to the HNA2> class did notprovide evidence of large differences with stations belong-ing to the HNA1> class regarding hydrological data ornutrient concentrations. However, stations characterized bytwo HNA2 extreme abundance values instead of one(Table 5), were associated to higher values of nitrate inthe upper 100 m than the HNA1> class stations (4.78 ±2.07 (n = 69) and 3.87 ± 2.44 (n = 157) mM NO3
respectively, t = 4.26, p < 0.001).3.5.2. Combined Results of the Two MCA Approaches[42] Extreme high abundances were observed close to the
extreme abundances below 200 m (Figure 8a), suggestingthat the influencing high abundances were occurring below200 m depth. The box-and-whisker plot of HNA1 and LNAabundances with respect to latitude (Figure 9) shows thatthe main influence comes from LNA that were particularlyabundant (>2.105 cells cm�3) in the 200–400 m layer in thesouth. High bacteria concentrations in deep waters alsooccurred in the northeast region where the mixed layerwas very deep (mean = 117 m), and Tchla high (0.05 ±0.07 mg m�3 at 200 m against 0.01 ± 0.02 mg m�3, averagevalue). Maximal abundances were mainly found at A2WandA2E, and very weak bacterial abundances were found at SE(Figure 8a). NE area was heterogeneously grouping extreme
Figure 6. Upper layer geostrophic current field superimposed on the bacteria abundances integratedbetween 0 and 300 m depth. (a) LNA integrated values (1013 cells m�2). (b) HNA1 integrated values(1013 cells m�2). Labeled mesoscale features: A1 and A2, anticyclonic gyre; C4, cyclonic gyre. See colorversion of this figure at back of this issue.
C07S16 THYSSEN ET AL.: BACTERIA IN THE NE ATLANTIC OCEAN
10 of 16
C07S16

abundances, while the other areas were more or lessrepresented by these classes. CW1 and FR areas wereinfluenced by high abundances and by the zero modalitiesrepresenting nonextreme situations (Figure 8a). HNA2>and LNA> modalities appeared on the same side of axis 2,separated from the HNA1> modality (Figure 8b). HNA1>modality was linked to CW1 and A2W (Figure 8b) wherestrong jets were observed, implying very low percentagesof LNA cells in these areas. Both HNA1> and HNA2>modalities were connected to FR, the one region whereboth modalities were well represented. HNA2> were
mostly found in frontal and strong jet areas (FR, CE,A2E) (Figure 8b). LNA> modality was connected to SEand CW2 (Figure 8b), and to NE where deep mixedlayers were observed. NW was linked to the zeromodalities (Figure 8b).
4. Discussion
4.1. Community Heterogeneity
[43] Bacteria are the main contributors to recycling DOCby their high mineralization rate, creating feedbacks of
Figure 7. Subdivision of the study area into nine regions to observe the physical impact on bacterialdistribution based on geostrophic currents, eddies, and fronts illustrated in Figure 6.
Table 5. Definition of the Different Classes Corresponding to Extreme Situations
Classes% Average Difference
With Total Description n
Abdc< �25 stations where total bacterial abundance was < [mean abundance for the whole study area – SD]for at least four depths (average of 13 sampled depths)
13
Abdc> +29 stations where total bacterial abundance was > [mean abundance for the whole study area + SD]for at least four depths (average of 13 sampled depths)
20
Abdc200m> +13 stations where the total bacterial abundance was > [mean + SD] below 200 m for at least two depths(average of five sampled depths)
11
HNA1> +11.3 stations where HNA% of the total was > [mean HNA% for the whole study area + SD]for at least three depths (average of 13 sampled depths)
23
LNA> +11.3 stations where LNA% of the total was > [mean LNA% for the whole study area + SD]for at least three depths (average of 13 sampled depths)
22
HNA2> +61 stations where HNA2 abundance was > [mean HNA2 abundance for the whole study area + SD]for one depth or more
22
C07S16 THYSSEN ET AL.: BACTERIA IN THE NE ATLANTIC OCEAN
11 of 16
C07S16

carbon and nutrients in the photic layer within the microbialtrophic network.[44] The three cytometrically distinguished subgroups
were dominant in different layers of the water column.
This suggests the existence of different ecological envi-ronments supporting distinct microbial assemblages whereone of these three subgroups would play a key role. Theheterogeneity in their activity is likely influenced by the
Figure 8. (a) Multiple correspondence analysis (MCA) of extreme bacterial abundances (see Table 5)and geographical areas (see Figure 7). Axis 1 describes 37.47% of the variability, and axis 2 describes33.65%. (b) MCA of bacterial extreme subgroup abundances (see Table 5) and geographical areas. Axis 1describes 22.49% of the variability, and axis 2 describes 19.17%.
Figure 9. Box-and-whisker plots of the HNA1 and LNA abundances (105 cells cm�3) between 200 and400 m depth as a function of the latitude.
C07S16 THYSSEN ET AL.: BACTERIA IN THE NE ATLANTIC OCEAN
12 of 16
C07S16

status of the surrounding and interacting environment(nutrient depletion, grazing, temperature, hydrodynamism)making critical the cell ability for adaptation.
4.2. Heterogeneity Between Bacteria and Tchla
[45] The highest Tchla integrated values found in thecenter east part of the study area were well correlated tobacterial integrated abundances over the mixed layer(Table 5). No significant correlations were observed on thesame areas whenwe took the concentrations values instead ofthe integrated values of both parameters, as observed in othertemperate areas [Cole et al., 1988; Simon et al., 1992]. Thusthere is an indirect relationship between bacteria and chloro-phyll spatial distribution, maintained inside of the mixedlayer. The large variability observed for Tchla and bacteriaconcentrations can be assigned to different stages of thephytoplankton bloom and the subsequent organic matterrelease [Barbosa et al., 2001] or to the interactions insidethe microbial loop (nutrient competition [Fuhrman, 1992],turnover rate between bacteria and phytoplankton [Choand Azam, 1988; Fuhrman et al., 1989], and diel peri-odicity of bacteria [Kuipers et al., 2000]) that were likelyvarying throughout the study area upon the effect oflatitudinal variations of hydrological and biogeochemicalparameters.[46] Themain occurrence in the surface layer of the highest
HNA1 concentrations and the high slopes of the log-logrelationship (Table 3) could be explained by the nutritionalsupport from phytoplankton, i.e., high Tchla and nutrientcontents. In the upper 300 m, HNA1 and Tchla Spearman’srank correlation was 0.64 (n = 400, p < 0.0001). LNAabundance was correlated to Tchla concentration in the samelayer (Spearman, r = 0.57, n = 400, p < 0.0001) as well as tothe Tchla integrated over the mixed layer (Table 4), so thatLNA may also respond to organic matter supplied by phyto-plankton growth, may be through sloppy feeding [Banse,1995] of the larger cells (i.e., HNA1 and HNA2). Indeed, theimplication of LNA cells in organic matter recycling throughbacterivory is known to be less important than for larger cells[del Giorgio et al., 1996]. Furthermore, LNA were moreabundant below 100 m depth (Figures 5b, 5e, 5h, 5k, 5n, and5q), suggesting that their abundance could respond to theupper layer trophic status and influence the remineralizationprocesses in deep layers. Indeed, three locations with largeLNA abundance can be noticed in Figure 9. They wereassociated with (1) the northern (>44�N) region characterizedby a deep MLD, (2) the central part (41�–42.5�N) whereTchlawas high andwhere frontal areaswere encountered, and(3) the south (<39.5�N)where highTchla concentrationswerelinked to the A2 anticyclonic eddy and where high sinkingparticle rates were observed at 400 m [Leblanc et al., 2005;Guieu et al., 2005].[47] HNA2 extreme concentrations (Table 5) were located
in higher nutrient domains and they exhibited weak corre-lations with Tchla (Spearman’s r = 0.41, n = 229, p <0.0001).
4.3. Zoning and the Different Stages of thePhytoplankton Bloom
[48] Siegel et al. [1990] and Frazel and Berberian [1990]provided evidence for a northward progression over 3 weeksto 1 month of the spring bloom in the North Atlantic Gyre.
During the POMME spring cruise, three main zones could bedistinguished: (1) north of 43�N, reflecting the late winterimpact, (2) in the center, corresponding to frontal systems,and (3) south of 41�N, on the way to the common summeroceanic conditions. Siegel et al. [2002] defined a transitionline at 40�N. South of it, the MLD did not vary enough tosupport Sverdrup’s hypothesis on phytoplanktonic bloomenhancement by the shallowing of the MLD. Thus springphytoplanktonic production would depend more on thequantity of nutrients supplied by winter mixing than onirradiance availability.[49] The northern area (areas 1 and 2 (Figure 1b)) where
the mixed layer was the deepest, exhibited no significantdifference between HNA1 and LNA percentages in theupper 100 m (Figures 5b and 5e). High bacterial concen-trations were observed (Figures 6a and 6b) while Tchlavalues were diluted through the water column, that couldexplain the slopes >1 observed over the euphotic layer(Table 3). This suggests that the potential dissolved organicmatter that would sustain these huge bacteria concentrationsmay not only find its source from sloppy feeding orphytoplankton exudation that accounts for 2/5 and 1/10respectively of bacterial carbon solubilization [Banse,1995]. The possible lack of a direct source of nutrient forbacteria would implicate the role of the winter permanentMLD in supplying organic matter to the upper layer. Thisorganic matter could have been accumulated since theprevious fall period (R. Fukuda-Sohrin and R. Sempere,Seasonal distribution in total organic carbon in the northeastAtlantic in 2000–2001, submitted to Journal of Geophys-ical Research, 2004) and made more labile through furtherexposure to UVB radiation [Hader et al., 1998] in conjunc-tion with the impact of turbulence [Peters et al., 2002]enhanced in the northern mixed layer. In the case of deepmixed layers, the phytoplankton growth rate is decreased[Sverdrup, 1953], and the phytoplankton production wasfound to be channeled to the microbial loop, makingpossible a bacterial growth exceeding primary production[Cho et al., 1994; Nielsen and Richardson, 1989] when thethermocline settling is delayed.[50] In the center east side (area 4 (Figure 1b)), down to
80mdepth, average Tchla concentrationwas high (Figure 5l),probably due to the frontal system of this area also suspectedto correspond to the subduction zone (40�–42�N). A highvalue of integrated bacterial abundance (mostly LNA) wasobserved east of the Tchla central peak (Figures 6a, 6b, and3a). Decoupling between bacteria and phytoplankton abun-dances in frontal areas were previously observed [Cho et al.,1994; Naganuma, 1997]. Average HNA1 and LNA abun-dances were not significantly different in the upper 100 m(Figure 5k), while LNA abundance was significantlyhigher than HNA1 abundance in deeper layers. Advectivetransfer of matter regarding the similar biogenic mattersignature from the productive A1 (200 m depth traps) tothe frontal area (400 m depth traps) were hypothesized byMosseri et al. [2005] and Goutx et al. [2005]. In contrastwith the other areas, the observed bacterial communitycorresponded to stations belonging to the LNA> andHNA2> classes (Figure 8b). The related ecosystem wasprobably the one where a phytoplanktonic bloom waswell pronounced. The unexpected low HNA1 concentra-tions could be explained by grazing pressure or shift
C07S16 THYSSEN ET AL.: BACTERIA IN THE NE ATLANTIC OCEAN
13 of 16
C07S16

between bacterial and phytoplanktonic blooms [Lochte etal., 1997; Ducklow, 1999].[51] In the center west part (area 3 (Figure 1b)), Tchla
values were low whereas high nitrate values were observed(Figures 3a and 3b). Bacterial integrated values were low inthe core of C4 (st 56 (Figures 6a, 6b, and 3c)). HNA1 cellswere more concentrated at the east side of C4 where highprimary production was observed [Fernandez et al., 2005b]while LNA cells were more concentrated at its west side(Figures 6b and 6a, respectively).[52] In the southwest (area 5 (Figure 1b)), high bacteria
concentrations were associated to a shallow MLD andundetectable nutrient levels in the surface waters, suggest-ing that the spring bloom in this area was almost over.Sedimentation of organic material in deep layers [Goutx etal., 2005] could explain the high concentrations of LNAobserved between 200 and 400 m depth (Figure 9). Highbacterial abundances at the surface layer could result from ahigher organic matter availability occurring at the late stageof a phytoplankton bloom. The MLD, shallower than theELD, may somehow isolate the microbial system and thusaccelerate the phytoplankton bloom decline. Figure 4cprovides evidence for the presence of nutrients in theeuphotic layer, on the borders of A2 that does not reachthe MLD: low ratios between the mixed and euphotic layersof integrated nitrate concentrations, situated well under thebisecting line. High HNA1 percentages in the surface layersuggest a weak impact of the grazing pressure in this areathat corresponded to the most productive part of thePOMME study area [Fernandez et al., 2005b]. Sloppyfeeding and phytoplanktonic exudation [Fuhrman, 1992]could counterbalance the effect of the potential bacterialpredation by increasing the organic matter availability andsustaining a subsequent bacterial bloom [Ducklow, 1999].[53] The southeast region (area 6 (Figure 1b)) was re-
markably poor both in bacteria and Tchla. LNA weresignificantly more abundant than HNA1 down to 300 mdepth at least, probably due to the poor nutrient content inthis area suggesting that LNA dominance in this area couldbe accounted for by their adaptation to poor nutritionalconditions [Zubkov et al., 2001]. Low HNA1 abundancecould result from the low phytoplanktonic concentration(Figure 3a), i.e., low organic matter availability. Thissituation was also observed in the northern Gulf of Mexico,where low-DNA bacteria dominated in the euphotic layer[Jochem, 2001], and where bacteria concentrations wherelow (2–4 � 105 cells cm�3) [Jochem et al., 2004].
4.4. Hydrodynamical Features and BacterialDistribution
4.4.1. Study Area Subdivision[54] In the POMME study area, the evidence of the
latitudinal phytoplankton bloom evolution was supportedin particular by the observation of high level of Tchla in thesouth, low nutrient concentrations and shallowMLD, mainlyaround A2, whereas in the north, the bloom development wasonly potential, nutrients where not depleted and MLD wasdeeper. This north-south contrast could not be deduced fromthe bacterial distribution alone. Karrasch et al. [1996] stip-ulated that the north-south variation of the spring bloom in theNorth Atlantic is not always obvious, and that the differentsteps of the phytoplanktonic bloom are linked to mesoscale
events. Hoppe et al. [2002, p. 171] reported that the ‘‘prox-imity of the heterotrophic and autotrophic patches in oligo-trophic oceans suggest an unstable system reacting rapidly tochanging environment conditions.’’ These changes are due inparticular to mesoscale dynamics that will increase phyto-plankton patchiness [Martin, 2003]. The area was dividedinto nine regions (Figure 7) corresponding to a compromisebetween geostrophic currents and mesoscale features ob-served in the area (Figures 6a and 6b), each region beingrepresented by a sufficient amount of samples.4.4.2. Mesoscale and Hydrodynamical Features:Impact on Bacterial Distribution4.4.2.1. Evidence of Physical Forcing on BacteriaDistribution[55] The strong northward jet delimitating A1 and C4 had
a different influence on the bacterial distribution as com-pared to the southward jet, located between C4 and A2(Figures 6a and 6b), and stirring nutrient-rich waters fromthe north. Conversely, the low LNA abundance between A1and C4 corresponded to the northward jet between the twoeddies and transporting warm surface waters (13�C) fromthe southeast. The distribution of LNA integrated abundancesappeared to be influenced by these currents, with (1) highabundances along the jet situated at the west border of C4,moving southward down to A2 east side, (2) low abundancesalong the jet flowing betweenA1 andC4 up to 43�N, 19.3�W,and (3) higher concentrations in the southward jet alongthe east side of A1 (Figure 6a). The HNA1 distributiondid not match the jet paths, and was more responding totrophic variations than the LNA distribution [Yanada etal., 2000], according to the relationships established inthis study.4.4.2.2. Mesoscale Features and Bacterial Distribution[56] The MCA was carried out in order to quantify the
impact on the bacterial distribution of mesoscale featuressuch as the geostrophic currents. Results suggest that theeastern part of the cyclonic eddy C4 (CW1 (Figure 8)) andthe frontal zone (FR (Figure 8)) were concentrating abnor-mally high abundances of HNA1 (HNA1> class stations(Table 5)) and HNA2 cells (HNA2> class stations (Table 5)),while phytoplankton was not particularly abundant accord-ing to Tchla values. The C4 cyclonic eddy was observed inthe study area from winter to late summer [Le Cann et al.,2005; Fernandez et al., 2005a] and Maixandeau [2004]observed high respiration rates in the core of C4 duringspring that may be explained by the presence of high HNA1concentrations. This eddy supplied continuously nitrate-richwaters to the mixed layer, with high regenerated productionrates [Fernandez et al., 2005a]. Frontal zones are known toinvolve vertical transport processes that supply nutrientsfrom deeper waters and stimulate phytoplankton develop-ment [Sournia, 1992; Martin and Richards, 2001], whichcould account for the high HNA2 abundances in the FRregion (Figures 3c and 7). Furthermore, turbulent conditionsincrease the recycling of dissolved organic matter, whichcould have enhanced the bacterial growth [Peters et al.,2002], until the establishment of the seasonal shallowthermocline.[57] Conditions were quite different in the region of the
A2 anticyclonic eddy. Its east side (A2E (Figure 8)) linkedto the northward jet flowing between C4 and A1, wasmarked by very high bacterial abundances, mostly below
C07S16 THYSSEN ET AL.: BACTERIA IN THE NE ATLANTIC OCEAN
14 of 16
C07S16

200 m depth (Abdc200m> class (Table 5)). The geostrophicsignature surrounding A2 was well followed by HNA1 andLNA bacterial subgroups (Figures 6a and 6b). The highabundances observed below 200 m depth, rather elevatedfor this area (Figure 9b), could be the sign of materialexportation to deep waters as previously discussed. Incontrast, the southeast area (SE (Figure 8)), was character-ized by low bacterial abundances and no strong hydrody-namical features nor jets. Nevertheless, this low bacterialstatus seemed to follow the warm water tongue until 43�Nbetween A1 and C4 (Figures 6a and 6b) as observed fornitrate concentrations and temperature [Fernandez et al.,2005a]. This observation was well accounted for by theMCA. Indeed, stations belonging to LNA> classes werealong the jets flowing toward the southeast (SE), C4 eastside (CW1) and northwest part (NW).
5. Conclusion
[58] The large data set collected during the POMMEspring cruise enabled us to determine the spatial distributionin the upper 600 m of the study area of the three bacterialsubpopulations (HNA1, HNA2 and LNA) resolved by flowcytometry.[59] The vertical distribution of the three subpopulations
was not identical. HNA2, when present, were restricted tothe surface layer, suggesting that these bacteria couldrepresent the facultative photoheterotrophic bacteria recentlydiscovered by Kolber et al. [2000, 2001]. HNA1 weredominant in the upper 100 m, and were spatially respond-ing to high Tchla concentrations. This subpopulationseemed to be favored by the most labile DOC generatedin the euphotic layer. HNA1 are certainly suited to highorganic carbon releases in terms of size and abundance asobserved by Jurgens et al. [2000]. Though also present inthe upper layer, LNA were dominant below 100 m,supporting the hypothesis of Zubkov et al. [2001], sug-gesting that they are adapted to nutrient limited waters.The LNA being more abundant in intermediate waters(200–400 m) their distribution was more affected by thehydrodynamic structures than HNA1. To account to someextent for the lack of synopticity of the data set inherentto the unavoidable long-lasting sampling, the study areawas subdivided. This approach enabled to partially dif-ferentiate the nutritional from the hydrodynamical impacton the distribution of bacterial subpopulation.
[60] Acknowledgments. The authors wish to thank Gilles Reverdinand Laurent Memery for their guidance and direction of the POMMEproject. We would like to thank the captain and crew of R/V L’Atalante foroutstanding assistance during the POMME spring cruise. We also wouldlike to thank Herve Claustre for providing chlorophyll analyses and LaetitiaDugrais and Stuart Newman for cytometer sampling onboard. The POMMEproject is funded by PATOM and PROOF (CNRS/INSU).
ReferencesAssenbaum, M., and G. Reverdin (2005), Near real-time analyses of themesoscale circulation during the POMME experiment, Deep Sea Res.,Part I, in press.
Banse, K. (1995), Zooplankton: Pivotal role in the control of ocean produc-tion, J. Mar. Sci., 52, 265–277.
Barbosa, A. B., H. M. Galvao, P. A. Mendes, X. A. Alvarez-Salgado, F. G.Figueiras, and I. Joint (2001), Short-term variability of heterotrophicbacterioplankton during upwelling off the NW Iberian margin, Prog.Oceanogr., 51, 339–359.
Benzecri, J.-P. (1980), L’analyse des donnees, vol. 2, L’analyse des corre-spondances, Bordas, Paris.
Billen, G., P. Servais, and S. Becquevort (1990), Dynamics of bacterio-plankton in oligotrophic and eutrophic aquatic environments: Bottom-upor top-down control?, Hydrobiologia, 2004, 37–42.
Buck, K. R., F. P. Chavez, and L. Campebell (1996), Basin-wide distribu-tions of living carbon components and the inverted trophic pyramid of thecentral gyre of the North Atlantic Ocean, summer 1993, Aquat. Micro-biol. Ecol., 10, 283–298.
Cho, B. C., and F. Azam (1988), Major role of bacteria in biogeochemicalfluxes in the ocean’s interior, Nature, 332, 441–443.
Cho, B. C., J.-K. Choi, and H. H. Hong (1994), Uncoupling of bacteria andphytoplankton during a spring diatom bloom in the mouth of the YellowSea, Mar. Ecol. Prog. Ser., 115, 181–190.
Claustre, H., et al. (2004), An inter-comparison of HPLC phytoplanktonpigment methods using in situ samples: Application to remote sensingand database activities, Mar. Chem., 85, 41–61.
Cole, J. J., S. Findlay, and M. L. Pace (1988), Bacterial production in freshand saltwater ecosystems: A cross-system overview, Mar. Ecol. Prog.Ser., 43, 1–10.
del Giorgio, P. A., J. M. Gasol, D. Vaque, P. Mura, S. Agusti, and C. M.Duarte (1996), Bacterioplankton community structure: Protist control netproduction and the proportion of active bacteria in a coastal marinecommunity, Limnol. Oceanogr., 41, 1169–1179.
de Mey, P., and Y. Menard (1989), Synoptic analysis and dynamical adjust-ment of GOES 3 and Seasat altimeter eddy fields in the northwest Atlan-tic, J. Geophys. Res., 94, 6221–6231.
Ducklow, H. W. (1999), The bacterial component of the oceanic euphoticzone, FEMS Microbiol. Ecol., 30, 1–10.
Dufour, P., and J. P. Torreton (1996), Bottom-up and top-down control ofthe bacterioplankton from eutrophic to oligotrophic sites in the tropicalnortheastern Atlantic Ocean, Deep Sea Res., Part II, 48, 1305–1320.
Dutkiewicz, S., M. Follows, J. Marshall, and W. W. Gregg (2001), Inter-annual variability of phytoplankton abundances in the North Atlantic,Deep Sea Res., Part II, 48, 2323–2344.
Fernandez, I. C., P. Raimbault, G. Caniaux, N. Garcia, and P. Rimmelin(2005a), Influence of mesoscale eddies on nitrate distribution during thePOMME program in the north-east Atlantic Ocean, J. Mar. Syst., 55,155–175.
Fernandez, C. I., P. Raimbault, N. Garcia, P. Rimmelin, and G. Caniaux(2005b), An estimation of annual new production and carbon fluxes inthe northeast Atlantic Ocean during 2001, J. Geophys. Res., 110, C07S13,doi:10.1029/2004JC002616.
Frazel, D. W., and G. A. Berberian (1990), Distributions of chlorophylland primary productivity in relation to water column structure in theeastern North Atlantic Ocean, Global Biogeochem. Cycles, 4, 241–251.
Fuhrman, J. (1992), Bacterioplankton roles in cycling of organic matter: Themicrobial foodweb, inPrimary Productivity andBiogeochemical Cycles inthe Sea, edited by P. G. Falkowski and A. D. Woodhead, pp. 361–383,Springer, New York.
Fuhrman, J., T. D. Sleeter, C. A. Carlson, and L. M. Proctor (1989), Dom-inance of bacterial biomass in the Sargasso Sea and its ecological im-plications, Mar. Ecol. Prog. Ser., 57, 207–217.
Gasol, J. M., U. L. Zweifel, F. Peters, J. H. Fuhrman, and A. Hagstrom(1999), Significance of size and nucleic acid content heterogeneity asmeasured by flow cytometry in natural planktonic bacteria, Appl. Environ.Microbiol., 65, 4475–4483.
Gonzales, N., R. Anadon, and L. Viesca (2003), Carbon flux through themicrobial community in a temperate sea during summer: Role of bacterialmetabolism, Aquat. Microbiol. Ecol., 33, 117–126.
Goutx, M., C. Guigue, N. Leblond, A. Desnues, A. Dufour, D. Aritio, andC. Guieu (2005), Particle flux in the northeast Atlantic Ocean during thePOMME experiment (2001): Results from mass, carbon, nitrogen, andlipid biomarkers from the drifting sediment traps, J. Geophys. Res.,doi:10.1029/2004JC002749, in press.
Gregori, G., A. Colosimo, and M. Denis (2001), Phytoplankton groupdynamics in the bay of Marseilles during a 2-year survey based onanalytical flow cytometry, Cytometry, 44, 247–256.
Gregori, G., M. Denis, D. Lefevre, and J.-C. Romano (2003), Viabilite desbacteries heterotrophes dans la baie de Marseille, C. R. Acad. Sci. Paris,326, 739–750.
Greenacre, M. J. (1984), Theory and Applications of CorrespondenceAnalysis, Elsevier, New York.
Guieu, C., M. Roy-Barman, N. Leblond, C. Jeandel, M. Souhaut, B. LeCann, A. Dufour, and C. Bournot (2005), Vertical particle flux in thenortheast Atlantic Ocean (POMME experiment), J. Geophys. Res.,doi:10.1029/2004JC002672, in press.
Hader, D.-P., H. D. Kumar, R. C. Smith, and R. C. Worrest (1998), Effectson aquatic systems, J. Photochem. Photobiol. B, 46, 53–68.
C07S16 THYSSEN ET AL.: BACTERIA IN THE NE ATLANTIC OCEAN
15 of 16
C07S16

Hoppe, H. G., K. Gocke, R. Koppe, and C. Begler (2002), Bacterial growthand primary production along a north-south transect of the AtlanticOcean, Nature, 416, 168–171.
Ihaka, R., and R. Gentleman (1996), R: A language for data analysis andgraphics, J. Comput. Graph. Stat., 5, 299–314.
Jenkins, W. J. (1988), Nitrate flux into the euphotic zone near Bermuda,Nature, 331, 521–523.
Jochem, F. J. (2001), Morphology and DNA content of bacterioplankton inthe northern Gulf of Mexico: Analysis by epifluorescence microscopyand flow cytometry, Aquat. Microbiol. Ecol., 25, 179–194.
Jochem, F. J., P. J. Lavrentyev, and M. R. First (2004), Growth and grazingrates of bacteria groups with different apparent DNA content in the Gulfof Mexico, Mar. Biol., 145, 1213–1225.
Jurgens, K., J. M. Gasol, and D. Vaque (2000), Bacteria-flagellate couplingin microcosm experiments in the central Atlantic Ocean, J. Explor. Mar.Biol. Ecol., 245, 127–147.
Karrasch, B., H. G. Hoppe, and S. Podewski (1996), The role of mesoscalehydrography on microbial dynamics in the northeast Atlantic: Results ofa spring bloom experiment, J. Mar. Res., 54, 99–122.
Kirchman, D. L., and P. A. Wheeler (1998), Uptake of ammonium andnitrate by heterotrophic bacteria and phytoplankton in the sub-ArcticPacific, Deep Sea Res., Part I, 45, 347–365.
Kolber, Z. S., C. L. Van Dover, R. A. Niederman, and P. G. Falkowski(2000), Bacterial photosynthesis in surface waters of the open ocean,Nature, 407, 117–179.
Kolber, Z. S., F. G. Plumley, A. S. Lang, J. T. Beatty, R. E. Blankenship, C. L.Van Dover, C. Vetriani, M. Koblizek, C. Rathgeber, and P. G. Falkowski(2001), Contribution of aerobic photoheterotrophic bacteria to the carboncycle in the ocean, Science, 292, 2492–2495.
Kuipers, B., G. J. van Noort, J. Vosjan, and G. J. Herndl (2000), Dielperiodicity of bacterioplankton in the euphotic zone of the subtropicalAtlantic Ocean, Mar. Ecol. Prog. Ser., 201, 13–25.
Lebaron, P., P. Servais, H. Agogue, C. Courties, and F. Joux (2001), Doesthe nucleic acid content of individual bacteria cells allows us to discri-minate between active and inactive cells in aquatic systems?, Appl. En-viron. Microbiol., 67, 1775–1782.
Leblanc, K., A. Leynaert, I. C. Fernandez, P. Rimmelin, T. Moutin,P. Raimbault, J. Ras, and B. Queguiner (2005), A seasonal study of diatomdynamics in the North Atlantic during the POMME experiment (2001):Evidence for Si limitation of the spring bloom, J. Geophys. Res.,110, C07S14, doi:10.1029/2004JC002621.
Le Cann, B., M. Assenbaum, J.-C. Gascard, and G. Reverdin (2005), Ob-served mean and mesoscale upper ocean circulation in the midlatitudenortheast Atlantic, J. Geophys. Res., 110, C07S05, doi:10.1029/ 2004JC002768.
Levitus, S., and T. P. Boyer (1994), World Ocean Atlas 1994, vol. 4,Temperature, NOAA Atlas NESDIS 4, 129 pp., Natl. Oceanic and Atmos.Admin., Silver Spring, Md.
Levitus, S., R. Burgett, and T. P. Boyer (1994), World Ocean Atlas 1994,vol. 3, Salinity, NOAA Atlas NESDIS 3, 111 pp., Natl. Oceanic andAtmos. Admin., Silver Spring, Md.
Li, W. K. W., and W. G. Harrison (2001), Chlorophyll, bacteria and pico-phytoplankton in ecological provinces of the North Atlantic, Deep SeaRes., Part II, 48, 2271–2293.
Li, W. K. W., J. F. Jellett, and P. M. Dickie (1995), DNA distributions inplanktonic bacteria stained with TOTO or TO-PRO, Limnol. Oceanogr.,40, 1485–1495.
Li, W. K. W., E. J. H. Head, and W. G. Harrison (2004), Macroecologicallimits of heterotrophic bacterial abundance in the ocean, Deep Sea Res.,Part I, 51, 1529–1540.
Lochte, K., P. K. Bjornsen, H. Giesenhagen, and A. Weber (1997), Bacterialstanding stock and production and their relation to phytoplankton in theSouthern Ocean, Deep Sea Res., Part II, 44, 321–340.
Long, R. A., and F. Azam (2001), Microscale patchiness of bacterioplank-ton assemblage richness in seawater, Aquat. Microbiol. Ecol., 26, 103–113.
Maixandeau, A. (2004), La pompe biologique: Fonctionnement de la com-munaute microbienne et relation avec le contexte hydrodynamique, Ph.D.thesis, Univ. de la Mediterranee, Marseille, France.
Martin, A. P. (2003), Phytoplankton patchiness: The role of lateral stirringand mixing, Prog. Oceanogr., 57, 125–174.
Martin, A. P., and K. J. Richards (2001), Mechanisms for vertical nutrienttransport within a North Atlantic mesoscale eddy, Deep Sea Res., Part II,48, 757–773.
Martin, A. P., K. J. Richards, and M. J. R. Fasham (2001), Phytoplanktonproduction and community structure in an unstable frontal region, J. Mar.Syst., 28, 65–89.
McGillicuddy, D. J., Jr., and A. R. Robinson (1997), Eddy-induced nutrientsupply and new production in the Sargasso Sea, Deep Sea Res., Part I,44, 1427–1450.
Memery, L., G. Reverdin, J. Paillet, and A. Oschlies (2005), Introduction tothe POMME special section: Thermocline ventilation and biogeochemicaltracer distribution in the northeast Atlantic Ocean and impact of mesoscaledynamics, J. Geophys. Res., doi:10.1029/2005JC002976, in press.
Morel, A., and J. F. Berthon (1989), Surface pigments, algal biomass pro-files, and potential production of the euphotic layer: Relationships rein-vestigated in view of remote-sensing applications, Limnol. Oceanogr., 34,1545–1562.
Morel, A., and S. Maritorena (2001), Bio-optical properties of oceanicwaters: A reappraisal, J. Geophys. Res., 106, 7163–7180.
Mosseri, J., B. Queguiner, P. Rimmelin, N. Leblond, and C. Guieu (2005),Silica fluxes in the northeast Atlantic frontal zone of Mode Water for-mation (38�– 45�N, 16�– 22�W) in 2001 – 2002, J. Geophys. Res.,110, C07S19, doi:10.1029/2004JC002615.
Naganuma, T. (1997), Abundance and production of bacterioplankton alonga transect of Ise Bay, Japan, J. Oceanogr., 53, 579–583.
Nielsen, T. G., and K. Richardson (1989), Food chain structure of the NorthSea plankton communities: Seasonal variations of the role of the micro-bial loop, Mar. Ecol. Prog. Ser., 56, 75–87.
Peters, F., C. Marasse, H. Havskum, F. Rassoulzadegan, J. R. Dolan,M. Alcarez, and J. M. Gasol (2002), Turbulence and the microbial foodweb: Effects on bacterial losses to predation and on community structure,J. Plankton Res., 24, 321–331.
Siegel, D. A., R. Iturriaga, R. R. Bidigare, H. Pak, R. C. Smith, T. D.Dickey, J. Marra, and K. S. Baker (1990), Meridional variations of thespringtime phytoplankton community in the Sargasso Sea, J. Mar. Res.,48, 379–412.
Siegel, D. A., S. C. Doney, and J. A. Yoder (2002), The North Atlanticspring phytoplankton bloom and Sverdrup’s Critical Depth hypothesis,Science, 296, 730–733.
Sieracki, M. E., E. M. Haugen, and T. L. Cucci (1995), Overestimation ofheterotrophic bacteria in the Sargasso Sea: Direct evidence by flow andimaging cytometry, Deep Sea Res., Part I, 42, 1399–1409.
Simon, M., B. C. Cho, and F. Azam (1992), Significance of bacterialbiomass in lakes and the ocean: Comparison to phytoplankton biomassand biogeochemical implications, Mar. Ecol. Prog. Ser., 86, 103–110.
Sournia, A. (1992), Frontal studies in France—JGOFS: A four year sum-mary, Ann. Inst. Oceanogr., 69, 47–55.
Stramma, L. (1984), Geostrophic transport in the warm water sphere of theeastern subtropical North Atlantic, J. Mar. Res., 42, 537–558.
Sverdrup, H. U. (1953), On conditions for the vernal blooming of phyto-plankton, J. Conseil Int. Explor. Mer, 18, 287–295.
Treguer, P., and P. Le Corre (1975), Manuel d’analyses des sels nutritifsdans l’eau demer (Utilisation de l’Autoanalyser II), 2nd ed., report, 110 pp.,Lab. de Chim. Mar. Univ. e de Bretagne Occident., Brest, France.
Troussellier, M., C. Courties, P. Lebaron, and P. Servais (1999), Flowcytometric discrimination of bacterial populations in seawater based onSYTO 13 staining of nucleic acids, FEMS Microbiol. Ecol., 29, 319–330.
Wheeler, P. A., and D. L. Kirchman (1998), Utilization of inorganic andorganic nitrogen by bacteria in marine systems, Limnol. Oceanogr., 31,998–1009.
Yanada, M., T. Yokokawa, C. W. Lee, and H. Tanaka (2000), Seasonalvariation of two different heterotrophic bacterial assemblages in subarcticcoastal seawater, Mar. Ecol. Prog. Ser., 204, 289–292.
Zubkov, M. V., B. M. Fuchs, P. H. Burkill, and R. Amann (2001), Compar-ison of cellular and biomass specific activities of dominant bacterioplank-ton groups in stratified waters of the Celtic Sea, Appl. Environ.Microbiol., 67, 5210–5218.
�����������������������G. Caniaux, Centre National de Recherche Meteorologique, 42 Avenue
G. Coriolis, F-31057 Toulouse Cedex, France. ([email protected])M. Denis, D. Lefevre, and M. Thyssen, Centre d’Oceanologie de
Marseille, Laboratoire de Microbiologie, Geochimie et Ecologie Marines,Centre National de la Recherche Scientifique, UMR 6117, Universite de laMediterranee, 163 avenue de Luminy, Case 901, F-13288 Marseille Cedex09, France. ([email protected]; [email protected]; [email protected])C. I. Fernandez, Centre d’Oceanologie de Marseille, Laboratoire
d’Oceanographie et de Biogeochimie, Campus de Luminy, F-13288Marseille Cedex 09, France. ([email protected])J. Ras, Laboratoire d’Oceanographie de Villefranche, B.P. 28, F-06234
Villefranche-sur-Mer Cedex, France. ([email protected])
C07S16 THYSSEN ET AL.: BACTERIA IN THE NE ATLANTIC OCEAN
16 of 16
C07S16

Figure
3.
Spatialdistributionofintegratedvalues
(over
0–300m)of(a)Tchla
content(m
gChlam
�2),(b)nitrate
concentration(m
molNO3m
�2),and(c)HNA2integratedabundance
derived
from
thedifference
betweentotalbacteriaand
HNA1+LNA
integratedabundances.
C07S16 THYSSEN ET AL.: BACTERIA IN THE NE ATLANTIC OCEAN C07S16
5 of 16

Figure 6. Upper layer geostrophic current field superimposed on the bacteria abundances integratedbetween 0 and 300 m depth. (a) LNA integrated values (1013 cells m�2). (b) HNA1 integrated values(1013 cells m�2). Labeled mesoscale features: A1 and A2, anticyclonic gyre; C4, cyclonic gyre.
C07S16 THYSSEN ET AL.: BACTERIA IN THE NE ATLANTIC OCEAN C07S16
10 of 16