Embed Size (px)
Citation preview

Spatial distribution models
From the truth to the whole truth?
Senait D. Senay & Sue P. Worner
Outline
Alien invasive species (AIS)
Species distribution models (SDMs) and their use to detect and monitor AIS
Uncertainty in SDM results
Suggested technical improvements
Conclusion

Alien invasive species (AIS)
Cause Economical, Ecological and Health problems
Increased trade and tourism intensified AIS dispersal
Usually scarce or no complete bio-geographical information available
When the species is small or cryptic as in most insects are, it makes detection and control difficult
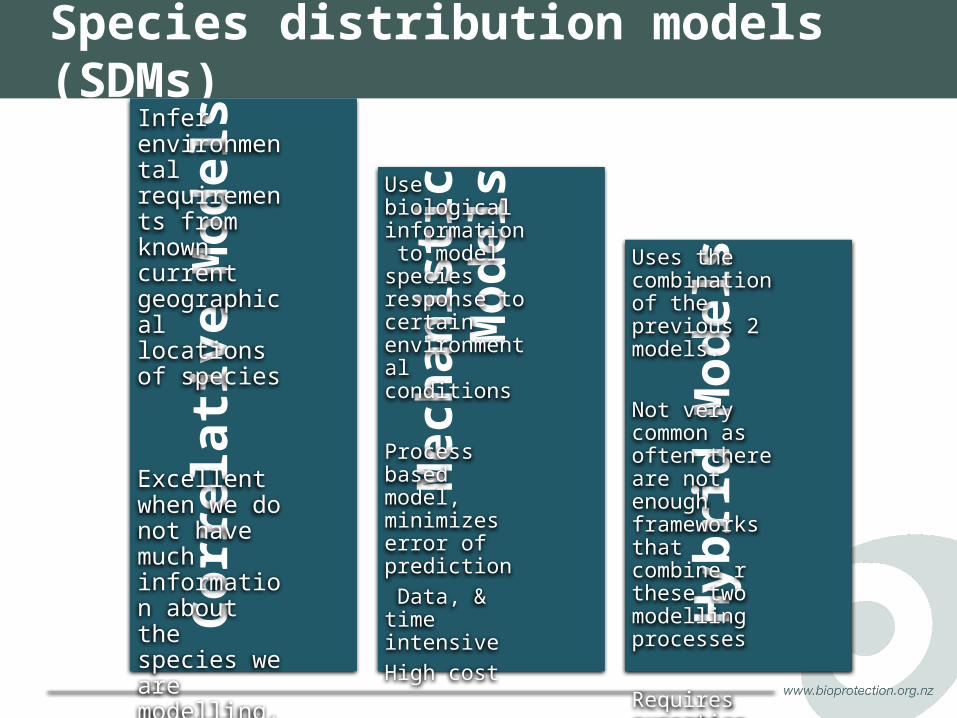
Species distribution models (SDMs)
Hyb
rid M
odel
s
Mec
hani
stic
Mod
els
Corr
elati
ve M
odel
sInfer environmental requirements from known current geographical locations of species
Excellent when we do not have much information about the species we are modelling.
Use biological information to model species response to certain environmental conditions
Process based model, minimizes error of prediction Data, & time intensiveHigh cost
Uses the combination of the previous 2 models.
Not very common as often there are not enough frameworks that combine r these two modelling processes
Requires expertise
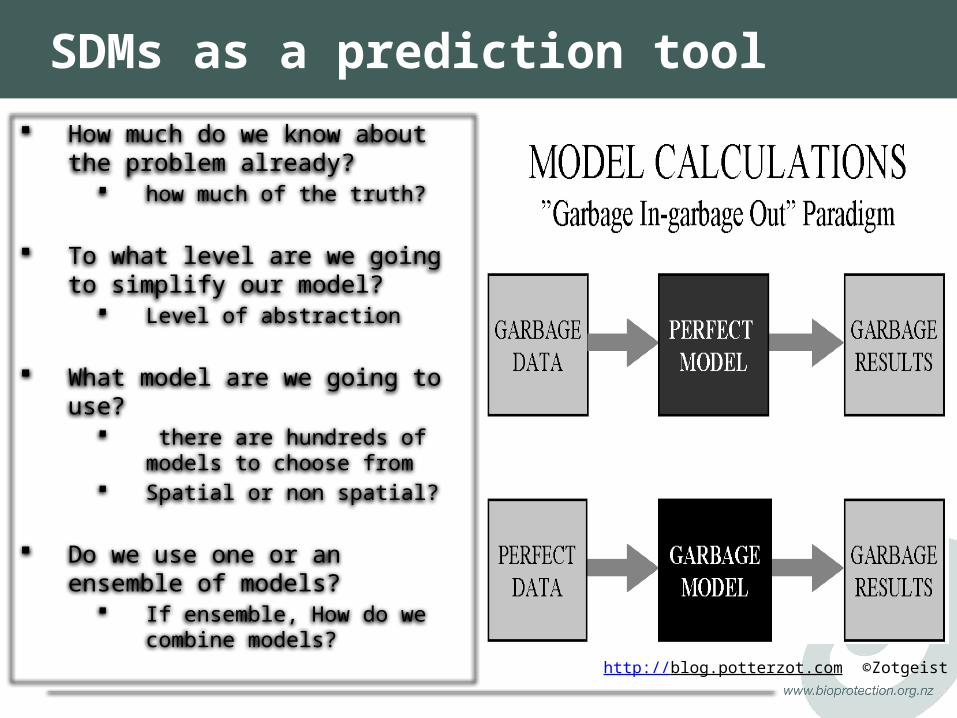
SDMs as a prediction tool How much do we know about the
problem already? how much of the truth?
To what level are we going to simplify our model?
Level of abstraction
What model are we going to use? there are hundreds of models to
choose from Spatial or non spatial?
Do we use one or an ensemble of models?
If ensemble, How do we combine models?
http://blog.potterzot.com ©Zotgeist 2007
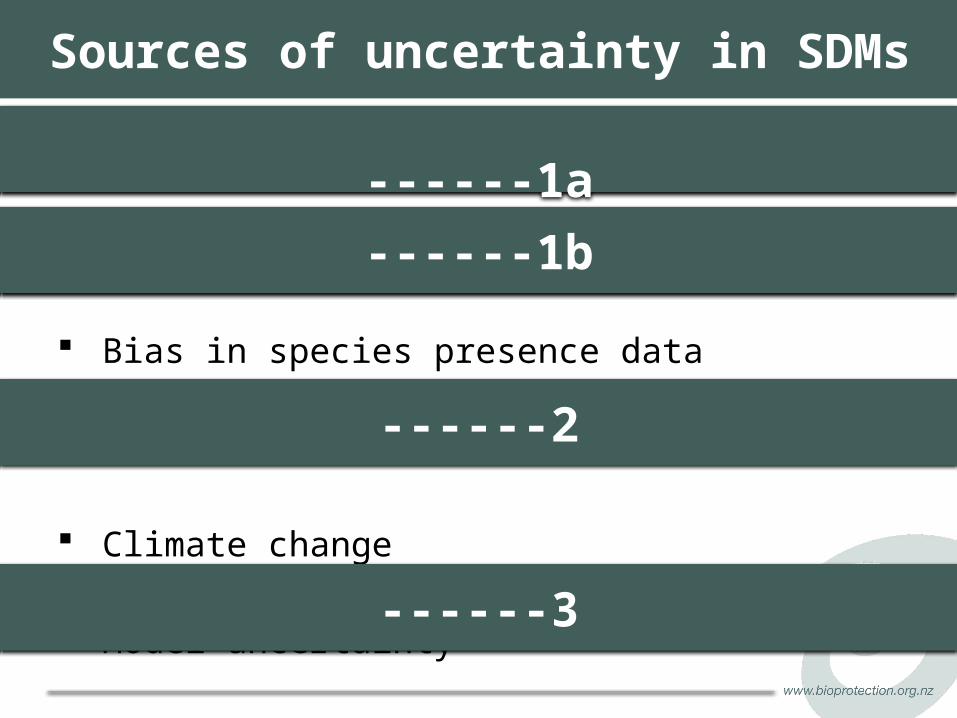
Sources of uncertainty in SDMs
Environmental data (Predictors)
Data collinearity
Bias in species presence data
Lack of absence data
Climate change
Model uncertainty
------1a
------1b
------2
------3
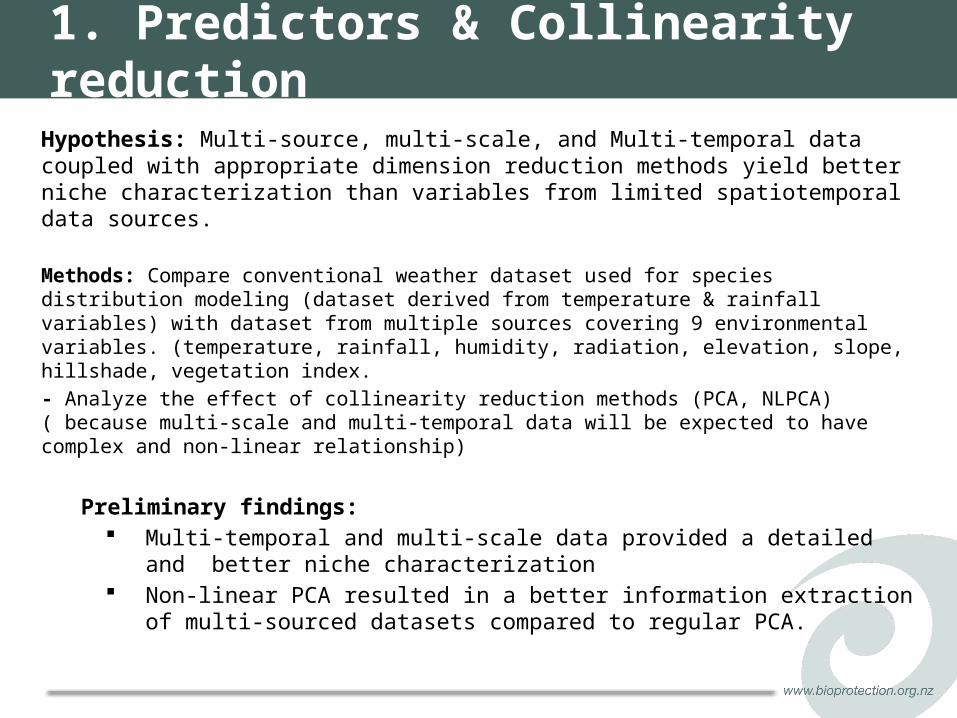
1. Predictors & Collinearity reduction
Hypothesis: Multi-source, multi-scale, and Multi-temporal data coupled with appropriate dimension reduction methods yield better niche characterization than variables from limited spatiotemporal data sources.
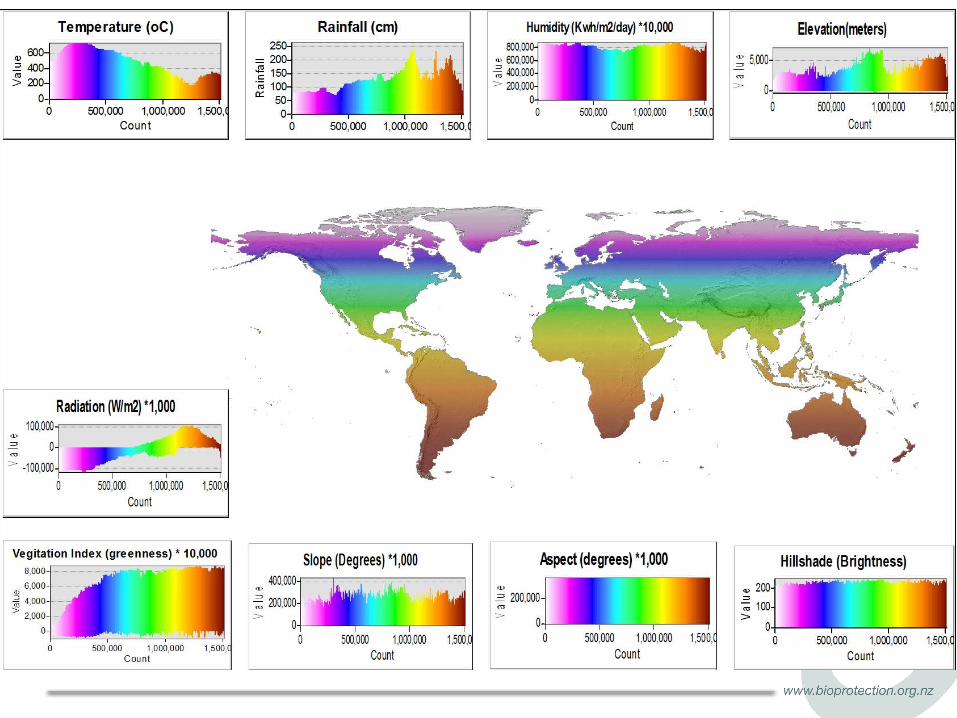
Methods: Compare conventional weather dataset used for species distribution modeling (dataset derived from temperature & rainfall variables) with dataset from multiple sources covering 9 environmental variables. (temperature, rainfall, humidity, radiation, elevation, slope, hillshade, vegetation index.- Analyze the effect of collinearity reduction methods (PCA, NLPCA) ( because multi-scale and multi-temporal data will be expected to have complex and non-linear relationship)
Preliminary findings: Multi-temporal and multi-scale data provided a detailed and better
niche characterization Non-linear PCA resulted in a better information extraction of multi-
sourced datasets compared to regular PCA.
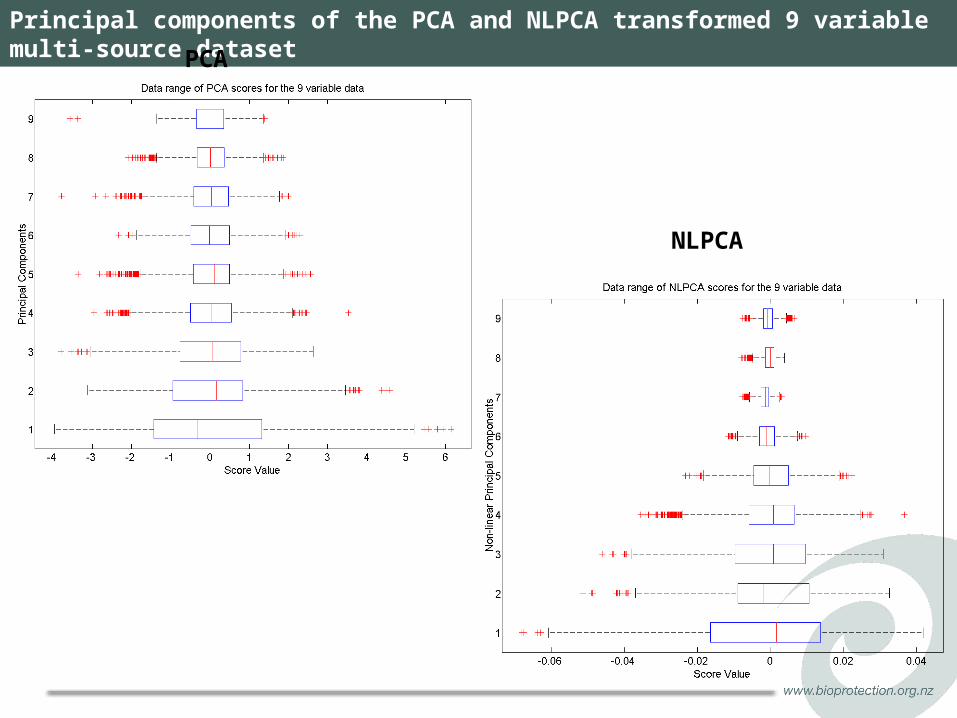
Principal components of the PCA and NLPCA transformed 9 variable multi-source dataset
NLPCA
PCA
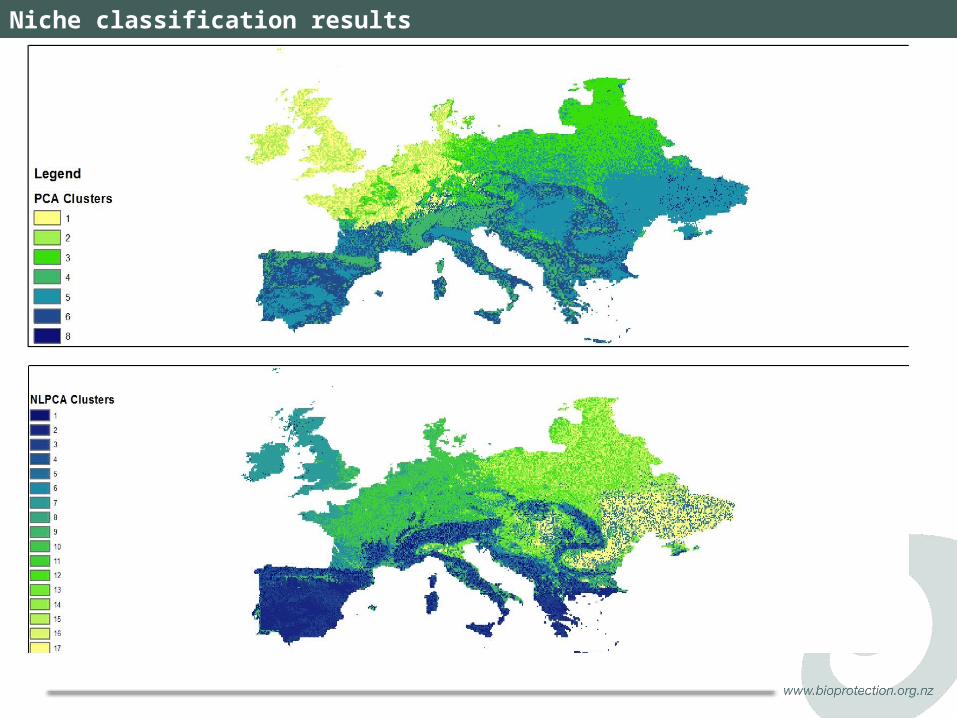
Niche classification results
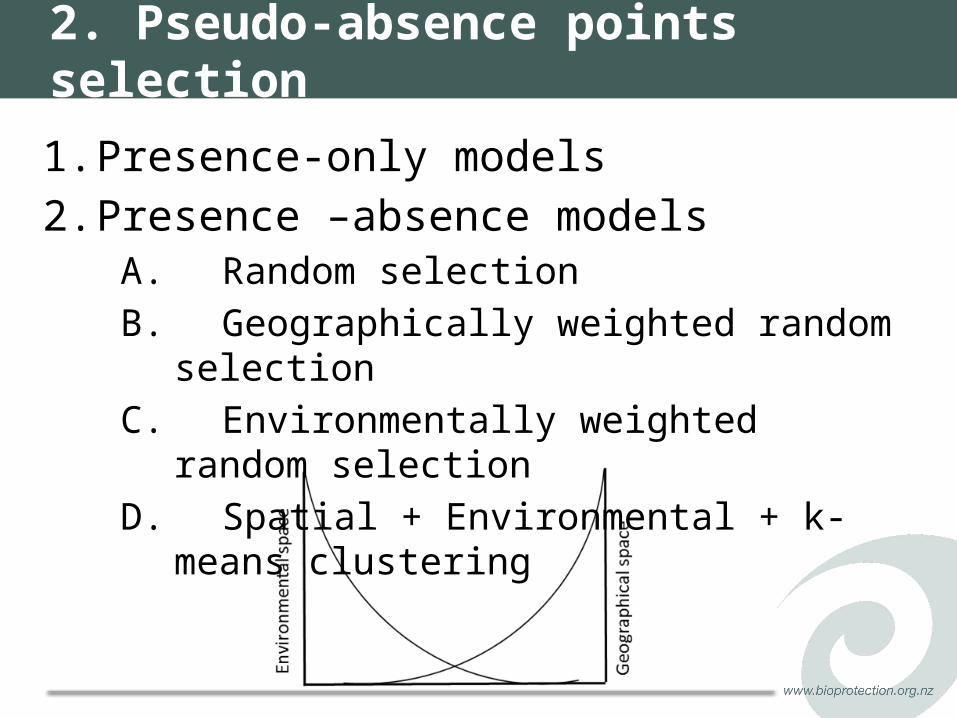
2. Pseudo-absence points selection
1. Presence-only models2. Presence –absence models
A. Random selectionB. Geographically weighted random
selectionC. Environmentally weighted random
selectionD. Spatial + Environmental + k-means
clustering
Hypothesis: pseudo-absence method that considers both spatial and environmental space better characterizes species ranges leading to an improved model prediction.
Methods: step 1: determine the distance at which the background data is bound with presence data for potential pseudo-absence selection.
2. Do environmental background profiling using one class support vector machine (OCSVM )
3. Do K-means clustering to choose the final set of points to represent pseudo-absences. Models used: LOG, NB, CART, CTREE, KNN, SVM, NNET. Models that needed separate or detail parameterization were optimized before they are compared with the other models (these are, KNN, SVM, NNET)
3-step pseudo-absence selection method
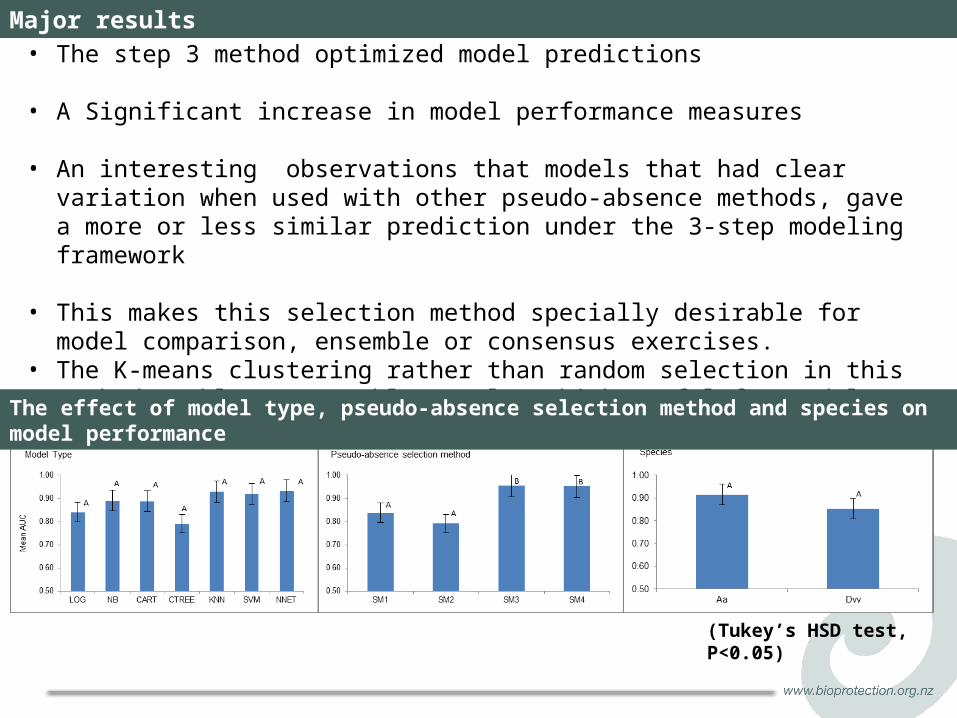
• The step 3 method optimized model predictions
• A Significant increase in model performance measures
• An interesting observations that models that had clear variation when used with other pseudo-absence methods, gave a more or less similar prediction under the 3-step modeling framework
• This makes this selection method specially desirable for model comparison, ensemble or consensus exercises.
• The K-means clustering rather than random selection in this method enables repeatable results which useful for model comparison exercises.
Major results
The effect of model type, pseudo-absence selection method and species on model performance
(Tukey’s HSD test, P<0.05)
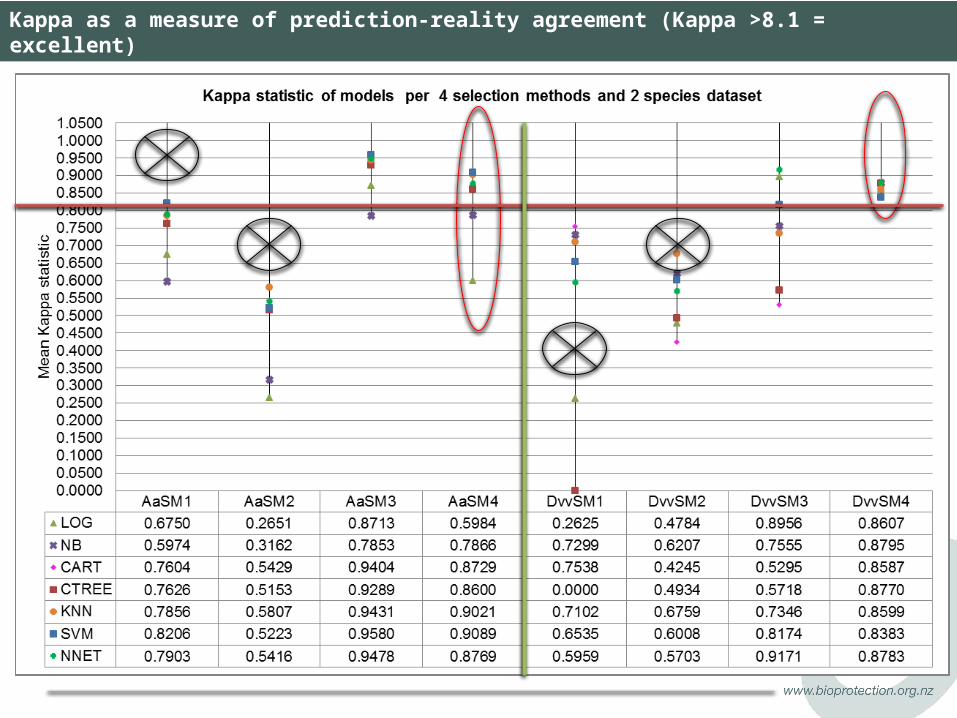
Kappa as a measure of prediction-reality agreement (Kappa >8.1 = excellent)
SM1 SM2 SM3 SM40
102030405060
Pseudo-absence selection method
% p
redi
icte
d ar
ea
(New
Zea
land
)
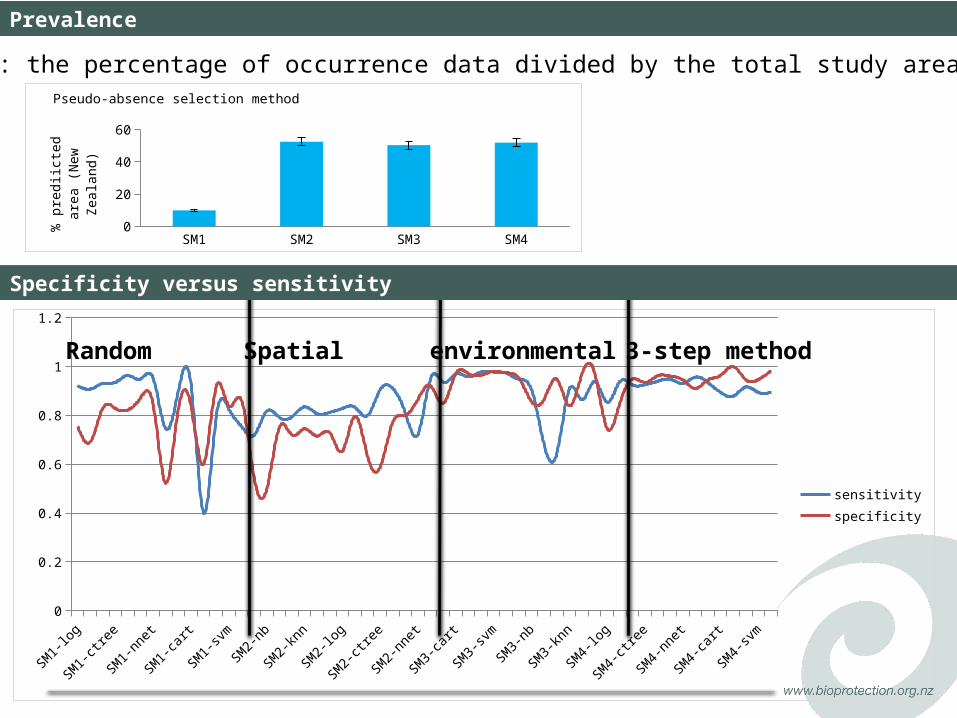
Prevalence
Prevalence: the percentage of occurrence data divided by the total study area
SM1-lo
g
SM1-ca
rt
SM1-kn
n
SM1-nnet
SM1-nb
SM1-ct
ree
SM1-sv
m
SM2-lo
g
SM2-ca
rt
SM2-kn
n
SM2-nnet
SM2-nb
SM2-ct
ree
SM2-sv
m
SM3-lo
g
SM3-ca
rt
SM3-kn
n
SM3-nnet
SM3-nb
SM3-ct
ree
SM3-sv
m
SM4-lo
g
SM4-ca
rt
SM4-kn
n
SM4-nnet
SM4-nb
SM4-ct
ree
SM4-sv
m0
0.2
0.4
0.6
0.8
1
1.2
sensitivityspecificity
3-step methodenvironmentalSpatialRandom
Specificity versus sensitivity
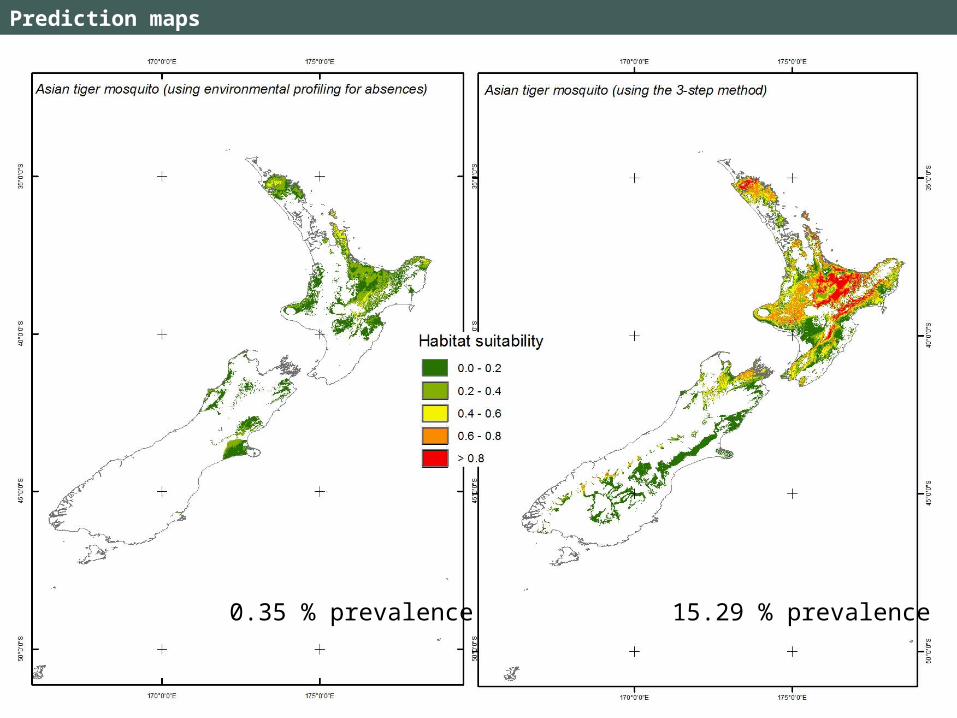
Prediction maps
0.35 % prevalence 15.29 % prevalence
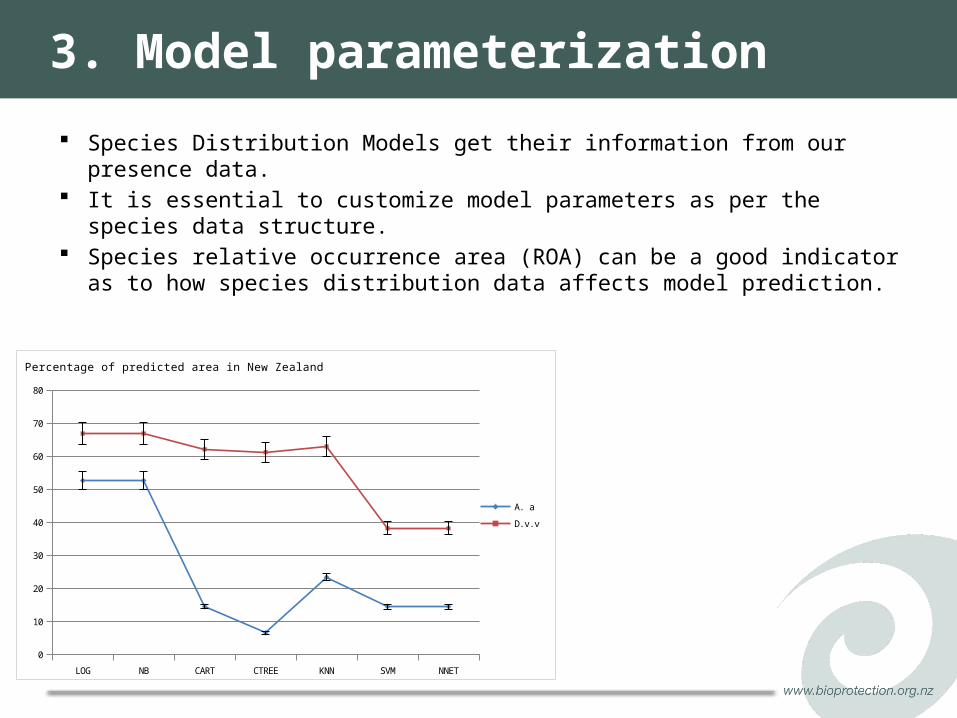
3. Model parameterization
Species Distribution Models get their information from our presence data. It is essential to customize model parameters as per the species data
structure. Species relative occurrence area (ROA) can be a good indicator as to how
species distribution data affects model prediction.
LOG NB CART CTREE KNN SVM NNET
0
10
20
30
40
50
60
70
80
Percentage of predicted area in New Zealand
A. a
D.v.v
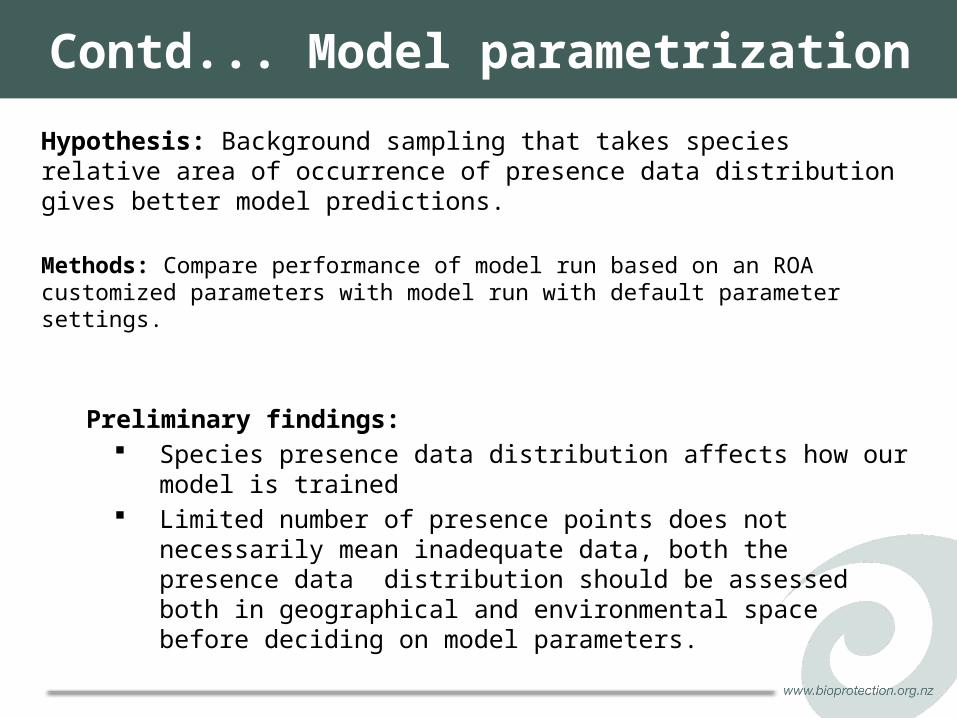
Contd... Model parametrization
Hypothesis: Background sampling that takes species relative area of occurrence of presence data distribution gives better model predictions.
Methods: Compare performance of model run based on an ROA customized parameters with model run with default parameter settings.
Preliminary findings: Species presence data distribution affects how our model is trained Limited number of presence points does not necessarily mean
inadequate data, both the presence data distribution should be assessed both in geographical and environmental space before deciding on model parameters.
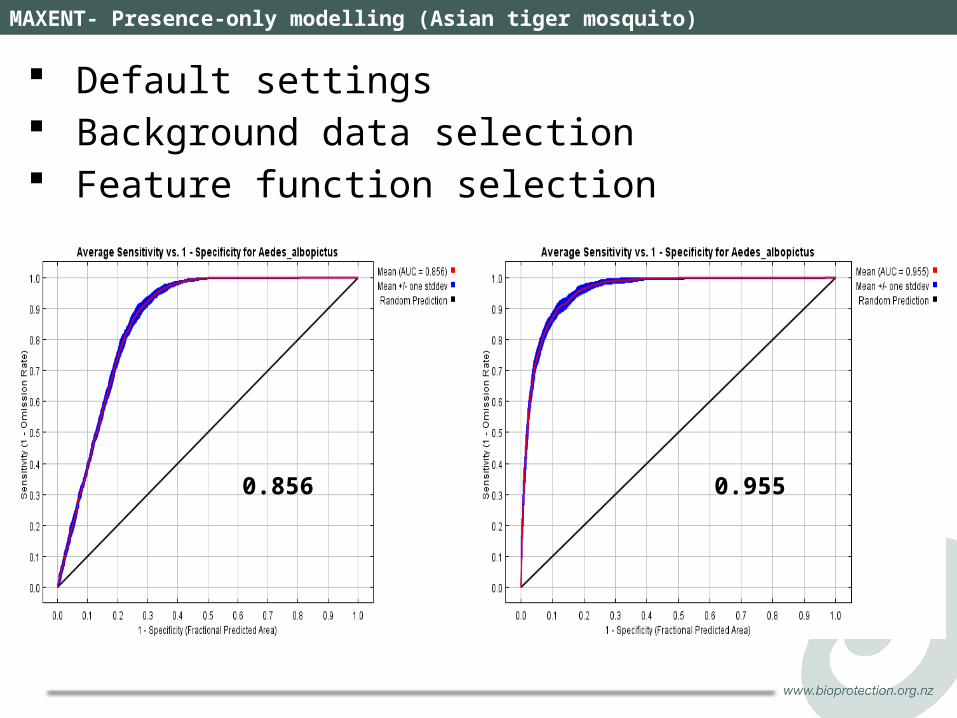
MAXENT- Presence-only modelling (Asian tiger mosquito)
Default settings Background data selection Feature function selection
0.856 0.955
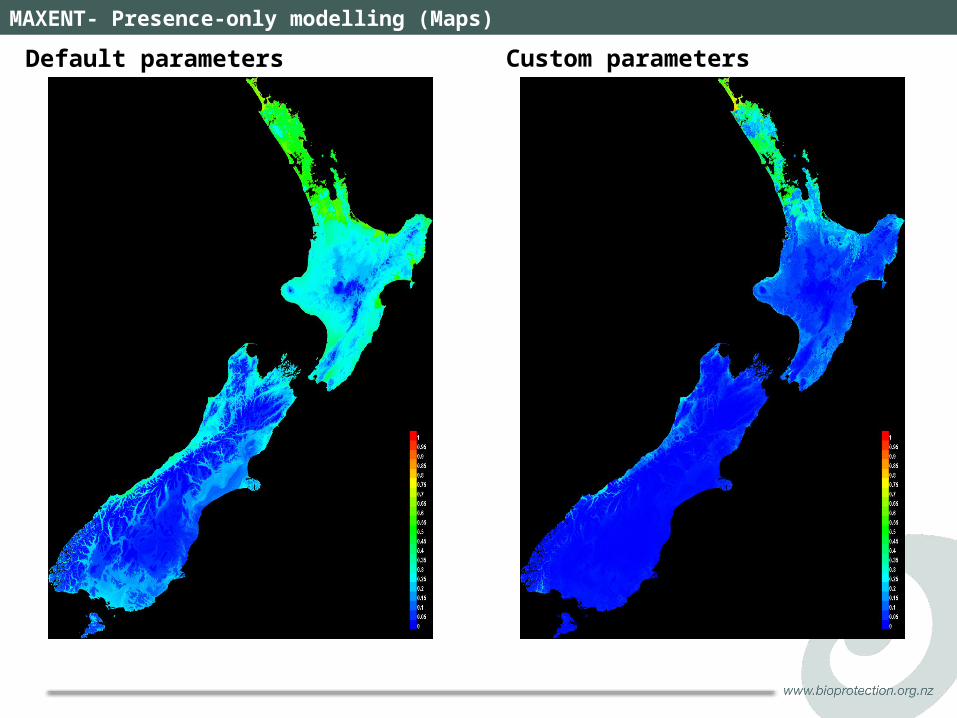
MAXENT- Presence-only modelling (Maps)
Custom parametersDefault parameters
Concluding remarks…
Robust niche characterizing helps our models to predict better, using appropriate data is important.
Pseudo-absence data sampling methods greatly affect model result uncertainty and should consider both spatial and environmental space.
Model parameterization should be customized to species data structure and not be generally applied to all cases specially in presence-only models.

Bio-Protection Research CentrePO Box 84Lincoln UniversityLincoln 7647, New ZealandP + 64 3 325 3696 F + 64 3 325 3864 www.bioprotection.org.nz
THANK YOU!