Embed Size (px)
Citation preview
ORIGINAL PAPER
Spatial changes of Extended De Martonne climaticzones affected by climate change in Iran
Jaber Rahimi & Meisam Ebrahimpour & Ali Khalili
Received: 1 December 2011 /Accepted: 25 July 2012 /Published online: 10 August 2012# Springer-Verlag 2012
Abstract In order to better understand the effect associatedwith global climate change on Iran’s climate condition, it isimportant to quantify possible shifts in different climatictypes in the future. To this end, monthly mean minimum andmaximum temperature, and precipitation from 181 synopticmeteorological stations (average 1970–2005) have beencollected from the meteorological organization of Iran. In thispaper, to study spatial changes of Iran’s climatic zones affectedby climate changes, Extended De Martonne’s classification(originally formulated by De Martonne and extended byKhalili (1992)) was used. Climate change scenarios were simu-lated in two future climates (average conditions during the2050s and the 2080s) under each of the SRES A1B and A2,for the CSIRO-MK3, HadCM3, and CGCM3 climate models.Coarse outputs of GCMswere downscaled by delta method.Weproduced all maps for three time periods (one for the current andtwo for the future) according to Extended De Martonne’s clas-sification. Finally, for each climatic zone, changes between thecurrent and the future were compared. As the main result,simulated changes indicate shifts to warmer and drier zones.For example, in the current, extra arid-cold (A1.1m2) climate iscovering the largest area of the country (21.4 %), whereas inboth A1B and A2 scenarios in the 2050s and the 2080s, extraarid-moderate (A1.1m3) and extra arid-warm (A1.1m4) will bethe climate and will occupy the largest area of the country, about21 and 38 %, respectively. This analysis suggests that the global
climate change will have a profound effect on the future distri-bution of severe aridity in Iran.
1 Introduction
There is a general scientific agreement that global climaticchange is a real problem and will affect all climatic aspects.There is considerable confidence that for obtaining crediblequantitative estimates of future climate change, particularly atcontinental and larger scales, the most advanced tools aregeneral circulation models (GCMs) (IPCC 2007b). GCMs aremathematical formulation of atmospheric, oceanic, and landsurface processes that are based on classical physical principlesused to simulate climatic patterns.Many international modelinggroups have completed simulations of present climate andfuture climate under selected IPCC SRES (Special Report onEmissions Scenarios) storylines (Nakićenović and Swart 2000)used to prepare the IPCC 4th Assessment Report (Meehl et al.2005). Among the important consequences resulting fromclimate change in arid and semi-arid lands, rank changes inclimatic zones. Identification of climate zones and theircharacteristics under climate change condition can assistpolicy makers in making decisions on climate-related planning(Virmani 1980).
Basically, climate classifications were constructed todesignate the various existing local climates to an adequatenumber of climate types, and to determine the spatialdistribution of these types based on climatic data for areference period. Thus, climate classifications are introducedin order to reflect the mean spatial climate characteristics(Beck et al. 2006). Classification methods have manyapplications in climatological studies (Golian et al. 2010).There are several classification models based on variousapproaches found in the literature (e.g. De Martonne 1926;Koppen 1936; Hare 1951; Thornthwaite and Mather 1955;
J. Rahimi (*) :M. Ebrahimpour :A. KhaliliMeteorological Division, Department of Irrigationand Reclamation Engineering,College of Soil and Water Engineering, University of Tehran,Karaj, Irane-mail: [email protected]
M. Ebrahimpoure-mail: [email protected]
A. Khalilie-mail: [email protected]
Theor Appl Climatol (2013) 112:409–418DOI 10.1007/s00704-012-0741-8
Gadgil and Inyengar 1980). Divisions of climate in Iran havebeen studied based on different methods such as Köppen(Ganji 1955; Adle 1960; Jawadi 1966), Thornthwaite (KalimiNikfard 1982) and De Martonne (Khalili 1992). Althoughthese methods are suitable for capturing climatic character-istics, their compatibility with ecological zones and vegetationcover in Iran either has not been considered or the resultsindicated incompatibility.
In many researches, the classification has been used todetect recent changes in global and regional climate types(Diaz and Eischeid 2007; Beck et al. 2006; Rubel andKottek 2010). For example, the most extreme climatic zonesof the earth in the widely used Koppen classification systemshowed statistically significant shifts; the global areas coveredby tropical climate were expanded, whereas the tundra regionswere reduced in size (Fraedrich et al. 2001; Wang andOverland 2005). Shifts from colder to warmer climate typeshave occurred in Europe (Gerstengarbe and Werner 2009;Jylhä et al. 2010). Also, shifts in agro-climatic zones areconsidered for the application of the climate change scenarios(Metzger et al. 2006; Rounsevell et al. 2006). Climate modelshave been used for studying climate and climate change inorder to project the moves of the boundaries of climate zonesin the future (Lohmann et al. 1993; Kalvova et al. 2003;
Gnanadesikan and Stouffer 2006; de Castro et al. 2007; Gaoand Giorgi 2008; Jylhä et al. 2010; Jokinen and Jylhä 2011).
Khalili (1993) showed that the original De Martonnearidity index (De Martonne 1926) does not match withvegetation cover in Iran, and therefore he modified it togain a better consistency between divisions of climateand vegetation. In this paper, the Extended De Martonneclassification method is briefly reviewed. The main objectiveof this study is mapping climate zones of Iran according to thatmethod, considering three climatic periods, one currentclimate: 1970–2005, and two future climates: the 2050s andthe 2080s affected by climate change (based on three GCMsoutputs and A1B and A2 scenarios), and showing howchanges will occur among different climate zones across Iran.
2 Materials and methods
2.1 Study area
Iran is situated in the south-western part of Asia with area ofabout 1,648,000 km2. This country is stretched in 25–45°Nand 44–64°E. Iran has a very variable climate due to someeffective factors like widespread area along latitude, presence
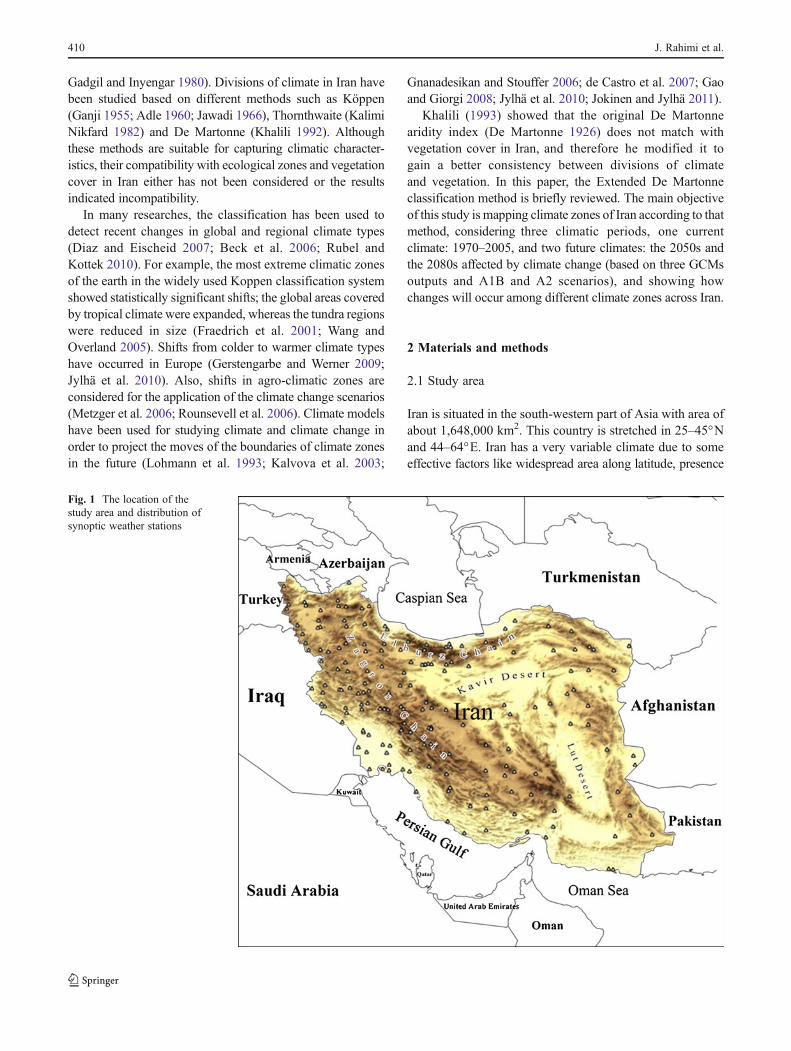
Fig. 1 The location of thestudy area and distribution ofsynoptic weather stations
410 J. Rahimi et al.
of the Elburz Chain in the north, the Zagros Chain in the west,two large deserts (the Lut desert and the Kavir desert) lying inthemiddle of Iranian Plateau and intensive elevation variability(from −25 m in coastal regions of the Caspian Sea to 5,600 min central Elburz Chains) (Fig. 1). Since the country is placedin the arid belt of northern hemisphere (30–60°N), arid andsemi-arid climate cover the majority of area (Ganji 1968).
2.2 Data and method of data analysis
2.2.1 Climate data
The mean monthly value records of temperature andprecipitation were obtained for total period of historicrecords of 181 synoptic stations from the Islamic Republic ofIran Meteorology Organization (IRIMO 2007). The length ofthe record common among the stations was 1970 to 2005. Thespatial distribution of the weather stations across the country isrelatively uniform. In general, all regions and relief formspossess meteorological stations measuring air temperatureand precipitation. The most part of the central regions areplaced where topography is generally flat and there is notintensive climatic gradient. So, using rather few synopticstations in these regions is unlikely to affect the results.Figure 1 shows the distribution of synoptic stations in studyarea. Data reconstruction, where required, was performedusing a multivariate regression method between surroundingstations (Eischeid et al. 1995).
2.2.2 GCM outputs data
In this study, having used SRESA1B (balance across sources)and A2 (highest emissions scenario analyzed), we obtainedtemperature and precipitation outputs with three GCMs(CSIRO-MK3, HadCM3 and CGCM3) from CanadianClimate Change Scenarios Network to project the futurecondition (http://www.cccsn.ec.gc.ca). A larger rectangulardomain than Iran boundaries (latitude 40.45–24.85°N,longitude 43.24–64.34°E) was selected in order to generatebaseline and future maps. All gridded network points, insidethe given domain, in three averaged time periods (baseline,1970–2005; the 2050s and the 2080s) were interpolated usinggeographical information system (GIS; ArcGIS 9.2) and mapsof spatial distributions were created.
2.2.3 Extended De Martonne classification
De Martonne's climatic classification (De Martonne 1926) isbased on aridity index values, Ai ¼ P T þ 10ð Þ= , where P isthe mean annual precipitation (millimeters) and T is the meanannual temperature (degrees Celsius). Many researchescarried out using this classification in the last decades showedthat despite this index have practical usage in some specific
regions (Krishnan 1980), yet it is not individually able toidentify climatic characteristics of regions with complextopography like Iran (Khalili 2004). According to DeMartonne's formula, the effect of temperature on aridity indexin mountainous areas and high-cold regions is more importantthan the effect of rainfall amount. That is why the aridity indexin high Zagros Range is almost equal to the rainy Caspian Seacoast of Iran, where the vegetation covers are very different.There is the same condition in desert regions and southernwarm regions. Khalili (1992) modified De Martonne'sclassification, attempting tomatch it to Iran's vegetation cover.Therefore, the list of trees and shrubs (Sabeti 1976) were
Table 1 Extended De Martonne classification (Khalili 1992)
Main climate Thermal sub-climate Climate type
Extra arid Very cold (m<−7) A1.1m1
A1.1 (aridity index<5) Cold (−7≤m<0) A1.1m2
Moderate (0≤m<5) A1.1m3
Warm (m≥5) A1.1m4
Arid Very cold (m<−7) A1.2m1
A1.2 (5≤aridity index<10) Cold (−7≤m<0) A1.2m2
Moderate (0≤m<5) A1.2m3
Warm (m≥5) A1.2m4
Semi-arid Very cold (m<−7) A2m1
A2 (10≤aridity index<20) Cold (−7≤m<0) A2m2
Moderate (0≤m<5) A2m3
Warm (m≥5) A2m4
Mediterranean Very cold (m<−7) A3m1
A3(20≤aridity index<24) Cold (−7≤m<0) A3m2
Moderate (0≤m<5) A3m3
Warm (m≥5) A3m4
Sub humid Very cold (m<−7) A4m1
A4 (24≤aridity index<28) Cold (−7≤m<0) A4m2
Moderate (0≤m<5) A4m3
Warm (m≥5) A4m4
Humid Very cold (m<−7) A5m1
A5 (28≤aridity index<35) Cold (−7≤m<0) A5m2
Moderate (0≤m<5) A5m3
Warm (m≥5) A5m4
Per-humid A Very cold (m<−7) A6m1
A6 (35≤aridity index<55) Cold (−7≤m<0) A6m2
Moderate (0≤m<5) A6m3
Warm (m≥5) A6m4
Per-humid B Very cold (m<−7) A7m1
A7 (aridity index≥55) Cold (−7≤m<0) A7m2
Moderate (0≤m<5) A7m3
Warm (m≥5) A7m4
m mean minimum temperature in the coldest month of year (degreesCelsius)
Spatial changes of Extended De Martonne climatic zones 411
gathered and categorized according to De Martonne's aridityindex and their thermal conditions.
According to this revision, each climate is identifiedusing two parts (Table 1). “Ai” is represented in ExtendedDe Martonne's index similar to the original De Martonneclassification, but there is only a small difference due to aridzones in the central deserts; the arid parts will be dividedinto two parts: “extra arid” and “arid”. So, this classificationincludes eight main classes (Table 1). The second part “mj” isdistinguished by considering the meanminimum temperaturesof coldest month of the year. Therefore, the Extended DeMartonne's index is comprised from four thermal groupsincluding “very cold, m1”, “cold, m2”, “moderate, m3”, and“warm, m4”, and eight types of main climates, so DeMartonne classification is extended into 32 categoriesof climate. Hence, preparing appropriate classified list ofvegetations for each climate is possible. Also, the map ofIran's climate for 1964–1984 was prepared according to thismethod (Khalili et al. 1992). Thermal thresholds used inthis classification are those that Emberger et al. (1963) ap-plied to explain ecological zones of Mediterranean climateregions (Sabeti 1969).
2.2.4 Mapping current climate
We produced our maps according to three time periods;the current (averaged from historical records until 2005),mid-period of the century (averaged over the 2050sdecade) and late period of the century (averaged overthe 2080s decade). Current climate maps were producedby the means of 181 synoptic stations' monthly historicalrecords. For each month, we obtained mean monthlyminimum temperature, maximum temperature (meanmonthly temperature used to Extended De Martonne'sclassification calculated from average of minimum andmaximum temperatures), and mean monthly precipitation.The coldest month of the year was obtained from meanmonthly temperatures. We used the Kriging interpolationtechnique (with a spherical semivariogram, variable searchradius and based on the ten nearest data points (Legendreand Fortin 1989)) to create minimum temperature, maximumtemperature, and precipitation maps at a 2×2 arc-minutespatial resolution. These surfaces were used to createExtended De Martonne's classification according to itsformula.
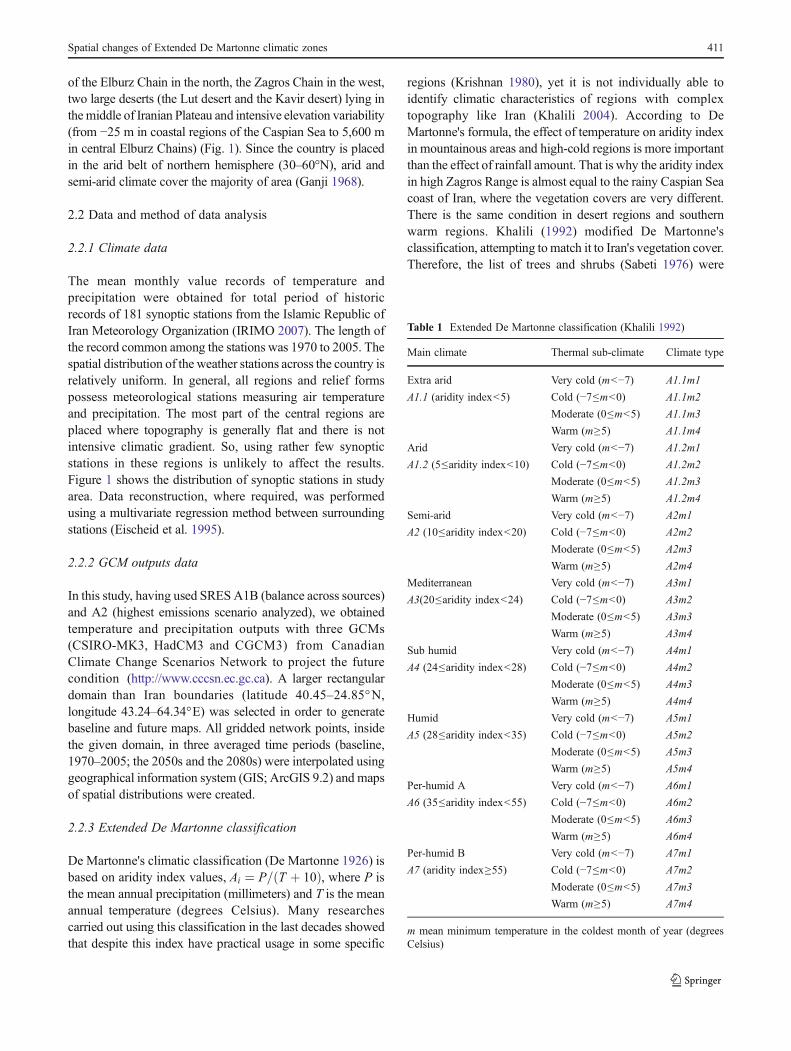
Fig. 2 Map of the mainclimatic zones according tothe Extended De Martonneclassification in Iran underthe current climate condition(1970–2005)
412 J. Rahimi et al.

2.2.5 Projection future climate: delta method
In this method, simply, an interpolated layer of changes inclimate (deltas or anomalies) was produced—with exactlythe same characteristics of the current climate map—basedon SRES A1B and A2 emissions scenarios (IPCC 2007b),then this layer and the current climate map were used toproject future condition. Since the greatest source of uncertaintyassociated with climate change studies arises from therange of future scenarios produced by GCMs (Wiley andPalmer 2008), and also none of these models can beclearly identified as being more accurate than the others
(Luedeling et al. 2009), averaged from outputs of threegeneral circulation models (CSIRO-MK3, HadCM3 andCGCM3) were used. On the other hand, the individualmodel errors are eliminated and the ensemble uncertaintyreduces by applying the average of an ensemble ofGCMs (Sperna Weiland et al. 2011).
The delta method uses differences between current andsimulated future climate conditions from three generalcirculation models added to observed time series of climatevariables (Hay et al. 2000). The method assumes that futuremodel biases for both mean and variability will be the same asthose in present-day simulations (Bader et al. 2008; Ramirez
Table 2 Area transfers among different climates of Extended De Martonne classification in three climatic periods based on A1B emission scenario
Climate classification Areas (km2, %)
Current 2050s 2080s
km2 % % km2 % % km2 % %
A1.1 m1 13,103.1 0.795 46.085 16,486.4 1.000 56.544 13,185.5 0.800 56.210m2 352,738.4 21.404 284,798.8 17.281 287,586.2 17.451
m3 196,069.6 11.897 347,608.5 21.093 328,132.9 19.911
m4 197,572.3 11.989 282,946.6 17.169 297,434.1 18.048
A1.2 m1 73,139.0 4.438 24.510 79,607.9 4.831 23.775 59,802.2 3.629 26.131m2 228,396.6 13.859 213,754.9 12.971 238,567.1 14.476
m3 56,132.5 3.406 52,485.1 3.185 61,801.1 3.750
m4 46,254.8 2.807 45,956.6 2.789 70,475.3 4.276
A2 m1 198,561.9 12.049 22.909 92,353.3 5.604 17.409 59,160.4 3.590 16.065m2 149,485.0 9.071 171,521.1 10.408 172,859.8 10.489
m3 28,441.9 1.726 22,061.4 1.339 25,233.9 1.531
m4 1,044.6 0.063 971.9 0.059 7,500.5 0.455
A3 m1 37,421.6 2.271 3.198 9,737.8 0.591 1.121 4,217.9 0.256 0.760m2 13,249.7 0.804 4,786.4 0.290 3,851.1 0.234
m3 2,034.2 0.123 3,667.7 0.223 2,145.6 0.130
m4 0.0 0.000 275.1 0.017 2,310.7 0.140
A4 m1 16,200.2 0.983 1.421 2,365.7 0.144 0.452 660.2 0.040 0.257m2 4,270.0 0.259 2,164.0 0.131 953.6 0.058
m3 2,950.5 0.179 2,017.2 0.122 1,027.0 0.062
m4 0.0 0.000 898.6 0.055 1,595.5 0.097
A5 m1 13,011.4 0.790 1.190 495.1 0.030 0.255 110.0 0.007 0.191m2 2,968.8 0.180 696.9 0.042 220.1 0.013
m3 3,628.5 0.220 2,108.9 0.128 1,797.2 0.109
m4 0.0 0.000 898.6 0.055 1,027.0 0.062
A6 m1 1,832.6 0.111 0.653 36.7 0.002 0.445 18.3 0.001 0.385m2 934.6 0.057 0.0 0.000 0.0 0.000
m3 7,990.1 0.485 7,170.4 0.435 4,236.2 0.257
m4 0.0 0.000 128.4 0.008 2,090.6 0.127
A7 m1 36.7 0.002 0.034 0.0 0.000 0.000 0.0 0.000 0.000m2 0.0 0.000 0.0 0.000 0.0 0.000
m3 531.5 0.032 0.0 0.000 0.0 0.000
m4 0.0 0.000 0.0 0.000 0.0 0.000
100 100 100
Spatial changes of Extended De Martonne climatic zones 413

and Jarvis 2010). While these assumptions might holdtrue in a number of cases, they could be wrong inhighly heterogeneous landscapes. Anomalies are interpolatedamong GCM grid outputs, and are then applied to a currentclimate map as the baseline period, using absolute sumfor temperatures, and addition of relative changes forprecipitation.
3 Results
Current main climatic zones in Iran according to theExtended De Martonne classification, based on precipitationand temperature data from 181 synoptic stations of IRIMO,are illustrated in Fig. 2. Under the current climate (averagedclimate from 1970 to 2005), extra arid (A1.1) climate occupies∼46 % of the total area, and arid (A1.2) climate, semi-arid(A2), Mediterranean (A3), semi-humid (A4), humid(A5),per-humid type A (A6), and per-humid type B (A7) contribute24.51, 22.90, 3.19, 1.42, 1.19, 0.65, and 0.03 %, respectively(Table 2). At first glance, obviously, about half the total area ofthe country is covered by extra-arid climate; and humid
climates including humid, per-humid A, and per-humidB cover about only 2 %.
Having applied three CGMs outputs (CSIRO-MK3,HadCM3 and CGCM3) and delta method downscaling,future mean monthly minimum temperature, maximumtemperature and precipitation (in sum, 36 maps for eachperiod) were compiled. Projected data set by three GCMsunder SRES A1B showed that annual mean temperature willrise by ∼3.1 and ∼3.9 °C for 2050s and 2080s, respectively.Moreover, precipitation projections indicated future decreases∼26 mm (12.26 %) for 2050s and ∼29 mm (13.68 %) for2080s. Similar results were reported according to IPCC(2007b).
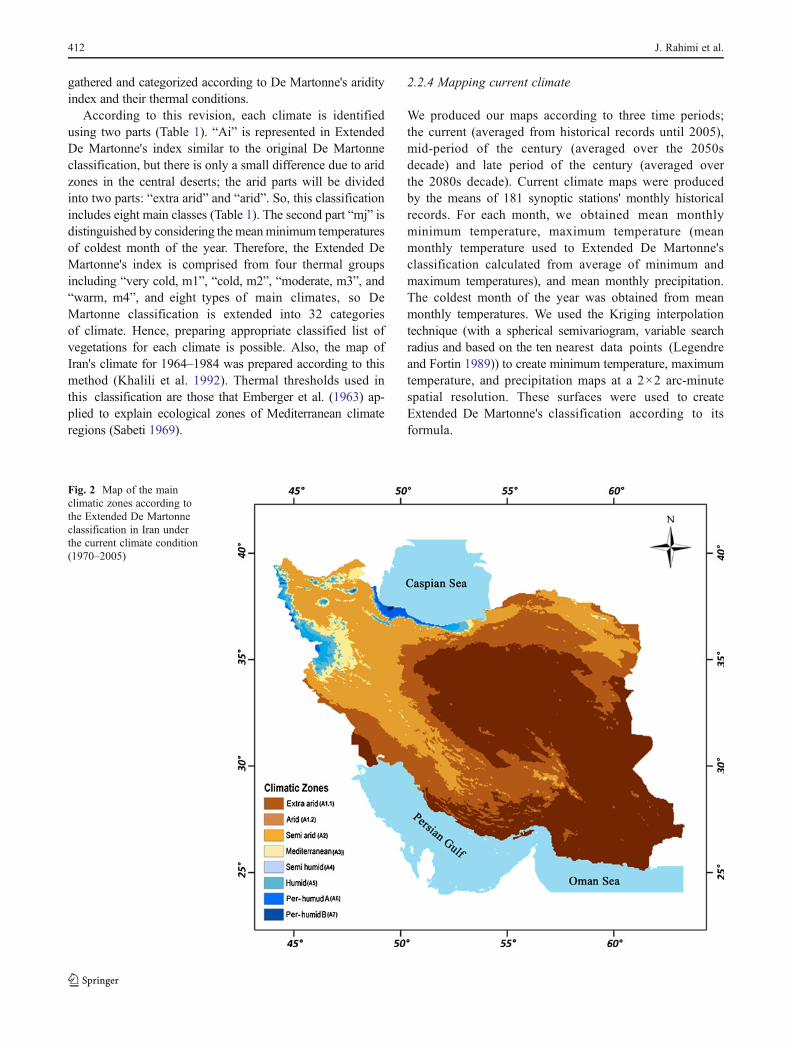
Climate classification maps for two periods (the 2050sand the 2080s) based on aridity index “Aimj” distributionfor two scenarios (A1B and A2) were projected. Wewithdrew display of all 32 classes of Extended De Martonnein maps because of complication in illustrations; hence, wepresented in Figs. 3 and 4 only eight main types of climates. Inaddition, A1.1 climate, covering considerable area in thecountry, with combination of m2, m3 and m4 was selectedas examples to represent probable shifts in Extended De
Fig. 3 Map of the mainclimatic zones according to theExtended De Martonneclassification in Iran under thefuture climate condition (2080s,A1B)
414 J. Rahimi et al.
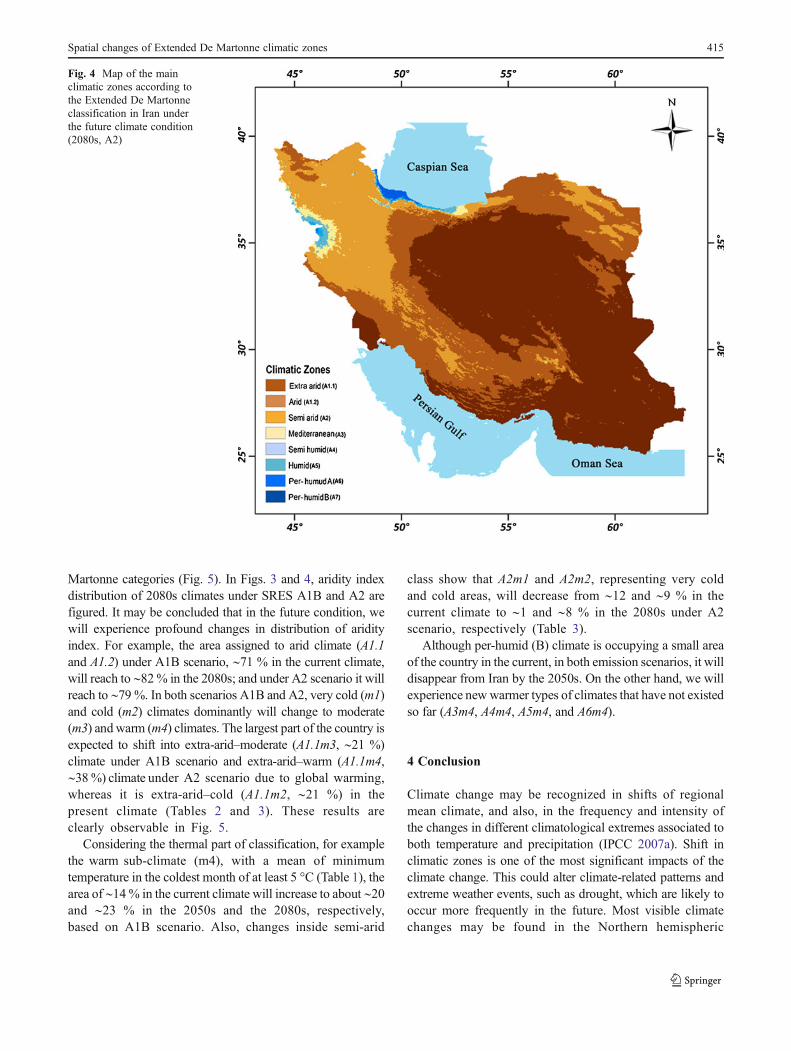
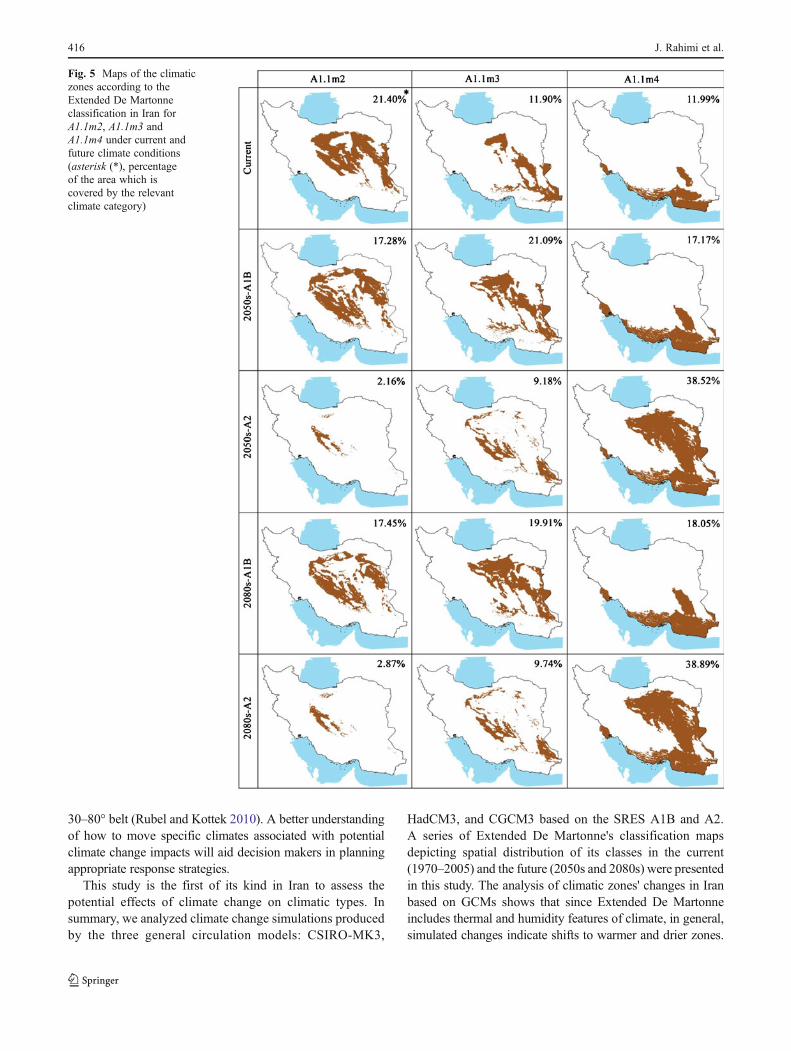
Martonne categories (Fig. 5). In Figs. 3 and 4, aridity indexdistribution of 2080s climates under SRES A1B and A2 arefigured. It may be concluded that in the future condition, wewill experience profound changes in distribution of aridityindex. For example, the area assigned to arid climate (A1.1and A1.2) under A1B scenario, ∼71 % in the current climate,will reach to ∼82% in the 2080s; and under A2 scenario it willreach to ∼79 %. In both scenarios A1B and A2, very cold (m1)and cold (m2) climates dominantly will change to moderate(m3) andwarm (m4) climates. The largest part of the country isexpected to shift into extra-arid–moderate (A1.1m3, ∼21 %)climate under A1B scenario and extra-arid–warm (A1.1m4,∼38%) climate under A2 scenario due to global warming,whereas it is extra-arid–cold (A1.1m2, ∼21 %) in thepresent climate (Tables 2 and 3). These results areclearly observable in Fig. 5.
Considering the thermal part of classification, for examplethe warm sub-climate (m4), with a mean of minimumtemperature in the coldest month of at least 5 °C (Table 1), thearea of ∼14% in the current climate will increase to about ∼20and ∼23 % in the 2050s and the 2080s, respectively,based on A1B scenario. Also, changes inside semi-arid
class show that A2m1 and A2m2, representing very coldand cold areas, will decrease from ∼12 and ∼9 % in thecurrent climate to ∼1 and ∼8 % in the 2080s under A2scenario, respectively (Table 3).
Although per-humid (B) climate is occupying a small areaof the country in the current, in both emission scenarios, it willdisappear from Iran by the 2050s. On the other hand, we willexperience newwarmer types of climates that have not existedso far (A3m4, A4m4, A5m4, and A6m4).
4 Conclusion
Climate change may be recognized in shifts of regionalmean climate, and also, in the frequency and intensity ofthe changes in different climatological extremes associated toboth temperature and precipitation (IPCC 2007a). Shift inclimatic zones is one of the most significant impacts of theclimate change. This could alter climate-related patterns andextreme weather events, such as drought, which are likely tooccur more frequently in the future. Most visible climatechanges may be found in the Northern hemispheric
Fig. 4 Map of the mainclimatic zones according tothe Extended De Martonneclassification in Iran underthe future climate condition(2080s, A2)
Spatial changes of Extended De Martonne climatic zones 415
30–80° belt (Rubel and Kottek 2010). A better understandingof how to move specific climates associated with potentialclimate change impacts will aid decision makers in planningappropriate response strategies.
This study is the first of its kind in Iran to assess thepotential effects of climate change on climatic types. Insummary, we analyzed climate change simulations producedby the three general circulation models: CSIRO-MK3,
HadCM3, and CGCM3 based on the SRES A1B and A2.A series of Extended De Martonne's classification mapsdepicting spatial distribution of its classes in the current(1970–2005) and the future (2050s and 2080s) were presentedin this study. The analysis of climatic zones' changes in Iranbased on GCMs shows that since Extended De Martonneincludes thermal and humidity features of climate, in general,simulated changes indicate shifts to warmer and drier zones.
Fig. 5 Maps of the climaticzones according to theExtended De Martonneclassification in Iran forA1.1m2, A1.1m3 andA1.1m4 under current andfuture climate conditions(asterisk (*), percentageof the area which iscovered by the relevantclimate category)
416 J. Rahimi et al.

The area and proportion of each climatic zones of ExtendedDe Martonne showed that in the current climate A1.1m2 isoccupying the largest area of Iran, whereas according to A1Band A2 scenarios in the 2050s and the 2080s, A1.1m3 andA1.1m4will occupy the largest area of the country, respectively.
References
Adle AH (1960) Climatic regions and vegetation in Iran. University ofTehran Press, Tehran, p 144
Bader DC, Covey C, Gutowski WJ, Held IM, Kunkel KE, MillerRL, Tokmakian RT, Zhang MH (2008) Climate models: an
assessment of strengths and limitations. U.S. Climate changescience program synthesis and assessment product 3.1. Departmentof Energy, Office of Biological and Environmental Research,124 pp
Beck C, Grieser J, Kottek M, Rubel F, Rudolf B (2006) Characterizingglobal climate change by means of Koppen climate classification.DWD, Klimastatusbericht 2005:139–149
de Castro M, Gallardo C, Jylha K, Tuomenvirta H (2007) The use of aclimate-type classification for assessing climate change effects inEurope from an ensemble of nine regional climate models. ClimChange 81:329–341
De Martonne E (1926) Une nouvelle fonction climatologique: L'indiced'aridité. La Meteorologie 2:449–458
Diaz HF, Eischeid JK (2007) Disappearing “alpine tundra” Koppenclimatic type in the western United States. Geophys Res Lett 34:L18707. doi:10.1029/2007GL031253
Table 3 Area transfers among different climates of Extended De Martonne classification in three climatic periods based on A2 emission scenario
Climate classification Areas (km2, %)
Current 2050s 2080s
km2 % % km2 % % km2 % %
A1.1 m1 13,103.1 0.795 46.085 0.000 0.000 49.858 165.0 0.010 51.517m2 352,738.4 21.404 35,558.6 2.158 47,387.0 2.875
m3 196,069.6 11.897 151,256.9 9.178 160,517.9 9.740
m4 197,572.3 11.989 634,846.3 38.522 640,934.7 38.892
A1.2 m1 73,139.0 4.438 24.510 7,078.7 0.430 25.940 15,257.7 0.926 27.095m2 228,396.6 13.859 124,794.3 7.572 134,807.2 8.180
m3 56,132.5 3.406 173,263.3 10.514 173,776.8 10.545
m4 46,254.8 2.807 122,355.3 7.424 122,685.4 7.445
A2 m1 198,561.9 12.049 22.909 26,829.4 1.628 21.413 19,127.2 1.161 18.933m2 149,485.0 9.071 150,945.2 9.159 131,597.9 7.985
m3 28,441.9 1.726 150,376.7 9.125 142,326.0 8.636
m4 1,044.6 0.063 24,738.8 1.501 18,962.1 1.151
A3 m1 37,421.6 2.271 3.198 825.2 0.050 1.439 293.4 0.018 1.186m2 13,249.7 0.804 6,070.1 0.368 4,217.9 0.256
m3 2,034.2 0.123 11,241.6 0.682 9,847.8 0.598
m4 0.0 0.000 5,574.9 0.338 5,189.8 0.315
A4 m1 16,200.2 0.983 1.421 183.4 0.011 0.678 128.4 0.008 0.603m2 4,270.0 0.259 2,255.7 0.137 1,815.5 0.110
m3 2,950.5 0.179 5,006.4 0.304 4,419.6 0.268
m4 0.0 0.000 3,722.7 0.226 3,576.0 0.217
A5 m1 13,011.4 0.790 1.190 55.0 0.003 0.274 0.0 0.000 0.273m2 2,968.8 0.180 385.1 0.023 183.4 0.011
m3 3,628.5 0.220 1,338.7 0.081 1,540.4 0.093
m4 0.0 0.000 2,732.5 0.166 2,769.1 0.168
A6 m1 1,832.6 0.111 0.653 18.3 0.001 0.398 18.3 0.001 0.393m2 934.6 0.057 0.0 0.000 0.0 0.000
m3 7,990.1 0.485 18.3 0.001 73.4 0.004
m4 0.0 0.000 6,528.5 0.396 6,381.8 0.387
A7 m1 36.7 0.002 0.034 0.0 0.000 0.000 0.0 0.000 0.000m2 0.0 0.000 0.0 0.000 0.0 0.000
m3 531.5 0.032 0.0 0.000 0.0 0.000
m4 0.0 0.000 0.0 0.000 0.0 0.000
100 100 100
Spatial changes of Extended De Martonne climatic zones 417
Eischeid JK, Baker CB, Karl TR, Diaz HF (1995) The quality controlof long-term climatological data using objective data analysis. JAppl Meteor 34:2787–2795
Emberger L, Gaussen H, Kassas M, De Philippis W (1963) Cartebioclimatique de la région méditerranéenne. UNESCO/FAD, Paris,p 58
Fraedrich K, Gerstengarbe FW, Werner PC (2001) Climate shiftsduring the last century. Clim Change 50:405–417
Gadgil S, Inyengar RN (1980) Cluster analysis of rainfall stations ofthe Indian Peninsula. Quart J Roy Meteor Soc 106(450):873–886
Ganji MH (1955) The climate of Iran. Bull de Soc Geogr 28:195–199Ganji MH (1968) Climate. In: Fisher WB (ed) The Cambridge history
of Iran. Volume 1. The land of Iran. Cambridge University Press,Cambridge, pp 212–249
Gao X, Giorgi F (2008) Increased aridity in the Mediterranean regionunder greenhouse gas forcing estimated from high resolutionsimulations with a regional climate model. Glob Planet Change62:195–209
Gerstengarbe FW, Werner PC (2009) A short update on Koppenclimate shifts in Europe between 1901 and 2003. Clim Change92:99–107
Gnanadesikan A, Stouffer RJ (2006) Diagnosing atmosphere–oceangeneral irculationmodel errors relevant to the terrestrial biosphereusing the Koppen climate classification. Geophys Res Lett 33:L22701. doi:10.1029/2006GL028098
Golian S, Saghafian B, Sheshangosht S, Ghalkhani H (2010) Comparisonof classification and clustering methods in spatial rainfall patternrecognition at Northern Iran. Theor Appl Climatol 102:319–329
Hare FK (1951) Climate classification. In: Stamp LD, Woolridge SW(eds) London essays in geography. London School of Economicsand Political Science, London, pp 111–134
Hay EL, Wilby LR, Leavesley HG (2000) A comparison of deltachange and downscaled GCM scenarios for three mountainousbasins in the United States. J AmWater Res Assoc 36(2):387–397
IPCC (2007a) Climate change 2007: synthesis report. Contributions ofWorking Groups I, II and III to the Fourth Assessment Report of theIntergovernmental Panel on Climate Change. In: IntergovernmentalPanel on Climate Change (ed). Geneva, Switzerland
IPCC (2007b) Climate change 2007: the physical science basis.Contribution of Working Group I to the Fourth Assessment Reportof the Intergovernmental Panel on Climate Change. In: Solomon S,Qin D, Manning M, Chen Z, Marquis M, Averyt KB, Tignor M andMiller HL (eds). Cambridge University Press, Cambridge
IRIMO (2007) Iranian meteorological office. Data Processing Center,Tehran
Jawadi C (1966) Distribution climatiques en Iran. Monographie MeteorolNat, Paris
Jokinen P, Jylhä K (2011) Migration of climatic zones in Europe basedon regional climate model simulations. Geophys Res Abstr 13:EGU2011-7568-1
Jylhä K, Tuomenvirta H, Ruosteenoja K, Niemi-Hugaerts H, Keisu K,Karhu JA (2010) Observed and projected future shifts ofclimatic zones in Europe, and their use to visualize climatechange information. Wea Climate Soc 2(2):148–167
Kalimi Nikfard B (1982) Climate of Iran based on Thornthwaitesystem. Dissertation, University of Tehran
Kalvova J, Halenka T, Bezpalcova K, Nemesova I (2003) Koppenclimate types in observed and simulated climates. Stud GeophysGeod 47:185–202
Khalili A (1992) Arid and semi arid regions of Iran. Proceeding ofSeminar on the problems of Iranian Deserts and Kavirs, 17–20May, Yazd, Iran, pp 566–579
Khalili A (1993) A new method of bioclimtological classificationsystem applied to the forest region of the South Caspian Sea.
Abstract Proceedings of the 13th International Congress ofBiometeorology, Calgary, Canada
Khalili A (2004) The climatology of Iran. In: Banaei MH, Bybordi M,Moameni A, Malakouti MJ (eds) The soils of Iran. Soil and WaterResearch Institute, Iran, pp 24–71
Khalili A, Hajam S, Irannezhad P (1992) Integrated water plan of Iran.Vol. 4: meteorological studies, climatical classification map1964–1984. Jamab Consulting Engineering Co., The Minisitry of Energy,Tehran
Koppen W (1936) Das geographische system der Klimate. In:Koppen W, Geiger R (eds) Handbuch der Klimatologie,Vol. 1. Verlagsbuchhandlung Gebrüder, Borntraeger, Berlin,pp 1–44
Krishnan A (1980) Agro-climatic classification methods and theirapplication to India. Climatic classification: a consultants' meeting14–16 April, ICRISAT, Patancheru, India, pp 59–88
Legendre P, Fortin MJ (1989) Spatial pattern and ecological analysis.Vegetatio 80:107–138
Lohmann U, Sausen R, Bengtsson L, Cubasch U, Perlwitz J, RoecknerE (1993) The Koppen climate classification as a diagnostic toolfor general circulation models. Clim Res 3:177–193
Luedeling E, Zhang M, Girvetz EH (2009) Climatic changes lead todeclining winter chill for fruit and nut trees in California during1950–2099. PLoS ONE 4(7):e6166. doi:10.1371/journal.pone.0006166
Meehl GA, Covey C, McAvaney B, Latif M, Stoufer RJ (2005)Overview of the coupled model intercomparison project. BullAmer Meteor Soc 86:89–93
Metzger MJ, Rounsevell MDA, Acosta-Michlik L, Leemans R,Schroter D (2006) The vulnerability of ecosystem services to landuse change. Agr Ecosyst Environ 114:69–85
Nakićenović N, Swart R (2000) Special report on emissions scenarios.Cambridge University Press, Cambridge, 599 pages
Ramirez J, Jarvis A (2010) Downscaling global circulation modeloutputs: the delta method. Decision and policy analysis workingpaper no. 1: CIAT-CGIAR. 17 p
Rounsevell MDA, Reginster I, Araujo MB, Carter TR, Dendoncker N,Ewert F, House JI, Kankaanpaa S, Leemas R, Metzger MJ, SchmitP, Tuck G (2006) A coherent set of future land use changescenarios for Europe. Agr Ecosyst Environ 114:57–68
Rubel F, Kottek M (2010) Observed and projected climate shifts 1901–2100 depicted by world maps of the Koppen–Geiger climateclassification. Meteor Z 19:135–141. doi:10.1127/0941-2948/2010/0430
Sabeti H (1969) Bioclimatic studies of Iran. University of TehranPress, Tehran, no. 1231, 266 pages
Sabeti H (1976) Forests, trees and shrubs of Iran. Ministry of Agricultureand Natural Resources of Iran, Tehran, p 874
Sperna Weiland FC, van Beek LPH, Weerts AH, Bierkens MFP (2011)Extracting information from an ensemble of GCMs to reliablyassess future global runoff change. J Hydrol 412:66–75
Thornthwaite CW, Mather JR (1955) The water balance. Publicationsin Climatology 8(1):1–104, Drexel Institute of Technology—Laboratory of Climatology, Centerton NJ
Virmani SM (1980) Need, relevance, and objectives of the consultants'meeting on climate classification. Proceeding of ClimaticClassification: A Consultants' Meeting 14–16 April 1980(International Crops Research Institute for the Semi-Arid Tropics)xvii–xx
Wang M, Overland JE (2005) Detecting arctic climate change usingKoppen climate classification. Clim Change 67:43–62
Wiley WM, Palmer NR (2008) Estimating the impacts and uncertaintyof climate change on a municipal water supply system. ASCE, JWat Res Plan Manage 134(3):239–246
418 J. Rahimi et al.