Embed Size (px)
Citation preview

1
Spatial and Temporal Dimensions of Heterogeneity in
Founding Patterns
Filippo Carlo Wezel
Department of Management
Faculty of Economics - University of Bologna
e-mail [email protected]
Johannes M. Pennings
Gino Cattani
Department of Management
The Wharton School – University of Pennsylvania
email: [email protected]
&
Gino Cattani
Department of Management
The Wharton School – University of Pennsylvania
e-mail [email protected]
2
Theory
In their efforts to uncover To explain evolutionary processes at the organizational
level, population ecology typically has focused on the level of the population or sector to
the population to which a single organization belongs. A population comprises
organizations sharing a common form, strategy or template, making them respond in
similar ways to environmental forces (Hawley, 1950). It is dependent upon distinct
combinations of resources supporting them. Each one of which of these combinations of
resources constitutes a different niche, i.e., namely a set of “social, economic and
political conditions that can sustain the functioning of organizations that embody the
form” 1 (Hannan & Carroll, 1992: 28). As a consequence, given their interdependence in
performance, organizations sharing these conditions elements are more prone to develop
competition.
Population ecologists trace this interdependence to processes of legitimation and
competition that shape the vital rates of a given population. From this perspective, an
organization obtains legitimation the very moment it is considered to posses a genetic
code socially organized (Meyer & Rower, 1977). When a new organizational form
appears on the market it generally lacks this legitimizationrecognition. For instance,
customers and suppliers need to be taught and guided, employees instructed about the
production process and the institutional while the environment in general is subject to
time compression diseconomies before it needs time to becomes aware of the new form’s
presence of these new organizations (Carroll & Hannan, 2000). The effect of this process
3
over time is to stimulate the founding of new organizations thus gradually augmenting
the sheer number of peer firms present. and then to increase the density of the population.
On the other hand, competition inside a population originates from the growing
number of potential bilateral competitors (Hannan & Freeman, 1987). More precisely,
“the action of all on the common supply gives rise to a reciprocal relation between each
unit and all the others, if only from the fact that what one gets reduces by that amount
what the others can obtain … without these elements of indirection, that is unless units
affect one other through affecting a common limited of supply, competition does not
exist” (Hawley, 1950: 202). Competition – which stems from the growing presence of
multiple organizations – has a negative impact on the survival rate of incumbents, thus so
decreasing the density of the population (Hannan & Freeman, 1989). The analysis of
these processes has been largely restricted to regional or conducted by focusing on the
national populations thus disregarding unobserved heterogeneity. assuming the latter as a
homogeneous entity.
Starting with Carroll & Wade (1991), the spatial dimension has been the object of
increasing attention. In their study of the American brewing industry, Carroll & Wade
found the strongest effects on founding at local level and advance the hypothesis that
competition operates at a different level for foundings than for mortality. Geographical
location has been investigated as a source of heterogeneity among organizations within a
given population ever since. In particular, two streams of research have developed, one
mainly focused on manufacturing industries, to other on service industries. It is worth
1 A form is the group of skills that permit organizations to transform inputs into output (Hannan & Freeman, 1977).
4
noting that, depending on the nature of the industry, processes of legitimation and
competition may unfold at different levels.
Several studies have concentrated on manufacturing industries. In their paper on
the European automobile firms Hannan et al. (1995) found that legitimation tends to flow
across countries, whereas competition occurs locally. The study provided the first
empirical support for the theoretical proposition that density dependent processes operate
at different level of analysis. Torres (1995) obtained similar results for the UK
automobile industry. Still with respect to the European automobile firms, more recently
Hannan (1997), investigating the motives for the late resurgence of density in mature
populations, has shown the non-proportionality of density dependence with time. Relying
on this study, Wezel (2000) has reached similar conclusions for the UK motorcycle
industry. However, Carroll et al. (1997) did not find support for the multilevel density
dependence theory for the US automobile industry. By shifting the level of analysis to a
single country (US), processes of legitimation and competition proved to be unexpectedly
stronger at state level. Differences in technology were recalled to explain these results.
On the other side, recent studies have tried to explore the same issues inside
service industries. In his study of rural cooperative banks in Italy, Lomi (1995) showed
how different segments of the population respond heterogeneously to competitive and
institutional processes. These results support differences in strength between estimates
based on local versus those relying on non-local specifications of density. While no real
“difference in legitimation was found across models based on local and non-local
specification of density, competition is seven times stronger at the regional than at the
national level” (1995: 137). Yet, expressly investigating multi-level density-dependence
5
processes, Lomi (2000) in his study on the Danish commercial banks in the period 1846-
1989, found weak support to this theory. In particular, he showed that for the city of
Copenhagen the founding rate of commercial banks decreases as national density
increases. He then concluded “this result is not consistent with the claim that legitimation
tends to operate on a broader scope than competition and indicates the need for a more
detailed understanding of the specific kind of legitimation that might be driving density
dependence…” (2000: 455). In a similar vein, Greve (2000) has emphasized that what
mattered for the evolution of the population within each area is local density. The effect
of densities tends to be stronger at local than non-local level. Evidence on spatial density
dependence was offered for the Tokyo banking industry and the spatial reach of this
effect was found to be limited (Greve, 2000: 21). Consistently with these findings we
hypothesize:
H1: In service industries density-dependence processes tend to operate at local level
This is particularly relevant in service industries where the client-firm relationship –
especially for small, individual firms – is local2. As Porter (1980) suggests, such
industries are often fragmented, namely no single firm has a dominating position, entry
barriers are low and differentiated services are offered. For this reason, the nature of the
service industries leads us to exclude the competing hypothesis that density-dependence
processes operate at national level. Yet, this does not necessarily exclude processes of
social influence operating at an intermediate level.
6
In this respect, research on social contagion provides both the theoretical
underpinnings and the empirical support to explore this influence. In their seminal work
on the diffusion of tetracycline Coleman et al. (1966) suggested the central role played by
phenomena of social contagion among doctors. The spreading of innovation was indeed
fostered by proximity among adopters. In a later re-examination of the data originally
analyzed by Coleman et al. and relying on a different methodological approach, Strang &
Tuma (1991) were able to show the contemporaneous influence of both social contagion
and structural equivalence. By the same token, in studying spatial diffusion of Swedish
trade unions, Hedstrom (1994) found that mobilization processes across the country were
highly contagious. In particular, “spatial properties and network densities are likely to
influence considerably both the speed of a mobilization process and the success of a
movement in organizing the relevant population” (1994: 1176). In his study on the
diffusion of a market position in the US radio broadcasting Greve (1996) argued that the
adoption of a particular strategy can spread contagiously among organizations. One the
main findings of the paper is that “a strong baseline contagion effect was in operation in
the spread of the Soft AC format and the stations with relatively low inertia were likely
adopters of the format” (1996: 52). With respect to the diffusion of innovation, Rogers
(1995) maintained that its adoption depends on the perceived number of actors who have
already adopted the same innovation. Processes of diffusion can be stimulated by social
interactions among these actors, especially when such interactions are based on trust and
mutuality. In light of the foregoing discussion, we hypothesize:
2 “A major cause of the problem lies in the nature of professional practice. By very definition, professional work requires customization and the need to adapt the practice to the special, individualized needs of a
7
H2: In service industries neighboring areas have a positive influence on the
founding rate in the focal area
Should H1 be supported, we believe that some interesting strategic implications
might be derived. Shifting the level of analysis from the population to the sub-population
allows us not only to treat the former as a spatially heterogeneous entity, but also to
address issues of temporally heterogeneity at the same level. In particular, the combined
examination of the spatial and temporal dimensions seems to be critical first to establish
the timing of entry and then to estimate the survival rate of a new organization.
Although research in strategic management has tried to delve into this
fundamental issue, in general the focus has been placed on first mover-related
advantages. Porter (1980), for instance, has emphasized how the cost of entry into a
strategic group is affected by the timing of entry3, which is contingent on both the type of
industry and the specific phase of its life cycle. Several authors have underscored that
timing of market entry is correlated with firms’ subsequent performance (Hofer &
Sandberg, 1987; Sandberg, 1986). Strong empirical association has been found between
order of market entry and market share. Abell (1980), Porter (1980) and Thompson &
Strickland (1987) have pointed out how pioneering entrants are more likely to enjoy
sustainable long-term advantages. Similarly, Lieberman & Montgomery (1988) have
argued that a first mover advantage may be achieved by spatial preemption, namely
trying to occupy new and profitable niches before other entrants.
local clientele“ (Maister, 1993: 330). 3 By timing of entry we mean the foundation of a new firm. We use this terminology to be consistent with literature in strategic management.
8
However, this literature does seem to account for the contemporaneous effect of
spatial and temporal heterogeneity on the timing of entry. On the contrary, we believe
that valuable insight might stem from looking at local clocks to decide when and where to
enter. So long as density dependence processes tend to be essentially local, the very same
processes might start at different points in time, varying from area to area. Thus, a newly
founded organization is more or less likely to survive depending on whether the sub-
population to which it ends up belonging is going through a phase of legitimation or
competition. Since temporal heterogeneity implies age differences among sub-
populations, any entry decision, particularly in fragmented industries, should be made in
light of the type of phase a sub-population is experiencing at a given point in time.
Therefore, we hypothesize:
H3: In service industries there is an inverse U-shaped relationship between local age and
founding rate in the focal area
Data
The data used in the paper cover the entire population of Dutch accounting firms
during the period 1880-1986 (Pennings et al., 1998). Since the first firm was founded in
1880 there is no problem of “left-truncation”. Data were collected with one- to five-year
intervals. Therefore, we observe foundings within those time intervals. The complete
industry comprised 2646 firms over the 106-year period. However, firms founded
between 1986 and 1990 were not included in the analysis because they could not be
identified as either right-censored or as having dissolved.
9
To explore the impact of both the temporal and spatial dimensions on the
founding rate, following Lee & Pennings (2000) we divided the overall population of
accounting firms into 11 sub-populations – each corresponding to a different province. In
particular, we assume the latter to represent a distinct selection environment where
processes of legitimation and competition take place.
Data mostly consist of individual firms. Given their small size, firms tend to
operate at local (province) level and their critical resources (essentially, clients) tend to be
local as well. This is particularly relevant in service industries where the client-firm
relationship – especially for small, individual firms – is more likely to be local (Maister,
1993). As already pointed out, the Dutch accounting industry shares many of the features
of what Porter (1980) defines as fragmented industries where no single firm has a
dominating position, entry barriers are low and services are differentiated.
Variables
In our model the independent variables refer to spatial density dependence, social
contagion and temporal heterogeneity. With respect to spatial density dependence, we
tested our first hypothesis (H1) by creating two variables, density (dpr) and density
squared (dpr2), to account for processes of legitimation and competition at the province
level. As to our second hypothesis (H2), social contagion was measured by a variable –
neard – consisting of the sum of the density of neighboring provinces and capturing
processes of influence spilling over from these areas. We also squared the same variable
– neard2 – to verify the non-linear effect of this influence.

10
Our third hypothesis (H3) on the influence of temporal heterogeneity among
different sub-populations was tested by including in the model a variable – agep – for the
age of the industry at the province level. A square term – agep2 – was also created to test
the curvilinear effect of local clocks on the processes of legitimation and competition at
the same level.
Drawing from Pennings et al. (1998) several control variables were also included
in the model to control for changes in the environment at national level. In particular, two
dummies were created for the occurrence of World War I (1914-1918) and World War II
(1941-1946). Since Indonesia’s independence was supposed to have a persistent effect
due to the shrinkage of the market, we used a dummy taking the value of 1 if year >
1949, 0 otherwise. The government regulation of 1929, in the wake of the Great
Depression, was presumed to have its impact during 1929 and 1931 (1 if year ≥ 1929 and
≤ 1931, 0 otherwise). Another institutional event was the emergence of a single
association that represented the collective interests of all Dutch accounting firms, NivRA,
which was established in 1966 (1 if year > 1966, 0 otherwise).
The industry also experienced two regulatory changes in 1971 and 1984. In the
former case, the Act on Annual Financial Statements of Enterprises required annual
audits. In the latter, definitive guidelines for auditing were promulgated and enforced by
NIvRa in collaboration with the Dutch Ministry of Justice. Both regulations significantly
heightened the demand for audit services. Two variables were then used, namely d971 (1
if year > 1971) and d984 (1 if year > 1984). Since a new firm may be found or even
disappear when two firms merge together or one firm is acquired by another firm, a
11
control variable – M&A – for all mergers and acquisitions occurring at national level
throughout the entire period was included.
Finally, to control for differences at the province level, on the one hand the we
used the number of inhabitants in each province – inhab – to capture diversity in growth
opportunities. On the other hand, we controlled for unobserved heterogeneity by
including fixed effect for each of the 11 provinces.
Model and method of analysis
One of the peculiarities of investigating the process of founding inside a
population is linked to methodological issues. As by definition an organization does not
exist before its birth, competencies and skills at firm level are not measured by
independent variables. Thus, the industry represents the appropriate unit of analysis. In
particular, to study the founding of Dutch accounting firms our model includes as
independent variables the density within neighboring provinces [B and B2], the density
per year within each province [N and N2], age of the industry at province level [T and T2]
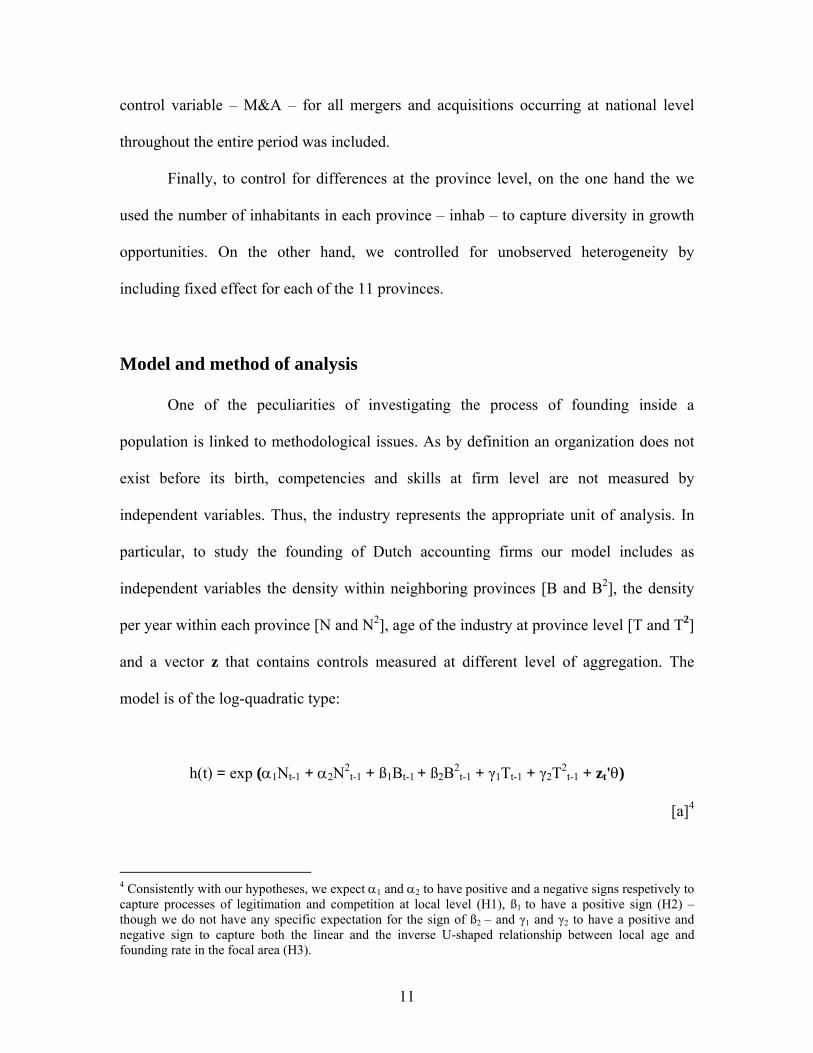
and a vector z that contains controls measured at different level of aggregation. The
model is of the log-quadratic type:
h(t) = exp (α1Nt-1 + α2N2t-1 + ß1Bt-1 + ß2B2
t-1 + γ1Tt-1 + γ2T2t-1 + zt'θ)
[a]4
4 Consistently with our hypotheses, we expect α1 and α2 to have positive and a negative signs respetively to capture processes of legitimation and competition at local level (H1), ß1 to have a positive sign (H2) – though we do not have any specific expectation for the sign of ß2 – and γ1 and γ2 to have a positive and negative sign to capture both the linear and the inverse U-shaped relationship between local age and founding rate in the focal area (H3).
12
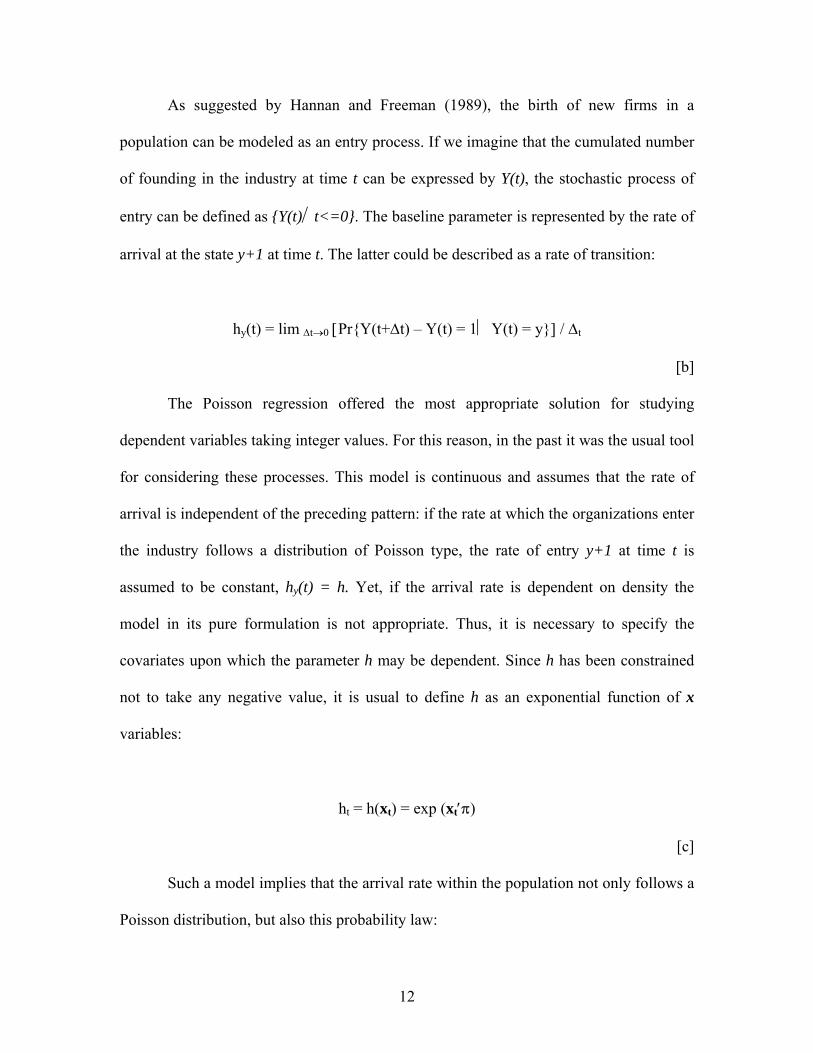
As suggested by Hannan and Freeman (1989), the birth of new firms in a
population can be modeled as an entry process. If we imagine that the cumulated number
of founding in the industry at time t can be expressed by Y(t), the stochastic process of
entry can be defined as {Y(t)⎪ t<=0}. The baseline parameter is represented by the rate of
arrival at the state y+1 at time t. The latter could be described as a rate of transition:
hy(t) = lim ∆t→0 [Pr{Y(t+∆t) – Y(t) = 1⎥ Y(t) = y}] / ∆t
[b]
The Poisson regression offered the most appropriate solution for studying
dependent variables taking integer values. For this reason, in the past it was the usual tool
for considering these processes. This model is continuous and assumes that the rate of
arrival is independent of the preceding pattern: if the rate at which the organizations enter
the industry follows a distribution of Poisson type, the rate of entry y+1 at time t is
assumed to be constant, hy(t) = h. Yet, if the arrival rate is dependent on density the
model in its pure formulation is not appropriate. Thus, it is necessary to specify the
covariates upon which the parameter h may be dependent. Since h has been constrained
not to take any negative value, it is usual to define h as an exponential function of x
variables:
ht = h(xt) = exp (xt′π)
[c]
Such a model implies that the arrival rate within the population not only follows a
Poisson distribution, but also this probability law:
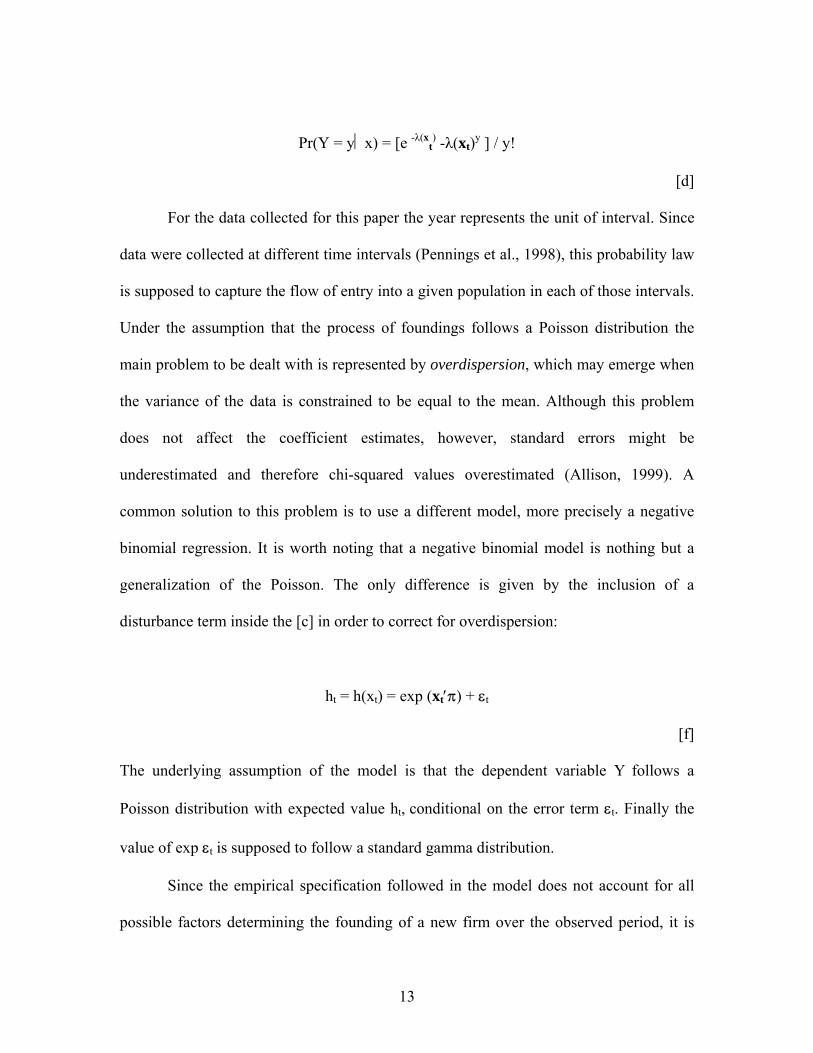
13
Pr(Y = y⎥ x) = [e -λ(xt) -λ(xt)y ] / y!
[d]
For the data collected for this paper the year represents the unit of interval. Since
data were collected at different time intervals (Pennings et al., 1998), this probability law
is supposed to capture the flow of entry into a given population in each of those intervals.
Under the assumption that the process of foundings follows a Poisson distribution the
main problem to be dealt with is represented by overdispersion, which may emerge when
the variance of the data is constrained to be equal to the mean. Although this problem
does not affect the coefficient estimates, however, standard errors might be
underestimated and therefore chi-squared values overestimated (Allison, 1999). A
common solution to this problem is to use a different model, more precisely a negative
binomial regression. It is worth noting that a negative binomial model is nothing but a
generalization of the Poisson. The only difference is given by the inclusion of a
disturbance term inside the [c] in order to correct for overdispersion:
ht = h(xt) = exp (xt′π) + εt
[f]
The underlying assumption of the model is that the dependent variable Y follows a
Poisson distribution with expected value ht, conditional on the error term εt. Finally the
value of exp εt is supposed to follow a standard gamma distribution.
Since the empirical specification followed in the model does not account for all
possible factors determining the founding of a new firm over the observed period, it is
14
necessary to control for those factors not contemplated in the model. Therefore, to correct
for the bias resulting from omitted explanatory variables at the province level, we
included fixed effects for each of the 11 provinces in our model (Allison, 1999).
Moreover, the entry at a given time interval is not completely unrelated to the time of
entry in previous periods. To deal with auto-correlation in time series of event counts we
used the Generalized Least Squares Estimation method (Carroll & Hannan, 2000). This
estimation procedure has become very popular in the last years among researchers that
need to consider nonlinear regression models for count response data (for a deep
discussion, see Barron, 1992). The value of the estimates has been obtained using this
method inside SAS version 8.0.
Results
In this section we show the results of the models we estimated to test our
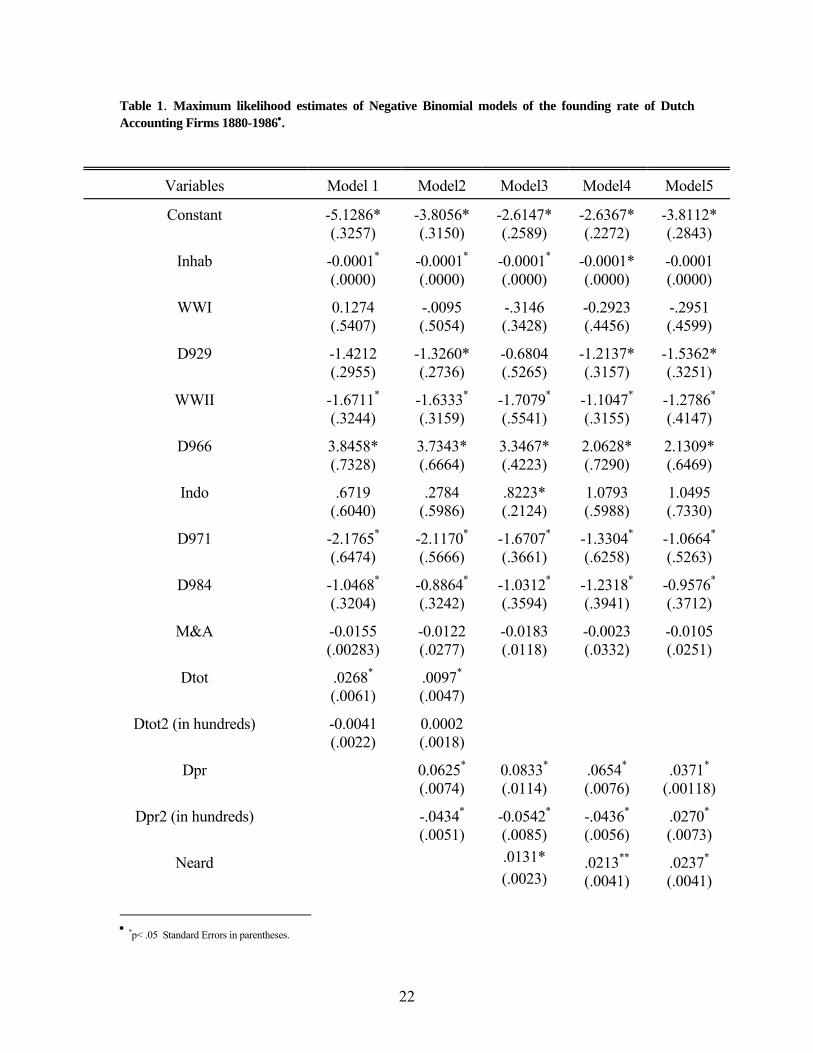
hypotheses. The first model in Table 1 tests the classical population ecology hypothesis
of density dependence processes at national level. Whereas the first order effect of
density measuring legitimation is highly significant, the second order effect measuring
competition is in the expected direction but non-significant at .05 level.
-----------------------------
Insert Table 1
------------------------------
In light of these results, the second model tests H1 that in service industry density
dependence processes operate at local level. The value of the Log Likelihood in model 2
clearly shows that the model with the variables measuring legitimation (dpr) and

15
competition (dpr2) fits the data better at province than at national level (χ2[L2⎟ L1] =
30.38 with p-value <.0001 for 2 degree of freedom). The results strongly support our
hypothesis on spatial density dependence in service industry. In particular, each 1-unit
increase in the national density increases the probability of founding of a new firm in the
focal province by approximately 1% (exp 0.0097). By contrast, each 1-unit increase in
the density at the province level raises the probability of founding a new firm by more
than six times (exp 0.0625 = 6.5%).
The non-significance of dtot2 suggests that, consistently with previous work (Lomi,
1995; Carroll et al., 1997), competition is primarily local. As legitimation at national
level – though weaker than at province level – is significant, we decided to explore
whether social contagion molded of evolution of each sub-population. Although the sign
of the coefficient of neard in model 3 is in the expected direction, the effect is significant
only at .10 level. Since the dynamcs of this effect might not be linear, drawing from
Greve (2000), we estimated a model with a quadratic term for the sum of the density of
neighboring provinces (neard2). Not only does model 4 fit better the data (χ2[L4⎟ L3] =
22.96 with p-value <.0001 for 1 degree of freedom), but both the coefficient estimates for
neard and neard2 are strongly significant. Nevertheless, the effect of local density
dependence remains highly significant and the magnitude of dpr and dpr2 is much larger
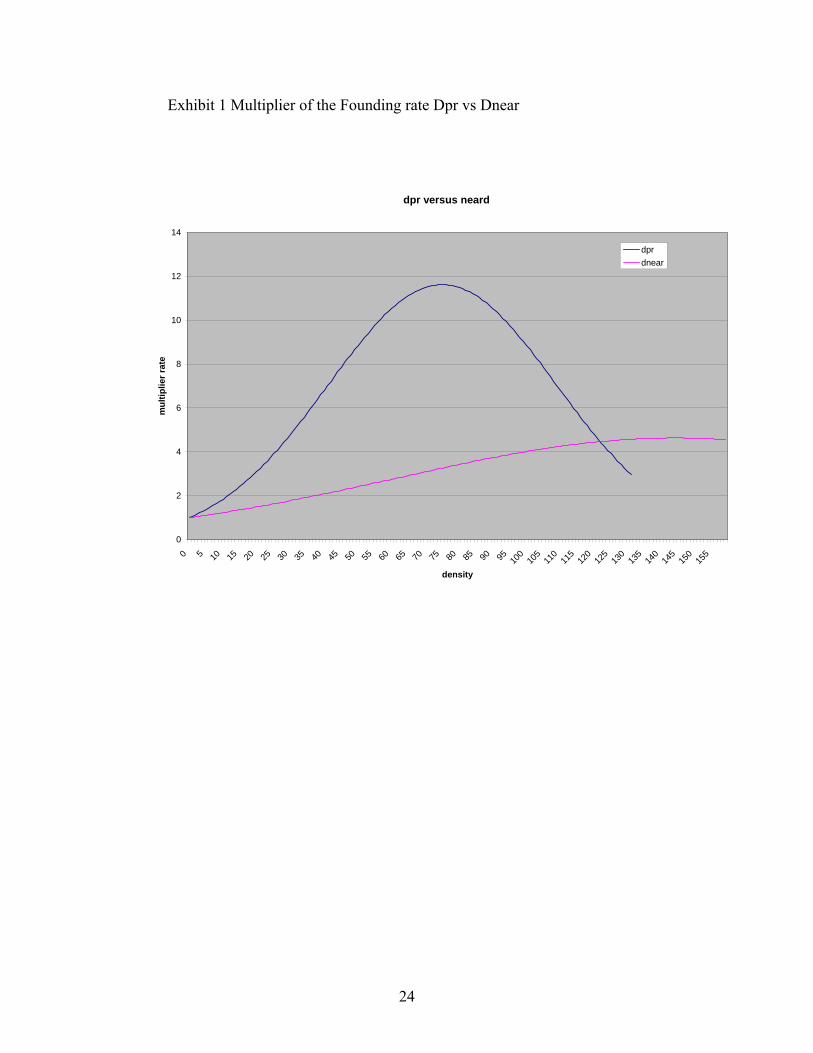
than neard and neard2. This can be intuitively understood by looking at Exhibit 1. All the
numeric values used to plot the graph have been generated from the coefficient estimates
of the variables in model 4 in Table 1. Based on these estimates, the multiplier of the
founding rate for dpr and dpr2 reach its maximum when the sub-population’s density is at
75. At that value the founding rate increases more than 11 times the rate when N=0. This
16
finding confirms the importance of the legitimation process for each sub-population. The
value of the multiplier of the founding rate reaches its maximum at λ*=11.8. This result
is consistent with Hannan’ and Carroll’s (1992) study on Manhattan Banks where λ*=10.
Evidence suggesting how local density dependence effects tend to dominate over those
due to social contagion is given by the difference in magnitude between the value of the
multiplier of the founding rate for dpr and neard. In particular, in the latter case the
maximum is reached at value λ*= 4.8 that is less than half that found at the sub-
population level. The results of the analysis only partly support H2.
-----------------------------
Insert Exhibit 1
------------------------------
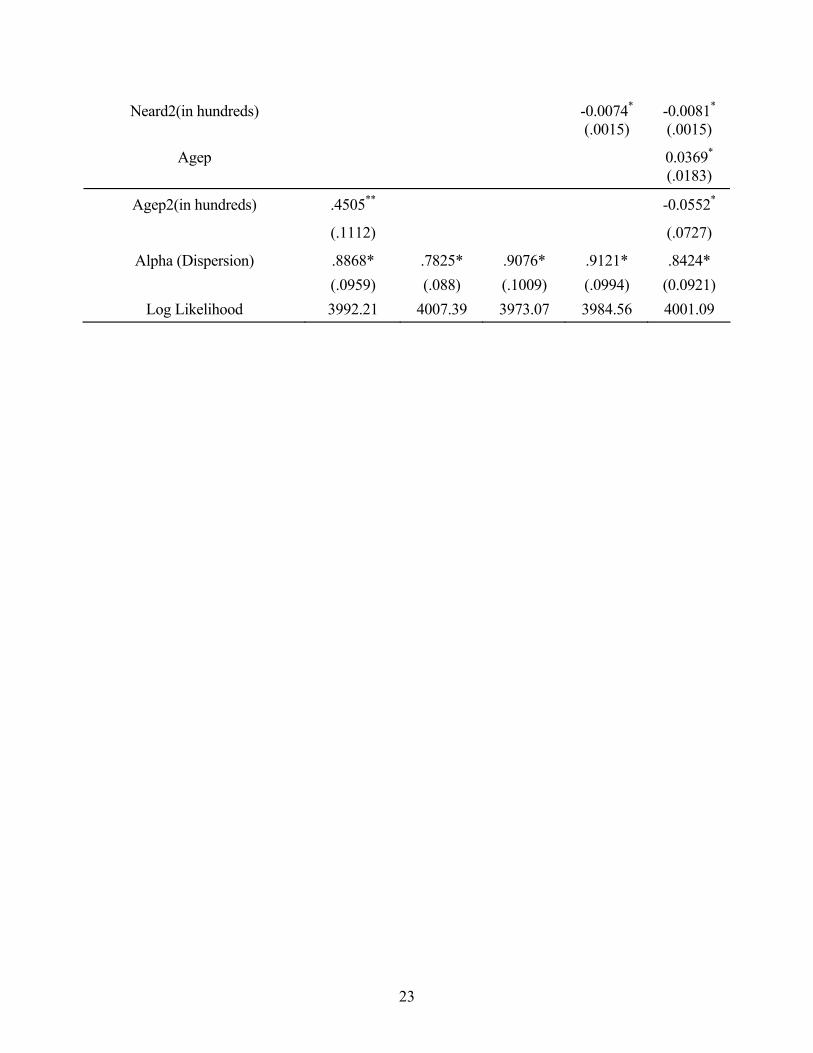
Whereas all these models have been estimated to test whether spatial dimension
may be seen as a source of heterogeneity among sub-populations, in model 5 we included
two new variables – agep and agep2 – to test the temporal dimension of this
heterogeneity (H3). Adding these components of diversity among sub-populations
improves significantly the fit of the model (χ2[L5⎟ L4] = 33.4 with p-value <.0001 for 2
degree of freedom). In particular, for each 1-year increase in the age of the sub-
population the number of new founding raises by 3.7% (exp 0.0369). The effect of sub-
population’s age on founding tends to increase till age of 32 years (-0.0369/2*(-0.0552)),
after which it starts to decline. Therefore, H3 is confirmed. Finally, the coefficient
estimates for the control variables in model 5 – the model with the best fit – are largely
consistent with those in Pennings et al. (1998).
17
Conclusions
The purpose of the paper was to demonstrate how heterogeneity within a given
population can be ascribed to the contemporaneous influence of the spatial and temporal
dimensions. Starting with Carroll & Wade (1991) some recent contributions have
investigated the lack of homogeneity among organizations facing distinct selection
environments inside the same industry. To date the most promising stream of research is
that related to the multilevel density dependence theory. Following this theory,
legitimation and competition are supposed to operate at different levels of analysis: the
former tends to flow across borders, whereas the latter occurs locally. Although these
results seem to be robust when different countries are compared, the same does not
entirely hold true when the level of analysis is shifted to a single country. Moreover, most
of the findings refer to manufacturing industries (Hannan et al., 1995; Hannan, 1997;
Torres, 1995). On the contrary, for service industries results are more controversial
(Greve, 2000; Lomi, 2000).
In spite of the growing importance of service industries in modern economy, less
attention has been drawn to their examination relative to the manufacturing ones. At a
deeper analysis, the very same nature of service industries may partly explain some of the
inconsistencies in the results observed in the literature. As already pointed out,
professional works build their survival on the customization of their products (Maister,
1993). This circumstance, along with the fragmented nature of these industries (Porter,
1980), suggests the importance of examining processes of legitimation and competition at
a less aggregate level than the industry as a whole.
18
The results of our analysis of the Dutch accounting industry, during the period
1880-1986, clearly confirm spatial density dependence theory (Greve, 2000). More
precisely, they are consistent with the hypothesis of spatial heterogeneity among sub-
populations. Yet, our findings emphasize the role played by temporal heterogeneity in
shaping the dynamics of density dependence processes at the sub-population level. In
particular, we demonstrate how several distinct clocks can be identified within the same
population. This circumstance seems to have interesting implications from a strategic
standpoint.
In this respect, it is worth noting that a service industry is less likely to experience
the stages of the life cycle typical of many manufacturing industries (Klepper, 1997).
While the services offered by a single firm may become obsolete over time, the industry
is less likely to face the same problem. This can be partly ascribed to the fact that the
demand for auditing services remains relatively stable over time. Moreover, technological
advancement – one of the most critical sources of obsolescence in many manufacturing
industries – seems to be less relevant in several service industries. Finally, the lack of a
dominant design and the limited availability of economies of scale induce service
industries to be fragmented (Porter, 1980).
Therefore we argue that, if the evolution of a service industry does entirely
conform to the pattern of the industry life cycle and processes of legitimation and
competition tend to be essentially local, any entry decision should be made in light of the
type of phase a sub-population is experiencing at a given point in time. Our results
suggest that a newly founded organization is more or less likely to survive depending on

19
whether the sub-population to which it may end up belonging is going through a phase of
legitimation or competition.
The findings of this paper might complement literature on first-mover advantage.
Whereas several studies have stressed how pioneering entrants are more prone to enjoy
sustainable long-term advantages (Abell, 1980; Lieberman & Montgomery, 1988;
Thompson & Strickland, 1987), the latter might be available to later entrants so long as
density at the sub-population level is still growing – which means that competition for
scarce resources has not started as yet. Furthermore, several studies have emphasized that
organizations benefit economically from being located in efficient positions. Different
mechanisms can determine positive co-location externalities: economies of information
and communications arising from social relations (Scherer, 1984), an extended division
of labor, common labor markets and knowledge spillovers (Saxenian, 1994). All these
factors presumably enhance the survival chance of firms in these locations. However, in
strategic terms, with competition increasing over time the probability of a firm to survive
is contingent on the timing of entry into the sub-population.
Despite evident limitations, the multilevel analysis conducted in this paper has
shown how restricting the examination of evolutionary processes to the national
population may obscure that the latter are often better observed at a lower level. This
seems to be particularly important in service industries for the reasons explained before.
In our opinion, one of the most interesting implications of the present analysis is the
attempt to identify the drivers of macro-evolutionary processes with micro-decisions. The
overall spectrum of these decisions – entry, competition or collaboration – cannot be fully
20
captured by simply looking at foundings. Thus, a multi-level analysis seems to be
promising for studying mortality rates within populations.
References
Allison, P. 1999. Logistic Regression Using the SAS system: Theory and application, Sas
Institute Cary, NC.
Baum, J. & Mezias, S. 1992. Localized competition and organizational failure in the
Manhattan hotel industry, 1898-1990, in Administrative Science Quarterly, 37: 580-604.
Baum, J. & Singh, J. 1994. Evolutionary dynamics of organizations, Oxford University
Press, New York.
Carroll, G. & Hannan, M. 1989. On using institutional theory in studying organizational
populations, in American Sociological Review, 54: 545-548.
Carroll, G. & Hannan, M. 2000. The Demography of Corporations and Industries,
Princeton University Press NJ.
Hannan, M. & Carroll, G. 1992. Dynamics of Organizational Populations: density,
legitimation and competition, Oxford University Press, NY.
Hannan, M. & Freeman, J. 1989. Organizational ecology, Harvard University Press,
Cambridge.
Hannan, M. 1997. Inertia, Density and structure of organizational populations: entries in
European automobile industries, 1886-1981, in Organization Studies, 18: 193-228.
Hannan, M. Carroll, G. Dundon, E. & Torres, J. 1995. Organizational evolution in
multinational context: Entries of automobile manufacturers in Belgium, France, Germany
and Italy, in American Sociological Review, 60: 509-528.

21
Hawley, A. 1950. Human Ecology: a theory of community structure, Ronald Press, NY.
Lomi, A. 1995. The population ecology of organizational founding: location dependence
and unobserved heterogeneity, in Administrative Science Quarterly, 40: 111-145.
Lomi, A. 2000. Density Dependence and Spatial Duality in Organizational Founding
Rates: Danish Commercial Banks, 1846-1989, in Organization Studies 21 (2): 433-461.
Maister, D. 1993. Managing the professional service firms. New York: The Free Press.
Pennings, J. Lee, K. & van Witteloostuijn, A. 1998. Human capital, social capital and
firm dissolution, Academy of Management Journal, 41(4): 425-440.
Porter, M. 1980. Competitive strategy, Free Press, New York.
Porter, M. 1990. The competitive advantage of Nations, MacMillan, New York.
Press, New York.
22
Table 1. Maximum likelihood estimates of Negative Binomial models of the founding rate of Dutch Accounting Firms 1880-1986•.
Variables Model 1 Model2 Model3 Model4 Model5
Constant -5.1286* (.3257)
-3.8056* (.3150)
-2.6147* (.2589)
-2.6367* (.2272)
-3.8112* (.2843)
Inhab -0.0001* (.0000)
-0.0001* (.0000)
-0.0001* (.0000)
-0.0001* (.0000)
-0.0001 (.0000)
WWI 0.1274 (.5407)
-.0095 (.5054)
-.3146 (.3428)
-0.2923 (.4456)
-.2951 (.4599)
D929 -1.4212 (.2955)
-1.3260* (.2736)
-0.6804 (.5265)
-1.2137* (.3157)
-1.5362* (.3251)
WWII -1.6711* (.3244)
-1.6333* (.3159)
-1.7079* (.5541)
-1.1047* (.3155)
-1.2786* (.4147)
D966 3.8458* (.7328)
3.7343* (.6664)
3.3467* (.4223)
2.0628* (.7290)
2.1309* (.6469)
Indo .6719 (.6040)
.2784 (.5986)
.8223* (.2124)
1.0793 (.5988)
1.0495 (.7330)
D971 -2.1765* (.6474)
-2.1170* (.5666)
-1.6707* (.3661)
-1.3304* (.6258)
-1.0664* (.5263)
D984 -1.0468* (.3204)
-0.8864* (.3242)
-1.0312* (.3594)
-1.2318* (.3941)
-0.9576* (.3712)
M&A -0.0155 (.00283)
-0.0122 (.0277)
-0.0183 (.0118)
-0.0023 (.0332)
-0.0105 (.0251)
Dtot .0268* (.0061)
.0097* (.0047)
Dtot2 (in hundreds) -0.0041 (.0022)
0.0002 (.0018)
Dpr 0.0625* (.0074)
0.0833* (.0114)
.0654* (.0076)
.0371* (.00118)
Dpr2 (in hundreds) -.0434* (.0051)
-0.0542* (.0085)
-.0436* (.0056)
.0270* (.0073)
Neard .0131* (.0023)
.0213** (.0041)
.0237* (.0041)
• *p< .05 Standard Errors in parentheses.
23
Neard2(in hundreds) -0.0074* (.0015)
-0.0081* (.0015)
Agep 0.0369* (.0183)
Agep2(in hundreds) .4505**
(.1112)
-0.0552*
(.0727)
Alpha (Dispersion) .8868* (.0959)
.7825* (.088)
.9076* (.1009)
.9121*
(.0994) .8424*
(0.0921) Log Likelihood 3992.21 4007.39 3973.07 3984.56 4001.09
24
Exhibit 1 Multiplier of the Founding rate Dpr vs Dnear
dpr versus neard
0
2
4
6
8
10
12
14
0 5 10 15 20 25 30 35 40 45 50 55 60 65 70 75 80 85 90 95 100
105
110
115
120
125
130
135
140
145
150
155
density
mul
tiplie
r rat
e
dprdnear