Embed Size (px)
Citation preview

Hydrobiologia 160: 207 - 217 (1988) © Dr W. Junk Publishers, Dordrecht - Printed in the Netherlands 207
Spatial and biocenotic trends in the water-mite fauna of small ponds
Ana I. Camacho & Antonia G.-Valdecasas l
f Museo Nacional de Ciencias Naturales, Jose Gutierrez Abascal, 2, 28006-Madrid, Spain
~ !
w· Key words: temporary and permanent ponds, water mites, biotic trends
Abstraet
Forty-one permanent and temporary ponds have been studied in a mountain range in the center of Spain. Abiotic variables are used to characterize the ponds. Spatial and biocenotic distribution patterns of macroinvertebrates with special reference to the water mite fauna are considered.
Introduetion
Temporary and permanent stagnant waters are widely distributed around the world, but temporary waters are the least known, due, in part, to a supposed lack of economic interest. Most studies have dealt with the taxonomy of their inhabitants. For recent, more comprehensive approaches see HartlandRowe, 1972 and Wiggins et al., 1980.
Faunal diversity tends to be low, although sorne of the taxa are quite abundant. Nevertheless, within a restricted area, total faunal diversity is high, due to low repetitivity.
The stagnant waters of the sierra del Guadarrama, a mountain range in the center of Spain, have mainly received a systematic approach. Arévale (1921, 1931) deals with insect larvae and c1adocera, Viets (1930) and G.-Valdecasas (1981) with water mites, Alvarez & Selga (1967) with several taxa and Margalef (1947) gives a more ecological view. More recently, we have looked at these ponds from an insular model perspective (G.-Valdecasas et al., 1984).
The present paper tries to understand the spatial and biocenological patterns shown by pond taxa, especially water mites.
1 Order oC authorship determined by the toss oC a coin.
Material and methods
Studyarea
The sierra de Guadarrama is a mountain range in the center of Spain. Its highest point is Peñalara, at 2430 m. The whole area is mainly gneissic. It consists of 5800 km2, arbitrarily delimited aboye 1 000 m altitude.
The area was divided into quadrats of 5 km per side, and at least one pond was looked for in each quadrat. Out of 115 quadrats only 41 ponds were found (Fig. 1).
Sampling procedure
The sampling period extended from spring into summer, when the temporary nature of the ponds was confirmed.
The following physico-chemical variables were taken at sampling time: altitude, mean depth, surface, water and air temperature (mercury thermometer), pH with Merck indicator paper, hardness (Merck tritiplex), and alkalinity (Aquamerck Alkalinitat). The nature of the substrate and vegetation growths was also noted. Macroinvertebrates were sampled quali- and quantitatively (see G.Valdecasas et al., 1984). Samples were fixed with formalin in 40/0 and sorted in the laboratory.

208
•
A 9
AA 8 7
El Espinar
Fig. l. Distribution of ponds in the Sierra de Guadarrama.
Data ana/ysis
Data analysis was done with the BMDP Computer Package (Dickson, 1983). Programs 1M, 2M and 4M were used for cluster and principal component analysis (P.C.A.). Program 1M used a similarity matrix obtained by. applying the J accard index to water mite faunal record s in ponds. In this case, the average (U.P.G.M.A., see Sneath & Sokal, 1973) was chosen for clustering. In program 2M we selected the Euclidean distance and the centro id algorithm for clustering. Principal components were obtained from the correlation matrix. Analysis of correspondence was done using Lebart & Fenelons (1973) programo
Results
A 33
• Somosierr el
1. Spatia/ trends
D 1000
~ 2000
¡¡[]} 2200
The main purpose of this work has been to investigate the spatial and biocenotic trends in the pond communities of a mountain range. The search for the pattern of spatial directionality was carried out using the Wald-Wolfowitz, non-parametric run test (Siegel, 1956; Wratten & Fry, 1980). Only two spatial directions, North-South and East-West, were analyzed for each of the following cases: the distribution pattern of ponds, water mites, calanoid and cyclopoid copepods and hemiptera, respectively. It was thought that ea eh group would present a different kind of disperson and survival if the ponds dried up. Table 1 shows the values of quadrats, ponds and organisms used for the analysis, where Xis the mean

Toble 1. Spatial distribution trends of ponds and organisms. See text for explanation.
E- W direction N-S direction
No. No. No. spp. No. spp. No. spp. No. spp. No. No. No. spp. No. spp. No. spp. No. spp. quadrat ponds watermites calanoids cyc1opoids Hemiptera quadrat ponds watermites calanoids cyc1opoids Hemiptera
4 4 O 1 5 4 2 2 2 O 4 6 3 O 3 5 4 3 3 4 O
9 O O O O O 8 2 4 6 7 1 10 4 17 8 18 5 10 4 6 4 3 2 12 3 3 3 2 12 10 7 13 4 6 16 13 2 3 1 2 11 5 17 3 8 13 12 5 4 2 5 7 11 3 12 5 10 6 11 6 11 9 14 9 12 7 14 6 19 15 11 7 7 8 10 11 10 1 O O O 3 10 3 2 2 5 8 9 1 O O 3 3 9 2 7 O 2 11 9 4 8 3 7 10 8 7 24 5 13 12 6 3 3 O 6 9
4 O O O O O 3 O O 5
X=0.349 X=0.974 X=0.305 X=0.64 X=0.805
r=6 r=7 r=6 r=6 r=5 X=0.349 X=0.618 X=0.50 X=0.311 X=0.772
n¡=5 n¡=5 n¡=4 n¡=4 n¡=8 r=8 r=7 r=4 r=6 r=9 rc=3 rc=3 rc=3 rc=3 rc=3
n2=7 n2=7 n2=8 n2=8 n2=6 n¡=7 n¡=6 n¡=4 n¡=8 n¡=7 rc=3 rc=3 rc=3 rc=3 rc=3
n2=7 n2=8 n2= 10 n2=6 n2=7
N
~

210
number of ponds or organisms per quadrat, r is the number of runs and ni and n2 the number of + and - signs respectively.
The null hypothesis, which states that the distribution of ponds and organisms in the area of study is random, could not be rejected in any case. That does not mean that random distribution or organisms has really been proved (Pielou, 1969).
This result is reinforced, as we will see below, when the faunal and geographic similarity between ponds is examined. Neighbouring ponds do not necessarily contain similar fauna.
2. AbioticlBiocenotic trend
First we have analyzed whether there is a clear pattern of distribution of ponds in relation to abiotic variables. Figure 2 and Jable 2 synthesize the values of the abiotic variables.
Two different analyses have been performed, one of classification and the other of ordination by p.e.A. Fig. 3 shows the resulting dendogram obtained from clustering with the following abiotic variables: pond surface and depth, hardness, alka~_ linity, pH, altitude, vegetation and bottom type (this was codified as follows: muddy = 1; stony/muddy = 2; sandy = 3). At an amalgamation distance of 1.2888, 6 cluster groups were obtained. Despite sorne minor disagreement, these groupings could be explained in terms of the temporary or permanent nature of the ponds. Minor disagreement could be due to the conflicting nature of certain ponds, that, in very dry years, could behave as temporary, and, in wet ones, as permanent ponds.
To clarify tbis hypothesis, a p.e.A. has been done using the following variables: altitude, area, depth, alkalinity, hardness and pH. Table 3 shows the eigen values, the cumulative proportion of total variance for 6 factors, and contribution ofvariables to factors 1 and 2. The first two factors explain more than 670/0 of the total variance. Figure 4 plots the ponds in the coordinated diagram formed by the first two factors. Looking at the contributions of variables to factors, alkalinity, pH and hardness have the highest contribution to factor 1 and depth, area and altitude to factor 2. If we eliminate pH and altitude for their lower variability, the coordinated space could be divided
Fig. 2. Proportional contribution of different characteristic foro the ponds of the Sierra de Guadarrama. A- Pond type: Temporal (T) = 56.750/0;
Permanent (P) = 43.35% B- Altitude: 900-1000m. (a) = 21.62%;
100l-1200m. (b) = 56.76% 120l-1600m. (e) = 10.81%; 1601 (d) = 10.810/0
C- Alcalinity: 0.15 -0.5 (a) = 24.32%; 0.6-1.2 (b) = 43.24% 1.3 (e) = 32.43%
D- Hardness: 0.5-2 mEq/1 (a) = 43.24%; 2.1-6 (b) = 32.43% 6.l-9 (e) = 18.91%; 9.1 (d) = 5.4%
E- pH: 5.5-6.5 (a) = 83.78%; 6.6-7.5 (b) = 16.21%
into a fourth area plane, where area I and li ·correspond to permanent ponds with low and high hardness and alkalinity, respectively. Area III and IV have temporary ponds with low and high hardness and alkalinity, respectively. It seems, then, that abiotic variables define ponds in terms of their temporary or permanent nature, although this pattern is not so well defined as to allow us to make a clear hierarchical classification. Although the extremes, the always permanent and temporary ponds, could be clear1y distinguished, between t~em exists a continuum of alternatively temporary or permanent

211
Table 2. Principal characteristics of the small water bodies of the Sierra de Guadarrama.
Ponds (number)
01 02 03 04 05 06 07 08 09 10 11 12 13 14 15 16A 17 18 19 20 21 22 23 25 26 27 28 32 33 34 35 36 37 38 39 40 41
U.T.M. (30T)
V 1296215 VL269293 VI 329335 VL342343 VL337058 VL358227 UL988191 UL975192 VL013208 VL091275 VLl32286 VLl21315 VL425241 VL484287 V 1460346 VL486458 VL081056 VLl22056 VL186068 VLl41395 VLl78411 VL229440 VL207454 VL287463 VL312465 VL521381 VL327559 VL638414 VL492635 VL327102 VLl97073 VLl59111 VLl59288 VLl95214 VL208214 VL221231 VL213067
Altitude (m)
1740 1150 1120 1120 940
1280 1180 1160 1140 1120 1120 1100 1200 970
1160 1150 980
1040 1000 llOO 1175 1222 1130 1200 1190 990
1020 1250 1060 900 990
1325 1200 2021 1980 1900 950
Vegetation
grass absent absent algae mixture grass grass grass mixture algae grass grass algae grass grass grass grass grass mixture mixture grass grass mixture grass grass grass grass grass algae grass grass mixture absent absent grass grass mixture
Type
temporary temporary permanent temporary temporary temporary temporary temporary permanent permanent temporary temporary permanent temporary temporary temporary temporary temporary permanent temporary temporary permanent temporary temporary temporary permanent permanent permanent permanent temporary temporary permanent permanent permallent permanent permanent permanent
Area (m2)
480 280 280
34 140 30 4 9
194 167 82
51 29 27 19 50 74 16 65 30 56 28
148 182 600 230 300 800 26 23 13
lOO 35
900 25
250 250
Depth (cm)
30 76
300
15 43 40 24
6 43 30 27 42 16 7
II 25 9
47 31 22 15 23 19 24 21 41 40 52 34 6
17 15 44
900 20 16
400
A1calinity (mEq/l)
2.9 2.9 1.5
1.5 1.4 0.5 2.6 2.0 1.2 0.8 0.6 0.8 0.7 1.0 0.3 0.4 1.8 0.7 0.5 0.8 0.8 1.0 0.4 0.6 0.4 1.0 1.4 0.4 5.0 2.0 3.2 0.8 0.6 0.6 0.4 0.4 1.2
5.60 6.72 8.40
8.40 6.16 1.12 8.96 5.60 1.68 1.12 1.20 3.35 2.80 3.36 1.12 0.84 2.80
29.12 1.68 1.68 1.12
5.04 1.68 1.12
1.68 2.24 2.24 1.12
14.00 8.96 7.84 2.24 2.80 1.68 1.12 0.56 2.80
pH
6.5 6.5 6.5 6.5 6.5 6.5 7.2 6.8 6.5 6.4 6.4 6.5 6.5 6.5 6.5 6.5 6.5 6.5 6.5 6.5 6.2 7.2 6.4 6.2 6.5 6.0 6.5 6.0 7.0 6.9 7.2 6.4 6.4 6.1 6.0 6.0 6.5
ponds, that depends more on the climate of the area than the characteristics of the pondo
Prior to cluster anaIysis those ponds with only one species and those species found in only one pond were eliminated. Figure 5 shows the dendogram obtained through a similarity matrix. At a 50010 similarity level, 6 cluster groups are obtained. If they are analysed with regard to the temporary or permanent nature of the pond, it is found that there is no congruence in any one case. Permanent pond fauna remain in permanent ponds and temporary fauna in temporary ones.
3. Water mite biocenotic trend
Patterns of ordination and classification of the fauna have been obtained only of water mites, for which extensive data from the sierra already exist (0.Valdecasas & Camacho, 1986). Jable 4 shows pond water mite distribution in the sierra. Suspecting that fauna similarity could be due to

212
J 7790
1 J
I 1
I 1
1
J 1
~ ..... ,....L
-'-
..L , 1288
_ ....
-
207
38183339402 32632411 1310372821 19616 1514123620239252717 541 22 8 3435 71
Fig. 3. Hierarchical c1assification of ponds, based on environmental variables.
the proximity of ponds rather than to their duration, a new classification was done, taking into account geographic locality and coordinates. The classification obtained, that clearly forms groups of neighbouring ponds, does not show any congruence with the previous faunal classification.
In order to take into account, at the same time, species and pond contribution to a multidimension-
Toble 3. Eigen values fpr six factors obtained t\1rough a P.C.A.
Factor
2 3 4 5 6
Eigen values
2.687957 1.368274 0.650225 0.584381 0.454958 0.254205
Cumulative proportion of total variance
0.447993 0.676039 0.784409 0.881806 0.957633 1.000000
o "
o l2
• "
o "
o o ., '.
t
• , o
--------------~~~ .. ~. --------~------~' • • o ..
o "
• Temporary O Permanent
2.5 nI ': n' ".~ I;l b •• I !"~, ~H
•• "ce n , • JI
• 1 •
"
Fig. 4. Two factor projection of ponds based on a P.C.A. of the environmental variables: temporary; permanent.
c ·

~
Table 4. Pond water mite distribution. .
Hydrachna globosa Hydrachna rophaloidea Eylais extendens Eylais tantilla Eylais hamata Hydryphantes ruber Thyas barbigera Euthyas truncata Diplodontus scapularis Hydrodroma despiciens Limnesia koenikei Hygrobates longipalpis Neumania deltoides Piona nodata Piona conglobata Wettina podagrica Tiphys ornatus Tiphys latipes Pionopsis lutescens Arrenurus ancoriferus Arrenurus distans Arrenurus redrogensis Arrenurus radiatus Arrenurus szalayi Arrenurus papillator Arrenurus octagonus
..
1 2 3 4 5 6 7 8 8 9 10 11 12 13 14 15 16 16 17 18 192021 2223 2425 26 27 28 29 30 31 32 33 34 35 36 37 38 394041 A B
X X XX XX X X
x xx x x X
X
X X
X
X X X
X X X
X XX X
X
x X
X
X
X X xx
X X X XX X
X X
X X
X X X
X XX X X
X
x
xx
X XXX
X
X
XX
X
X
X
X
X X
X X
X
X
X X X X
X
N -w

214
I
I I
so
I r- .L ,......L-
'-
, r-- -'- r-
100
I I I I 9 28 14 4 22 11 5 8A 8 25 35 34 16A 31 16a 2 20 17 26 36 41 39 33
Fig. 5. Hierarchical classification of ponds based on faunal similarity.
Table 5. Ponds and species relative contributions to factor 1 and 2 of the correspondence ana1ysis.
Factor 1 Factor 2 Factor 1 Factor 2
C02 0.100 0.434 Hydrachna globosa (HYG) 0.278 0.329 C04 0.001 0.078 Hydrachna rophaloidea (HYR) 0.317 0.026 C05 0.742 0.095 Eylais extendens (EYE) 0.705 0.019 C08 0.742 0.095 Eylais hamata (EYH) 0.606 0.014 C09 0.013 0.046 Eylais tantilla (EYT) 0.015 0.077 CIO 0.312 0.099 Hydryphantes ruber (HYU) 0.185 0.112 Cll 0.742 0.095 Thyas barbigera (THB) 0.167 0.055 C14 0.085 0.011 Euthyas truncata (EUT) 0.042 0.257 C16 0.593 0.012 Diplodontus scapularis (DIS) 0.009 0.036 C17 0.201 0.028 Hydrodroma despiciens (HYD) 0.096 0.062 C18 0.109 0.073 Limnesia koenikei (LIK) 0.088 0.288 C19 0.115 0.067 Hygrobates longipalpis (HYL) 0.012 0.034 C20 0.102 0.333 Neumania 'deltoides (NED) 0.088 0.288 C21 0.153 0.054 Piona nodata (PIN) 0.001 0.465 C22 0.061 0.341 Piona conglobata (PIC) 0.012 0.034 C25 0.088 0.130 Wettina podagrica (WEP) 0.007 0.009 C26 0.082 0.300 Tiphys ornatus (TIO) 0.001 0.191 C28 0.091 0.005 Tiphys latipes (TIL) 0.163 0.011 C30 0.312 0.099 Pionopsis lutescens (PIL) 0.063 0.234 C31 0.141 0.005 Arrenurus ancoriferus (ARA) 0.009 0.036 C33 0.016 0.122 Arrenurus distans (ARD) 0.109 0.244 C34 0.036 0.000 Arrenurus rodrigensis (ARR) 0.149 0.270 C35 0.062 0.001 Arrenurus radiatus (ART) 0.149 0.270
,~
C36 0.310 0.169 Arrenurus szalayi (ARS) 0.149 0.270 C39 0.028 0.091 Arrenurus papillator (ARP) 0.000 0.190
1
C41 0.482 0.301 Arrenurus octagonus (ARO) 0.278 0.084 ~

. .
...
'H
"D ,,, en
• 'D C"
C39 AA,. ... .. ,
CDO CD' cn
cn
.,.
/' i ; i i c .. , C20~IL C02
\c •• en l
C09 i ,..- ._./
/ " AA ..
Fig. 6. 1\vo factors projection of the analysis of correspondence between water mite species and ponds. Vertical axis interpreted in terms ofthe temporary-permanent nature of ponds. Horizontal axis interpreted in terms of the early-Iate development of water mites.
al, complementary space, we have done a correspondence analysis for the water mite fauna. Thble 5 ineludes the factor contributions for ponds and water mite species. The first three factors account for 460/0 of the total variance (I = 20.28%; II = 14.62%; III = 12.160/0). Figure 6_sh'?~s..!h~_~c~tte~ di!!-gr~m ofthe first tWQ factors, and our interpretation ofthe ordination scheme.
Ponds ordinate in the first factor mainly with respect to their permanent or temporary nature. Those that belong more elearly to one or other of these categories have the highest contribution to this factor. Factor two does not have a elear interpretation in terms of pond ordination.
The species with the highest contribution to factor I are, on the one hand: Hydrachna rhopaloidea, Arrenurus octagonus and Hydrachna globosa and, at the other extreme, the species of the genus Eylais: E.
215
extendens and E. hamata predominate. Factor 11 is strongly influenced at its positive extreme by Hydrachna globosa, Arrenurus octagonus, Limnesia Koenikei and Neumania deltoides. The highest contributions belong to the negative part of the projected factor, with Piona nodata, Euthyas truncata and Pionopsis lutescens being the most important species .
A detailed study of species contribution to factors I and 11 reveals a vertical gradient of temporary versus permanent species, and an early versus late gradient in the horizontal direction. Eylais extendens and E. hamata predominate in temporary waters but Hydrachna globosa, H. rophaloidea and Arrenurus octagonus are typical of permanent waters. Those species between Pionopsis lutescens and Piona nodata and Hydracna globosa, Arrenurus octagonus, Limnesia koenikei and Neumania deltoides ordinate in an early-Iate fashion.
On the whole, the early species tend to be present in temporary waters and the gradient moves toward permanent waters where the 'later' species predominate.
Discussion
The irregular distribution of ponds through the area of study, although not completely rejecting the random null hypothesis, does not allow us to accept it. Not every quadrat was searched completely for the total number of ponds they contained. Once a pond was located in a quadrat, the search was stopped, and, unless sorne other pond in the quadrat was in sight, no more were ineluded. In sorne areas, the distribution of the ponds studied reflects their accessibility, although not aH were neaÍ' a road or path.
The distribution of organisms in the ponds does not show any definite pattern. Even the proximity of ponds does not assure similarity in their fauna. This fact is a weH-recognized one in the literature (Wiggins et al., 1981) of different kinds of organisms. In our case, several factors seem to combine to produce what should be a complex pattern. Even within the same group of organisms, different species have different ways of dispersing and enduring until the next cyele. Sorne of them survive in the same pond
216
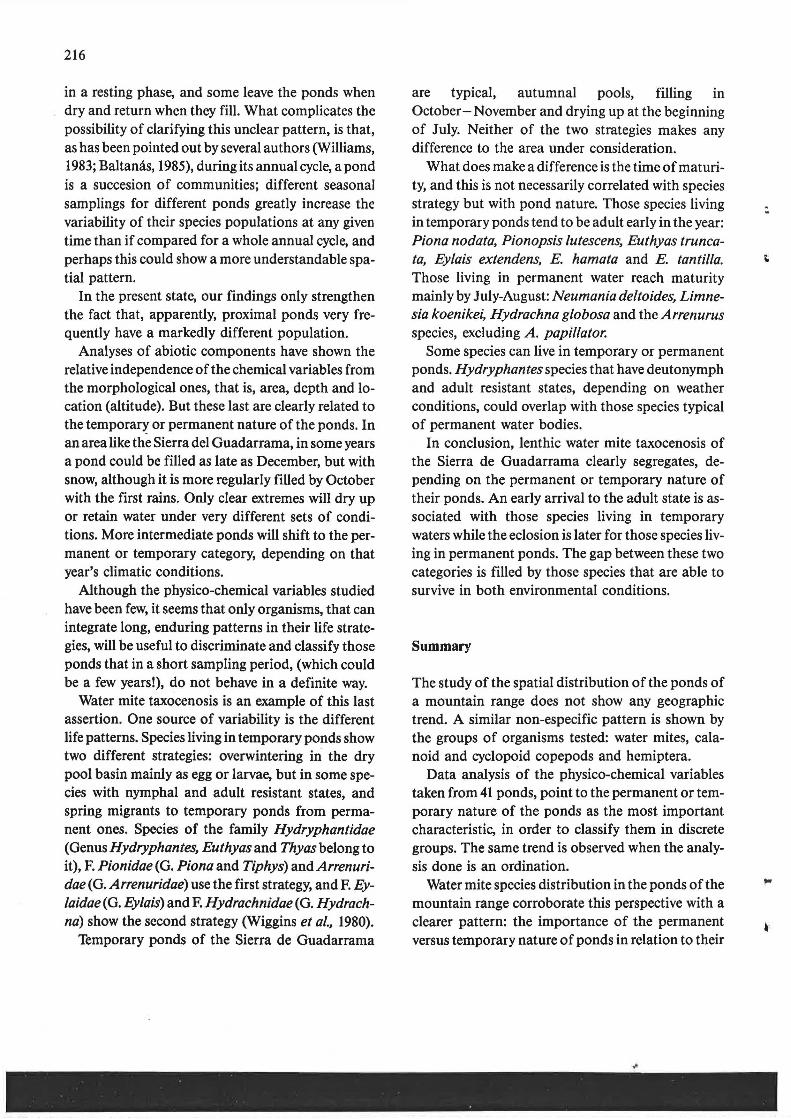
in a resting phase, and sorne leave the ponds when dry and return when they fill. What complicates the possibility of clarifying this unclear pattern, is that, as has been pointed out by several authors (Williams, 1983; Baltanás, 1985), during its annual cycle, a pond is a succesion of communities; different seasonaJ samplings for different ponds greatly increase the variability of their species populations at any given time than if compared for a whole annual cycle, and perhaps this could show a more understandable spatial pattern.
In the present state, our findings only strengthen the fact that, apparently, proximal ponds very frequently have a markedly different population.
Analyses of abiotic components have shown the relative independence ofthe chemical variables from the morphological ones, that is, area, depth and 10-cation (altitude). But these last are clearly related to the temporar~ or permanent nature of the ponds. In an area like the Sierra del Guadarrama, in sorne years a pond could be filled as late as December, but with snow, although it is more regularly filled by October with the first rains. Only clear extremes will dry up or retain water under very different sets of conditions. More intermediate ponds will shift to the permanent or temporary category, depending on that year's climatic conditions.
Although the physico-chemical variables studied have been few, it seems that only organisms, that can integrate long, enduring patterns in their life strategies, will be use fui to discriminate and classify those ponds that in a short sampling period, (which could be a few years!), do not behave in a definite way.
Water mite taxocenosis is an example of this last assertion. One source of variability is the different life patterns. Species living in temporary ponds show two different strategies: overwintering in the dry pool basin mainly as egg or larvae, but in sorne species with nymphal and adult resistant states, and spring migrants to temporary ponds from permanent ones. Species of the family Hydryphantidae (Oenus Hydryphantes, Euthyas and Thyas belong to it), F. Pionidae (G. Piona and Tiphys) and Arrenuridae (G. Arrenuridae) use the first strategy, and F. Ey/aidae (O. Ey/ais) and F. Hydrachnidae (G. Hydrachna) show the second strategy (Wiggins et a/., 1980).
Temporary ponds of the Sierra de Guadarrama
are typical, autumnal pools, filling in October- November and drying up at the beginning of July. Neither of the two strategies makes any difference to the area under consideration.
What do es make a difference is the time of maturity, and this is not necessarily correlated with species strategy but with pond nature. Those species living in temporary ponds tend to be adult early in the year: Piona nodata, Pionopsis lutescens, Euthyas truncata, Ey/ais extendens, E. hamata and E. tan tilla. Those living in permanent water reach maturity mainly by July-August: Neumanía deltoides, Limnesia koenikeí, Hydrachna globosa and the A rrenurus species, excluding A. papillator.
Sorne species can live in temporary or permanent ponds. Hydryphantes species that have deutonymph and adult resistant states, depending on weather conditions, could overlap with those species typical of permanent water bodies.
In conclusion, lenthic water mite taxocenosis of the Sierra de Guadarrama clearly segregates, depending on the permanent or temporary nature of their ponds. An early arrival to the adult state is associated with those species living in temporary waters while the eclosion is later for those species living in permanent ponds. The gap between these two categories is filled by those species that are able to survive in both environmental conditions.
Summary
The study of the spatial distribution of the ponds of a mountain range does not show any geographic trend. A similar non-especific pattern is shown by the groups of organisms tested: water mites, calanoid and cyclopoid copepods and hemiptera.
Data analysis of the physico-chemical variables taken from 41 ponds, point to the permanent or temporary nature of the ponds as the most important characteristic, in order to classify them in discrete groups. The same trend is observed when the analysis done is an ordination.
Water mite species distribution in the ponds of the mountain range corroborate this perspective with a clearer pattern: the importance of the permanent versus temporary nature of ponds in relation to their
::.

;
,
\ '.1
inhabitant organisms. An early-Iate trend of adult eclosion is related to pond type. Early species are favoured by temporary ponds and 'later' species by permanent ponds.
Acknowledgements
Carlos Puch, Angel Baltanás and A. Fernández Lop improved this papero M. R. Miracle has indirectly made it possible. This research was supported by funds provided by the C.A.Y.C.I:r. (Grand No. 1530/82.)
References
Alvarez, J. & D. Selga, 1967. Observaciones sobre invertebrados dulceacuicolas de los alrededores de Madrid. Bol. R. Soco Española Hist. Nat. (Biol.) 65: 171-197.
Arevalo, C., 1921. Larvas planktonicas de Arquipteros de la Laguna de Peñalara. Real. Soco Esp. Hist. Nat. 50: 169 -172.
Arevalo, C., 1931. Los montruos de la Laguna de Peñalara. Cultura Segoviana, 1.
Baltanas, A., 1985. Variacion temporal de la fauna de Invertebrados de una charca temporal. Tesina de licenciatura. U niv. Autonoma Madrid, 194 pp.
Dickson, W. J., 1983. BMDP statistical software. University California Press, 734 pp.
217
G.-Valdecasas, A., 1981. Las hidracnelas de la sierra de Guadarrama: Taxonomia, distribución y ecología. Tesis doctoral. Univ. Complutense Madrid, 532 pp.
G.-Valdecasas, A., A. F. Lop & A. 1. Camacho, 1984. Recurrence and equilibrium oftemporal ponds of a mountain range in central spain. Arch. Hydrobiol. 102: 43-51.
G.-Valdecasas, A. & A. 1. Camacho, 1986. Las hidracnelas leniticas de la Sierra de Guadarrama. Graellsia XLII: 149-160.
HartIand-Rowe, R., 1972. Thelimnologyoftemporarywatersand the ecology of Euphyllopoda. In: Clarck, R. B. & R. Wootton (eds.), Essays in Hydrobiology: 15-31. Univ. Exeter.
Lebart, L. & J. P. Fenelon, 1973. Statistique et informatique appliquees. Dunod, Paris.
Margalef, R., 1947. Datos para la hidrobiologia de la Sierra de Guadarrama. P. Inst. Biol. Apl. 6: 5 - 21. -
Pielou, E. C., 1969. An introduction to mathematical ecology. Wiley-Interscience, New York, 286 pp.
Siegel, S., 1956. Nonparametric statistics for the behavioral sciences. Mcgraw-hill, New York, 312 pp.
Sneath, P. H. A. & R. S. Sokalk, 1973. Numerical Taxonomy. W. H. Freeman & Co, San Francisco, 573 pp.
Viets, K., 1930. Zur Kenntnis der Hydracarinen-Fauna von Spanien. Arch. Hydrobiol. 21: 175-240, 359-446.
Wiggins, G. B., R. Mackay & 1. M. Smith, 1980. Evolutionaryand ecological strategies of animals in annual temporary pools. Arch. Hydrobniol. 58: 97 - 206.
Williams, D. D., 1983. The natural history of a neartic temporary pond in Ontario with remarks on continental variations in such habitats. Int. Rev. ges. Hydrobiol., 68: 239-253.
Wratten, S. D. & G. L. A. Fry, 1980. Field and laboratory exercises in ecology. E. Arnold, London, 227 pp.