Embed Size (px)
Citation preview

LETTERS
Sparse optical microstimulation in barrel cortexdrives learned behaviour in freely moving miceDaniel Huber1,2, Leopoldo Petreanu1,2, Nima Ghitani1, Sachin Ranade2, Tomas Hromadka2, Zach Mainen2
& Karel Svoboda1,2
Electrical microstimulation can establish causal links between theactivity of groups of neurons and perceptual and cognitivefunctions1–6. However, the number and identities of neuronsmicrostimulated, as well as the number of action potentialsevoked, are difficult to ascertain7,8. To address these issues weintroduced the light-gated algal channel channelrhodopsin-2(ChR2)9 specifically into a small fraction of layer 2/3 neurons ofthe mouse primary somatosensory cortex. ChR2 photostimulationin vivo reliably generated stimulus-locked action potentials10–13 atfrequencies up to 50 Hz. Here we show that naive mice readilylearned to detect brief trains of action potentials (five light pulses,1 ms, 20 Hz). After training, mice could detect a photostimulusfiring a single action potential in approximately 300 neurons.Even fewer neurons (approximately 60) were required for longerstimuli (five action potentials, 250 ms). Our results show that per-ceptual decisions and learning can be driven by extremely briefepochs of cortical activity in a sparse subset of supragranular cor-tical pyramidal neurons.
We used in utero electroporation14 to introduce ChR2 fused to agreen fluorescent protein (GFP) (ChR2–GFP15) together with a redfluorescent cytosolic marker15 (RFP) into neocortical pyramidal neu-rons (Fig. 1a, Methods). In the adult brain, ChR2–GFP expressionwas restricted to pyramidal cells in layers 2/3 (more than 99.4%),mainly in the barrel cortex (Figs 1a and 2a). In vivo two-photonimaging and retrospective immunohistology revealed that ChR2–GFP was localized to the neuronal plasma membrane. ChR2–GFPwas expressed in about half (48.9 6 5.3%, n 5 10, five mice; seeMethods) of red fluorescent layer 2/3 neurons (SupplementaryMovie 1). ChR2–GFP invaded the soma, dendrites and axons(Fig. 1b, c). ChR2–GFP expression was stable for at least 8 monthsand did not seem to perturb neuronal morphology (Fig. 1a–c,Methods).
We next characterized the responses of ChR2–GFP-expressingneurons to photostimulation in anaesthetized mice. To sample fromthe entire population of ChR2–GFP-expressing neurons, unbiased byChR2–GFP expression level, we recorded from red fluorescent neu-rons using two-photon targeted loose-patch recordings16 (Fig. 1c, d).Photostimuli consisted of light pulses, produced by a blue miniaturelight-emitting diode (LED; 470 nm), centred on the recording win-dow (Fig. 1d). At maximum light intensities (Imax 5 11.6 mW mm22
at the surface of the brain, centred on the diode; 1–10 ms duration)about half (51%) of the patched red neurons (n 5 39/77, eight mice)responded reliably to single photostimuli with at most one actionpotential. Increasing the photostimulus duration beyond 10 ms didnot reveal additional responsive neurons. The other half of thepatched neurons did not fire spikes time-locked to the photostimuli,and presumably corresponded to ChR2–GFP-negative neurons.These measurements indicate that most ChR2–GFP-positive
neurons can be driven to spiking using our photostimulation system;furthermore, excitation of layer 2/3 neurons through indirect syn-aptic pathways was weak.
1Howard Hughes Medical Institute, Janelia Farm Research Campus, Ashburn, Virginia 20147, USA. 2Cold Spring Harbor Laboratory, Cold Spring Harbor, New York 11724, USA.
Layer II/III
Layer IV
Layer V
Layer VI
Dura
Externalcapsule
200 ms
1 mV
50 Hz20 Hz
a
e
h
25 µm 50 µm200 µm
f
b c
g
0 20 40 60 80 100 Light intensity
(percentage of Imax)Light intensity
(percentage of Imax)
Pro
bab
ility
of s
pik
ing
above 0 20 40 60 800
0.2
0.4
0.6
0.8
1
Frac
tion
of n
euro
ns s
pik
ing
above1000
0.2
0.4
0.6
0.8
1
d
Figure 1 | ChR2-assisted photostimulation of layer 2/3 barrel cortexneurons in vivo. a, Coronal section through the electroporated mousesomatosensory cortex after immunohistochemical staining for ChR2–GFP.b, Individual layer 2/3 neuron, side view. c, Maximum value projection (topview) of an image stack in vivo (see Supplementary Movie 1) showing layer2/3 neurons expressing ChR2–GFP and cytosolic RFP. d, Schematic of therecording geometry. e, Action potentials recorded from one ChR2–GFP-positive neuron. Blue bars indicate photostimuli (1 ms duration,11.6 mW mm22, 20 Hz). f, Same as e, 50 Hz. g, Probability of spiking as afunction of light intensity (1 ms duration, five repetitions per condition, 15 sbetween stimuli) (Imax 5 11.6 mW mm22). Each line corresponds to adifferent neuron, each colour to a different animal. Neurons that could onlybe driven with photostimuli longer than 1 ms were pooled at the far right(above). h, Cumulative fraction of recorded neurons firing at variousthreshold intensity levels (computed from the data in g).
Vol 451 | 3 January 2008 | doi:10.1038/nature06445
61Nature ©2007 Publishing Group

When stimulated with 1 ms light pulses, ChR2–GFP-expressingneurons were able to follow frequencies up to 20 Hz (Fig. 1e) andin some cases up to 50 Hz (Fig. 1f). These frequencies are comparableto, or higher than, typical spike rates in the barrel cortex17. Actionpotentials followed the photostimuli with short delays (range3–11 ms) and little jitter (Supplementary Fig. 1).
We next determined the relation between photostimulus intensityand the probability of spiking of ChR2–GFP-expressing neurons.During cell-attached recordings we stimulated with 1 ms light pulseswhile varying the photostimulus. With decreasing light intensity,neurons switched abruptly from firing action potentials with highprobability to firing no action potentials. The photostimulus inten-sity required to trigger action potentials varied substantially acrossthe population of ChR2–GFP-expressing neurons (Fig. 1g). Controlexperiments in brain slices revealed that the brightness of ChR2–GFPmeasured in individual cells was inversely correlated with firingthreshold (Supplementary Fig. 2); in contrast, the firing thresholdwas independent of the depth of the recorded neuron in vivo(Supplementary Fig. 3). The variability in firing threshold in termsof photostimulus intensity therefore primarily reflects heterogeneityin the expression level of ChR2–GFP in individual neurons. Theseresults confirm that ChR2 can transduce photostimuli into preciselytimed spike trains in vivo18. Furthermore, the fraction of activatedneurons can be tuned by modulating the excitation light intensity(Fig. 1h).
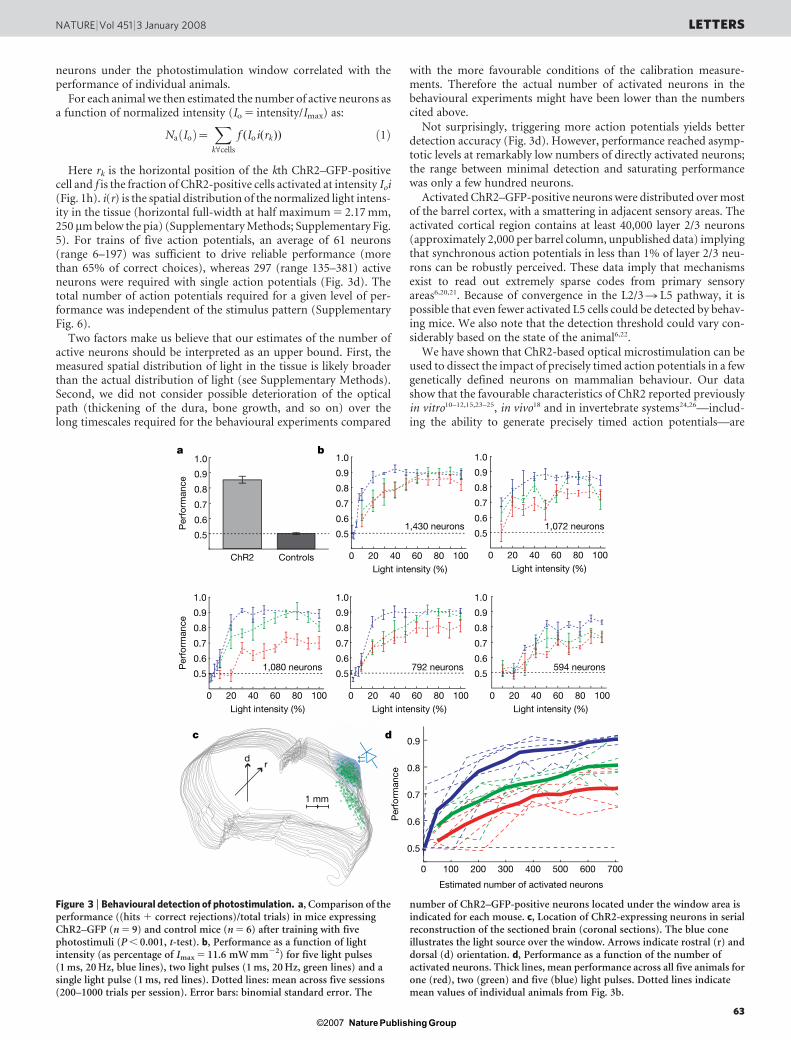
Can awake mice learn to report photostimulation of layer 2/3pyramidal neurons in the barrel cortex? To address this questionwe delivered light pulses to ChR2–GFP-expressing neurons in freelymoving animals (Fig. 2a). We first implanted a window above thebarrel cortex19, which provided optical access for photostimulationand screening the density of electroporated neurons. We nextmounted the miniature LED centred on the imaging window(Fig. 2a; Methods). During the behavioural sessions the mice were
temporarily connected to an LED controller (Methods). Mice weretrained in a detection task to associate photostimulation of ChR2–GFP-expressing neurons (five light pulses, 20 Hz, 1 ms duration)with water reward on one of two choice ports (Fig. 2b, left port).After four to seven training sessions (200–800 trials per session) allanimals expressing ChR2–GFP (n 5 9) reliably reported photosti-mulation; in the presence (absence) of a photostimulus, mice chosethe left (right) port (Fig. 3a, range 72–93% correct, defined as hits 1
correct rejections, divided by total number of trials; SupplementaryMovie 2). Control mice without electroporated neurons (n 5 6) per-formed at chance levels (50.1%, P . 0.70, t-test), even after 25 train-ing sessions (Fig. 3a and Supplementary Fig. 4). These experimentsdemonstrate that photostimulation of layer 2/3 neurons can driverobust behaviour.
How many action potentials triggered by photostimulation arenecessary for perception? To address this issue we further trainedfive mice to respond to one, two and five photostimuli at 20 Hz(example in Fig. 2c). Although performance decreased with fewerpulses, all ChR2–GFP-expressing mice were able to detect singleaction potentials in the activated cells, even at modest photostimulusintensities (Fig. 3b, red lines).
To determine the relation between performance and the numberof neurons directly activated by light, we measured behaviour as afunction of light intensity (Fig. 3b). As expected, behavioural per-formance decreased with decreasing photostimulus intensity,although the psychometric curves varied from animal to animal.For example, at the lowest intensities probed (10% of Imax) someanimals continued to discriminate, whereas others performed atchance levels.
We counted the number of ChR2–GFP-positive somata andmeasured their positions (Fig. 3c; Methods). Between 594 and 1430ChR2–GFP-positive neurons were found in a 2 mm diameterwindow (Fig. 3b, c; Methods). The number of ChR2–GFP-positive
b
No stimulation
Miss Light pulses
Correct reject
Right port
Leftport
False alarm
Hit
Trialinitiation
a Connector
Secondlayer
Cortex
LED
Skull
Coverglass
Firstlayer
Masking flash
Trial initiation
0 0.2 0.4 0.6Time (s)
0.8 1.0
100
90
80
70
60
50
40
30
20
10
Light pulse (1 ms)
Inte
nsity
(%)
c
Figure 2 | Photostimulation in freely moving mice performing a detectiontask. a, Schematic of the photostimulation setup (see Methods).b, Schematic of the behavioural apparatus and reward contingencies. Themouse initiates a trial by sticking its snout into the central port. Photostimuliare applied during a stimulation period (300 ms) accompanied by a series ofbright blue light flashes delivered to the behavioural arena (30 Hz, 300 ms) tomask possible scattered light from the portable light source. The mouse thendecides to enter either the left or the right port for a water reward. If aphotostimulus was present, the choice of the left port was rewarded with a
drop of water (hit, green star) whereas the choice of the right port lead to ashort timeout (4 s, miss, red star). If the stimulus was absent, only the choiceof the right port was rewarded with reward (correct reject, green circle)whereas the left port lead to a timeout (4 s, false alarm, red circle). c, Datafrom one session (200 trials) with a single stimulus (1 ms) with decreasinglight intensities. Each horizontal line delineates 20 trials at fixed lightintensity. Blue dots indicate the presence or absence of a photostimulus.Stimulated and non-stimulated trials were presented pseudo-randomly witha probability of 0.5.
LETTERS NATURE | Vol 451 | 3 January 2008
62Nature ©2007 Publishing Group
neurons under the photostimulation window correlated with theperformance of individual animals.
For each animal we then estimated the number of active neurons asa function of normalized intensity (Io 5 intensity/Imax) as:
Na Ioð Þ~X
kVcells
f (Ioi(rk)) ð1Þ
Here rk is the horizontal position of the kth ChR2–GFP-positivecell and f is the fraction of ChR2-positive cells activated at intensity Ioi(Fig. 1h). i(r) is the spatial distribution of the normalized light intens-ity in the tissue (horizontal full-width at half maximum 5 2.17 mm,250 mm below the pia) (Supplementary Methods; Supplementary Fig.5). For trains of five action potentials, an average of 61 neurons(range 6–197) was sufficient to drive reliable performance (morethan 65% of correct choices), whereas 297 (range 135–381) activeneurons were required with single action potentials (Fig. 3d). Thetotal number of action potentials required for a given level of per-formance was independent of the stimulus pattern (SupplementaryFig. 6).
Two factors make us believe that our estimates of the number ofactive neurons should be interpreted as an upper bound. First, themeasured spatial distribution of light in the tissue is likely broaderthan the actual distribution of light (see Supplementary Methods).Second, we did not consider possible deterioration of the opticalpath (thickening of the dura, bone growth, and so on) over thelong timescales required for the behavioural experiments compared
with the more favourable conditions of the calibration measure-ments. Therefore the actual number of activated neurons in thebehavioural experiments might have been lower than the numberscited above.
Not surprisingly, triggering more action potentials yields betterdetection accuracy (Fig. 3d). However, performance reached asymp-totic levels at remarkably low numbers of directly activated neurons;the range between minimal detection and saturating performancewas only a few hundred neurons.
Activated ChR2–GFP-positive neurons were distributed over mostof the barrel cortex, with a smattering in adjacent sensory areas. Theactivated cortical region contains at least 40,000 layer 2/3 neurons(approximately 2,000 per barrel column, unpublished data) implyingthat synchronous action potentials in less than 1% of layer 2/3 neu-rons can be robustly perceived. These data imply that mechanismsexist to read out extremely sparse codes from primary sensoryareas6,20,21. Because of convergence in the L2/3 R L5 pathway, it ispossible that even fewer activated L5 cells could be detected by behav-ing mice. We also note that the detection threshold could vary con-siderably based on the state of the animal6,22.
We have shown that ChR2-based optical microstimulation can beused to dissect the impact of precisely timed action potentials in a fewgenetically defined neurons on mammalian behaviour. Our datashow that the favourable characteristics of ChR2 reported previouslyin vitro10–12,15,23–25, in vivo18 and in invertebrate systems24,26—includ-ing the ability to generate precisely timed action potentials—are
1 mm
dr
a b
1,430 neurons
20 40 60 80 100
0.5
0.6
0.7
0.8
0.9
1.0
0Light intensity (%)
20 40 60 80 1000Light intensity (%)
20 40 60 80 1000Light intensity (%)
20 40 60 80 1000Light intensity (%)
c
0.5
0.6
0.7
0.8
0.9
1.0
0.5
0.6
0.7
0.8
0.9
1.0
0.5
0.6
0.7
0.8
0.9
1.0
0.5
0.6
0.7
0.8
0.9
1.0
ChR2 Controls
Per
form
ance
Per
form
ance
Estimated number of activated neurons
0 200 400 600
0.5
0.6
0.7
0.8
0.9
300100 500 700
d
1,072 neurons
20 40 60 80 100
0.5
0.6
0.7
0.8
0.9
1.0
0Light intensity (%)
594 neurons792 neurons1,080 neuronsPer
form
ance
Figure 3 | Behavioural detection of photostimulation. a, Comparison of theperformance ((hits 1 correct rejections)/total trials) in mice expressingChR2–GFP (n 5 9) and control mice (n 5 6) after training with fivephotostimuli (P , 0.001, t-test). b, Performance as a function of lightintensity (as percentage of Imax 5 11.6 mW mm22) for five light pulses(1 ms, 20 Hz, blue lines), two light pulses (1 ms, 20 Hz, green lines) and asingle light pulse (1 ms, red lines). Dotted lines: mean across five sessions(200–1000 trials per session). Error bars: binomial standard error. The
number of ChR2–GFP-positive neurons located under the window area isindicated for each mouse. c, Location of ChR2-expressing neurons in serialreconstruction of the sectioned brain (coronal sections). The blue coneillustrates the light source over the window. Arrows indicate rostral (r) anddorsal (d) orientation. d, Performance as a function of the number ofactivated neurons. Thick lines, mean performance across all five animals forone (red), two (green) and five (blue) light pulses. Dotted lines indicatemean values of individual animals from Fig. 3b.
NATURE | Vol 451 | 3 January 2008 LETTERS
63Nature ©2007 Publishing Group

maintained in awake conditions and can be used effectively to drivelearning and behaviour.
Photostimulation of genetically defined neurons27 has key advan-tages compared with electrical microstimulation. Under typicalexperimental conditions, electrical microstimulation excites axonsnon-discriminately, probably including diverse local and long-rangeaxons7,8. Therefore, the cell type and cell location that drive behaviourin classical microstimulation experiments are poorly defined.Photostimulation of genetically defined neural populations naturallyovercomes these problems. Our estimates of the number of directlyactivated cortical neurons necessary to drive perception is lower thanprevious estimates based on electrical microstimulation28,29. Ourstimuli might be functionally more potent because a pure populationof excitatory neurons is activated, whereas electrical microstimula-tion drives a mixture of diverse excitatory and inhibitory neurons.The robust associative learning induced by ChR2-assisted photo-stimulation opens the door to study the circuit basis of perceptionand cognition in vivo.
METHODS SUMMARYIn utero electroporation. DNA solution (ChR2–GFP and either mCherry or
DsRedexpress (‘RFP’); 4:1 molar ratio; final concentration 2mgml21) was
injected into the right lateral ventricle of embryonic mice (E16). Layer 2/3
progenitor cells were transfected by in utero electroporation14,15.
Photostimulation and behaviour. An imaging window was implanted on the
electroporated mice19 at postnatal day 40–50. A miniature blue high-power
LED (470 nm peak wavelength, NFSB036BT, Nichia, Japan) was mounted on
the imaging window with black dental acrylic. The timing and intensity of the
LED was computer-controlled with a custom-built, low-noise current-source
circuit (see Methods). Mice were trained on a detection task to report photo-
stimulation (see Methods). The training protocol consisted of several phases;
transitions from one phase to the next were triggered by performance at
65% correct or above. Mice had restricted access to drinking water to maintain
80–85% of their pre-training weight. For calibrations using targeted cell-
attached recordings16 mice were placed under a custom-made two-photon
laser-scanning microscope controlled by ScanImage software19,30. For the
photostimulation the objective was removed and a miniature blue high-power
LED (as described above) was placed on the centre of the recording window(see Methods).
Histology. After completion of behavioural experiments, the brain from each
animal was cut into coronal or tangential sections (40–60mm thick) on a cryostat
(Leica, CM 3050S). The localization of ChR2–GFP-positive cell bodies was mea-
sured using Neurolucida software (MBF Bioscience).
Full Methods and any associated references are available in the online version ofthe paper at www.nature.com/nature.
Received 19 August; accepted 2 November 2007.Published online 19 December 2007.
1. Penfield, W. & Boldery, P. Somatic motor and sensory representation in thecerebral cortex of man as studied by electrical stimulation. Brain 60, 389–443(1937).
2. Salzman, C. D., Britten, K. H. & Newsome, W. T. Cortical microstimulationinfluences perceptual judgements of motion direction. Nature 346, 174–177(1990).
3. Romo, R., Hernandez, A., Zainos, A. & Salinas, E. Somatosensory discriminationbased on cortical microstimulation. Nature 392, 387–390 (1998).
4. Libet, B. in Handbook of Sensory Physiology (ed. Iggo, A.) 743–790 (Springer,Berlin, 1973).
5. Leal-Campanario, R., Delgado-Garcia, J. M. & Gruart, A. Microstimulation of thesomatosensory cortex can substitute for vibrissa stimulation during Pavlovianconditioning. Proc. Natl Acad. Sci. USA 103, 10052–10057 (2006).
6. Butovas, S. & Schwarz, C. Detection psychophysics of intracorticalmicrostimulation in rat primary somatosensory cortex. Eur. J. Neurosci. 25,2161–2169 (2007).
7. Tehovnik, E. J. Electrical stimulation of neural tissue to evoke behavioralresponses. J. Neurosci. Methods 65, 1–17 (1996).
8. Ranck, J. B. Jr. Which elements are excited in electrical stimulation of mammaliancentral nervous system: a review. Brain Res. 98, 417–440 (1975).
9. Nagel, G. et al. Channelrhodopsin-2, a directly light-gated cation-selectivemembrane channel. Proc. Natl Acad. Sci. USA 100, 13940–13945 (2003).
10. Boyden, E. S., Zhang, F., Bamberg, E., Nagel, G. & Deisseroth, K. Millisecond-timescale, genetically targeted optical control of neural activity. Nature Neurosci.8, 1263–1268 (2005).
11. Li, X. et al. Fast noninvasive activation and inhibition of neural and network activityby vertebrate rhodopsin and green algae channelrhodopsin. Proc. Natl Acad. Sci.USA 102, 17816–17821 (2005).
12. Ishizuka, T., Kakuda, M., Araki, R. & Yawo, H. Kinetic evaluation ofphotosensitivity in genetically engineered neurons expressing green algae light-gated channels. Neurosci. Res. 54, 85–94 (2006).
13. Bi, A. et al. Ectopic expression of a microbial-type rhodopsin restores visualresponses in mice with photoreceptor degeneration. Neuron 50, 23–33 (2006).
14. Hatanaka, Y., Hisanaga, S., Heizmann, C. W. & Murakami, F. Distinct migratorybehavior of early- and late-born neurons derived from the cortical ventricularzone. J. Comp. Neurol. 479, 1–14 (2004).
15. Petreanu, L., Huber, D., Sobczyk, A. & Svoboda, K. Channelrhodopsin-2-assistedcircuit mapping of long-range callosal projections. Nature Neurosci. 10, 663–668(2007).
16. Margrie, T. W. et al. Targeted whole-cell recordings in the mammalian brain invivo. Neuron 39, 911–918 (2003).
17. Fee, M. S., Mitra, P. P. & Kleinfeld, D. Central versus peripheral determinants ofpatterned spike activity in rat vibrissa cortex during whisking. J. Neurophysiol. 78,1144–1149 (1997).
18. Arenkiel, B. R. et al. In vivo light-induced activation of neural circuitry in transgenicmice expressing channelrhodopsin-2. Neuron 54, 205–218 (2007).
19. Gray, N. W., Weimer, R. M., Bureau, I. & Svoboda, K. Rapid redistribution ofsynaptic PSD-95 in the neocortex in vivo. PLoS Biol. 4, e370 (2006).
20. DeWeese, M. R., Wehr, M. & Zador, A. M. Binary spiking in auditory cortex.J. Neurosci. 23, 7940–7949 (2003).
21. Petersen, R. S., Panzeri, S. & Diamond, M. E. Population coding in somatosensorycortex. Curr. Opin. Neurobiol. 12, 441–447 (2002).
22. Ferezou, I., Bolea, S. & Petersen, C. C. Visualizing the cortical representation ofwhisker touch: voltage-sensitive dye imaging in freely moving mice. Neuron 50,617–629 (2006).
23. Zhang, Y. P. & Oertner, T. G. Optical induction of synaptic plasticity using a light-sensitive channel. Nature Methods 4, 139–141 (2006).
24. Nagel, G. et al. Light activation of channelrhodopsin-2 in excitable cells ofCaenorhabditis elegans triggers rapid behavioral responses. Curr. Biol. 15,2279–2284 (2005).
25. Wang, H. et al. High-speed mapping of synaptic connectivity usingphotostimulation in channelrhodopsin-2 transgenic mice. Proc. Natl Acad. Sci. USA104, 8143–8148 (2007).
26. Schroll, C. et al. Light-induced activation of distinct modulatory neurons triggersappetitive or aversive learning in Drosophila larvae. Curr. Biol. 16, 1741–1747(2006).
27. Lima, S. Q. & Miesenbock, G. Remote control of behavior through geneticallytargeted photostimulation of neurons. Cell 121, 141–152 (2005).
28. Salzman, C. D., Murasugi, C. M., Britten, K. H. & Newsome, W. T.Microstimulation in visual area MT: effects on direction discriminationperformance. J. Neurosci. 12, 2331–2355 (1992).
29. Tehovnik, E. J., Tolias, A. S., Sultan, F., Slocum, W. M. & Logothetis, N. K. Direct andindirect activation of cortical neurons by electrical microstimulation.J. Neurophysiol. 96, 512–521 (2006).
30. Pologruto, T. A., Sabatini, B. L. & Svoboda, K. ScanImage: flexible software foroperating laser-scanning microscopes. Biomed. Eng. Online 2, 13 (2003).
Supplementary Information is linked to the online version of the paper atwww.nature.com/nature.
Acknowledgements We thank B. Burbach, D. Flickinger, H. Kessels, D. O’Connor,T. Sato, R. Weimer and A. Zador for help with experiments, and D. O’Connor forcomments on the manuscript. This work was supported by the Swiss NationalScience Foundation (to D.H.), the National Institutes of Health and the HowardHughes Medical Institute.
Author Contributions D.H. and K.S. designed the experiments. D.H. performed thebehavioral and in vivo physiological experiments. L.P., D.H. and K.S. performed thebrain slice measurements. N.G. performed histology. S.R., T.H., Z.M. and K.S.provided advice and equipment. D.H. and K.S. wrote the paper. All authorsdiscussed the results and commented on the manuscript.
Author Information Reprints and permissions information is available atwww.nature.com/reprints. Correspondence and requests for materials should beaddressed to K.S. ([email protected]).
LETTERS NATURE | Vol 451 | 3 January 2008
64Nature ©2007 Publishing Group

METHODS
All experimental protocols were conducted according to the National Institutes
of Health guidelines for animal research and were approved by the Institutional
Animal Care and Use Committee at Cold Spring Harbor Laboratory and HHMI
Janelia Farm Research Campus.
In utero electroporation. Venus or GFP was fused to the carboxy (C) terminus
of the first 315 amino acids of channelrhodopsin-2 (gift from G. Nagel). The
construct (‘ChR2–GFP’) was inserted into pCAGGS vector modified for in utero
electroporation19. DNA was purified and concentrated using Qiagen plasmid
preparation kits and dissolved in 10 mM Tris–HCl (pH 8.0). Layer 2/3 progen-
itor cells were transfected by in utero electroporation. E16 timed-pregnant
C57BL/6J mice (Charles River, Wilmington, Massachusetts) were deeply anaes-
thetized by using an isoflurane–oxygen mixture (2% isoflurane/O2 by volume).
The abdomen was opened and the uterine horns were exposed. Approximately
1 ml of DNA solution coloured with Fast Green (Sigma, St. Louis, Missouri) was
pressure injected (Picospritzer, General Valve, Fairfield, New Jersey) through a
pulled glass capillary pipette (Warner Instruments, Hamden, Connecticut) into
the right lateral ventricle of each embryo. The DNA solution contained a mixture
of plasmids encoding ChR2–GFP and either mCherry or DsRedexpress (‘RFP’)
in a 4:1 molar ratio, at a final concentration of 2 mg/ml. The DNA was electro-
porated into the right lateral ventricular wall of the embryo’s brain by applying
five pulses of 45 V (duration 50 ms, frequency 1 Hz) through a pair of custom-
made tweezer-electrodes, with the positive plate contacting the right side of the
head. Approximately 50% of the surviving pups were strongly positive for trans-
gene expression.
Photostimulation. A chronic imaging window was implanted on the electro-
porated mice at postnatal age 40–50 days. The mice were anaesthetized by using
an isoflurane-oxygen mixture (2% isoflurane/O2 by volume) delivered by an
anaesthesia regulator (SurgiVet, Waukesha, Wisconsin) and mounted on a
stereotaxic frame (Stoelting, Wood Dale, Illinois). The animals were screened
through the exposed skull for expression of RFP by using a fluorescent dissecting
scope (MVX10, Olympus, Tokyo, Japan). Expression centred on the barrel cor-
tex was found in about 30% of the positive mice. A thin cover of cyanoacrylate
adhesive (Vetbond, 3M, St Paul, Minnesota) was applied to allow subsequent
adhesion of the dental acrylic. A 2 mm diameter skull flap overlying right barrel
cortex (centred on 1.5 mm caudal, 3.5 mm lateral of bregma) was removed by
using a fine motorized drill. Special care was taken to leave the dura intact. The
opening was covered with a thin layer of warm 1% agarose (Sigma, St Louis,
Missouri), and a 5 mm diameter round cover glass (Warner Instruments,
Hamden, Connecticut) was sealed on top of the agarose with black dental acrylic
(Lang Dental, Wheeling, Illinois). A titanium bar was embedded rostral to the
window above the midline to allow fixation to the microscope. After the initial
surgery, the animals were left to recover for five days. Animals of the same age
that were not electroporated were used as controls. A miniature blue high-power
LED (470 nm peak wavelength, NFSB036BT, Nichia, Tokyo, Japan) was
mounted on the imaging window. The assembly was then covered with black
dental acrylic to prevent leakage of light. The timing and intensity of the LED was
computer-controlled with a custom-built, low-noise current-source circuit. All
LEDs were tested before implantation and after termination of the experiments.
The distribution of light intensity at the surface of the brain was measured
using a beam profiler (Supplementary Methods; Supplementary Fig. 5a, b). The
distribution of light intensity in the brain, which was used to estimate the num-
ber of activated neurons (equation (1)), was estimated in a block of freshly cut
brain. The dorsal surface, with mounted skull and LED, was on the side. The cut
surface was imaged from the top by using a CCD (charge-coupled device)
(Supplementary Fig. 5). Because the light that reaches the camera is smeared
by scattering on its way out of the tissue, the width of the distribution
(Supplementary Fig. 5c) on the cut surface is likely an overestimate of the actual
width of the distribution in the brain.
In vivo two-photon imaging and cell-attached recordings. For targeted cell-
attached recordings, similar surgery was performed as described above except
that the skull opening was only 1.5 mm and a custom-shaped semilunar cover-
glass was sealed in place using dental acrylic, leaving the lateral edge of the
exposed dura accessible to the recording electrode. To monitor the level of
anaesthesia, an electrocorticogram was recorded by inserting a thin Teflon-
coated silver wire between the dura and skull in the contralateral hemisphere.
A reference wire was inserted above the cerebellum. In vivo imaging was per-
formed by using a custom-made two-photon laser-scanning microscope con-
trolled by ScanImage software19,30. The light source was a pulsed Ti:sapphire laser
(wavelength, 920–1010 nm; power, 50–200 mW in the objective back-focal
plane; MaiTai, Spectra-Physics, Mountain View, California). Red and green
fluorescence photons were separated by using a 565 nm dichroic mirror
(Chroma Technology, Brattleboro, Vermont) and barrier filters (green, BG22;
red, 607/45; Chroma). Signals were collected using photomultiplier tubes (3896,
Hamamatsu, Hamamatsu City, Japan). We used an objective lens (340, 0.8 NA)
from Olympus (Tokyo, Japan). RFP-positive neurons were targeted for loose seal
cell-attached recordings by using the two-photon fluorescence image16. The
recording pipette contained (in mM): 10 KCl, 140 K-gluconate, 10 HEPES, 2
MgCl2, 2 CaCl2, 0.05 sulphorhodamine 101, pH 7.25, 290 milli-osM. The signals
were recorded using a patch clamp amplifier (Axoclamp 200B, Axon
Instruments, Foster City, California). For the photostimulation, the objective
was removed and a miniature blue high power LED (470 nm) was placed on the
centre of the recording window. To determine the spike threshold, single light
pulses of 1 ms or 10 ms duration were initially presented at maximal intensity. In
addition, a series of longer pulses (20–100 ms) were tested for each recording
without revealing any additional responsive neurons. All neurons in the analysis
displayed evoked or spontaneous activity. If a neuron fired with a 1 ms pulse, the
threshold was probed by presenting varying light intensity. The light pulses
were presented every 15 s with increasing amplitude. Six to ten intensity values
were repeated five times for each condition. Data collection and LED stimulation
were controlled by custom-written physiology software in MATLAB
(Mathworks, Natick, Massachusetts). All data of neurons responding to light
durations above 1 ms were pooled for the analysis.
Training procedures. Mice with implanted LEDs had free access to food but had
restricted access to drinking water to maintain 80–85% of their pre-training
weight. Water was only available during and immediately after the behavioural
sessions, with a minimum of 1.5 ml per day. Body weight was monitored daily
before the training. The mice were kept at a reversed 12 h light/dark cycle and
sessions were performed during the dark cycle. The behavioural box consisted of
a white Plexiglas chamber (200 mm 3 140 mm 3 200 mm) with three ports
mounted on one wall. The ports were conical and equipped with an infrared
phototransistor–photodiode pair that signalled the interruption of the beam
when the mouse entered his snout. The floor was a washable plastic kitchen
cutting board. Both box and floor were cleaned with 70% ethanol after each
animal. The box was placed in a sound- and light-proof cabinet that was con-
stantly illuminated with bright white light. The box was covered with a trans-
parent Plexiglas plate in which an infrared camera (for monitoring) and a bright
masking light (high-power blue LED 470 nm, Luxeon V, Lumileds, San Jose,
California) were mounted along the midline. The white light illumination of the
behavioural box and the bright blue light flash were designed to mask any
scattered light potentially reaching the retina through the skull or brain. The
masking flash consisted of a series of bright 2 ms flashes (30 Hz, for 300 ms)
illuminating the entire box. This mask flash was presented during every stimu-
lation period (independently of whether a stimulus was presented).
Detection task. Training consisted of several phases. Transitions from one phase
to the next were triggered by performance at 65% correct or above.
1. Mice were habituated to the behavioural box and trained for one week to get
water from either left or right water port by breaking the light beam inside the
port. The availability of water in a port was signalled with a white noise click from
a loudspeaker (synchronized with the 5 ms valve opening). Water was delivered
with a gravitational system and the drop size was controlled with solenoid valves
(Neptune Research, West Caldwell, New Jersey). Single drop volume was
approximately 4 ml. All components of the behaviour box were controlled with
custom MATLAB software that was interfaced with a real-time processor system
(RP2 or RM1, Tucker-Davis Technologies, Gainesville, Florida).
2. The snout of the mouse had to enter the centre port (trial initiation) to make
water reward available in either the left or the right port for 10 s.
3. The LED was connected to the behavioural control system before the mouse
was placed in the box. The cable to the LED controller ran through a hole in the
Plexiglas cover and was mounted on a rotating hook 60 cm above the mouse.
Reward was only available in the left port after photostimulation, whereas water
was available on the right port in the absence of photostimulation (Fig. 2b).
Stimuli were presented in an interleaved series of 20 trials, with each type occur-
ring with a probability of 0.5 (pseudo-randomly, excluding runs of more than
four consecutive identical trials). Occasional response bias for one port over the
other was corrected by repeating the stimulus associated with the ignored port
until the correct response was achieved.
4. Animals were trained to respond to fewer stimuli and decreased light
intensity.
Histology. After completion of behavioural experiments, the mice were deeply
anaesthetized and transcardially perfused with 4% paraformaldehyde in 0.1 M
phosphate buffer, pH 7.4. The brain was carefully removed from each animal and
cut into coronal or tangential sections ranging from 40 to 60 mm on a cryostat
(CM 3050S, Leica Microsystems, Wetzlar, Germany). ChR2–GFP-positive neu-
rons were detected with an anti-GFP polyclonal antibody (Rb-anti-GFP,
AB3080P, dilution 1:700, Chemicon, Temecula, California), subsequently amp-
lified with a biotin-conjugated antibody (Gt-anti-Rb, 111-066-003, Jackson
doi:10.1038/nature06445
Nature ©2007 Publishing Group

ImmunoResearch Laboratories, West Grove, Pennsylvania) and revealed byusing a standard ABC-kit (Vector Laboratories, Burlingame, California) with
diaminobenzidine (DAB) precipitation. The sections were then mounted, dehy-
drated with increasing alcohol series, and coverslipped in DPX mounting med-
ium. The localization of the cell bodies and serial reconstruction of the brain
volume was performed in Neurolucida software (MBF Bioscience, Williston,
Vermont). Estimates of the number of neurons under the window area were
performed in MATLAB by calculating the number of neurons inside a sphere of
diameter 2 mm positioned above the window centre. To define the degree of co-
localization of ChR2–GFP and RFP, the ChR2–GFP was revealed with a fluor-
escent anti-GFP antibody (Rb-anti-GFP-488, A21311, Invitrogen, Carlsbad,
California) whereas the cytosolic red signal was detected directly. Thick sections
(40mm) were imaged under a confocal microscope (LSM 510, Carl Zeiss, Jena,
Germany). The individual red or green neurons were then classified and counted
by hand on the image stacks using Object-Image software (http://simon.bio.
uva.nl/object-image.html). Based on in vivo two-photon imaging or confocal
and bright field microscopy of fixed brain sections, we could not detect any
morphological changes due to the expression of ChR2 in layer 2/3 neurons.
doi:10.1038/nature06445
Nature ©2007 Publishing Group


![M1 Garand Barrel Replacement – New Barrel[1]](https://img.pdfslide.us/doc/110x75/577c79801a28abe05492e684/m1-garand-barrel-replacement-a-new-barrel1.jpg)