Embed Size (px)
Citation preview

www.at-spectrosc.com/as/article/pdf/2020202 18 At. Spectrosc. 2021, 42(1), 18-24
Spark Discharge-LIBS: Evaluation of One-Point and Multi-
Voltage Calibration for P and Al Determination
Alan Lima Vieira,a Edilene Cristina Ferreira,a Dário Santos Júnior,b Giorgio Saverio Senesi,c and
José Anchieta Gomes Netoa,*
a São Paulo State University - UNESP, Analytical Chemistry Department, P.O. Box 355, 14801-970, Araraquara - SP, Brazil
b Federal University of São Paulo - UNIFESP, Chemistry Department. 09913-030, Diadema - SP, Brazil
c CNR-Istituto per la Scienza e Tecnologia dei Plasmi (ISTP) sede di Bari, Via Amendola, 122/D - 70126 Bari, Italy
Received: October 31, 2020; Revised: November 12, 2020; Accepted: November 12, 2020; Available online: November 30, 2020.
DOI: 10.46770/AS.2020.202
ABSTRACT: Spark discharge (SD) laser-induced breakdown spectroscopy (LIBS) is a technique suitable to overcome the
low energies of lasers by reheating the plasma, increasing the emission intensities and to perform single-standard calibration. A
calibration method called one-point and multi-voltage calibration (OP-MVC), which requires two different voltages applied to both
the standard and the sample, is proposed for use with SD-LIBS. The performance of this method was compared to that of the one-
point and multi-lines calibration (OP-MLC) and the slope ratio calibration (SRC) methods for LIBS determination of Al in certified
reference plant leaves and P in commercial fertilizers. No statistical
differences at the 95% confidence level were observed between the
Al and P concentrations determined by OP-MVC LIBS for the Al
certified values and the P values measured by high-resolution
continuum-source flame atomic absorption spectrometry (HR-CS
FAAS). The limit of detection (LOD) for P was 0.60 wt% P2O5 and
35.1 mg kg-1 for Al. The relative standard deviation (n=3) was
typically 7% for Al and in the 4 - 10% range for P.
INTRODUCTION
The interest in laser-induced breakdown spectroscopy (LIBS) for
elemental analysis has increased greatly in recent years due to its
capability to analyze a wide range of samples.1 However, despite
its advantages, the low sensitivity and calibration of this technique
are still challenging.2-4
Among several approaches attempted to achieve LIBS signal
enhancement,2,3,5,6 spark discharge (SD) was found to be simple
and relatively low-cost.7 Since its first proposal in 1962,7 SD-LIBS
has been used to analyze a variety of samples8 in various sectors
of agriculture9, such as soil,10-17 phosphate rock,10,18 rice,19 honey,20
coal21,22 and onion leaves.23 For instance, when using the SD
method, the signal-to-background (S/B) ratio increased up to 7
times in the analysis of Pb and As in soil,11 up to 3 times for As,
Al, Ba, Ca, Co, Fe, Mg, Pb, Si, Sr, Ti and V in soil,13 and up to 12
times for P in fertilizer.18 Furthermore, the detection limit
decreased 10 times for Pb, Mg and Sn in soil15 and improved to
0.028 ppm for Cu in onion leaves.23
Besides sensitivity, calibration is also considered a main issue in
LIBS analysis due to the matrix effects.9,24 Several univariate and
multivariate calibration methods have been applied to overcome
these effects, including partial least squares (PLS),9,25 artificial
neural networks (ANN),9,25 principal component regression
(PCR),9,25 external calibration (EC),18,24 internal standardization
(IS),24 calibration-free (CF),26,27 one-point calibration (OPC),27,28
CF inverse,27,29 C-sigma,27,30 and single-sample calibration
(SSC).31 In particular, the SSC method does not require the
calculation of plasma temperature, electron number density or
other experimental parameters.26-30
The use of a single standard to produce several signal intensities
(multi-points), which avoids the preparation of a set of solid
standards with a similar matrix to test the samples at different

www.at-spectrosc.com/as/article/pdf/2020202 19 At. Spectrosc. 2021, 42(1), 18-24
analyte concentrations, is very attractive. The one-point and multi-
line calibration (OP-MLC) method proposed by Hao et al.32 used
several wavelengths of Mn, Cr, Ni and Ti to analyze alloy steel,
achieving the relative errors of 9, 22, 21 and 36%, respectively.
Nunes et al.33 used the slope ratio calibration (SRC) method33 to
determine B, Ca, Cu Mg, Fe, Mn, P and Zn in plant leaves with an
equation equivalent to single-point calibration. An increase of the
emission intensities as a function of the applied voltage was
observed in the SD-LIBS analysis of Al and Cu in air,34 As, Pb, Si
and Mn in soil,11,35 Si in silicon crystals,36 P in fertilizers18 and Pb
and Fe in copper alloys.37 Quantitative analysis by SD-LIBS
usually employs calibration with a fixed single voltage and
standards at various concentrations,9-23 whereas the use of a single
standard and various applied voltages has rarely been reported in
the literature.
This study aimed to evaluate the performance of one-point and
multi-voltage calibration (OP-MVC) for the SD-LIBS
determination of Al and P in plant leaves and fertilizers,
respectively, in comparison with high-resolution continuum
source atomic absorption spectrometry (HR-CS AAS), OP-MLC
and SRC. This method required the measurement of the intensities
(I) of the standard (Cstd) and the unknown sample (Csample) at two
voltages, so that Csample can be calculated (see Equation 3 below).
EXPERIMENTAL
Samples, standards, reagents and procedures
Six fertilizer samples containing different P concentrations (P2O5
wt%) were obtained at a local market in Araraquara city (São
Paulo State, Brazil). An amount of 1000 g of each sample was
quartered, and aliquots of 250 g were ground manually with a pistil
in an agate mortar to obtain a fine powder, which was then dried
at 105° C for 12 h. Calcium carbonate and NIST SRM 1568a Rice
Flour were employed as blanks for P and Al, respectively, and to
calculate the limit of detection (LOD) and the limit of
quantification (LOQ). The 1515 Apple Leaves, 1570a Spinach
Leaves, 1573a Tomato Leaves and 120c Phosphate Rock standard
reference materials (SRM) from the National Institute of
Standards and Technology (NIST, Gaithersburg, MD, USA) were
employed for the evaluation of calibration and accuracy. Disc
pellets of 250 mg powdered fertilizer samples, SRM plant leaves
and blanks were prepared daily using the SL-10/15 hydraulic press
(Solab, Piracicaba, Brazil), operating at a pressure of 7.5 ton cm-2
for 3 min.
For comparative purposes, P was determined by HR-CS AAS
after acid digestion of the sample. In particular, 200 mg of each
fertilizer sample and phosphate rock SRM was accurately
weighed, transferred to a microwave flask, and 3 mL of HCl and
HNO3 solution at a ratio 1:3 (reverse aqua regia), 2 mL of
deionized water and 1 mL of hydrogen peroxide were added. High
purity de-ionized water (resistivity 18.2 MΩ cm) was used to
prepare all solutions, obtained with a Millipore Rios 5® reverse
osmosis and a Milli-Q Academic® deionizer system (Millipore
Corporation, Bedford, MA, USA). Hydrochloric acid, nitric acid,
and 30 wt% hydrogen peroxide were purchased from Merck
(Darmstadt, Germany).
Digestion was performed in a Multiwave microwave oven
(Anton Paar, Graz, Austria). The optimized program involving
power/ramp time/hold time consisted in the following steps: step
1, 1000 W/15 min/0 min; step 2, 1000 W/0 min/10 min; step 3, 0
W/0 min/20 min (ventilation). After cooling, the digests were
transferred into polypropylene flasks and diluted with deionized
water to a final volume of 30 mL.
Instrumentation
The LIBS system used for Al and P determinations consisted of a
Q-switched ND:YAG laser (Big Sky Ultra 50, Quantel USA,
Bozeman, MT, USA), operating at 1064 nm, 9 ns of pulse
duration, 10 Hz repetition rate, energy power of 48.7 ± 0.4 mJ,
measured by laser power and energy meter (FieldMaxII-P,
Coherent, Inc., Santa Clara, CA, USA). The laser beam was
focused onto the sample surface by a plano-convex lens (12-cm
focal length), thus producing a spot diameter of about 300 µm,
resulting in a laser fluence of ca. 69 J cm-2 and an irradiance of
0.59 GW cm-2 delivered to the sample. The emission spectra were
collected by an optical fiber bundle at an angle of 45° with respect
to the laser beam and transferred to four spectrometers of the
HR2000+ (Ocean Optics, Dunedin, FL, USA), operating at a
spectral range from 200 at 620 nm, with optical resolution of 0.5
nm full width at half maximum (FWHM). The analysis was
performed using 1-ms integration time and 1-µs Q-switched delay.
The LIBS system included an automatic x-y direction sample
holder and a video camera inside the sampling chamber in order
to help the analyst to control the sample position. The laser was
rasterized over a sample surface of about 3 mm2 and broadband
spectra from 10 single-pulse ablations were collected and mapped
on discrete XY spatial coordinates. All measurements were
performed at atmospheric air pressure.
The SD-LIBS system employed two cylindrical, pure tungsten
electrodes of 100-mm length and 2.6-mm diameter, with tips
arranged at a distance of 4 mm between them and 2 mm above the
sample surface. The electrodes were connected to a single-spark
generator operating in the voltage range from 2.0 to 4.5 kV. More
information about the SD system can be found elsewhere.18 The
peak heights of the atomic lines of Al I at 308.22 nm and P I at
214.91 nm were obtained using Excel spreadsheet
“Chromatograms and Spectra Handling”38 and Microsoft Excel
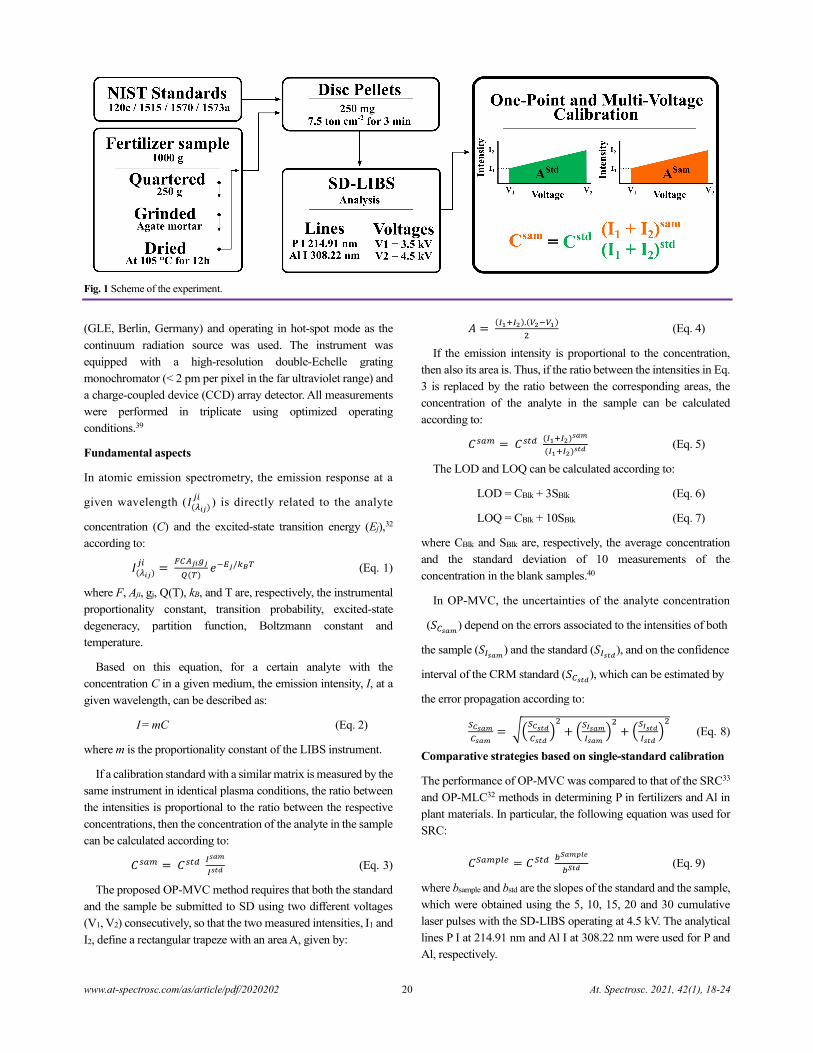
for data processing and calculating the concentrations. A scheme
of the experimental setup is shown in Fig. 1.
The concentrations of the sample digests, prepared as described
above, were determined by HR-CS AAS using an Analytik Jena
ContrAA 300, equipped with a xenon short-arc lamp XBO 301
www.at-spectrosc.com/as/article/pdf/2020202 20 At. Spectrosc. 2021, 42(1), 18-24
Fig. 1 Scheme of the experiment.
(GLE, Berlin, Germany) and operating in hot-spot mode as the
continuum radiation source was used. The instrument was
equipped with a high-resolution double-Echelle grating
monochromator (< 2 pm per pixel in the far ultraviolet range) and
a charge-coupled device (CCD) array detector. All measurements
were performed in triplicate using optimized operating
conditions.39
Fundamental aspects
In atomic emission spectrometry, the emission response at a
given wavelength (𝐼(𝜆𝑖𝑗)𝑗𝑖
) is directly related to the analyte
concentration (C) and the excited-state transition energy (Ej),32
according to:
𝐼(𝜆𝑖𝑗)𝑗𝑖
= 𝐹𝐶𝐴𝑗𝑖𝑔𝑗
𝑄(𝑇)𝑒−𝐸𝑗/𝑘𝐵𝑇 (Eq. 1)
where F, Aji, gj, Q(T), kB, and T are, respectively, the instrumental
proportionality constant, transition probability, excited-state
degeneracy, partition function, Boltzmann constant and
temperature.
Based on this equation, for a certain analyte with the
concentration C in a given medium, the emission intensity, I, at a
given wavelength, can be described as:
I = mC (Eq. 2)
where m is the proportionality constant of the LIBS instrument.
If a calibration standard with a similar matrix is measured by the
same instrument in identical plasma conditions, the ratio between
the intensities is proportional to the ratio between the respective
concentrations, then the concentration of the analyte in the sample
can be calculated according to:
𝐶𝑠𝑎𝑚 = 𝐶𝑠𝑡𝑑 𝐼𝑠𝑎𝑚
𝐼𝑠𝑡𝑑 (Eq. 3)
The proposed OP-MVC method requires that both the standard
and the sample be submitted to SD using two different voltages
(V1, V2) consecutively, so that the two measured intensities, I1 and
I2, define a rectangular trapeze with an area A, given by:
𝐴 = (𝐼1+𝐼2).(𝑉2−𝑉1)
2 (Eq. 4)
If the emission intensity is proportional to the concentration,
then also its area is. Thus, if the ratio between the intensities in Eq.
3 is replaced by the ratio between the corresponding areas, the
concentration of the analyte in the sample can be calculated
according to:
𝐶𝑠𝑎𝑚 = 𝐶𝑠𝑡𝑑 (𝐼1+𝐼2)𝑠𝑎𝑚
(𝐼1+𝐼2)𝑠𝑡𝑑 (Eq. 5)
The LOD and LOQ can be calculated according to:
LOD = CBlk + 3SBlk (Eq. 6)
LOQ = CBlk + 10SBlk (Eq. 7)
where CBlk and SBlk are, respectively, the average concentration
and the standard deviation of 10 measurements of the
concentration in the blank samples.40
In OP-MVC, the uncertainties of the analyte concentration
(𝑆𝐶𝑠𝑎𝑚) depend on the errors associated to the intensities of both
the sample (𝑆𝐼𝑠𝑎𝑚) and the standard (𝑆𝐼𝑠𝑡𝑑
), and on the confidence
interval of the CRM standard (𝑆𝐶𝑠𝑡𝑑), which can be estimated by
the error propagation according to:
𝑆𝐶𝑠𝑎𝑚
𝐶𝑠𝑎𝑚= √(
𝑆𝐶𝑠𝑡𝑑
𝐶𝑠𝑡𝑑)
2
+ (𝑆𝐼𝑠𝑎𝑚
𝐼𝑠𝑎𝑚)
2+ (
𝑆𝐼𝑠𝑡𝑑
𝐼𝑠𝑡𝑑)
2
(Eq. 8)
Comparative strategies based on single-standard calibration
The performance of OP-MVC was compared to that of the SRC33
and OP-MLC32 methods in determining P in fertilizers and Al in
plant materials. In particular, the following equation was used for
SRC:
𝐶𝑆𝑎𝑚𝑝𝑙𝑒 = 𝐶𝑆𝑡𝑑 𝑏𝑆𝑎𝑚𝑝𝑙𝑒
𝑏𝑆𝑡𝑑 (Eq. 9)
where bsample and bstd are the slopes of the standard and the sample,
which were obtained using the 5, 10, 15, 20 and 30 cumulative
laser pulses with the SD-LIBS operating at 4.5 kV. The analytical
lines P I at 214.91 nm and Al I at 308.22 nm were used for P and
Al, respectively.

www.at-spectrosc.com/as/article/pdf/2020202 21 At. Spectrosc. 2021, 42(1), 18-24
The following equation was used for OP-MLC:
𝐶𝑆𝑎𝑚𝑝𝑙𝑒 = 𝐶𝑆𝑡𝑑 𝛼𝑆𝑎𝑚𝑝𝑙𝑒 .𝑆𝑡𝑑 (Eq. 10)
where αSample.Std is the slope obtained by plotting the intensities of
the sample (y-axis) versus those of the standard (x-axis) measured
for different emission lines of the analyte. In particular, the
emission lines of P I at 213.62 nm, 214.91 nm and 215.41 nm, and
the line of Al I at 308.22 nm, which was selected after considering
its lower interference, were employed. However, as OP-MLC
requires multiple lines, different wavelengths located at the wing
of the Al I core line at 308.22 nm, i.e., 308.01, 308.07, 308.12,
308.17, 308.22 nm, were also used. The SD-LIBS employed 4.5
kV because the Al signals were very low when only LIBS is used.
RESULTS AND DISCUSSION
The P lines profile in the spectra of NIST SRM 120c Phosphate
Rock (33.34 ± 0.06 wt% P2O5) and the Al lines profile in the
spectra of NIST SRM 1515 Apple Leaves (284.5 ± 5.8 mg kg-1 Al)
acquired by LIBS and SD-LIBS are showed in Fig. 2. Based on
Fig. 2 LIBS (dashed line) and SD-LIBS (continuous line) spectra for (a) P
in NIST SRM 120c Phosphate Rock and (b) Al in NIST SRM 1515 Apple
Leaves. The voltage applied in SD-LIBS was 4.5 kV.
earlier information,18 the P I line at 214.91 nm was selected for P
determination in fertilizers, and the Al I line at 308.22 nm was
chosen for Al determination in plants. Despite the higher intensity
observed for the line of Al I at 309.27 nm, this line was not used
due to possible spectral interferences caused by the Mg I lines at
309.10, 309.29 and 309.68 nm.41 These lines might become
critical for samples rich in Mg, such as NIST SRMs 1573a and
1515 which contain 12,000 mg kg-1 (not certified) and 2710 ± 120
mg kg-1 of Mg, respectively.
The effect of the applied voltage at the values of 2.0, 2.5, 3.0,
3.5, 4.0 and 4.5 kV on the emission intensities of the P I line at
214.91 nm and the Al I line at 308.22 nm was evaluated for the
NIST SRM 120c and NIST SRM 1515 samples, respectively (Fig.
3). In both cases, the plots of the line intensity against the applied
voltage were linear with correlation coefficients (r) of 0.989 and
0.999 for Al and P, respectively. The NIST SRM 1570a and 1573a
in the case of Al (Fig. 3a) and all fertilizer samples in the case of P
(Fig. 3b) were analyzed only at higher voltages, i.e., 3.5, 4.0 and
4.5 kV, at which the highest line intensity of the analyte, i.e., a
greater sensitivity, was achieved. In all cases, for both Al and P, the
intensity versus voltage curves were linear with r > 0.97.
The extended temporal evolution of the plasma, and the increase
of plasma temperature and electronic density achieved by
reheating the plasma, improved the atomization and excitation
processes.10 In particular, the highest increase in the signal
intensity for both elements, i.e., 6.7-fold for P (NIST SRM 120c)
and 4.4-fold for Al (NIST SRM 1515), was achieved at the
maximum applied voltage, i.e., 4.5 kV, which yielded a
satisfactory relative standard deviation (RSD) for both Al and P.
Thus, further experiments aiming to optimize data collection were
carried out at the voltage of 4.5 kV.
Notwithstanding the high content of P in fertilizers and the re-
excitation with 4.5-kV high voltage discharge, no self-reversal
effect was observed for the peak profiles of P in the concentration
range from 4.8 to 33.34 wt% P2O5 (Fig. 4a). Furthermore, the plots
of the intensity of the emission lines of P I at 213.62, 214.91 and
Fig. 3 Plots of line intensity vs. voltage (n = 3) for (a) line Al I at 308.22 nm in three NIST SRM plant leaves and (b) line of P I at 214.91 nm in NIST SRM
120c and fertilizer samples. The error bars represent the standard deviation of the measurements.

www.at-spectrosc.com/as/article/pdf/2020202 22 At. Spectrosc. 2021, 42(1), 18-24
Fig. 4 SD-LIBS spectra of solid standards containing 0 (black), 4.8 (red),
11.9 (light blue), 22.9 (magenta), 27.8 (green) and 33.34 wt% P2O5 (dark
blue) at an applied voltage of 4.5 kV (a), and (b) linear working range of P
I lines at 213.62, 214.91 and 215.41 nm.
Fig. 5 Effect of the number of replicate spectra on the emission line
intensities of Al I at 308.22 nm in NIST 1515 Apple Leaves SRM () and
P I at 214.91 nm in NIST 120c Phosphate Rock SRM () recorded at an
applied voltage of 4.5 kV. Circles correspond to the average values and
error bars to standard deviations.
215.41 nm versus P concentration yielded straight lines (Fig. 4b)
with correlation coefficients 0.997. As these results were
obtained using the maximum voltage discharge, the OP-MVC
method yielded emission intensities in the linear range. Generally,
SD-LIBS studies do not investigate the influence of re-excitation
by high-voltage discharge on self-absorption. The plasma
temperature homogeneity increase achieved by SD-LIBS without
changing the ablation rate would explain the reduction of P self-
absorption in the plasma periphery. A similar effect was observed
by Tang et al.42 who used microwave to increase LIBS sensitivity.
The effect of the number of replicate spectra recorded at the
emission intensities of P I at 214.91 nm and Al I at 308.22 nm was
evaluated by acquiring 3, 5, 10, 15, 20, 25 and 30 spectra for the
NIST SRM 120c Phosphate Rock and NIST SRM 1515 Apple
Leaves at the voltage of 4.5 kV. The results obtained (Fig. 5)
showed that the average intensity for both the Al and P lines
remained constant for replicated spectra 5 and that a satisfactory
precision (RSD: 6% for P and 17% for Al) was achieved for
replicate spectra 10. Thus, the total of 10 replicate spectra was
chosen for data acquisition as a compromise between precision,
sensibility and sample throughput.
After optimization, the proposed calibration method was
applied to determine P in fertilizers and Al in plant leaves using
one or two voltages. In particular, the NIST SRM 120c Phosphate
Rock was used as the unique standard to determine the P content
in the five commercial fertilizer samples, which were also
analyzed by HR-CS FAAS. The data in Table 1 show good
agreement with the paired t-test at the 95% confidence level
between the data achieved by OP-MVC LIBS and those obtained
by HR-CS FAAS. The RSD values for P were in the 4.3 – 9.6%
range.
For Al determinations, the NIST SRM 1515 Apple Leaves was
used as the unique standard to analyze NIST SRM 1570a Spinach
Leaves and NIST SRM 1573a Tomato Leaves, whereas the NIST
SRM 1570a Spinach Leaves was used as the unique standard to
analyze NIST SRM 1515 Apple Leaves. The results obtained by
OP-MVC LIBS were in good agreement with the certified values
with a paired t-test at the 95% confidence level (Table 1). The
recoveries were in the range of 94 – 107% and the RSD values in
the 6.0 – 6.9% interval.
The use of two voltages, V1: 3.5 kV and V2: 4.5 kV applied
sequentially, achieved good performance in precision and
accuracy, which may be attributed to the linear relationship
existing between the line intensity and the applied voltage (Fig. 3).
Furthermore, the use of three voltages appeared not to alter the
results significantly, but it limited the analytical throughput due to
the increased time needed to charge the capacitors. Calibration
using only one applied voltage at 4.5 kV, which provided the best
signal-to-noise ratio, was also tested. For the P and Al data, the
relative standard deviations were in the range of 4.3 – 9.5% and 6
– 11%, respectively (Table 1). However, the precision achieved for
both P and Al was improved when calibration was performed
using two voltages (3.5 and 4.5 kV), which provided also better
discrimination between the nominal and the actual applied voltage.
For comparative purposes, the performance of the SRC and OP-
MLC methods was also tested for P and Al determination by LIBS
(Table 1). The results obtained for Al by OP-MVC were in
agreement with those achieved by SRC and OP-MLC at the 95%
confidence level, but the RSD values for OP-MVC (in the range
of 6.0 – 7.0%) were better than those for SRC and OP-MLC (in
the range of 8.3 – 15.8% and 23.0 – 26.7%, respectively). However,
the results obtained for P were in agreement with those achieved
by SRC, but not by OP-MLC, at the 95% confidence level. The
RSD values of P obtained by OP-MVC, SRC and OP-MLC
ranged from 4.3 – 9.5%, 4.0 – 14.1% and 0.6 – 15.8%, respectively.
Using OP-MVC, SRC and OP-MLC, the LOQs for P (expressed

www.at-spectrosc.com/as/article/pdf/2020202 23 At. Spectrosc. 2021, 42(1), 18-24
Table 1. Comparative Results (Mean ± Standard Deviation, n=3) for the Determination of P (wt% P2O5) in Fertilizers and Al (mg kg-1) in Plant
Leaves Obtained by OP-MVC (with One and Two Voltages) and SRC and OP-MLC Methods
Sample/SRM Comparative
values
OP-MVC
SRC OP-MLC Standard used
for calibration V1 = 4.5 kV V1 = 3.5 kV
V2 = 4.5 kV
P
Sample 1 19.0 ± 0.3 a 17.3 ± 1.4 17.7 ± 0.9 20.5 ± 2.9 15.0 ± 0.1c SRM-120c
Sample 2 6.5 ± 0.2 a 7.0 ± 0.8 6.9 ± 0.3 6.4 ± 0.4 7.9 ± 0.3 c SRM-120c
Sample 3 17.2 ± 0.4 a 16.5 ± 1.6 17.1 ± 1.1 16.2 ± 1.7 14.0 ± 1.3 c SRM-120c
Sample 4 9.2 ± 0.1 a 9.1 ± 0.7 9.4 ± 0.9 9.5 ± 1.1 11.4 ± 1.8 c SRM-120c
Sample 5 19.0 ± 0.1 a 18.8 ± 1.2 18.5 ± 0.8 19.7 ± 0.8 16.8 ± 1.3 c SRM-120c
Al
NIST 1570a 310 ± 15 b 322 ± 14 316 ± 2 290 ± 46 343 ± 90 NIST 1515
NIST 1515 284.5 ± 5.8 b 288 ± 27 280 ± 18 295 ± 25 265 ± 61 NIST 1570a
NIST 1573a 598.4 ± 7.1 b 586 ± 56 591 ± 41 579 ± 48 685 ± 183 NIST 1515 a Comparative value determined by HR-CS FAAS; b Certified values; c Not in agreement with comparative values at the 95% confidence level.
as wt% P2O5) were, respectively, 2.0%, 2.3% and 2.7%, and for
Al (mg kg-1) 117, 126 and 269.
Different LIBS configurations may affect the quality of the data
obtained for P using OP-MLC, as the emission line of P I at 213.62
nm may be interfered by those of Cu and Zn, which are commonly
present in fertilizers, thus deteriorating the calibration curve
obtained for OP-MLC. In particular, the correlation coefficients
obtained by plotting the P signal for the sample in the y-axis and
that of the NIST SRM 120c Phosphate Rock in the x-axis varied
from 0.946 to 0.998, with the lower values possibly due to these
spectral interferences. The significantly higher RSD values
obtained by OP-MLC for Al in plant materials with respect to
those for P in fertilizers (Table 1) might be due to the much lower
content of Al (mg kg-1) compared to P (wt%). Furthermore, the
wavelengths employed for Al were located at the wing of the Al I
line at 308.22 nm, i.e., the lines at 308.01, 308.07, 308.12, 308.17,
and 308.22 nm. Although this procedure is not commonly used for
MLC, it was a strategy adopted to overcome the limited number
of non-interfered Al I lines. In conclusion, the differences among
the results obtained with these various methods might be due to
the different instrumental strategies used to increase the signal
intensities, such as cumulative laser pulses (SRC), several lines
(OP-MLC) and voltages (OP-MVC).
CONCLUSIONS
In this work, SD-LIBS was successfully used in combination with
the SSC calibration method of OP-MVC to determine Al and P in
plant leaves and fertilizers, respectively, achieving suitable
accuracy, precision and LOQs. The required SD extra device used
should not be seen as a serious shortcoming as it is a simple, low
cost, and rugged tool capable of enhancing the signal intensities
for any LIBS system, thus improving the performance especially
of those featuring limited sensitivity.
For comparative purposes, the performance of the OP-MVC
method was also evaluated with respect to the SRC and OP-MLC
methods. Although SRC and OP-MLC are simple and
performance calibration methods, they need high sensitivity LIBS
systems depending on the specific analyte and sample. Further,
SRC can be performed with one emission line, while OP-MLC is
limited to elements that feature several lines. In general, all of these
calibration methods employ a single solid calibration standard, so
that difficulties related to the preparation of several solid standards
(e.g., external calibration) with physicochemical properties similar
to the samples are minimized.
Finally, the proposed OP-MVC method cannot be considered as
limited to LIBS analysis of Al and P in plants and fertilizers, but
its performance appears promising to be tentatively extended to
other analytes and samples in various matrices.
AUTHOR INFORMATION
Corresponding Author
*J. A. Gomes Neto
Email address: [email protected]
Notes
The authors declare no competing financial interest.
ACKNOWLEDGMENTS
The authors thank the São Paulo Research Foundation (FAPESP,
Grant # 2019/07537-6) for financially supporting this work and
the Conselho Nacional de Desenvolvimento Científico e
Tecnológico (CNPq) for the fellowship to A.L.V. (grant#
141977/2016-7), and researchship to J.A.G.N. (grant #
302414/2017-7) and E.C.F. (grant # 308200/2018-7).

www.at-spectrosc.com/as/article/pdf/2020202 24 At. Spectrosc. 2021, 42(1), 18-24
REFERENCES
1. S. Musazzi, and U. Perini, Laser-Induced Breakdown Spectroscopy,
Theory and Applications. Springer-Verlag, Berlin, Germany, 2014.
2. X. Fu, G. Li and D. Dong, Front. Phys., 2020, 68, 10.3389.
https://doi.org/10.3389/fphy.2020.00068
3. Y. Li, D. Tian, Y. Ding, G. Yang, K. Liu, C. Wang and X. Han,
Appl. Spectrosc. Rev., 2018, 53, 1-35.
https://doi.org/10.1080/05704928.2017.1352509
4. M. Martinez and M. Baudelet, Anal. Bioanal. Chem., 2020, 412,
27-36. https://doi.org/10.1007/s00216-019-02195-1
5. D. W. Hahn and N. Omenetto, Appl. Spectrosc., 2012, 66, 347-419.
https://doi.org/10.1366/11-06574
6. Y. Liu, M. Baudelet and M. Richardson, J. Anal. At. Spectrom.,
2010, 25, 1316-1323. https://doi.org/10.1039/C003304A
7. F. Brech and L. Cross, Appl. Spectrosc., 1962, 16, 59-64.
8. W. D. Zhou, Y. H. Guo and R. R. Zhang, Front. Phys., 2020, 15,
52201. https://doi.org/10.1007/s11467-020-0969-1
9. J. Peng, F. Liu, F. Zhou, K. Song, C. Zhang, L. Ye and Y. He,
Trends Anal. Chem., 2016, 85, 260-272.
https://doi.org/10.1016/j.trac.2016.08.015
10. A. A. Bol’shakov, X. Mao and R. E. Russo, J. Anal. At. Spectrom.,
2017, 32, 657-670. https://doi.org/10.1039/C6JA00436A
11. L. I. Kexue, W. Zhou, Q. Shen, J. Shao and H. Qian,
Spectrochim. Acta. B., 2010, 65, 420-424.
https://doi.org/10.1016/j.sab.2010.04.006
12. M. V. Belkov, V. S. Burakov; A. De Giacomo, V. V. Kiris, S. N.
Raikov, and N. V. Tarasenko, Spectrochim. Acta. B., 2009, 64,
899-904. https://doi.org/10.1016/j.sab.2009.07.019
13. K. Li, W. Zhou, Q. Shen, Z. Ren, and B. Peng,
J. Anal. At. Spectrom., 2010, 25, 1475-1481.
https://doi.org/10.1039/B922187E
14. V. S. Burakov, S. N. Raikov, N. V. Tarasenko, M. V. Belkov and
V. V. Kiris, J. Appl. Spectrosc., 2010, 77, 595-608.
https://doi.org/10.1007/s10812-010-9374-9
15. X. F. Li, W. Zhou, K. Li, H. Qian, R. Huiguo and R. Zhijun,
Opt. Comm., 2012, 285, 54-58.
https://doi.org/10.1016/j.optcom.2011.08.074
16. W. Zhou, K. Li, X. Li, H. Qian, J. Shao, X. Fang, P. Xie and W. Liu,
Opt. Lett., 2011, 36, 2961-2963.
https://doi.org/10.1364/OL.36.002961
17. X. F. Li, W. D. Zhou and Z. F. Cui, Front. Phys., 2012, 7, 721-727.
https://doi.org/10.1007/s11467-012-0254-z
18. A. L. Vieira, T. V. Silva, F. S. I. de Sousa, G. S. Senesi, D. S. Júnior,
E. C. Ferreira and J. A. Gomes Neto, Microchem. J., 2018, 139,
322-326. https://doi.org/10.1016/j.microc.2018.03.011
19. M. P. Rodríguez, P. M. Dirchwolf, T. V. Silva, R. N. Villafañe,
J. A. Gomes Neto, R. G. Pellerano and E. C. Ferreira, Food Chem.,
2020, 331, 127051. https://doi.org/10.1016/j.foodchem.2020.127051
20. M. G. Nespeca, A. L. Vieira, D. Santos Júnior, J. A. Gomes Neto
and E. C. Ferreira, Food Chem., 2020, 311, 125886.
https://doi.org/10.1016/j.foodchem.2019.125886
21. Z. Hou, Z. Wang, J. Liu, W. Ni and Z. Li, Opt. Express, 2014, 22,
12909-12914. https://doi.org/10.1364/OE.22.012909
22. S. Sheta, M. S. Afgan, Z. Hou, S. C. Yao, L. Zhang, Z. Li and
Z. Wang, J. Anal. At. Spectrom., 2019, 34, 1047-1082.
https://doi.org/10.1039/C9JA00016J
23. A. Jabbar, M. Akhtar, S. Mehmmod, M. Iqbal, R. Ahmed and
M. A. Baig, Spectrochim. Acta B., 2019, 162, 105719.
https://doi.org/10.1016/j.sab.2019.105719
24. D. V. Babos, A. I. Barros, J. A. Nóbrega, and E. R. Pereira-Filho,
Spectrochim. Act. B., 2019, 155, 90-98.
https://doi.org/10.1016/j.sab.2019.03.010
25. M. Martinez and M. Baudelet, Anal. Bioanal. Chem., 2020, 412,
27-36. https://doi.org/10.1007/s00216-019-02195-1
26. A. Ciucci, M. Corsi, V. Palleschi, S. Rastelli, A. Salvetti and
E. Tognoni, Appl. Spectrosc., 1999, 53, 960-964.
https://doi.org/10.1366/0003702991947612
27. E. Grifoni, S. Legnaioli, G. Lorenzetti, S. Pagnotta, F. Poggialini,
and V. Palleschi, Spectrochim. Acta B., 2016, 124, 40-46.
https://doi.org/10.1016/j.sab.2016.08.022
28. G. Cavalcanti, D. Teixeira, S. Legnaioli, G. Lorenzetti, L. Pardini
and V. Palleschi, Spectrochim. Act. B., 2013, 87, 51-56.
https://doi.org/10.1016/j.sab.2013.05.016
29. R. Gaudiuso, M. Dell'Aglio, O. De Pascale, A. Santagata and
A. De Giacomo, Spectrochim. Acta B., 2012, 74-75, 38-45.
https://doi.org/10.1016/j.sab.2012.06.034
30. C. Aragón and J. A. Aguilera, J. Quant. Spectrosc. Radiat. Transf.,
2014, 149, 90-102. https://doi.org/10.1016/j.jqsrt.2014.07.026
31. R. Yuan, Y. Tang, Z. Zhu, Z. Hao, J. Li, H. Yu, Y. Yu, L. Guo,
X. Zeng and Y. Lu, Anal. Chim. Acta., 2019, 1064, 11-16.
https://doi.org/10.1016/j.aca.2019.02.056
32. Z. Q. Hao, L. Liu, R. Zhou, Y. W. Ma, X. Y. Li, L. B. Guo, Y. F. Lu
and X. Y. Zeng, Opt. Express, 2018, 26, 22926-22933.
https://doi.org/10.1364/OE.26.022926
33. L. C. Nunes, F. R. P. Rocha and F. J. Krug, J. Anal. At. Spectrom.,
2019, 34, 2314-2324. https://doi.org/10.1039/C9JA00270G
34. O. A. Nassef and H. E. Elsayed-Ali, Spectrochim Acta. B., 2005, 60,
1564-1572. https://doi.org/10.1016/j.sab.2005.10.010
35. K. Li, W. Zhou, Q. Shen, Z. Ren, B. Peng, L. I. Kexue, W. Zhou,
Q. Shen, Z. Ren and B. Peng, J. Anal. At. Spectrom., 2010, 25,
1475-1481. https://doi.org/10.1039/b922187e
36. W. Zhou, X. Su, H. Qian, K. Li, X. Li, Y. Yu and Z. Ren,
J. Anal. At. Spectrom., 2013, 28, 702-710.
https://doi.org/10.1039/c3ja30355a
37. Y. Jiang, R. Li and Y. Chen, J. Anal. At. Spectrom., 2019, 34,
1838-1845. https://doi.org/10.1039/C9JA00169G
38. A. L. Vieira, M. G. Nespeca, W. D. Pavini, E. C. Ferreira and
J. A. Gomes Neto, Chemom. Intell. Lab. Syst., 2019, 194, 103816.
https://doi.org/10.1016/j.chemolab.2019.103816
39. M. A. Bechlin, F. M. Fortunato, R. M. Da Silva, E. C. Ferreira, and
J. A. Gomes Neto, Spectrochim. Acta Part B., 2014, 101, 240-244.
https://doi.org/10.1016/j.sab.2014.09.012
40. J. Miller, and J. C. Miller, Statistics and Chemometrics for
Analytical Chemistry. Pearson, Harlow, U.K., 2010.
41. NIST Atomic Spectra Database
(https://physics.nist.gov/PhysRefData/ASD/).
42. Y. Tang, J. Li, Z. Hao, S. Tang, Z. Zhu, L. Guo, X. Li, X. Zeng,
J. Duan, and Y. Lu, Opt. Express., 2018, 26, 12121.
https://doi.org/10.1364/OE.26.012121