Embed Size (px)
Citation preview

1Spar Nord · Risk Report · 2017
2017
SPAR NORD
RISK REPORT

2 Spar Nord · Risk Report · 2017
The Risk Report has been prepared in accordance with the le-gal disclosure requirements in articles 431 to 455 of the Capi-tal Requirements Regulation (CRR), and the Executive Order on Calculation of Risk Exposures, Own Funds and Solvency Need. References regarding the disclosure obligations appear from Appendix A.
The rules regarding the capital adequacy of credit institutions are laid down in European Parliament and Council Directive 2013/36/ EU (CRD) and Regulation no. 575/2013 (CRR), including the associated delegated regulations and guidelines. The rules originate from the Basel III rules and determine the rules for the disclosure of capital adequacy requirements and risk manage-ment.
Spar Nord’s disclosure of information pursuant to the regulatory framework relate to Spar Nord Bank A/S, CVR no. 13737584, and the subsidiary Aktieselskabet Skelagervej 15, which is fully con-solidated in the Group. Unless otherwise explicitly stated in the report, figures express consolidated figures.
Figures in the risk report are presented in millions of Danish kro-ner, unless otherwise stated. Consequently, rounding differences may occur because grand totals are rounded and the underly-ing decimal places are not shown.

3Spar Nord · Risk Report · 2017
ContentsIntroduction
Business model
Risk management
Capital management and solvency need
Liquidity risk
Credit risk
Market risk
Operational risk
Risk statement
Appendix
4
5
6
10
17
21
36
42
45
46
4 Spar Nord · Risk Report · 2017
1. Introduction
Introduction
The global and the European economy both showed positive trends in 2017, and several leading indicators in the industry and service sectors are now at their highest since 2011. In Ger-many, the Ifo business climate index is at an all-time high, and most other economies have experienced an upward trend that has continued into 2018. Overall, signs of a synchronous global economic recovery became ever more clear.
The Danish economy also experienced positive trends in 2017 and is currently experiencing a broadly founded recovery that will most likely continue for the next couple of years with annual growth of around 2.0%.
The economic growth is expected to lead to a continuing im-provement in employment. This is expected to push up wage growth in Denmark, which in turn will continue to spur consumer spending. In addition, new technology and low financing costs are expected to drive a continued increase in investment levels.Combined, these factors will have a positive knock-on effect on both short-term and long-term economic growth in Denmark.
2017 was also a year of historically low interest rates. The rate of interest on certificates of deposit has remained negative since October 2014, and since January 2016 it has been at mi-nus 0.65%. The current situation with banks having high excess liquidity that must therefore be placed at a negative interest rate weighs on the Banks’ net interest income. This situation is expected to persist in 2018, while a gradual improvement is ex-pected to materialise in 2019.
POSITIVE CREDIT QUALITY DEVELOPMENTSThe positive economic trends in Denmark with low interest rates and low unemployment rates have produced a positive finan-cial climate for the Bank’s customers and have been supportive of a strengthened credit quality for the Bank’s retail and busi-ness customers.
The credit quality of the Bank’s agricultural customers also im-proved in 2017, leading to a substantial decline in the Bank’s ag-ricultural impairment charges. Over the course of the past year, the Bank’s agricultural exposures have been reduced by DKK 0.3 billion. During the past ten years, the Bank’s agricultural expo-sures have been reduced by approximately DKK 2.5 billion, and agriculture now accounts for 6% of the Bank’s loans, advances and guarantees, against 12% ten years ago.
SPAR NORD ASSIGNED SIFI STATUSAt the end of 2017, the Danish Ministry of Industry, Business and Financial Affairs announced that the model for identifying sys-temically important financial institutions (SIFIs) had been evalu-ated and is expected to be adjusted. In this connection, it was found expedient to adjust the threshold value for deposits from 5.0% of the sector’s total deposits to 3.0% of the sector’s total deposits. The adjustment was made to identify institutions in Denmark that are considered systemically important. The ad-
justment of the threshold value for deposits will require a legis-lative amendment, which is expected to take effect in 2018, and as a result Spar Nord will become a SIFI.
Being assigned SIFI status will result in stricter capital require-ments and generally stricter requirements on the Bank’s risk management process. Overall, we believe that the benefits of being assigned SIFI status outweigh the drawbacks for Spar Nord, not least in terms of capital procurement.
Prior to the announcement that Spar Nord would be assigned SIFI status, Spar Nord had already been ordered to comply with the upcoming minimum requirements for eligible liabilities (MREL requirements) that apply to SIFIs. In the coming years, Spar Nord must therefore prepare to comply with an MREL requirement of twice the total capital requirement.
Based on the upcoming MREL requirements and stricter capi-tal requirements, Spar Nord has resolved to apply for permis-sion for the Bank to switch to the use of internal ratings-based models (IRB) for the calculation of credit risk. Spar Nord currently employs the standard method to calculate its risk exposure. By using internal ratings-based models, Spar Nord will be able to achieve lower risk weights for its assets, thus attaining a more optimum capital application.
DANISH FSA CONDUCTING REVIEW OF SPAR NORDIn spring 2017, the Danish FSA carried out an ordinary inspec-tion of Spar Nord, comprising all of the Bank’s principal risk ar-eas. Spar Nord was pleased to find that the Danish FSA had no comments on the Bank’s impairment, requested no changes to the individual solvency need calculated by the Bank and ap-proved of the Bank’s credit quality.
During its review of Spar Nord’s credit exposure, the FSA found that the Bank has a better credit quality than the average of group 2 institutions and ranks closer to the credit quality of the group 1 institutions. In addition, the Bank has a strong credit organisation and a thorough control environment, supported by low authorisation limits and centralised credit management procedures.
NEW CAPITAL TARGETSIn mid-2017, the Bank revised its capital targets and dividend policy. The Bank aims to have a common equity tier 1 (CET1) ra-tio of 13.0%, an own funds ratio of 16.5% and a 40-50% dividend payout ratio.
The Bank has a strong capital position with a common equity tier 1 (CET1) ratio at 31 December 2017 of 14.4% and an own funds ratio of 18.2%, corresponding to an excess capital coverage of DKK 3.9 billion or 7.9 percentage points relative to the calculated capital requirement.
5Spar Nord · Risk Report · 2017
2. Business model
Business model
Founded in Aalborg, Denmark, in 1824, Spar Nord has historically been rooted in northern Jutland, and continues to be a market leader in this region.
In the period from 2002 to 2010 Spar Nord established and ac-quired 27 local banks (branches) outside northern Jutland, and in 2012 the Bank merged with Sparbank, which had 23 branches. Concurrently with these developments, Spar Nord adjusted the branch network and now has a nationwide distribution network comprising 50 branches.
Spar Nord offers all types of financial services, consultancy and products, focusing its business on retail customers and SMEs in the local areas in which the Bank is represented.
The Spar Nord Group consists of two earnings entities: Spar Nord’s Local Banks and Trading, Financial Markets & the Inter-national Division. The Group also has a number of staff and sup-port divisions at its Aalborg headquarters.
2.1 VISION AND STRATEGY Developments in the banking market and the challenges they entail would seem to call for fundamental changes to the ways in which you run a bank.
Spar Nord’s starting point is that the Bank’s greatest strength, also in an increasingly digital world, remains its ability to be a personal and attentive bank. No matter what tomorrow brings, people will always desire a bank that is close to its customers in every sense of the term, and which knows and understands their needs and wants.
Therefore, Spar Nord’s vision – the landmark which all staff members should steer for – is to become Denmark’s most per-sonal bank.
As part of its efforts to bring the vision within reach, Spar Nord launched a new strategy a little over a year ago. The new strat-egy builds on the current trends in the banking market, with dig-italisation a dominant factor. Banks seem to be handling the digitalisation trend in very different ways. Some are striving to become fully digitised, while others are sticking to traditional bank models.
Spar Nord believes that in future many customers will still wish to speak personally with an adviser about their financial affairs. At the same time, however, having strong digital offerings in the future will be paramount. Accordingly, the ambition behind Spar Nord’s strategy is to become The Personal Bank in a Digital World.
2.2 CUSTOMERSSpar Nord’s primary target groups are retail customers and small and medium-sized businesses in the local areas where the Bank has a presence. In special cases, we offer asset financing abroad (primarily in Germany). Leasing products are offered to business customers in addition to traditional bank financing op-tions.
As an entity, Trading, Financial Markets & the International Di-vision serves customers from Spar Nord’s local banks as well as large retail customers and institutional clients in the field of eq-uities, bonds, fixed income & forex products, asset management and international transactions.
Finally, under the umbrella concept SparXpress the Bank offers consumer financing through retail stores, gift voucher solutions via shopping centres and shopping centre associations and di-rect loans via the website, sparxpres.dk.
In its retail segment, Spar Nord gives priority to full-service cus-tomers in the sense that it wants to be a banker for financially sound customers and their entire families, thus catering to all their banking needs. The Bank focuses its day-to-day opera-tions on retaining existing full-service customers, turning existing non-regular customers into full-service customers and attract-ing new customers with good potential.
In the business customer segment, Spar Nord focuses on sound businesses across industry sectors. In other words, it is to a large degree the structure of a local business community and the lo-cal focus that determine the distribution of industry sectors in the individual banking areas.
Spar Nord’s credit exposure at Group level is characterised by a higher-than-average exposure to retail customers and good sector diversification in its business customer portfolio.
Spar Nord generally aims to be the customer’s primary banker and that customers conduct their basic banking business with the Bank. However, after a concrete assessment Spar Bank may accept that the customer also banks with another one or two institutions, provided the Bank knows the extent of credit facili-ties granted by these institutions.
2.3 DISTRIBUTION The 50 local banks throughout Denmark constitute the back-bone of Spar Nord’s distribution network. Spar Nord gives very high priority to personalised advisory services in its physical branches, supplementing them with self-service solutions such as well-functioning online banking and mobile platforms.
This makes Spar Nord well positioned to face the stricter future capital requirements, which in addition to requirements trig-gered by the assigned SIFI status also include a fully phased-in capital conservation buffer and a countercyclical buffer. The Systemic Risk Council has proposed a countercyclical buffer of 0.5%, if adopted by the Danish government, will be implement-
ed in Q1 2019. In connection with the formal assignment of SIFI status, Spar Nord expects to raise its capital adequacy targets. Thus, the target for the common equity tier 1 capital ratio is ex-pected to be raised from 13.0% to 13.5%, and the own funds ratio target to be raised from 16.5% to 17.5%.

6 Spar Nord · Risk Report · 2017 Risk management
3. Risk management
EXECUTIVE BOARD
Spar Nord’sLocal Banks
Trading, Financial Markets & the Inter-
national Division
Credit Rating
CreditDepartment
Audit Committee
Nomination and Remuneration Committee
Solvency Committee
Credit Committee
Risk ManagementFunction
Finance &Accounts
LegalDepartment
Credit Quality Department
Analysis and Process
Department
Market RiskCommittee
Compliance Function
Market risk
Capital &Liquidity Risk
OperationalRisk
CreditControlling
AML Function
Debt CollectionDepartment
Internal Audit Department
Risk Committee
RISK MANAGEMENT ORGANISATION
BOARD OF DIRECTORS
IT SecurityCommittee
Figure 3.1
Using Spar Nord’s strategic objectives as its point of departure, the Board of Directors determines the Bank’s risk profile, which describes the risk within the Bank’s most important risk types that the Board of Directors is willing to undertake while meeting the objectives set forth in the strategy.
The objective is to ensure cohesion between Spar Nord’s vision and strategy while ensuring that Spar Nord’s risk profile is ap-propriate at all times, having regard to the Bank’s capital and liquidity situation.
3.1 RISK ORGANISATIONRisk assumption is a natural and everyday part of Spar Nord’s business activities, placing heavy demands on the Bank’s risk management organisation and risk management environment.
In accordance with Danish legislation, Spar Nord has estab-lished a two-tier management structure consisting of a Board of Directors and an Executive Board.
The structure of Spar Nord’s risk management organisation is shown in figure 3.1.
3.2 BOARD OF DIRECTORS It is the duty of the Board of Directors to handle the overall and strategic management with a view to running a healthy and competitive bank, thus securing long-term value for the Bank’s stakeholders.
The Board of Directors has defined a number of risk policies that set out the overall handling and management of the Bank’s risks. These policies are reviewed and approved by the Board of Directors at least once a year.

7Spar Nord · Risk Report · 2017Risk management
In order to underpin the management structure, the Board of Directors has drafted written guidelines for the Executive Board, specifying the areas of responsibility and scope of action. As required and at least once a year, the Board of Directors must assess and update these guidelines.
3.3 Executive Board In accordance with the guidelines and risk policies defined by the Board of Directors, the Executive Board handles the day-to-day management of Spar Nord.
The Executive Board must ensure that the Bank’s risk policies and guidelines are implemented in the Bank’s day-to-day op-erations while also ensuring that business procedures or work descriptions have been prepared for all important areas.
The Executive Board delegates specific guidelines and author-isations to selected departments of the Bank with a view to the practical implementation of the guidelines and policies adopt-ed by the Board of Directors.
3.4 BOARD COMMITTEES The Board of Directors has set up an Audit Committee, a Risk Committee and a Nomination and Remuneration Committee charged with arranging the preparatory work for the Board of Directors' consideration of matters relating to these topics.
Establishing these board committees help ensure a better utili-sation of the special competences held by the board members, thus ensuring in-depth dealing with the board material. The sole purpose of the committees is to facilitate the transaction of business by the Board of Directors and they have no independ-ent decision-making powers.
The Audit Committee is responsible for monitoring and con-trolling accounting and auditing matters and drafting material for the Board of Directors' consideration of matters relating to accounting and auditing. The Audit Committee is composed of three board members, one of whom is an independent member with special expertise in auditing and accounting matters. In 2017, the Committee held seven meetings.
The principal purpose of the Nomination and Remuneration Committee is to facilitate the decisions to be taken by the Board of Directors with respect to remuneration, including the remuneration policy, and other related decisions that may influ-ence the Bank’s risk management. The Committee also serves to facilitate work related to the process of board evaluation, nominating new board candidates, etc. The Nomination and Remuneration Committee consists of three board members, one of which is a member elected by the employees. In 2017, the Committee held three meetings.
The principal purpose of the Risk Committee is to handle risk-re-lated matters, including the Bank’s risk policies, products and services and to assess incentives in the Bank’s remuneration structure. The Risk Committee also serves to advise the Board of Directors on the Bank’s overall risk profile and strategy and to ensure the correct implementation of the risk strategy in the Bank. The Risk Committee consists of three board members. In 2017, the Committee held four meetings.
3.5 RISK COMMITTEESThe Executive Board has set up a number of committees which in specific areas contribute to Spar Nord’s risk management, preparing issues and themes for consideration by the Executive Board and Board of Directors.
The Credit Committee, which is composed of representatives of the Executive Board, Credit Rating and Corporate Banking, deals with credit facilities that exceed Credit Rating’s author-isation limits or involve a matter of principle. The Committee meets several times a week. Frequently, matters that have been dealt with by the Credit Committee will be prepared for subse-quent discussion among all members of the Board of Directors.
The Market Risk Committee is composed of representatives of the Executive Board, Finance & Accounts and Trading, Finan-cial Markets & the International Division. The Committee meets every quarter to review developments in Spar Nord’s positions and risks as well as the liquidity situation and expectations re-garding market developments and future plans.
The Solvency Committee is composed of members of the Exec-utive Board, Credit Rating and Finance & Accounts. The Com-mittee meets every quarter and serves to formulate targets and principles for calculating adequate own funds and the individ-ual solvency need. The Solvency Committee prepares a recom-mendation for the individual solvency need and passes it on to the Board of Directors for approval.
The IT Security Committee is composed of a member of the Ex-ecutive Board, the head of the IT department, the IT security officer and selected heads of business areas. The Committee serves to advise on and deal with any issues that may arise in relation to the IT security policy, IT security rules, IT security pro-cedures and the IT contingency plan. The IT Security Committee holds quarterly meetings.

8 Spar Nord · Risk Report · 2017 Risk management
3.6 INTERNAL AUDIT DEPARTMENTThe Internal Audit Department is responsible for planning and performing an audit to obtain reasonable assurance as to whether the consolidated financial statements and the parent company financial statements are free from material misstate-ment. The Internal Audit Department also serves as a secretari-at to the Bank’s Risk Committee.
It reports directly to the Board of Directors and regularly reports on an ongoing basis to the Executive Board and the Board of Directors. The Internal Audit Department bases its activities on the annual plan adopted by the Board of Directors. These ac-tivities include test examinations of business procedures and internal control systems in key areas subject to risk, including in connection with preparing the financial statements.
Dismissal of the Bank’s head of internal audit is subject to the prior approval of the Board of Directors.
3.7 RISK MANAGEMENT FUNCTION The Risk Management Function is responsible for providing an overview of the Bank and its risk exposure to be able to assess whether such risk exposure is adequately addressed. The Risk Management Function’s area of responsibility comprises the Bank’s risk-prone activities across various risk areas and organ-isational units and risks deriving from outsourced functions. The Risk Management Function also serves as a secretariat to the Bank’s Risk Committee and will assist the Risk Committee pro-viding information about the Bank’s risk exposure.
The Chief Risk Officer reports directly to the Bank’s Executive Board. The Risk Management Function reports to the Board of Directors twice a year. The activities of the Risk Management Function are rooted in the annual plan adopted by the Board of Directors.
Dismissal of the Chief Risk Officer is subject to the prior approval of the Board of Directors.
3.8 COMPLIANCE FUNCTION The Compliance Function is charged with assessing and con-trolling Spar Nord’s compliance with applicable legislation, banking sector standards and Spar Nord’s internal guidelines, advising on how to reduce compliance risk.
The Compliance Officer reports directly to the Bank’s Executive Board. The Compliance Function reports to the Executive Board on a quarterly basis and to the Board of Directors twice a year. The activities of the Compliance Function are rooted in the an-nual plan adopted by the Board of Directors.
Dismissal of the Compliance Officer is subject to the prior ap-proval of the Board of Directors.
3.9 REPORTING The Bank deploys substantial resources to ensure appropriate risk reporting on an ongoing basis, including follow-up on legis-lative and managerial risk frameworks.
Reporting to Spar Nord’s Management and relevant stakehold-ers is performed according to fixed guidelines. The Board of Directors receives continual reports covering all important risk areas, which appears from figure 3.2.

9Spar Nord · Risk Report · 2017Risk management
OVERVIEW OF SIGNIFICANT RISK REPORTS
Report Frequency Contents
General risk reporting
Selected audit reportsOn an ongoing basis
The Internal Audit Department prepares various reports pertaining to the Bank’s risk areas.
Individual solvency need (ICAAP)
Quarterly
Assessment of the risk profile and calculation of adequate own funds. The report contains conclusions reached in Spar Nord’s stress test and an assessment of the capital needs in respect of the individual risks. Once a year, an extended version of the report is prepared.
Forecast QuarterlyThe forecast is updated regularly with a view to ensuring ongoing follow-up on the business results and projections for profits, balance sheet, liquidity and capital matters.
Follow-up on recovery indicators
Semi-annuallyFollow-up on the indicators set out in the recovery plan, viewed in relation to the threshold values fixed.
Reporting from the Risk Management Function
Semi-annuallyComplete overview of Spar Nord’s principal risks and monitoring of Spar Nord’s risk profile.
Reporting from the Compliance Function
Semi-annuallyReview of the most significant compliance controls and status on ongoing tasks. Once a year, an extended version of the report is prepared.
Budget AnnuallyThe budget is prepared with a view to identifying the business risks for the coming year.
Credit and balance sheet report
AnnuallyReview and analysis of Spar Nord’s assets, including a specific review of individual exposures and an analysis and assessment of future trends for important lines of business and asset areas.
Credit risk
Credit facility exten-sions in excess of DKK 10 million
MonthlyReporting on all credit facility extensions in excess of DKK 10 million that have not been considered by the Board of Directors.
Unauthorised over-drafts in excess of DKK 1 million
MonthlyReporting on all individual unauthorised overdrafts in excess of DKK 1 million.
Statistics on unauthor-ised overdrafts
Monthly Reporting on unauthorised overdraft statistics in all banking areas.
Credit quality report QuarterlyAnalysis of trends in exposures, impairment and losses, including portfolio analyses broken down by rating groups, volume, geography, etc. Once a year, an extended version of the report is prepared.
Losses on loans, advances and guarantees
Quarterly Reporting on the heaviest losses during the past quarter.
Weak exposures Semi-annuallyReporting on all credit-weak exposures larger than DKK 50 million, reviewed individually.
Market risk Market risk report Monthly
Review and analysis of Spar Nord’s current interest, equity and foreign-exchange risks, including the historical trend in utilisation of the frameworks and instructions defined by the Board of Directors. An extended version of the report is prepared quarterly.
Operational risk
Reporting from the IT Department
Semi-annuallyReview of and follow-up on Spar Nord’s IT security and stability of Spar Nord’s IT systems, including follow-up on outsourced development projects.
Risk review of operational risk
AnnuallyReview of Spar Nord’s operational risks and measures to counter such risks.
Liquidity risk
Liquidity risk report Monthly
Review and analysis of Spar Nord’s short-term and long-term liquidity risks, including Spar Nord’s liquidity stress test and trends in the historical utilisation of the frameworks and instructions laid down by legislation and by the Board of Directors. An extended version of the report is prepared quarterly.
Calculation and assessment of liquidity position and liquidity risks – internal liquidity adequacy assessment process (ILAAP)
Annually
Combined calculation and assessment of Spar Nord’s liquidity position and liquidity risks. The assessment supports Spar Nord’s liquidity management and is a component of the statement of the individual solvency need.
Figure 3.2

10 Spar Nord · Risk Report · 2017 Capital management and solvency need
4. Capital management and solvency need
The Bank’s capital position developed favourably in 2017. There was an increase in capital ratios, and Spar Nord in-creased its excess capital coverage relative to the statu-tory requirement. The positive trends were attributable to enhanced consolidation driven by our after-tax profit of DKK 989 million. The Bank’s risk exposure amount increased by DKK 2.1 billion during the same period. A DKK 431 million provision has been made covering proposed dividends for 2017, equal to DKK 3.5 per share.
Going forward, Spar Nord will be affected by a number of factors, including the assignment of SIFI status, phasing in of MREL requirements, development of advanced credit models for calculating capital adequacy (IRB) and the im-plementation of IFRS 9.
The regulatory capital requirements express the amount of capital a bank must reserve to cover the risk it undertakes in the course of its operations in the fields of credit risk, market risk and operational risk.
Spar Nord must ensure that it has access to sufficient capital to support its future business activities and growth. At the same time, Spar Nord must be able to overcome cyclical downturns and absorb unexpected substantial credit losses and substantial negative changes in the value of market-risk-related positions.
Developments in 2017
Definition of capital requirements
TOTAL RISK EXPOSURE AMOUNT
DKK 49,5 bn2016: DKK 47,5 bn
COMMON EQUITY TIER 1 RATIO
14.4%2016: 14.0%
OWN FUNDS RATIO
18.2%2016: 17.7%
INDIVIDUALSOLVENCY NEED
9.0%2016: 9.5%
EXCESS COVERAGE, OWN FUNDS RATIO
7.9%2016: 7.6%
LEVERAGE RATIO
8.5%2016: 8.1%

11Spar Nord · Risk Report · 2017
4.1 CAPITAL POLICY The capital forms the foundation of Spar Nord’s risk profile in terms of capital and helps ensure that the risk profile matches Spar Nord’s overall risk profile. The capital policy aims to ensure that Spar Nord consistently complies with applicable legislation in respect of the following three areas:
• Calculation of risk exposure, own funds and capital requirement• Individual solvency need and supervision procedures• Market discipline through a number of disclosure obligations
The capital policy defines targets for the common equity tier 1 ra-tio and the own funds ratio, which should be viewed relative to the capital requirements that apply to Spar Nord. Spar Nord’s capital targets at end-2017 are:
• Common equity tier 1 capital ratio of 13.0%• Own funds ratio of 16.5%
In its endeavours to comply with the described targets, Spar Nord has adopted a number of guidelines intended to ensure that the management of Spar Nord’s capital matters is appropriate and ad-equate and in compliance with applicable legislation.
The capital policy also covers Spar Nord’s dividend policy, which expresses an intention to distribute 40-50% of the net profit for the year as ordinary dividends.
4.2 DEVELOPMENT IN CAPITAL RATIOSAt end-2017, Spar Nord had a common equity tier 1 (CET1) ratio of 14.4%, a tier 1 capital ratio of 16.0%, an own funds ratio of 18.2% and an individual solvency need ratio of 9.0%.
4.3 OWN FUNDSOwn funds are composed of common equity tier 1 capital, addition-al tier 1 capital and tier 2 capital.
Own funds are characterised by the fact that the claims of share-holders and capital holders are subordinated to those of other creditors.
The common equity tier 1 capital, tier 1 capital and own funds are calculated with a view to calculating the capital ratios to show Spar Nord’s capital resources to comply with Spar Nord’s targets as per the capital policy as well as the regulatory requirements.
4.3.1 ISSUED CAPITAL INSTRUMENTS Spar Nord has issued additional tier 1 capital with a total principal of DKK 850 million, distributed on two loans of DKK 400 million and DKK 450 million, respectively.
Spar Nord has issued tier 2 capital with a total principal of DKK 1,154 million, distributed on two issues of DKK 700 million and SEK 600 million (DKK 454 million), respectively.
In 2017, tier 2 capital with a principal of DKK 400 million was repaid. At the same time, new tier 2 capital of SEK 600 million was issued.
Spar Nord’s additional tier 1 capital (AT1) and tier 2 capital (T2) was issued on terms that meet the requirements for inclusion in own funds under CRR. Capital issues are therefore recognised in own funds with the principal adjusted for the permitted holding of treasury shares and any expenses not incurred.
See Appendix C for further information about Spar Nord’s issued capital instruments.
4.3.2 CALCULATED OWN FUNDSIn 2017, own funds grew by DKK 589 million. Own funds are mainly impacted by developments in the following three areas:
• Profit/loss for the year• Provision for expected dividends for 2017• Repayment and new issuance of tier 2 capital
Profit for the year added DKK 989 million after tax. In addition, a DKK 431 million provision has been made covering proposed dividends for 2017, equal to DKK 3.5 per share, which reduces own funds by a corresponding amount.
Tier 2 capital of DKK 400 million has been repaid, and new tier 2 capital with a principal of DKK 454 million was issued in Q4 2017. The net impact of DKK 54 million makes a positive contribution to developments in own funds.
Capital management and solven-
cy need
CAPITAL RATIOS AND EXCESS COVERAGE
20162017%
Figure 4.1
14.4 14.0
16.0 15.6
18.2 17.7
9.0 9.5
7.9 7.6
7.9 7.6
Common equity tier 1 capital ratio
Tier 1 capital ratio
Own funds ratio
Individual solvency need
%-point
Excess coverage, common equity tier 1 capital ratio
Excess coverage, own funds ratio
DKKm
CALCULATION OF OWN FUNDS
Share capital
Other reserves
Retained earnings
Revaluation reserves
- Buyback of treasury shares
- Proposed dividend excl. dividends for shares comprised by the share buyback programme
- Intangible assets
- Goodwill in associates
- Deduction for equity investments > 10%
- Deduction for the sum of equity investments < 10%
- Prudent valuation
- Adjustment, permitted holding of treasury shares
- Treasury shares acquired by customers on the basis of loan financing
Common equity tier 1 capital after primary deductions
Additional tier 1 (AT1) capital
- Deduction for equity investments > 10%
- Deduction for the sum of equity investments < 10%
Tier 1 capital (incl. additional tier 1 capital) after deductions
- Tier 2 capital (T2)
- Deduction for equity investments > 10%
- Deduction for the sum of equity investments < 10%
Own funds after deductions
2016
1,230 1,255
0 22
6,789 6,546
94 91
0 -150
-431 -615
-151 -159
-37 -37
0 0
-331 -240
-16 -21
-25 -26
-1 -1
7,123 6,665
843 843
0 0
-41 -80
7,924 7,428
1,133 1,080
0 0
-41 -80
9,016 8,427
2017
Figure 4.2
12 Spar Nord · Risk Report · 2017
TOTAL RISK EXPOSURE AMOUNT
Credit risk
- Sovereigns or central banks
- Regional or local authorities
- Public-sector entities
- Institutions
- Business customers etc.
- Retail customers
- Exposures secured by mortgages on real property
- Exposures in arrears or overdrawn
- High-risk exposures
- Exposures in units or CIU
- Equity exposures
- Other items
CVA risk
Total credit risk, incl. CVA
Market risk
- Debt instruments
- Shares etc.
- Foreign-exchange risk
- Commodity risk
Total market risk
Total operational risk
Total
DKKm
0 0 0 2
0 0 1 0
3 1 34 15
39 46 489 573
1,315 1,276 16,440 15,945
1,125 1,132 14,061 14,148
181 157 2,262 1,962
191 73 2,385 912
114 108 1,420 1,345
0 0 1 3
147 130 1,843 1,624
128 121 1,601 1,509
10 14 121 177
3,253 3,057 40,658 38,215
209 231 2,616 2,891
25 32 313 405
21 19 265 241
0 0 2 1
256 283 3,196 3,538
455 459 5,692 5,732
3,964 3,799 49,546 47,485
2016201720162017
Capital requirement*) Risk exposure
*) The capital requirement is calculated as 8% of the risk exposure amount Figure 4.3
0
10000
20000
30000
40000
50000
20152011 2012 2013 2014
2.757
1.727
1.0302.159
1.676
483
2.239
1.677
562
2.572
1.849
723
2.663
1.800
863
Indesign udgave
Riskexposure
2016
Creditrisk
Marketrisk
47,485 49,546
2,443 -342 -40
Operationalrisk
Riskexposure
2017
CHANGE IN TOTAL RISK EXPOSURE AMOUNT(DKKM )
Figure 4.4
Capital management and solvency need
With respect to figure 4.2, it should be noted that the phasing-in of CRR means that 80% of the financial equity investments is being deducted from common equity tier 1 capital, compared with 60% in 2016.
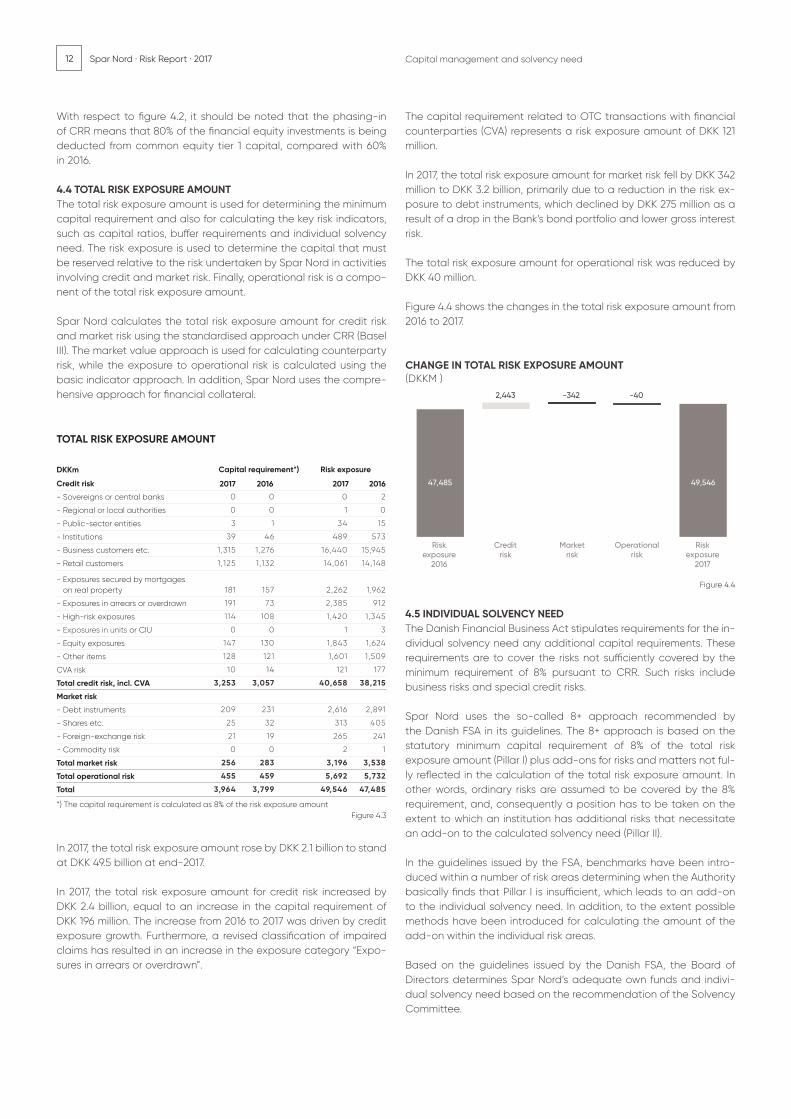
4.4 TOTAL RISK EXPOSURE AMOUNTThe total risk exposure amount is used for determining the minimum capital requirement and also for calculating the key risk indicators, such as capital ratios, buffer requirements and individual solvency need. The risk exposure is used to determine the capital that must be reserved relative to the risk undertaken by Spar Nord in activities involving credit and market risk. Finally, operational risk is a compo-nent of the total risk exposure amount.
Spar Nord calculates the total risk exposure amount for credit risk and market risk using the standardised approach under CRR (Basel III). The market value approach is used for calculating counterparty risk, while the exposure to operational risk is calculated using the basic indicator approach. In addition, Spar Nord uses the compre-hensive approach for financial collateral.
In 2017, the total risk exposure amount rose by DKK 2.1 billion to stand at DKK 49.5 billion at end-2017.
In 2017, the total risk exposure amount for credit risk increased by DKK 2.4 billion, equal to an increase in the capital requirement of DKK 196 million. The increase from 2016 to 2017 was driven by credit exposure growth. Furthermore, a revised classification of impaired claims has resulted in an increase in the exposure category “Expo-sures in arrears or overdrawn”.
The capital requirement related to OTC transactions with financial counterparties (CVA) represents a risk exposure amount of DKK 121 million.
In 2017, the total risk exposure amount for market risk fell by DKK 342 million to DKK 3.2 billion, primarily due to a reduction in the risk ex-posure to debt instruments, which declined by DKK 275 million as a result of a drop in the Bank’s bond portfolio and lower gross interest risk.
The total risk exposure amount for operational risk was reduced by DKK 40 million.
Figure 4.4 shows the changes in the total risk exposure amount from 2016 to 2017.
4.5 INDIVIDUAL SOLVENCY NEEDThe Danish Financial Business Act stipulates requirements for the in-dividual solvency need any additional capital requirements. These requirements are to cover the risks not sufficiently covered by the minimum requirement of 8% pursuant to CRR. Such risks include business risks and special credit risks.
Spar Nord uses the so-called 8+ approach recommended by the Danish FSA in its guidelines. The 8+ approach is based on the statutory minimum capital requirement of 8% of the total risk exposure amount (Pillar I) plus add-ons for risks and matters not ful-ly reflected in the calculation of the total risk exposure amount. In other words, ordinary risks are assumed to be covered by the 8% requirement, and, consequently a position has to be taken on the extent to which an institution has additional risks that necessitate an add-on to the calculated solvency need (Pillar II).
In the guidelines issued by the FSA, benchmarks have been intro-duced within a number of risk areas determining when the Authority basically finds that Pillar I is insufficient, which leads to an add-on to the individual solvency need. In addition, to the extent possible methods have been introduced for calculating the amount of the add-on within the individual risk areas.
Based on the guidelines issued by the Danish FSA, the Board of Directors determines Spar Nord’s adequate own funds and indivi- dual solvency need based on the recommendation of the Solvency Committee.
13Spar Nord · Risk Report · 2017Capital management and solvency need
3,594 7.3 3,612 7.3
421 0.8 421 0.8
455 0.9 448 0.9
9 0.0 9 0.0
0 0.0 0 0.0
4,479 9.0 4,490 9.0
CAPITAL REQUIREMENT BY RISK AREA2017
Credit risk
Market risk
Operational risk
Other risks
Supplement
if required
by law
Total
DKKm/%
ParentCompany
Capital requirement
ParentCompanyAdequateown funds
Group¨Capital
requirement
GroupAdequateown funds
3,558 7.5 3,661 7.5
384 0.8 384 0.8
459 1.0 453 0.9
117 0.2 117 0.3
0 0.0 0 0.0
4,518 9.5 4,615 9.5
CAPITAL REQUIREMENT BY RISK AREA 2016
Credit risk
Market risk
Operational risk
Other risks
Supplement
if required
by law
Total
DKKm/%
ParentCompany
Capital requirement
ParentCompanyAdequate
Own funds
GroupCapital
requirement
GroupAdequateown funds
Figure 4.5
PHASING IN OF BUFFER REQUIREMENT 2015-2019
4
2
0
2015 2016 2017 2018 2019
Figure 4.6
5
3
1
Capital conservation buffer Countercyclical buffer
(%)
Spar Nord’s calculation method follows the guidelines issued by the Danish FSA and is based on an assessment of risks within the follow-ing nine key areas:
1. Earnings 2. Growth in lending 3. Credit risk -Credit risk attaching to large customers in financial difficulty - Concentration risk: Individual customers - Concentration risk: Industries - Concentration, collateral - Concentration, geography - Concentration, retail/business - Other credit risks 4. Market risks - Interest rate risk - Equity risk - Foreign exchange risk - Credit spread risk 5. Liquidity risk 6. Operational risk 7. Leverage8. Regulatory maturity of capital instruments9. Other risks - The Bank’s business profile - Capital procurement - Strategic risks - Reputational risks - Properties - Other
The impact of the individual areas on the solvency need has been calculated directly using the methods designated by the Danish FSA in its guidelines, and by making supplementary calculations. Management has made an estimate in selected risk areas.
In Spar Nord’s opinion, the risk factors applied in the model cover all the risk areas that management is required by legislation to take into consideration in determining the solvency need and the risks that Management finds Spar Nord has assumed. At end-2017, the adequate own funds amounted to DKK 4.5 billion, which was on a level with end-2016.
Spar Nord’s total risk exposure amount rose from DKK 47.5 billion at end-2016 to DKK 49.5 billion at end-2017. At end 2017, the solvency need ratio amounted to 9.0%.
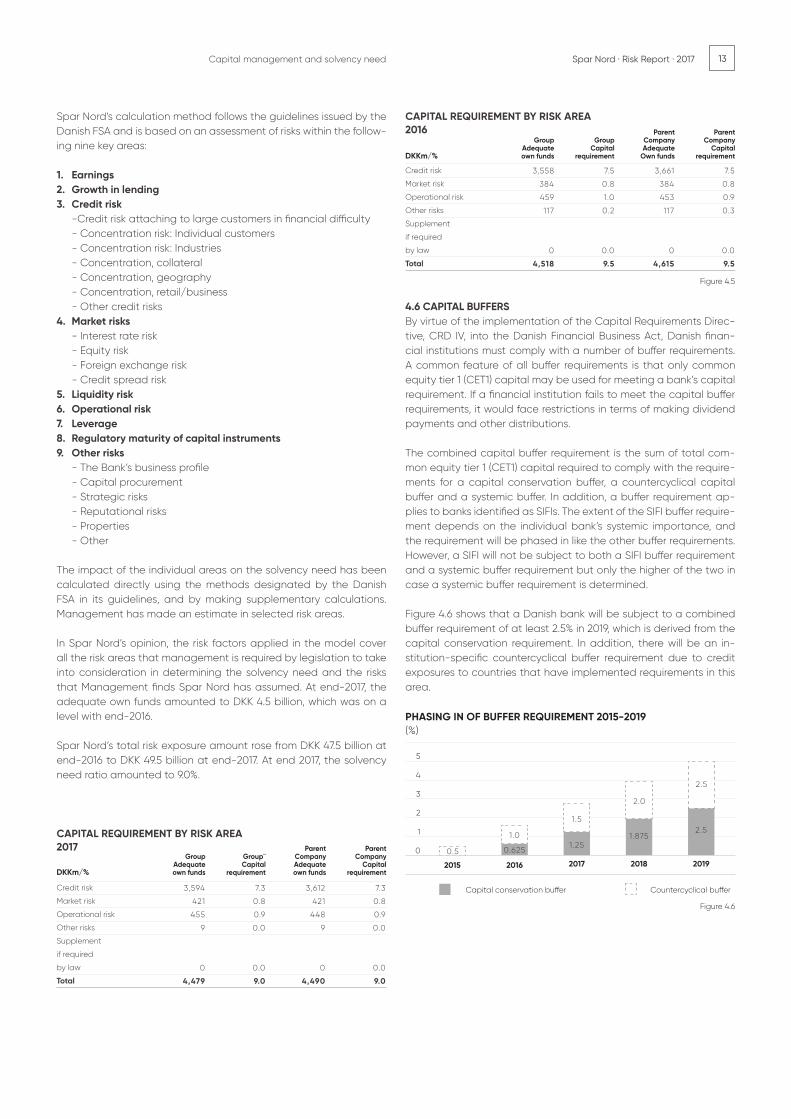
4.6 CAPITAL BUFFERSBy virtue of the implementation of the Capital Requirements Direc-tive, CRD IV, into the Danish Financial Business Act, Danish finan-cial institutions must comply with a number of buffer requirements. A common feature of all buffer requirements is that only common equity tier 1 (CET1) capital may be used for meeting a bank’s capital requirement. If a financial institution fails to meet the capital buffer requirements, it would face restrictions in terms of making dividend payments and other distributions.
The combined capital buffer requirement is the sum of total com-mon equity tier 1 (CET1) capital required to comply with the require-ments for a capital conservation buffer, a countercyclical capital buffer and a systemic buffer. In addition, a buffer requirement ap-plies to banks identified as SIFIs. The extent of the SIFI buffer require-ment depends on the individual bank’s systemic importance, and the requirement will be phased in like the other buffer requirements. However, a SIFI will not be subject to both a SIFI buffer requirement and a systemic buffer requirement but only the higher of the two in case a systemic buffer requirement is determined.
Figure 4.6 shows that a Danish bank will be subject to a combined buffer requirement of at least 2.5% in 2019, which is derived from the capital conservation requirement. In addition, there will be an in-stitution-specific countercyclical buffer requirement due to credit exposures to countries that have implemented requirements in this area.
0.5
1.0
1.5
2.0
2.5
2.51.875
1.250.625
14 Spar Nord · Risk Report · 2017
The Minister for Industry, Business and Financial Affairs may de-termine the countercyclical buffer requirement if financial matters are considered to result in higher socio-economic risks. Basically, the countercyclical buffer requirement may amount to somewhere between 0% and 2.5% of the total risk exposure amount when the rules have been fully phased in by 2019. In December 2017, the Sys-temic Risk Council recommended that the Danish government should introduce a countercyclical buffer requirement of 0.5% from March 2019. In Q1 2018, the Minister for Industry, Business and Finan-cial Affairs will decide whether or not Denmark will follow the rec-ommendation.
The Minister for Industry, Business and Financial Affairs may fix a sys-temic buffer requirement to counteract and limit long-term non-cy-clical systemic or macro-prudential risks that are not comprised by CRR. No systemic buffer has been implemented that will affect Spar Nord.
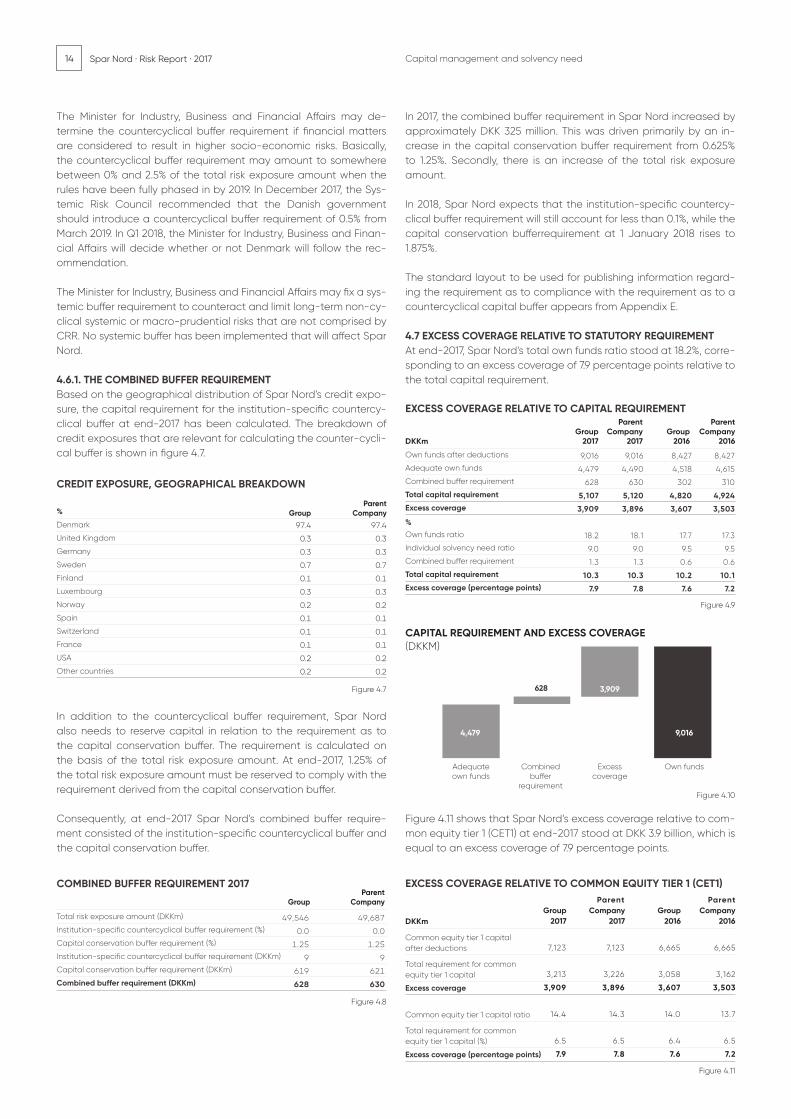
4.6.1. THE COMBINED BUFFER REQUIREMENTBased on the geographical distribution of Spar Nord’s credit expo-sure, the capital requirement for the institution-specific countercy-clical buffer at end-2017 has been calculated. The breakdown of credit exposures that are relevant for calculating the counter-cycli-cal buffer is shown in figure 4.7.
In addition to the countercyclical buffer requirement, Spar Nord also needs to reserve capital in relation to the requirement as to the capital conservation buffer. The requirement is calculated on the basis of the total risk exposure amount. At end-2017, 1.25% of the total risk exposure amount must be reserved to comply with the requirement derived from the capital conservation buffer.
Consequently, at end-2017 Spar Nord’s combined buffer require-ment consisted of the institution-specific countercyclical buffer and the capital conservation buffer.
In 2017, the combined buffer requirement in Spar Nord increased by approximately DKK 325 million. This was driven primarily by an in-crease in the capital conservation buffer requirement from 0.625% to 1.25%. Secondly, there is an increase of the total risk exposure amount.
In 2018, Spar Nord expects that the institution-specific countercy-clical buffer requirement will still account for less than 0.1%, while the capital conservation bufferrequirement at 1 January 2018 rises to 1.875%.
The standard layout to be used for publishing information regard-ing the requirement as to compliance with the requirement as to a countercyclical capital buffer appears from Appendix E.
4.7 EXCESS COVERAGE RELATIVE TO STATUTORY REQUIREMENTAt end-2017, Spar Nord’s total own funds ratio stood at 18.2%, corre-sponding to an excess coverage of 7.9 percentage points relative to the total capital requirement.
Figure 4.11 shows that Spar Nord’s excess coverage relative to com-mon equity tier 1 (CET1) at end-2017 stood at DKK 3.9 billion, which is equal to an excess coverage of 7.9 percentage points.
COMBINED BUFFER REQUIREMENT 2017
Total risk exposure amount (DKKm)
Institution-specific countercyclical buffer requirement (%)
Capital conservation buffer requirement (%)
Institution-specific countercyclical buffer requirement (DKKm)
Capital conservation buffer requirement (DKKm)
Combined buffer requirement (DKKm)
ParentCompany
49,546 49,687
0.0 0.0
1.25 1.25
9 9
619 621
628 630
Figure 4.8
Group
CAPITAL REQUIREMENT AND EXCESS COVERAGE(DKKM)
4,479
3,909
Adequate own funds
Combinedbuffer
requirement
Excess coverage
Own funds
Figure 4.10
9,016
628
Capital management and solvency need
CREDIT EXPOSURE, GEOGRAPHICAL BREAKDOWN
%
Denmark
United Kingdom
Germany
Sweden
Finland
Luxembourg
Norway
Spain
Switzerland
France
USA
Other countries
ParentCompany
97.4 97.4
0.3 0.3
0.3 0.3
0.7 0.7
0.1 0.1
0.3 0.3
0.2 0.2
0.1 0.1
0.1 0.1
0.1 0.1
0.2 0.2
0.2 0.2
Figure 4.7
Group
DKKm
EXCESS COVERAGE RELATIVE TO CAPITAL REQUIREMENT
Own funds after deductions
Adequate own funds
Combined buffer requirement
Total capital requirement
Excess coverage
Own funds ratio
Individual solvency need ratio
Combined buffer requirement
Total capital requirement
Excess coverage (percentage points)
ParentCompany
2016Group
2016
9,016 9,016 8,427 8,427
4,479 4,490 4,518 4,615
628 630 302 310
5,107 5,120 4,820 4,924
3,909 3,896 3,607 3,503
18.2 18.1 17.7 17.3
9.0 9.0 9.5 9.5
1.3 1.3 0.6 0.6
10.3 10.3 10.2 10.1
7.9 7.8 7.6 7.2
Figure 4.9
ParentCompany
2017Group
2017
%
Figure 4.11
EXCESS COVERAGE RELATIVE TO COMMON EQUITY TIER 1 (CET1)
Common equity tier 1 capital after deductions
Total requirement for common equity tier 1 capital
Excess coverage
Common equity tier 1 capital ratio
Total requirement for common equity tier 1 capital (%)
Excess coverage (percentage points)
Parent Parent Group Company Group Company 2017 2017 2016 2016
7,123 7,123 6,665 6,665
3,213 3,226 3,058 3,162
3,909 3,896 3,607 3,503
14.4 14.3 14.0 13.7
6.5 6.5 6.4 6.5
7.9 7.8 7.6 7.2
DKKm
15Spar Nord · Risk Report · 2017Capital management and solvency need
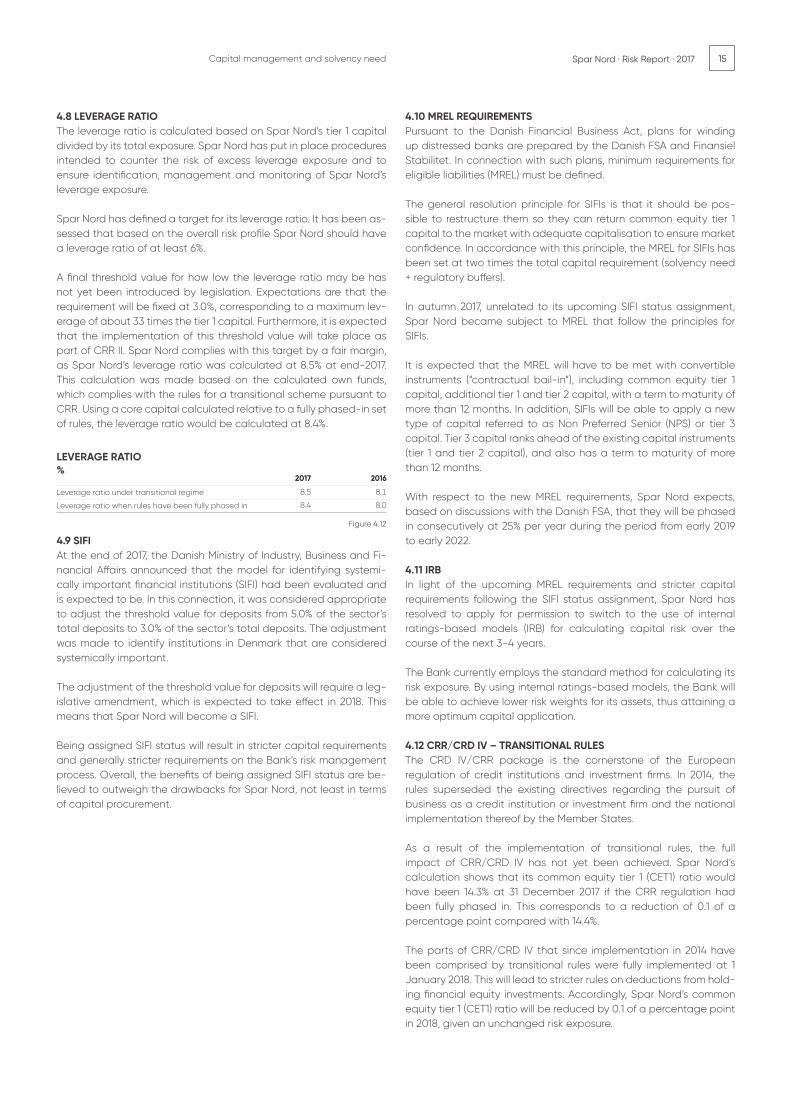
8.5 8.1
8.4 8.0
2017
LEVERAGE RATIO %
Leverage ratio under transitional regime
Leverage ratio when rules have been fully phased in
Figure 4.12
2016
4.8 LEVERAGE RATIO The leverage ratio is calculated based on Spar Nord’s tier 1 capital divided by its total exposure. Spar Nord has put in place procedures intended to counter the risk of excess leverage exposure and to ensure identification, management and monitoring of Spar Nord’s leverage exposure.
Spar Nord has defined a target for its leverage ratio. It has been as-sessed that based on the overall risk profile Spar Nord should have a leverage ratio of at least 6%.
A final threshold value for how low the leverage ratio may be has not yet been introduced by legislation. Expectations are that the requirement will be fixed at 3.0%, corresponding to a maximum lev-erage of about 33 times the tier 1 capital. Furthermore, it is expected that the implementation of this threshold value will take place as part of CRR II. Spar Nord complies with this target by a fair margin, as Spar Nord’s leverage ratio was calculated at 8.5% at end-2017. This calculation was made based on the calculated own funds, which complies with the rules for a transitional scheme pursuant to CRR. Using a core capital calculated relative to a fully phased-in set of rules, the leverage ratio would be calculated at 8.4%.
4.9 SIFI At the end of 2017, the Danish Ministry of Industry, Business and Fi-nancial Affairs announced that the model for identifying systemi-cally important financial institutions (SIFI) had been evaluated and is expected to be. In this connection, it was considered appropriate to adjust the threshold value for deposits from 5.0% of the sector’s total deposits to 3.0% of the sector’s total deposits. The adjustment was made to identify institutions in Denmark that are considered systemically important.
The adjustment of the threshold value for deposits will require a leg-islative amendment, which is expected to take effect in 2018. This means that Spar Nord will become a SIFI.
Being assigned SIFI status will result in stricter capital requirements and generally stricter requirements on the Bank’s risk management process. Overall, the benefits of being assigned SIFI status are be-lieved to outweigh the drawbacks for Spar Nord, not least in terms of capital procurement.
4.10 MREL REQUIREMENTS Pursuant to the Danish Financial Business Act, plans for winding up distressed banks are prepared by the Danish FSA and Finansiel Stabilitet. In connection with such plans, minimum requirements for eligible liabilities (MREL) must be defined.
The general resolution principle for SIFIs is that it should be pos-sible to restructure them so they can return common equity tier 1 capital to the market with adequate capitalisation to ensure market confidence. In accordance with this principle, the MREL for SIFIs has been set at two times the total capital requirement (solvency need + regulatory buffers).
In autumn 2017, unrelated to its upcoming SIFI status assignment, Spar Nord became subject to MREL that follow the principles for SIFIs.
It is expected that the MREL will have to be met with convertible instruments (“contractual bail-in”), including common equity tier 1 capital, additional tier 1 and tier 2 capital, with a term to maturity of more than 12 months. In addition, SIFIs will be able to apply a new type of capital referred to as Non Preferred Senior (NPS) or tier 3 capital. Tier 3 capital ranks ahead of the existing capital instruments (tier 1 and tier 2 capital), and also has a term to maturity of more than 12 months.
With respect to the new MREL requirements, Spar Nord expects, based on discussions with the Danish FSA, that they will be phased in consecutively at 25% per year during the period from early 2019 to early 2022.
4.11 IRB In light of the upcoming MREL requirements and stricter capital requirements following the SIFI status assignment, Spar Nord has resolved to apply for permission to switch to the use of internal ratings-based models (IRB) for calculating capital risk over the course of the next 3-4 years.
The Bank currently employs the standard method for calculating its risk exposure. By using internal ratings-based models, the Bank will be able to achieve lower risk weights for its assets, thus attaining a more optimum capital application.
4.12 CRR/CRD IV – TRANSITIONAL RULESThe CRD IV/CRR package is the cornerstone of the European regulation of credit institutions and investment firms. In 2014, the rules superseded the existing directives regarding the pursuit of business as a credit institution or investment firm and the national implementation thereof by the Member States.
As a result of the implementation of transitional rules, the full impact of CRR/CRD IV has not yet been achieved. Spar Nord’s calculation shows that its common equity tier 1 (CET1) ratio would have been 14.3% at 31 December 2017 if the CRR regulation had been fully phased in. This corresponds to a reduction of 0.1 of a percentage point compared with 14.4%.
The parts of CRR/CRD IV that since implementation in 2014 have been comprised by transitional rules were fully implemented at 1 January 2018. This will lead to stricter rules on deductions from hold-ing financial equity investments. Accordingly, Spar Nord’s common equity tier 1 (CET1) ratio will be reduced by 0.1 of a percentage point in 2018, given an unchanged risk exposure.
Parent Parent Group Company Group Company 2017 2017 2016 2016
7,123 7,123 6,665 6,665
3,213 3,226 3,058 3,162
3,909 3,896 3,607 3,503
14.4 14.3 14.0 13.7
6.5 6.5 6.4 6.5
7.9 7.8 7.6 7.2
16 Spar Nord · Risk Report · 2017 Capital management and solvency need
The expiry of the transitional rules will not have any effect on the own funds ratio, as the transitional rules on deduction of equity in-vestments only provide a change in the distribution of deductions between common equity tier 1 capital, tier 1 capital and own funds.
4.13 IFRS 9At 31 December 2017, Spar Nord estimated the impact of the new impairment rules that follow from IFRS 9 and how they will affect the Bank’s loan impairment charges etc. when they enter into force at the beginning of 2018. The estimate shows an effect to the tune of DKK 225-275 million, which when reduced by the tax impact of 22% equals a reduction in shareholders’ equity of 2.2-2.6%. For capital adequacy purposes, it is possible to use transitional rules, as a result of which IFRS 9 will only have a marginal overall effect on Spar Nord’s own funds in 2018, and the impact will gradually increase until the transitional rules are fully implemented over five years.
Spar Nord has resolved to utilise the possibility of applying the tran-sitional rules to the IFRS 9 impact on the calculation of own funds. Two components of the IFRS 9 impact must be considered when applying the transitional rules.
The static component equals the one-off effect and is calculated as the increase in the total allowance account from 31 December 2017 to 1 January 2018. The dynamic component equals the current developments. This component is calculated as the development in the allowance account for stages 1 and 2 between 1 January 2018 and a given future calculation date. Spar Nord will apply the tran-sitional arrangement relative to both the static and the dynamic component.
4.14 CRR II/CRD V – THE RULES OF THE FUTUREIn December 2017, the Basel Committee published its final recom-mendations for revised rules for calculating capital ratios and cap-ital requirements, designated CRR II and CRD V. The new rules will build on the existing CRR/CRD IV rules.
Spar Nord is aware of the following significant changes, which are relevant to calculations using the standard approach:
• Stricter capital requirements for exposures to unrated credit in-stitutions
• Stricter requirements for unutilised credit facilities• Stricter capital requirements for loans secured against real property• The more lenient capital requirements by way of an SME factor
for small businesses will be maintained
In light of Spar Nord’s process in the upcoming years of applying for approval relative to using IRB models for calculating the Bank’s capital adequacy, it is relevant to note that banks using internal models can only reduce their risk exposure to 72.5% relative to the calculated risk exposure when using the standard approach.
Changes have also been recommended for the calculation of mar-ket and operational risk, and significant changes are on the cards especially for market risk.
A binding requirement for the leverage ratio will be implemented, generally expected to be about 3%.
At present, no impact calculations have been made with respect to the implementation of CRR II/CRDV.
The rules are expected to enter into force on 1 January 2022, at the earliest.

17Spar Nord · Risk Report · 2017
5.1 LIQUIDITY POLICYThe policy determines Spar Nord’s overall risk profile for liquidity risks and financing structure, as well as the overall organisational dele-gation of responsibilities in the liquidity area with a view to profitably supporting Spar Nord’s business model.
The aim of the liquidity policy is to ensure that Spar Nord has a liquidity risk that at all times bears a natural relation to Spar Nord’s overall risk profile. In addition, the liquidity policy is intended to en-sure that Spar Nord continuously handles and manages its liquidity appropriately and is capable of meeting its payment obligations as and when due while complying with applicable legislation and supporting future activities and growth. Lastly, the policy is intended to ensure a financing structure that is optimised in relation to risk and price.
Spar Nord’s objective is for the LCR to amount to at least 125% in compliance with the regulation on LCR. In addition, Spar Nord aims to stay below the threshold value for Funding Ratio in the Diamond Test Model.
5. Liquidity risk
Liquidity risk
Compared with end-2016, Spar Nord’s liquidity situation remains at a strong level at end-2017. At 31 December 2017, Spar Nord’s LCR ratio was calculated at 187% compared with 171% at end-2016. Spar Nord’s strategic liquidity is calculated at DKK 20.8 billion, which is on a level with 2016, thus underlining the Bank’s comfortable liquidity situation.
Developments in 2017
Spar Nord Bank is generally exposed to liquidity risks when lending, investment and funding activities result in a cash flow mismatch. Liquidity risk means that Spar Nord cannot meet its payment obligations while also meeting the stat-utory liquidity requirements. Moreover, a liquidity risk exists if the lack of financing/funding prevents Spar Nord from adhering to the adopted business model, or if Spar Nord’s costs for procurement of liquidity rise disproportionately.
Definition of liquidity risk
LCR
187%2016: 171 %
STRATEGIC LIQUIDITY
DKK 20.8 billion2016: DKK 20.7 billion
SHARE OF ENCUMBERED ASSETS
2.2%2016: 5.1 %
18 Spar Nord · Risk Report · 2017 Liquidity risk
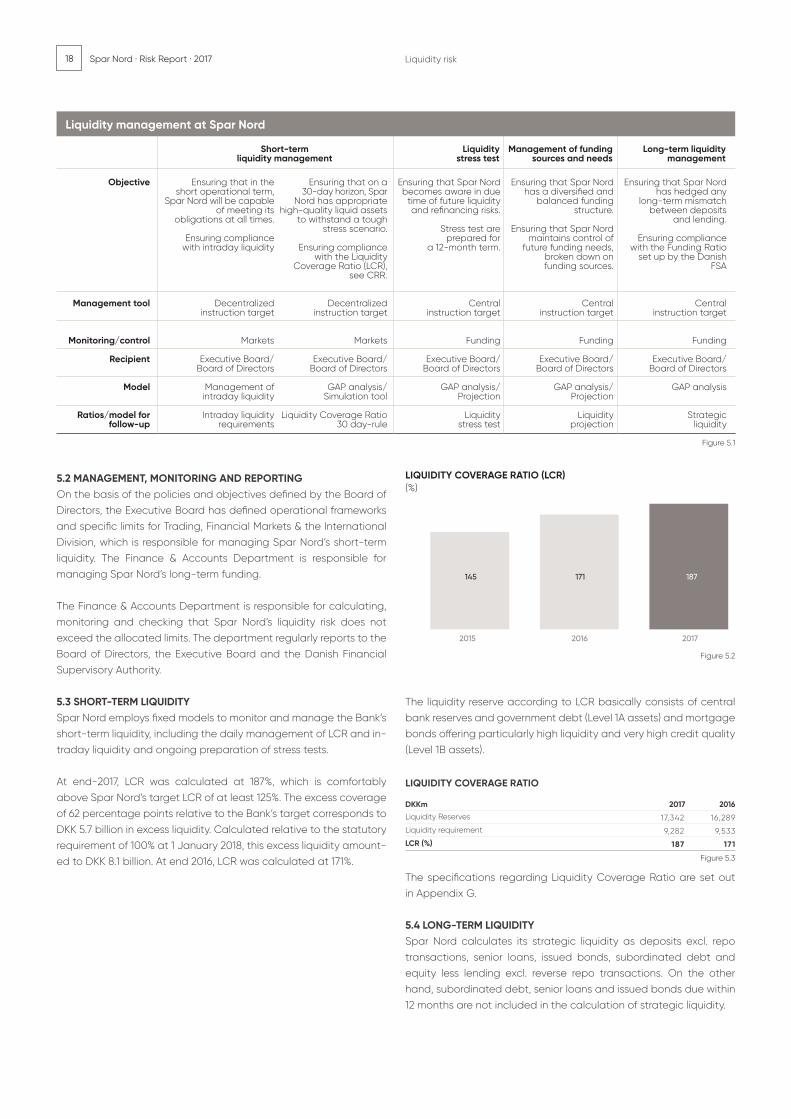
2016
17,342 16,289
9,282 9,533
187 171
Liquidity Reserves
Liquidity requirement
LCR (%)
DKKm
Figure 5.3
2017
LIQUIDITY COVERAGE RATIO
Figure 5.2
0
50
100
150
200
20152011 2012 2013 2014
2.757
1.727
1.0302.159
1.676
483
2.239
1.677
562
2.572
1.849
723
2.663
1.800
863
Indesign udgave
4. kvt.2016
1. kvt.2017
2. kvt.2017
171 168 176 165 187
3. kvt.2017
4. kvt.2017
2015 2016
145 171 187
2017
LIQUIDITY COVERAGE RATIO (LCR)(%)
5.2 MANAGEMENT, MONITORING AND REPORTING On the basis of the policies and objectives defined by the Board of Directors, the Executive Board has defined operational frameworks and specific limits for Trading, Financial Markets & the International Division, which is responsible for managing Spar Nord’s short-term liquidity. The Finance & Accounts Department is responsible for managing Spar Nord’s long-term funding.
The Finance & Accounts Department is responsible for calculating, monitoring and checking that Spar Nord’s liquidity risk does not exceed the allocated limits. The department regularly reports to the Board of Directors, the Executive Board and the Danish Financial Supervisory Authority.
5.3 SHORT-TERM LIQUIDITYSpar Nord employs fixed models to monitor and manage the Bank’s short-term liquidity, including the daily management of LCR and in-traday liquidity and ongoing preparation of stress tests.
At end-2017, LCR was calculated at 187%, which is comfortably above Spar Nord’s target LCR of at least 125%. The excess coverage of 62 percentage points relative to the Bank’s target corresponds to DKK 5.7 billion in excess liquidity. Calculated relative to the statutory requirement of 100% at 1 January 2018, this excess liquidity amount-ed to DKK 8.1 billion. At end 2016, LCR was calculated at 171%.
The liquidity reserve according to LCR basically consists of central bank reserves and government debt (Level 1A assets) and mortgage bonds offering particularly high liquidity and very high credit quality (Level 1B assets).
The specifications regarding Liquidity Coverage Ratio are set out in Appendix G.
5.4 LONG-TERM LIQUIDITYSpar Nord calculates its strategic liquidity as deposits excl. repo transactions, senior loans, issued bonds, subordinated debt and equity less lending excl. reverse repo transactions. On the other hand, subordinated debt, senior loans and issued bonds due within 12 months are not included in the calculation of strategic liquidity.
Short-term Liquidity Management of funding Long-term liquidity liquidity management stress test sources and needs management
Figure 5.1
Liquidity management at Spar Nord
Objective Ensuring that in the Ensuring that on a Ensuring that Spar Nord Ensuring that Spar Nord Ensuring that Spar Nord short operational term, 30-day horizon, Spar becomes aware in due has a diversified and has hedged any Spar Nord will be capable Nord has appropriate time of future liquidity balanced funding long-term mismatch of meeting its high-quality liquid assets and refinancing risks. structure. between deposits obligations at all times. to withstand a tough and lending. stress scenario. Stress test are Ensuring that Spar Nord Ensuring compliance prepared for maintains control of Ensuring compliance with intraday liquidity Ensuring compliance a 12-month term. future funding needs, with the Funding Ratio with the Liquidity broken down on set up by the Danish Coverage Ratio (LCR), funding sources. FSA see CRR.
Management tool Decentralized Decentralized Central Central Central instruction target instruction target instruction target instruction target instruction target
Monitoring/control Markets Markets Funding Funding Funding
Recipient Executive Board/ Executive Board/ Executive Board/ Executive Board/ Executive Board/ Board of Directors Board of Directors Board of Directors Board of Directors Board of Directors
Model Management of GAP analysis/ GAP analysis/ GAP analysis/ GAP analysis intraday liquidity Simulation tool Projection Projection
Ratios/model for Intraday liquidity Liquidity Coverage Ratio Liquidity Liquidity Strategic follow-up requirements 30 day-rule stress test projection liquidity

19Spar Nord · Risk Report · 2017
At end-2017, Spar Nord had strategic liquidity of DKK 20.8 billion. This level was unchanged from end-2016, when strategic liquidity was calculated at DKK 20.7 billion.
The flat development was due to the fact that both lending and deposits increased by DKK 2.2 billion. In addition, equity etc. in-creased by DKK 0.4 billion, while subordinated debt of DKK 0.3 billion had a term to maturity of less than 12 months, as a result of which it is not recognised as long-term liquidity.
5.5 STRESS TESTINGIn accordance with the Executive Order on Management and Control of Banks etc., Spar Nord prepares internal liquidity stress tests based on LCR. The stress tests span a 12-month period and are calculated using three permanently defined scenarios: A busi-ness-specific, a market-specific and a mixed scenario. The stress tests prepared have lived up to statutory requirements as well as internal targets throughout the period.
In addition, Spar Nord performs a stress test corresponding to Moody’s “12-month scenario with no access to funding”. This sce-nario operates on the assumption that Spar Nord has no access to capital markets during the period of calculation, for which rea-son senior loans, issued bonds and subordinated debt cannot be refinanced on maturity. Contractual due dates are used for mon-ey-market balances, while the stable deposit base remains an ac-cessible source of funding in the period.
As appears from figure 5.6, Spar Nord has positive liquidity for the full 12-month period.
5.6 FUNDING AND MATURITY STRUCTURESpar Nord’s operations are predominantly funded through four funding sources:
• Customer deposits• Loans or repo transactions from other credit institutions and Danmarks Nationalbank (the central bank)• Issued bonds and senior loans• Subordinated debt and equity
From an overall perspective, Spar Nord’s funding at end-2017 in-creased by DKK 2.3 billion to DKK 60.9 billion compared with end-2016. The principal change in Spar Nord’s funding is a DKK 2.4 bil-lion increase in deposits, which was primarily driven by deposits on demand. A net decline in the use of repos and repurchases and debt to central banks and credit institutions have to some degree affected the Bank’s total funding at the end of 2017. Deposits remain Spar Nord’s largest source of funding, and at end-2017 it represent-ed 80.2% of Spar Nord’s total funding.
In total, Spar Nord’s long-term funding (deposits on demand and funding with a term to maturity of more than 12 months) amounts to 93.1%, which is 1.4 percentage points up on end-2016.
FUNDING STRUCTURE
Central banks and credit institutions
Repos and repurchases with central banks and credit institutions
Senior loans < 1 year
Issued bonds < 1 year
Deposits < 1 year
Deposits > 1 year and on demand
Senior loans > 1 year
Issued bonds > 1 year
Subordinated debt
Equity
Total
20162017DKKm/% 2017
Figure 5.7
2016
1,377 981 2.3 1.7
555 1,400 0.9 2.4
2 0 0.0 0.0
0 0 0.0 0.0
2,262 2,483 3.7 4.2
46,582 43,981 76.5 75.0
30 49 0.0 0.1
0 0 0.0 0.0
1,144 1,093 1.9 1.9
8,975 8,627 14.7 14.7
60,926 58,614 100.0 100.0
Liquidity risk
Figure 5.5
STRATEGIC LIQUIDITY(DKKBN)
0
5
10
15
20
25
20152011 2012 2013 2014
2.757
1.727
1.0302.159
1.676
483
2.239
1.677
562
2.572
1.849
723
2.663
1.800
863
Indesign udgave
2015 2016 2017
19.5 20.7 20.8
0
5
10
15
20
25
20152011 2012 2013 2014
2.757
1.727
1.0302.159
1.676
483
2.239
1.677
562
2.572
1.849
723
2.663
1.800
863
Indesign udgave
Strategicliquidity
2016
Deposits,bankingactivities
Seniorloans/bondsissues
Sharehold.equity and
subord.debt.
Lending,bankingactivities
Lending,leasing
activities
Maturity< 1 year
Strategicliquidity
2017
2.20.4
0.0
-0.8-1.3
20.8
-0.3
20.7
DEVELOPMENT IN STRATEGIC LIQUIDITY(DKKBN)
Figure 5.4
22.5
15.0
7.5
0
MOODY’S 12-MTH SCENARIO WITH NO ACCESS TO FUNDING
(DKKBN)
End ofyear
Figure 5.6
5mth.
6mth.
7mth.
8mth.
9mth.
10mth.
11mth.
12mth.
1mth.
2mth.
3mth.
4mth.
2017 2016 2015
10
15
20
25
2015 2016 2017
19,5 20,7 20,8

20 Spar Nord · Risk Report · 2017
40
30
20
10
0
Figure 5.8
FUNDING STRUCTURE
2017
(DKKBN)
Cen
tra
l ba
nks
and
cred
it in
stitu
tions
Rep
os
and
rep
ur-
cha
ses
with
ce
ntra
l ba
nks
and
cre
dit
inst
itutio
nsSe
nio
r lo
ans
<
1 yea
r
Issu
ed
bo
nds
< 1 y
ear
Dep
osi
ts <
1 ye
ar
Dep
osi
ts >
1 ye
ar
and
on
dem
and
Seni
or l
oa
ns >
1 y
ear
Issu
ed
bo
nds
> 1 y
ear
Sub
ord
ina
ted
deb
t
Equi
ty
Short-term funding Long-term funding
2016
Liquidity risk
1,503 2,387 1,954 4,339
90,430 86,197 88,525 85,299
1.7 2.8 2.2 5.1
DKKm
Encumbered assets
Assets and collateral
Share of encumbered assets (%)
Year-end Average
Figure 5.9
20162016 20172017
SHARE OF ENCUMBERED ASSETS
5.7 LIQUIDITY CONTINGENCY PLANSpar Nord has prepared a liquidity contingency plan pursuant to the Danish Executive Order on Management and Control of Banks. This plan contains a catalogue of possible courses of action for strengthening Spar Nord’s liquidity in a critical situation. The cata-logue contains a more detailed description of the expected impact and time span of the individual actions.
The liquidity contingency plan is applied if Spar Nord can only meet the predetermined liquidity instructions with difficulty and with re-sulting sharply increased funding costs.
5.8 ENCUMBERED ASSETSAssets encumbrance may constitute a funding risk if the bank has many encumbered assets relative to its balance sheet total. Exten-sive asset encumbrance may also have a negative impact on the potential for procuring unsecured financing, as increased asset en-cumbrance contributes to deteriorate the position of this type of creditors.
As part of its business model, the Bank has for many years been active in the money and derivatives markets. One of the resulting effects is that some assets will be encumbered because market practice in interbank derivative transactions is to provide collat-eral for the market values or as collateral in connection with the procurement of funding in repo transactions. Moreover, the Bank provides collateral for numerous other purposes, including clearing activities and the raising of mortgage loans secured against the Bank’s properties.
The primary sources of asset encumbrance are:
Encumbrance triggered by activities in the securities market:• Repo and reverse repo transactions• Repurchase transactions with Danmarks Nationalbank • Securities lending
Collateral for derivative transactions:• CSA collateral for the market value of derivative transactions• CSA collateral for the clearing of derivative transactions• Collateral for stock lending
Other assets:• Collateral furnished with clearing systems• Paid-in margins and default funds • Offsetting, cf. netting agreements• Security provided for mortgage loans
The primary collateral received derives from reverse repo transac-tions.
The average share of Spar Nord’s total encumbered assets amounts to 2.2% of the total assets plus collateral received that can form the basis for encumbrance in 2017. This is a decrease of 2.9 percentage points from 5.1% in 2016.
The specifications regarding encumbered assets are set out in Ap-pendix H.
5.9 FUTURE LEGISLATION REGARDING LIQUIDITYThe European Commission’s final proposal for CRR II is expected to be finally adopted in mid-2018, after which time the liquidity requirement in the form of the Net Stable Funding Ratio (NSFR) is expected to apply from mid-2020. NSFR seeks to ensure stable funding profiles for the individual banks, the focus being the rela-tionship between the term of individual assets and funding. The NSFR ratio is to be calculated for a 12-month horizon.
On the basis of preliminary calculations and assessments of the principles underlying the calculation of NSFR, Spar Nord is believed to be ready for a future NSFR liquidity requirement of 100%.
On 23 June 2017, the Danish FSA approved the updated liquidity benchmark for the Supervisory Diamond Test Model, which will re-place the existing liquidity ratio calculated according to section 152 of the Danish Financial Business Act. The updated liquidity bench-mark will enter into force on 30 June 2018.
At end-2017, Spar Nord already complied with the new liquidity benchmark.
21Spar Nord · Risk Report · 2017
6. Credit risk
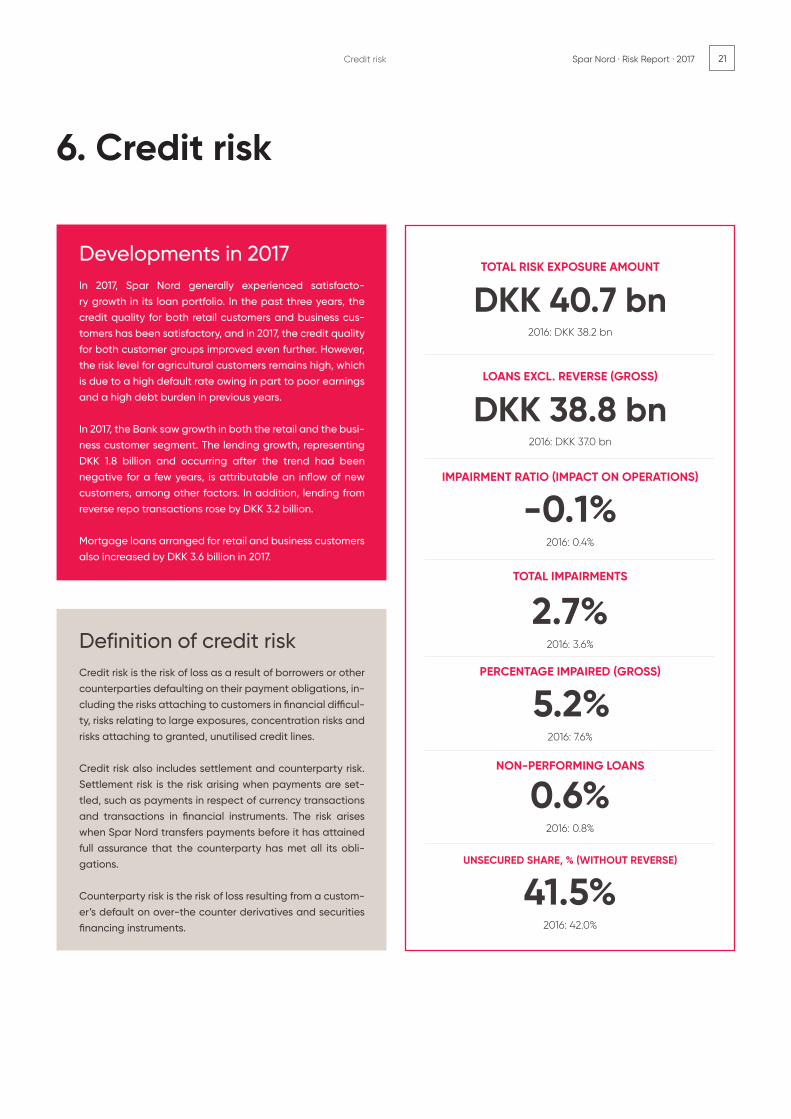
In 2017, Spar Nord generally experienced satisfacto-ry growth in its loan portfolio. In the past three years, the credit quality for both retail customers and business cus-tomers has been satisfactory, and in 2017, the credit quality for both customer groups improved even further. However, the risk level for agricultural customers remains high, which is due to a high default rate owing in part to poor earnings and a high debt burden in previous years.
In 2017, the Bank saw growth in both the retail and the busi-ness customer segment. The lending growth, representing DKK 1.8 billion and occurring after the trend had been negative for a few years, is attributable an inflow of new customers, among other factors. In addition, lending from reverse repo transactions rose by DKK 3.2 billion.
Mortgage loans arranged for retail and business customers also increased by DKK 3.6 billion in 2017.
Developments in 2017
Credit risk is the risk of loss as a result of borrowers or other counterparties defaulting on their payment obligations, in-cluding the risks attaching to customers in financial difficul-ty, risks relating to large exposures, concentration risks and risks attaching to granted, unutilised credit lines.
Credit risk also includes settlement and counterparty risk. Settlement risk is the risk arising when payments are set-tled, such as payments in respect of currency transactions and transactions in financial instruments. The risk arises when Spar Nord transfers payments before it has attained full assurance that the counterparty has met all its obli-gations.
Counterparty risk is the risk of loss resulting from a custom-er’s default on over-the counter derivatives and securities financing instruments.
Definition of credit risk
Credit risk
TOTAL RISK EXPOSURE AMOUNT
DKK 40.7 bn2016: DKK 38.2 bn
LOANS EXCL. REVERSE (GROSS)
DKK 38.8 bn2016: DKK 37.0 bn
IMPAIRMENT RATIO (IMPACT ON OPERATIONS)
-0.1%2016: 0.4%
TOTAL IMPAIRMENTS
2.7%2016: 3.6%
PERCENTAGE IMPAIRED (GROSS)
5.2%2016: 7.6%
NON-PERFORMING LOANS
0.6%2016: 0.8%
UNSECURED SHARE, % (WITHOUT REVERSE)
41.5% 2016: 42.0%

22 Spar Nord · Risk Report · 2017
6.1 CREDIT POLICY Spar Nord’s overall credit risk is controlled on the basis of its credit policy, which the Board of Directors determines in conjunction with the general policies and frameworks for risk assumption. The pivot-al objective of Spar Nord’s credit policy is to ensure that earnings and risks are balanced, and that the assumption of risk is always quantified.
It is Spar Nord’s policy that credit must always be granted on the basis of insight into the customer’s financial position and that credit quality – the customer’s ability and intention to meet current and future obligations – is a key parameter in all customer relations.
Spar Nord aims to develop long-term relationships with customers and does not want to use risk appetite as a competitive parame-ter. Spar Nord only wants to conclude transactions that conform to good banking practice and do not jeopardise Spar Nord’s reputa-tion and professional profile.
As a basic rule, Spar Nord does not grant loans and credit facilities
based on collateral alone. Thus, the customer should show the in-tention and have the ability to repay loans without Spar Nord hav-ing to realise the collateral.
In its endeavours to ensure sound risk diversification of its credit ex-posure, Spar Nord has introduced a number of internal targets.
In order not to lose its freedom of action towards a customer, the Bank generally aims not to increase its exposure towards a custom-er to such an extent that the customer would not be creditworthy in other banks. Consequently, Spar Nord has introduced a cap on individual exposures of DKK 500 million, of which basically the un-secured share of credit exposure may not exceed DKK 250 million in respect of any facility.
Exposures to financial institutions under supervision and repo and reverse repo transactions are not comprised by this restriction.
In determining the amount of exposure, generally accepted credit risk adjustments are made, as appears from the section regard-ing Large exposures in the CRR Regulation. The statutory limitations apply to trading partners in the financial sector with an external credit rating at investment grade level, and a DKK 700 million cap has been fixed internally for other trading partners in the financial sector.
Spar Nord has set targets for the industry diversification of loans, advances and guarantees, which means that brackets have been fixed for the desired share of total exposure that major lines of in-dustry may represent.
Finally, in its credit policy Spar Nord has stipulated that it wants in-sight into any commitments that its customers may have towards other financial institutions.
6.2 MANAGEMENT, MONITORING AND REPORTING Although Spar Nord’s business model is characterised by decen-tralised decision-making powers, the credit process is managed centrally.
As concerns new customers, the facility authorisation right is gener-ally half of that for existing customers. The powers of authority in the credit area are governed by two factors: The individual local man-agers’ ability and requirements and the wish that a certain share of authorisations from the local banks is dealt with by Credit Rating. Decentralised facility authorisation rights are maximised at DKK 10 million for existing customers.
Customer advisers, in consultation with local managers, handle the day-to-day management of Spar Nord’s credit risks. If a credit facility exceeds the local loan approval limits, it will be passed on
and dealt with by Credit Rating, the Credit Committee or the Board of Directors. Credit Rating may authorise credit lines up to DKK 50 million for existing customers and DKK 25 million for new customers. The Credit Committee may authorise exposures up to DKK 100 mil-lion, and up to DKK 50 million for new facilities. Exposures exceeding DKK 100 million and new exposures exceeding DKK 50 million are subject to approval by the Board of Directors. However, the Credit Committee may authorise credit facility extensions of up to DKK 50 million relative to the most recent authorisation given by the Board of Directors.
Overall monitoring of Spar Nord’s credit risk exposure is managed by the Credit Quality Department. This department oversees changes in the credit quality of exposures and undertakes systematic credit quality control of the credit portfolio.
New retail customer exposures in excess of DKK 100,000 and busi-ness customer exposures in excess of DKK 300,000 are systemat-ically screened with a view to being selected for a manual credit quality assessment. The selection is made on the basis of a combi-nation of risk parameters, which combined, or separately, indicate an increased level of risk. New customers with weak credit quality are registered on an ongoing basis.
Spar Nord has developed IT tools for controlling and monitoring credit risks. Spar Nord’s credit analysis system is used for monitoring purposes, and key data regarding credit exposures and custom-ers’ financial affairs are recorded in it. This is done to detect danger signals at an early stage and also to monitor changes in the credit quality of portfolios and organisational units.
Every month a statistically-based rating of both retail and business customers is performed. Rating systems are used at the local level to grant credit facilities. Thus, customers in the rating groups accord-ed the least risk exposure are more likely to be given higher credit limits or extensions than those with the greatest risk exposure. The systems are also used for managing overdrafts and for pricing pur-poses to help ensure a correlation between the risk assumed by the customer and the price paid.
% Maximum share of total exposure*
Agricultural sector 10
Property sector 15
of which speculative**) property financing 5
Financing and insurance 10
Industry and raw materials development 10
Trade 15
Utilities 8
* Excl. reverse repo transactions
** CRR 575/2013 Article 4(79)
Figure 6.1
TARGETS FOR INDUSTRY DIVERSIFICATION
Credit risk
23Spar Nord · Risk Report · 2017Credit risk
As a component of Spar Nord’s credit processing, all non-defaulting customers are risk-classified according to the probability that the individual customer defaults within the next 12 months. Customers are divided into groups 1 to 9, with group 9 containing customers subject to the highest risk. The probability of default is estimated statistically by means of Spar Nord’s rating systems which are based on various models for the different customer segments.
The model applied to business customers employs three compo-nents: An accounting component used to risk-classify the customer based on its most recent financial statements. A behavioural com-ponent that classifies the customer based on its account behav-iour and credit authorisation history. The third component is a cycli-cal component used to adjust the classification based on cyclical trends.
New business customers are classified based on the accounting component and the cyclical component until the sixth month, at which time the behavioural component is also applied.
For retail customers, the model is exclusively based on a behavioural component and a cyclical component.
New retail customers are risk-classified according to an application scoring model that is based on classical credit performance indi-cators, such as assets, pay, disposable income, etc. This model is based on a combination of a statistical and an expert model. After six months, customers are subjected to a behavioural scoring scruti-ny, and the results obtained using the two models are co-weighted in the transitional period until the twelfth month, after which the rat-ing is based on the behavioural component exclusively.
Moreover, Spar Nord applies a qualitative risk classification, in which the Spar Nord adviser flags the credit quality as weak if a customer shows signs of default risk. For retail customers, these signs of de-fault risk may for instance be divorce, unemployment, etc., and for business customers they could be marketing difficulties, the loss of key employees or suppliers, etc.
If a retail customer is flagged as having a weak credit quality and is not in default, the customer will be downgraded by one rating group; it should be noted that a customer flagged as having a weak credit quality does not qualify for rating in the best rating groups (1 and 2).
Business customers are rated based on two categories, customers flagged as having a weak credit quality and customers not flagged, using two different models. However, both models are based on the same components.
6.3 CREDIT EXPOSURE Spar Nord’s total credit exposure is attributable partly to activities related to loans and guarantees, partly to trading activities involv-ing bonds and financial instruments, etc.
Figure 6.2 shows Spar Nord’s total credit exposure (carrying amount) as at end-2017 and end-2016.
Spar Nord’s impairment account amounted to a total of DKK 1,616 million at 31 December 2017.
6.4 LOANS, ADVANCES AND GUARANTEES Spar Nord’s total loans, advances and guarantees before offset-ting of impairment losses amounted to DKK 60.3 billion at end-2017 compared with DKK 55.7 billion at end-2016, equal to an increase of 8%. The DKK 4.6 billion increase is attributable to a DKK 5.0 billion increase in lending and a DKK 0.4 billion decrease in guarantees.
Customers are categorised into five groups as part of the ongoing risk monitoring: Retail customers – Local Banks, Business custom-ers – Local Banks, Public-sector customers, financial customers and Spar Nord Leasing.
The development in these customer groups appears from figure 6.4.
Reverse repo transactions with customers
Loans and advances at amortised cost
Loans, advances and other receivables at amortised cost
Contingent liabilities
Net credit exposure relating to loans, advances and guarantees
Impairments of loans and provisions against guarantees, etc.
Discount on commitments taken over
Gross credit exposure relating to loans, advances and guarantees
Net credit exposure relating to loans, advances and guarantees
Cash balances and demand deposits with central banks
Reverse repo transactions
Due from credit institutions and central banks
Credit exposure for financial reporting purposes relating to lending activities
Positive fair value of derivative instruments, etc.
Credit exposure relating to assets in the trading portfolio
Assets in strategic business partners
Associates
Credit exposure for financial reporting purposes
20162017
CREDIT EXPOSURE (CARRYING AMOUNT), INCL. DISCOUNT ON EXPOSURES TAKEN OVER, PROVISIONS AND FAIR-VALUE ADJUSTMENTS
Figure 6.2
DKKm
9,475 6,253
37,272 35,092
46,747 41,346
11,961 12,334
58,708 53,680
1,616 1,877
0 103
60,324 55,660
58,708 53,680
1,298 595
570 1,453
867 726
61,444 56,454
1,030 1,284
11,059 15,148
1,405 1,346
128 118
75,066 74,350
IMPAIRMENT ACCOUNT AND DISCOUNT ON LOANS, ADVANCES AND GUARANTEES
Impairmentaccount/discount
Discount onexposurestaken over
Impairmentaccount
Spar Nord
20162017DKKm 201620172016
1,616 1,877 0 103 1,616 1,980
2017
Figure 6.3
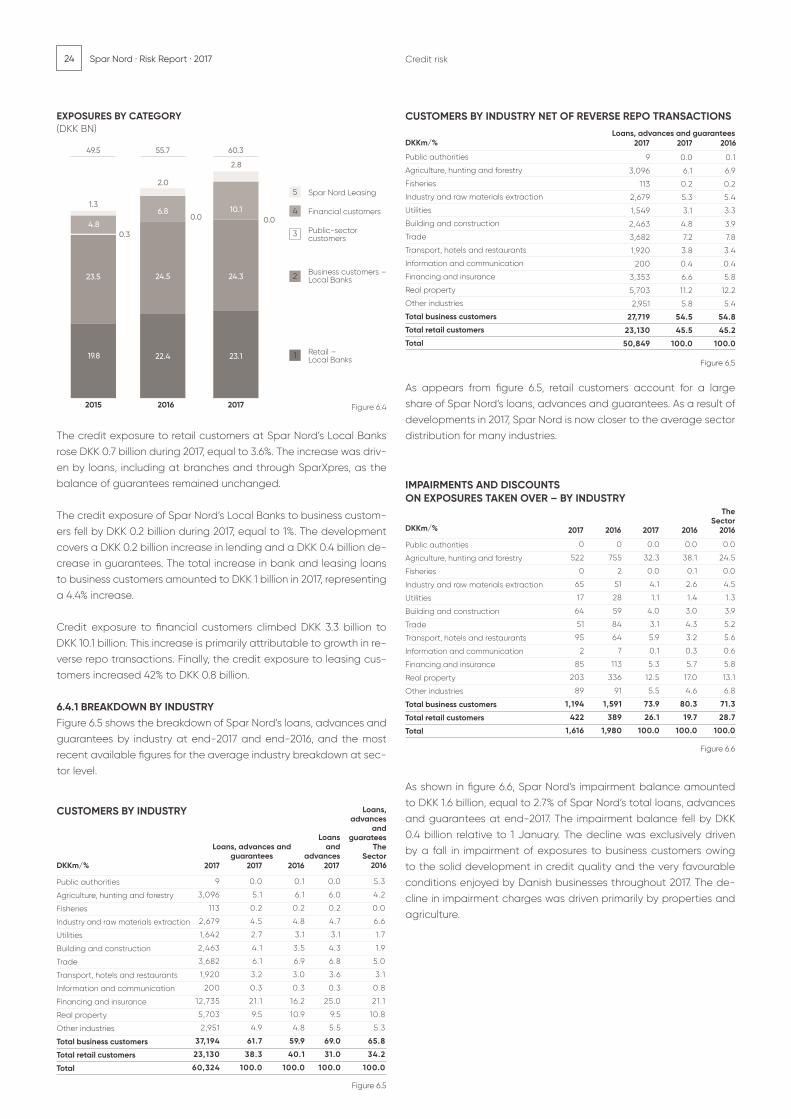
24 Spar Nord · Risk Report · 2017 Credit risk
The credit exposure to retail customers at Spar Nord’s Local Banks rose DKK 0.7 billion during 2017, equal to 3.6%. The increase was driv-en by loans, including at branches and through SparXpres, as the balance of guarantees remained unchanged.
The credit exposure of Spar Nord’s Local Banks to business custom-ers fell by DKK 0.2 billion during 2017, equal to 1%. The development covers a DKK 0.2 billion increase in lending and a DKK 0.4 billion de-crease in guarantees. The total increase in bank and leasing loans to business customers amounted to DKK 1 billion in 2017, representing a 4.4% increase.
Credit exposure to financial customers climbed DKK 3.3 billion to DKK 10.1 billion. This increase is primarily attributable to growth in re-verse repo transactions. Finally, the credit exposure to leasing cus-tomers increased 42% to DKK 0.8 billion.
6.4.1 BREAKDOWN BY INDUSTRY Figure 6.5 shows the breakdown of Spar Nord’s loans, advances and guarantees by industry at end-2017 and end-2016, and the most recent available figures for the average industry breakdown at sec-tor level.
As appears from figure 6.5, retail customers account for a large share of Spar Nord’s loans, advances and guarantees. As a result of developments in 2017, Spar Nord is now closer to the average sector distribution for many industries.
As shown in figure 6.6, Spar Nord’s impairment balance amounted to DKK 1.6 billion, equal to 2.7% of Spar Nord’s total loans, advances and guarantees at end-2017. The impairment balance fell by DKK 0.4 billion relative to 1 January. The decline was exclusively driven by a fall in impairment of exposures to business customers owing to the solid development in credit quality and the very favourable conditions enjoyed by Danish businesses throughout 2017. The de-cline in impairment charges was driven primarily by properties and agriculture.
Public authorities
Agriculture, hunting and forestry
Fisheries
Industry and raw materials extraction
Utilities
Building and construction
Trade
Transport, hotels and restaurants
Information and communication
Financing and insurance
Real property
Other industries
Total business customers
Total retail customers
Total
201620172016 20162017
IMPAIRMENTS AND DISCOUNTSON EXPOSURES TAKEN OVER – BY INDUSTRY
DKKm/%
0 0 0.0 0.0 0.0
522 755 32.3 38.1 24.5
0 2 0.0 0.1 0.0
65 51 4.1 2.6 4.5
17 28 1.1 1.4 1.3
64 59 4.0 3.0 3.9
51 84 3.1 4.3 5.2
95 64 5.9 3.2 5.6
2 7 0.1 0.3 0.6
85 113 5.3 5.7 5.8
203 336 12.5 17.0 13.1
89 91 5.5 4.6 6.8
1,194 1,591 73.9 80.3 71.3
422 389 26.1 19.7 28.7
1,616 1,980 100.0 100.0 100.0
Figure 6.6
The Sector
0.0
EXPOSURES BY CATEGORY(DKK BN)
49.5 55.7 60.3
Figure 6.42017
22.4 23.1
24.5 24.3
2.0
2.8
6.8 10.10.0
2016
19.8
23.5
1.3
4.80.3
Retail – Local Banks1
Business customers – Local Banks2
Public-sector customers
3
Financial customers4
Spar Nord Leasing5
2015
CUSTOMERS BY INDUSTRY NET OF REVERSE REPO TRANSACTIONS
Public authorities
Agriculture, hunting and forestry
Fisheries
Industry and raw materials extraction
Utilities
Building and construction
Trade
Transport, hotels and restaurants
Information and communication
Financing and insurance
Real property
Other industries
Total business customers
Total retail customers
Total
DKKm/%
Figure 6.5
9 0.0 0.1
3,096 6.1 6.9
113 0.2 0.2
2,679 5.3 5.4
1,549 3.1 3.3
2,463 4.8 3.9
3,682 7.2 7.8
1,920 3.8 3.4
200 0.4 0.4
3,353 6.6 5.8
5,703 11.2 12.2
2,951 5.8 5.4
27,719 54.5 54.8
23,130 45.5 45.2
50,849 100.0 100.0
Loans, advances and guarantees20172017 2016
2016
Loans, advances and guarantees
DKKm/%
9 0.0 0.1 0.0 5.3
3,096 5.1 6.1 6.0 4.2
113 0.2 0.2 0.2 0.0
2,679 4.5 4.8 4.7 6.6
1,642 2.7 3.1 3.1 1.7
2,463 4.1 3.5 4.3 1.9
3,682 6.1 6.9 6.8 5.0
1,920 3.2 3.0 3.6 3.1
200 0.3 0.3 0.3 0.8
12,735 21.1 16.2 25.0 21.1
5,703 9.5 10.9 9.5 10.8
2,951 4.9 4.8 5.5 5.3
37,194 61.7 59.9 69.0 65.8
23,130 38.3 40.1 31.0 34.2
60,324 100.0 100.0 100.0 100.0
20162017
Figure 6.5
Loans, advances
and guaratees
The Sector
20172017
Loans and
advances
CUSTOMERS BY INDUSTRY

25Spar Nord · Risk Report · 2017
The increase in impairment charges on retail customers was due to a management decision to make portfolio impairment charges on retail loans with a high debt factor and other signs of weakness at the end-2017 in the amount of DKK 67 million. Collective impairment charges on retail customers subsequently amount to DKK 91 million at end-2017. For business customers, portfolio impairment charges of DKK 73 million were made at end-2017 relating to debt-ridden customers in various industries, and collective impairment charges on business customers subsequently amount to DKK 160 million at end-2017. Agricultural customers account for DKK 91 million of the collective impairment charges.
Impairment of exposures to customers in the agricultural sector de-clined by DKK 233 million in 2017, ending at DKK 522 million, equal to 17% of exposures against 22% at the beginning of the year.
As concerns size of exposures, Spar Nord’s credit portfolio is con-sidered to be well-diversified, for one thing because 60% of the to-tal exposure is attributable to exposures below DKK 10 million each, and because Spar Nord only has 48 exposures that exceed DKK 100 million.
In relation to the new benchmark for large exposures in the Financial Supervisory Authority’s Diamond Test Model, which may not exceed 175% of the institution’s common equity tier 1 (CET1), Spar Nord’s large exposures amounted to 76.2% at end-2017.
Spar Nord’s credit portfolio is also considered to have an excellent geographical spread. At end-2017, the North Jutland Region ac-counted for 35.2% of Spar Nord’s total loans, advances and guar-antees, while the balance is spread over the other regions in the country.
6.4.2 RETAIL CUSTOMERS AT THE LOCAL BANKS The total credit exposure to business customers at Spar Nord’s Lo-cal Banks amounted to DKK 23.1 billion at end-2017 compared with DKK 22.4 billion at end-2016. The credit exposure to retail customers amounts to 38% of Spar Nord’s total credit exposure. As appears from figure 6.9 below, the average credit quality of retail customers has improved over the past three years and are at a satisfactory level.
In 2017, there was an increase in exposures to the rating groups ac-corded the least risk exposure – rating group 1 – and a decline in the default group. These changes are the primary contributor to the improved credit quality.
9 0.0 0.1
3,096 6.1 6.9
113 0.2 0.2
2,679 5.3 5.4
1,549 3.1 3.3
2,463 4.8 3.9
3,682 7.2 7.8
1,920 3.8 3.4
200 0.4 0.4
3,353 6.6 5.8
5,703 11.2 12.2
2,951 5.8 5.4
27,719 54.5 54.8
23,130 45.5 45.2
50,849 100.0 100.0
Credit risk
LOANS, ADVANCES AND GUARANTEES BROKEN DOWNBY SIZE OF EXPOSURE *)
0 - 0.1
0.1 - 0.5
0.5 - 1.0
1.0 - 5.0
5.0 - 10.0
10.0 - 20.0
20.0 - 50.0
50.0 - 100.0
100.0 -
Total
DKKm/%Number
2016
51,286 50,124 1.2 1.3
35,594 34,992 11.2 11.2
13,334 12,445 12.6 11.9
8,033 8,017 25.0 26.4
913 891 9.6 9.5
414 388 8.9 8.7
227 248 10.8 12.1
78 66 8.4 7.2
48 47 12.3 11.7
109,927 107,218 100.0 100.0
Share2017
Number2017
Share2016
Figure 6.7*) Excl. reverse repo transactions and SparXpres
EXPOSURES TO RETAIL CUSTOMERS BY RISK GROUP *)
2015 2016 2017
(%)
40
30
20
10
0987654321 De-
faultNot
rated
Figure 6.9*) Excl. SparXpres.
AVERAGE RISK GROUP *)
Average risk group
2.8 2.7 2.6
201720162015
Figure 6.10*) Exposures after impairments
05
10152025303540
20152011 2012 2013 2014
2.757
1.727
1.0302.159
1.676
483
2.239
1.677
562
2.572
1.849
723
2.663
1.800
863
Indesign udgave
The CapitalRegion
Mid-JutlandRegion
North JutlandRegion
RegionZealand
RegionSouth
Denmark
Unallocated
14.6
25.7
36.3
9.2
12.7
1.5
LOANS, ADVANCES AND GUARANTEES BROKEN DOWN BY REGION – 2016 *)(%)
Figure 6.8*) Excl. reverse repo transactions and SparXpres
05
10152025303540
The CapitalRegion
Mid-JutlandRegion
North JutlandRegion
RegionZealand
RegionSouth-
Denmark
Unallocated
15.7
24.6
35.2
10.113.1
1.3
LOANS, ADVANCES AND GUARANTEES BROKEN DOWN BY REGION – 2017 *)(%)
Figure 6.8
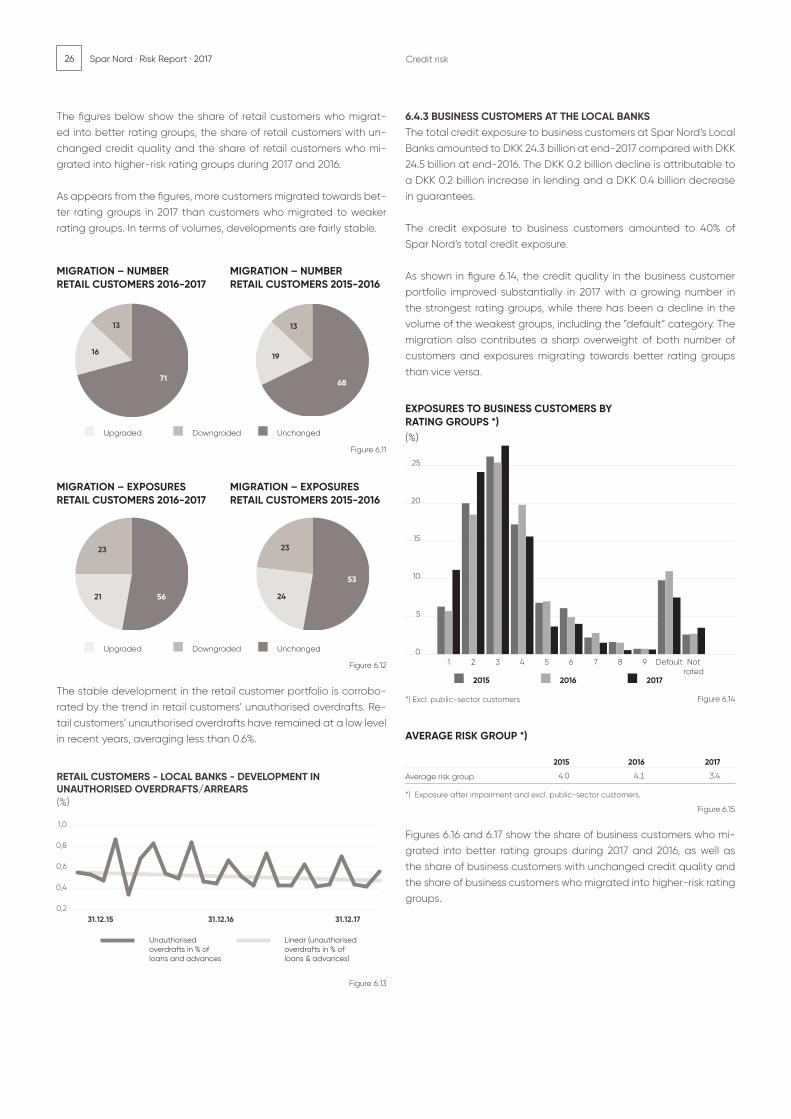
26 Spar Nord · Risk Report · 2017
AVERAGE RISK GROUP *)
Average risk group
2017
4.0 4.1 3.4
20162015
Figure 6.15
*) Exposure after impairment and excl. public-sector customers.
25
20
15
10
5
0
The figures below show the share of retail customers who migrat-ed into better rating groups, the share of retail customers with un-changed credit quality and the share of retail customers who mi-grated into higher-risk rating groups during 2017 and 2016.
As appears from the figures, more customers migrated towards bet-ter rating groups in 2017 than customers who migrated to weaker rating groups. In terms of volumes, developments are fairly stable.
The stable development in the retail customer portfolio is corrobo-rated by the trend in retail customers’ unauthorised overdrafts. Re-tail customers’ unauthorised overdrafts have remained at a low level in recent years, averaging less than 0.6%.
6.4.3 BUSINESS CUSTOMERS AT THE LOCAL BANKS The total credit exposure to business customers at Spar Nord’s Local Banks amounted to DKK 24.3 billion at end-2017 compared with DKK 24.5 billion at end-2016. The DKK 0.2 billion decline is attributable to a DKK 0.2 billion increase in lending and a DKK 0.4 billion decrease in guarantees.
The credit exposure to business customers amounted to 40% of Spar Nord’s total credit exposure.
As shown in figure 6.14, the credit quality in the business customer portfolio improved substantially in 2017 with a growing number in the strongest rating groups, while there has been a decline in the volume of the weakest groups, including the ”default” category. The migration also contributes a sharp overweight of both number of customers and exposures migrating towards better rating groups than vice versa.
Figures 6.16 and 6.17 show the share of business customers who mi-grated into better rating groups during 2017 and 2016, as well as the share of business customers with unchanged credit quality and the share of business customers who migrated into higher-risk rating groups.
Figure 6.14
EXPOSURES TO BUSINESS CUSTOMERS BY RATING GROUPS *)(%)
2015 2016 2017
Notrated
Default98765431 2
*) Excl. public-sector customers
Figure 6.13
0,2
0,4
0,6
0,8
1,0
31.12.15 31.12.16
Lineær (overtræk i procent af udlån)
Overtræk i procent af udlån
31.12.17
(%)
PRIVATKUNDER - LOKALE BANKER - UDVIKLING I OVERTRÆK/RESTANCER
0,20,40,60,81,01,21,41,61,8
0,2
0,4
0,6
0,8
1,0
(%)
RETAIL CUSTOMERS - LOCAL BANKS - DEVELOPMENT IN UNAUTHORISED OVERDRAFTS/ARREARS
31.12.15 31.12.16
Linear (unauthorised overdrafts in % of loans & advances)
Unauthorised overdrafts in % of loans and advances
31.12.17
MIGRATION – NUMBERRETAIL CUSTOMERS 2016-2017
MIGRATION – NUMBERRETAIL CUSTOMERS 2015-2016
Upgraded Downgraded Unchanged
68
13
19
MIGRATION – EXPOSURESRETAIL CUSTOMERS 2016-2017
Figure 6.12
MIGRATION – EXPOSURESRETAIL CUSTOMERS 2015-2016
Upgraded Downgraded Unchanged
23
24
53
71
13
16
23
21 56
Figure 6.11
Credit risk

27Spar Nord · Risk Report · 2017Credit risk
Figure 6.18
0,1
0,2
0,3
0,4
0,5
31.12.15 31.12.16
Lineær (overtræk i procent af udlån)
Overtræk i procent af udlån
31.12.17
(%)
ERHVERVSKUNDER UDEN LANDBRUG - LOKALE BANKER OVERTRÆK/RESTANCER
0,0
0,2
0,4
0,6
0,8
1,0
1,2
1,4
0,0
0,2
0,4
0,6
0,8
1,0
(%)
NON-AGRICULTURAL BUSINESS CUSTOMERS - LOCAL BANKS - DEVELOPMENT IN UNAUTHORISED OVERDRAFTS/ARREARS
31.12.15 31.12.16
Linear (unauthorised overdrafts in % of loans % advances)
Unauthorised overdrafts in % of loans and advances
31.12.17 %
LEASING
Public authorities
Agriculture, hunting and forestry
Fisheries
Industry and raw materials extraction
Utilities
Building and construction
Trade
Transport, hotels and restaurants
Information and communication
Financing and insurance
Real property
Other industries
Total business customers
Total retail customers
Total
0.0 0.0 0.0 0.0
16.0 18.3 20.5 12.0
0.0 0.0 0.0 0.0
15.1 17.3 26.3 44.9
6.5 4.1 2.4 1.0
13.2 11.9 8.0 7.5
7.3 7.5 2.0 5.1
20.6 18.2 18.2 17.4
0.7 1.4 0.3 0.0
1.1 2.6 0.1 0.0
2.6 1.0 1.0 0.7
16.7 17.5 20.0 9.8
99.8 99.8 98.8 98.4
0.2 0.2 1.2 1.6
100.0 100.0 100.0 100.0
201620162017
Figure 6.20
Impairmentaccount/discount
2017
Loans and advances
As was the case for retail customers, business customers’ unauthor-ised overdrafts and past due exposures remained at a stable, low level of 0.3% during 2015 and 2017.
6.4.4 MORTGAGE LOANS ARRANGED In addition to lending on Spar Nord’s own books, a major part of Spar Nord’s business consists of arranging mortgage loans on be-half of Totalkredit and DLR Kredit.
At end-2017, Spar Nord had arranged mortgage loans for a total of DKK 72.2 billion to its customers. Of this amount, mortgage loans to retail customers via Totalkredit amounted to DKK 65.6 billion, mort-gage loans to business customers via DLR Kredit amounted to DKK 11.1 billion, and mortgage loans to business customers via Totalkredit amounted to DKK 0.5 billion.
The cooperation with Totalkredit and DLR Kredit is based on the principle that in case of losses on the loans arranged by Spar Nord, a setoff will be made against the commission paid to Spar Nord for its loan-arranging services, or that – for some exposure categories – Spar Nord will be asked to provide a direct guarantee. However, as Spar Nord pursues a practice of recording losses arisen on an ongoing basis, no losses are offset against future commission.
Figure 6.19 shows the breakdown on rating groups for customers who have taken out mortgage loans with Totalkredit and DLR Kred-it. As appears, mortgage loans arranged for customers in the best rating groups represent the bulk of the group.
6.4.5 LEASING ACTIVITIES Spar Nord’s total credit exposure in the leasing area amounted to DKK 2.8 billion at end-2017, equal to 5% of total loans, advances and guarantees.
Figure 6.20 shows the breakdown by industry of Spar Nord’s leasing loans.
50
40
30
20
10
0
MORTGAGE LOANS ARRANGED DLR AND TOTALKREDIT (%)
987654321 Default Notrated
Figure 6.19
Mortgage loans arranged Banking activities
Upgraded Downgraded Unchanged
51
29
20
MIGRATION – EXPOSURESBUSINESS CUSTOMERS 2016-2017
MIGRATION – NUMBERBUSINESS CUSTOMERS 2016-2017
Figure 6.17
MIGRATION – EXPOSURESBUSINESS CUSTOMERS 2015-2016
MIGRATION – NUMBERBUSINESS CUSTOMERS 2015-2016
Upgraded Downgraded Unchanged
40
19
41
54
14
32
36
21
43
Figure 6.16

28 Spar Nord · Risk Report · 2017 Credit risk
CREDIT QUALITY2016
Public authorities
Agriculture, hunting and forestry
Fisheries
Industry and raw materials extraction
Utilities
Building and construction
Trade
Transport, hotels and restaurants
Information and communication
Financing and insurance
Real property
Other industries
Total business customers
Total retail customers
Total
% 0.0 0.0 0.0 0.1 0.1
3.3 0.1 0.2 2.5 6.1
0.0 0.0 0.0 0.2 0.2
0.3 0.1 0.7 3.7 4.8
0.1 0.0 0.6 2.4 3.1
0.4 0.4 0.3 2.4 3.5
0.6 0.1 0.5 5.7 6.9
0.4 0.0 0.2 2.4 3.0
0.0 0.0 0.1 0.2 0.3
0.5 0.0 0.1 15.6 16.2
2.3 0.3 0.7 7.6 10.9
0.4 0.0 0.4 4.0 4.8
8.4 1.1 3.8 46.6 59.9
1.9 0.1 2.4 35.7 40.1
10.3 1.2 6.2 82.3 100.0
ExposureCredit quality category
2b2c 2a/31
Figur 6.23
GEOGRAPHICAL BREAKDOWN OF MORTGAGES(%)
Figure 6.24
05
10152025303540
20152011 2012 2013 2014
2.757
1.727
1.0302.159
1.676
483
2.239
1.677
562
2.572
1.849
723
2.663
1.800
863
Indesign udgave
15.8
20.2
38.3
11.3 12.8 1.6
The CapitalRegion
Mid-JutlandRegion
North JutlandRegion
RegionZealand
RegionSouth-
Denmark
Unallocated
MORTGAGES BROKEN DOWN BY PROPERTY TYPE
Private housing
Holiday homes
Offices and businesses
Agriculture
Other
Total
2017 2017 DKKm/%
Figure 6.25
2016 2016
56.8 14,014
4.0 980
14.7 3,618
9.5 2,353
15.0 3,710
100.0 24,675
55.4 12,913
4.1 953
16.1 3,757
10.4 2,434
14.0 3,253
100.0 23,311
20162017
REPOSSESSED EQUIPMENT
Repossessed equipment, total
2 14
DKKm
Figure 6.21
CREDIT EXPOSURE TO FINANCIAL CUSTOMERS
Reverse repo transactions
Spar Nord's own commitments and key customers, etc.
Total financial customers
DKKm
9,475 6,253
669 544
10,144 6,797
2017
Figure 6.22
2016
CREDIT QUALITY2017
Public authorities
Agriculture, hunting and forestry
Fisheries
Industry and raw materials extraction
Utilities
Building and construction
Trade
Transport, hotels and restaurants
Information and communication
Financing and insurance
Real property
Other industries
Total business customers
Total retail customers
Total
%
0.0 0.0 0.0 0.0 0.0
2.3 0.1 0.3 2.4 5.1
0.0 0.0 0.0 0.2 0.2
0.4 0.1 0.6 3.4 4.5
0.1 0.0 0.1 2.5 2.7
0.4 0.0 0.2 3.5 4.1
0.4 0.1 0.2 5.4 6.1
0.5 0.1 0.2 2.5 3.3
0.0 0.0 0.0 0.3 0.3
0.4 0.0 0.1 20.6 21.1
1.1 0.2 0.3 7.8 9.4
0.3 0.0 0.3 4.3 4.9
5.8 0.6 2.3 52.9 61.6
1.6 0.1 2.1 34.6 38.3
7.4 0.7 4.4 87.5 100.0
ExposureCredit quality category
2b2c 2a/31
Figure 6.21 shows developments in the volume of repossessed leas-ing equipment, which remains at a very low level.
In the context of risks, it is important to note that leasing lending is always backed by security in the assets, either through charges or ownership.
6.4.6 FINANCIAL CUSTOMERS Spar Nord’s credit exposure to financial customers was DKK 10.1 bil-lion at end-2017, equivalent to 17% of Spar Nord’s total loans, ad-vances and guarantees. The exposure consists primarily of reverse repo transactions of DKK 9.4 billion and own liabilities, etc.
Figure 6.22 shows Spar Nord’s credit exposure to financial customers.
6.5 CREDIT QUALITY Figure 6.23 shows a breakdown of Spar Nord’s customers by the credit quality categories used by the Danish FSA. Categories 2a and 3 comprise low-risk customers, categories 2c and 2b comprise heightened-risk customers while customers in financial difficulty are placed in category 1 (OEI).
In a June 2017 report on the Bank, the Danish FSA noted that the Spar Nord’s credit quality is higher than those of its peers and more on a level with that for group 1 institutions.
6.6 COLLATERAL An important component of Spar Nord’s management of credit risks is to reduce the risk attaching to individual exposures by accept-ing collateral, such as mortgages and charges over physical as-sets, securities and guarantees, etc. Mortgages and charges on real property, securities and vehicles make up the most common type of collateral. Mortgages on property are by far the most important collateral type provided to Spar Nord. Mortgages on real property consist mainly of mortgages on private housing.
An increase of DKK 3.2 billion in reverse repo transactions in 2017 reduced the average unsecured share by 2.0 percentage points.
Figures 6.26 and 6.27 show that the total unsecured share at end-2017 was 34.9%. Net of reverse loans, the total unsecured share at end-2017 amounted to 41.5%. At end-2016, the unsecured share without reverse lending was 42.0%.

29Spar Nord · Risk Report · 2017
The property value under mortgages broken down by property type is calculated at DKK 24.7 billion, while only DKK 15.0 billion is recorded as security on properties in the figure below. This is because the for-mer amount represents the amount mortgaged to Spar Nord and is recorded as collateral received, while the latter amount is the share actually used for calculating collateral regarding a specific expo-sure. Some exposures are smaller than the collateral value, and col-lateral has also been provided by customers who do not currently have any facilities.
6.7 LOAN IMPAIRMENT CHARGES Based on the provisions of IAS 39, Spar Nord has defined an array of risk events that are considered objective evidence of impairment. Some risk events are automatically recorded in Spar Nord’s systems, while others are registered manually by customer advisers and credit staff members.
All significant loans and advances and credit-flagged exposures are evaluated individually. Credit-flagged loan exposures of less than DKK 250,000 are automatically reviewed using an algorithm based on the customer’s financial key figures and Spar Nord’s rating systems. All loans and advances that have not been impaired on an individual basis are assigned to groups having uniform credit risk exposure. If the review discloses objective evidence of impairment, an impairment loss is recognised. Impairment is calculated as the difference between the expected loan loss at the time of establish-ment and the present value of expected future losses on the loan. An exposure need not be in default before impairment is recognised and approval procedures regarding any new extension of credit are tightened.
Impairment losses are calculated individually as concerns all cus-tomers suffering from financial imbalances (objective evidence of impairment (OEI)). The expected cash flow is calculated, comprising conservatively assessed values and realisable costs for any assets that might have to be sold to cover the outstanding debt
In 2017, Spar Nord recorded a decline in credit exposure to custom-ers with individual impairment of DKK 1,086 million.
At end-2017, the impaired claims represented 5.2% of total credit ex-posure compared with 7.6% in 2016.
In 2017, the total impairment account/discount account fell by DKK 364 million. This development breaks down into an increase of DKK 32.5 million on retail customers and a DKK 396.7 million decline on business customers.
Collective impairment losses are recognised when objective indica-tions show that expected future losses exceed the anticipated loss when the loan was granted. Accordingly, in addition to objective indications for a group, collective impairment losses are basically recognised when customers are transferred to groups with a higher credit risk exposure.
Credit risk
UNSECURED SHARE OF EXPOSURE
<10
10-50
50-75
>75
Average unsecured share of credit exposure
2016
47.8 43.5
18.9 20.9
8.8 9.4
24.4 26.2
34.9 37.3
2017
Figure 6.26
%
UNSECURED SHARE OF CREDIT EXPOSURE
Public authorities
Agriculture, hunting and forestry
Fisheries
Industry and raw materials extraction
Utilities
Construction and engineering
Trade
Transport, hotels and restaurants
Information and communication
Financing and insurance
Real property
Other industries
Total business customers
Total retail customers
Total
9 98.8 37 99.6
873 28.2 1,142 33.6
32 28.8 46 43.3
819 30.6 913 34.4
499 30.4 536 30.7
647 26.3 711 36.9
1,586 43.0 1,848 47.9
431 22.4 488 29.2
94 46.8 93 47.4
2,214 17.4 1,780 19.7
2,390 41.9 2,444 40.3
1,338 45.3 1,193 45.0
10,932 29.4 11,231 33.7
10,150 43.9 9,519 42.6
21,082 34.9 20,750 37.3
Figure 6.27
%DKKm%DKKm2017 2016
20162017
CREDIT RISK MITIGATION BY VIRTUE OF COLLATERAL
Real property
Custody accounts/securities
Guarantees/sureties
Vehicles
Cash
Other collateral
Other collateral, total
Spec. secured trans. (mortgage credit inst. guarantees)
Total collateral, excluding Spar Nord Leasing
Collateral accepted, Spar Nord Leasing
Total
14,970 14,246
10,823 7,319
494 487
656 656
441 508
4,449 4,093
31,833 27,308
5,077 5,927
36,910 33,235
2,333 1,675
39,243 34,910
Figure 6.28
DKKm
IMPAIRED CLAIMS
Insolvent liquidation and bankruptcy
Debt collection and restructuring, etc.
Other financial difficulty
Total individual impairments
Collective impairments, Spar Nord
Impairment account and discount on commitments taken over
Individuallyvalue-adjusted
38 32
100 44
2,991 1,288
3,130 1,365
251
1,616
Exposure2017DKKm
Insolvent liquidation and bankruptcy
Debt collection and restructuring, etc.
Other financial difficulty
Total individual impairments
Collective impairments, Spar Nord
Impairment account and discount on commitments taken over
Individuallyvalue-adjusted
Exposure2016DKKm
199 142
189 126
3,827 1,589
4,216 1,857
124
1,980
Figure 6.29

30 Spar Nord · Risk Report · 2017 Credit risk
Total collective impairment losses of DKK 251 million break down into losses of DKK 91 million on retail customers and DKK 160 million on business customers, of which DKK 91 million is attributable to agri-cultural customers.
The impact on Spar Nord’s profits from impairment amounted to an income of DKK 38 million in 2017, equal to 0.1% of total loans, advanc-es and guarantees.
The impact on profits breaks down into an expense of DKK 75 mil-lion attributable to retail customers, equal to a profit impact ratio of 0.3%. Agricultural customers represented an income of DKK 38 million in 2017. An additional income of DKK 75 million was recorded on other business customers in 2017.
Spar Nord’s rating systems constitute the primary source of the breakdown into groups and the recognition of OEI by group. Expo-sures with suspended interest accrual are subjected to particularly critical review, and if a loss is considered unavoidable, the loan is written off, either partly or fully. No interest accrues on the part of the exposure that has been written down for impairment.
Exposures for which interest accrual has been suspended fell from DKK 443 million at end-2016 to DKK 341 million at end-2017.
ForbearanceA loan facility is defined as being subject to forbearance if the con-ditions regarding interest payments and/or repayments have been relaxed on account of the borrower’s financial difficulty or if the loan has been refinanced on more lenient terms.
At Spar Nord, forbearance is considered objective evidence of im-pairment (OEI), and the terms are deemed to have been relaxed if business customers with OEI are granted an interest rate of less than 3%. For retail customers, the terms are considered to have been re-laxed if they are granted an interest rate of less than 3.5%. Moreover, repayment terms are considered to be relaxed for retail customers if the term to maturity exceeds 20 years. The terms of a home loan will typically have been fixed prior to any OEI and will therefore not be included for the purpose of identifying facilities with relaxed terms, regardless of whether the above criteria have been met.
Figure 6.32
DEVELOPMENT IN PROFIT IMPACT FROM LOSSES AND IMPAIRMENT OF LOANS, ADVANCES AND GUARANTEES - BY INDUSTRY
DKKmPublic authoritiesAgriculture and forestryFisheriesIndustry and raw materials extractionUtilitiesBuilding and constructionTradeTransport, hotels and restaurantsInformation and communicationFinancing and insuranceReal propertyOther business customersTotal business customersTotal retail customersTotal
2017 2016 0 0 -38 121 -2 0 31 -6 -1 15 14 9 -5 12 46 18 0 3 -90 12 -76 43 8 20 -113 247 75 -5 -38 242
0 0 0 1,280 695 226 4 2 0 103 44 4 52 25 1 197 56 13 205 77 12 158 61 3 17 7 0 225 110 7 994 325 51 171 87 19 3,409 1,490 336 807 367 85 4,216 1,857 421
Figure 6.30
2016
Public authoritiesAgriculture, hunting and forestryFisheriesIndustry and raw materials extractionUtilitiesConstruction and engineeringTradeTransport, hotels and restaurantsInformation and communicationFinancing and insuranceReal propertyOther industriesTotal business customersTotal retail customersTotal
Recognisedlosses
Impairmentaccount/
discount *)In default and
impaired DKKm
MOVEMENTS IN LOSSES AND INDIVIDUAL IMPAIRMENT2017
Public authoritiesAgriculture, hunting and forestryFisheriesIndustry and raw materials extractionUtilitiesConstruction and engineeringTradeTransport, hotels and restaurantsInformation and communicationFinancing and insuranceReal propertyOther industriesTotal business customersTotal retail customersTotal
0 0 0 919 431 218 0 0 0 144 60 19 48 16 10 223 61 12 150 46 32 131 52 19 9 2 5 169 83 24 508 198 72 150 86 21 2,449 1,034 432 681 331 102 3,130 1,365 534
Recognisedlosses
Impairmentaccount/
discount *)In default and
impaired DKKm
Public authoritiesAgriculture, hunting and forestryFisheries Industry and raw materials extractionUtilitiesConstruction and engineeringTradeTransport, hotels and restaurantsInformation and communicationFinancing and insuranceReal propertyOther industriesTotal business customersTotal retail customersTotal
2017DKKm
Impairmentaccount/discount
Discount onexposurestaken over
Impairmentaccount
0 0 0 522 0 522 0 0 0 65 0 65 17 0 17 64 0 64 51 0 51 95 0 95 2 0 2 85 0 85 203 0 203 89 0 89 1,194 0 1,194 422 0 422 1,616 0 1,616
PublicauthoritiesAgriculture, hunting and forestryFisheriesIndustry and raw materials extractionUtilitiesConstruction and engineeringTradeTransport, hotels and restaurantsInformation and communicationFinancing and insuranceReal propertyOther industriesTotal business customersTotal retail customersTotal
2016DKKm
Impairmentaccount/discount
Discount onexposurestaken over
Impairmentaccount
Figure 6.31
0 0 0 755 0 755 2 0 2 51 5 46 28 0 28 59 3 57 84 1 83 64 1 63 7 1 6 113 16 98 336 58 278 91 9 83 1,591 93 1,498 389 11 379 1,980 103 1,877
*) Spar Nord’s total value adjustments should be supplemented by collective impairments in the amount of DKK 251 million (2016: DKK 124 million) including portfolio impairment of small retail customers with exposures of less than DKK 250,000 and SparXpres.
IMPAIRMENT ACCOUNT

31Spar Nord · Risk Report · 2017
2017 2016 0 0 -38 121 -2 0 31 -6 -1 15 14 9 -5 12 46 18 0 3 -90 12 -76 43 8 20 -113 247 75 -5 -38 242
Non-performing loans (NPL) are defined as the category of ex-posures that are in default (in terms of the Basel criteria) and/or impaired, i.e. exposures towards customers whose balances have been written off, written down or are past due by 90 days.
Figure 6.33 shows a breakdown of loans and advances for which the terms have been relaxed.
At end-2017, the impairment and discount account amounted to DKK 1,616 million, equal to 2.7% of loans, advances and guarantees, compared with 3.6% at end-2016.
6.7.1 AGRICULTURE Loans, advances and guarantees to agricultural customers amounted to DKK 3.1 billion, equal to 5% of Spar Nord’s total loans, advances and guarantees. Of this amount, leasing loans account for DKK 0.5 billion and guarantees for DKK 0.2 billion.
Figure 6.36 shows developments in credit quality among agricultural customers at Spar Nord’s local banks in the period from 2015 to 2017.
As appears from figures 6.36 and 6.37, the average credit quality im-proved during 2017. The improvement in 2017 is primarily attributable to a reduction in exposures in “Default”.
The impact on profits from impairment of agricultural loans amount-ed to an income of DKK 38 million in 2017 compared with an expense of DKK 121 million in 2016.
Settlement prices in Danish agriculture in 2017 were generally at a high and satisfactory level. However, many agricultural customers continue to suffer from a high debt burden and are finding it difficult to reduce their debts.
Spar Nord’s total impairment of agricultural loans amounted to DKK 522 million at end-2017, equal to 16.9% of Spar Nord’s total loans, advances and guarantees to the industry.
The figures below show Spar Nord’s agricultural loans and impair-ment related to agricultural exposures, broken down by production lines.
The total exposure to milk and pig producers was reduced by DKK 0.4 billion in 2017, equal to a reduction of 23%.
Credit risk
LOANS AND ADVANCES SUBJECT TO FORBEARANCE 2017 DKKm
Non-Performing
Performing
Total
Business Agricultural Retail customers customers customers Total
555 565 215 1,335
48 5 11 63
603 570 226 1,398
2016 DKKm
Non-Performing
Performing
Total
Business Agricultural Retail customers customers customers Total
591 617 187 1,394
85 5 22 112
676 622 209 1,507
Figure 6.33
DKKm
Figure 6.34
2016
533 424
-441 -313
93 111
457 650
-349 -291
-44 -65
64 294
-167 -116
-11 289
4 3
-7 292
-7 292
31 50
-38 242
2017
LOSSES AND IMPAIRMENT ON LOANS, ADVANCES AND GUARANTEES
Losses, incl. losses covered by provisions/impairment and impairment losses taken over
Covered by provisions/impairment and impairment losses taken overLosses not covered by provisions/impairment charges
New provisions/impairment charges, excluding sector-targeted solutions
Reversal of provisions/impairment charges
Interest accrued on loans subject to impairment charges
Net provisions/impairment charges
Recoveries of prior losses
Losses and impairment charges for the year
Other losses
Total losses and impairment charges for the year
Total amount recognised in the income statement
Adjustment of discount on exposures taken over from SparbankImpact on income statement
MOVEMENTS IN LOSSES AND VALUE ADJUSTMENTS AND NON-PERFORMING LOANS
Gross loans, advances and guarantees, end of year
Total losses and impairment charges for the year
– in % of loans, advances and guarantees
Impairment account and discount on commitments taken over
– in % of loans, advances and guarantees
Contractual non-performing loans, year-end
– in % of loans, advances and guarantees
Impairment account and discount on exposures taken over in % of contractual non-performing loans
2016
60,324 55,660
-38 242
0 0
1,616 1,980
3 4
341 443
1 1
474 447
2017 DKKm
Figure 6.35
AVERAGE RISK LEVEL – AGRICULTURE*)
Average risk group
2017
6.6 6.3 5.6
20162015
Figure 6.37*) Exposure after impairment
Figure 6.36
AGRICULTURAL EXPOSURE BY RATING GROUP *)
(%)
40
30
20
10
0
2015 2016 2017
Notrated
Default98765431 2
*) Excl. leasing

32 Spar Nord · Risk Report · 2017
DKKm/%
0 0 0.0 0.0
570 1,453 34.2 58.9
175 73 10.5 3.0
272 126 16.3 5.1
420 527 25.2 21.4
231 285 13.8 11.6
0 0 0.0 0.0
1,668 2,464 100.0 100.0
DUE FROM CREDIT INSTITUTIONSBY PRODUCT TYPE
Certificates of deposit
Reverse repo transactions
Deposits and unlisted bonds
Current accounts
CSA accounts, etc.
Commercial foreign business
Market value, derivatives
Due from credit institutions
201620162017
Figure 6.40
2017
Spar Nord pursues the principle that if agricultural customers fail to deliver positive returns at the breakeven prices fixed by Spar Nord of DKK 9.50/kg (without supplementary payment) for pork, and DKK 2.20/kg for milk (without supplementary payment), this is defined as OEI. Breakeven prices are calculated based on financing at a 4% average interest rate for all the interest-bearing debt, regardless of the concrete financing chosen. If realistic budgets cannot be drawn up on these conditions, the exposure will be subjected to an impair-ment calculation.
Spar Nord anticipates that in 2018 the settlement prices for milk will fall slightly compared with the average prices for 2017, and that pork settlement prices will decline noticeably relative to realised average prices in 2017.
Spar Nord’s calculation of collateral values of agricultural properties is in accordance with the Danish FSA’s most recent guidelines, which means that the land values in Spar Nord’s market area range be-tween DKK 125,000 and DKK 160,000 per hectare.
Farm buildings are assessed in relation to their age, condition, etc. Farm buildings are measured at their fair value, which means that obsolete buildings are measured at DKK 0.
Other agricultural assets such as livestock, stocks, equipment, etc. are recognised at 80% of their carrying amount.
A 5% haircut is applied to all of the above-mentioned values.
6.8 CREDIT RISK EXPOSURE TO FINANCIAL COUNTERPARTIES As part of its trading of securities, foreign currency and derivative instruments and its payment services, etc., the Bank will experience credit risk exposure to financial counterparties.
Spar Nord’s Management allocates lines for credit risk exposure to financial counterparties, based on the specific counterparty’s risk profile, rating, amount of exposure and solvency. The risks and lines of financial instruments are monitored on a day-to-day basis.
A major source of financial credit risk is Spar Nord’s balances with credit institutions. The credit risk relates to international credit insti-tutions, for which Spar Nord has provided cash collateral for finan-cial transactions, or Danish credit institutions with which Spar Nord’s Trading, Financial Markets & the International Division has customer relations.
87.8% of Spar Nord’s receivables from credit institutions concerns banks with an A rating or higher. Of the total receivables from credit institutions in the amount of DKK 1.7 billion, 34.2% is attributable to exposures with an AAA rating. Balances with unrated credit institu-tions are attributable primarily to Danish credit institutions.
DKKm/%
570 1,453 34.2 58.9
242 192 14.5 7.8
652 512 39.1 20.8
117 204 7.0 8.3
1 2 0.1 0.1
85 102 5.1 4.1
0 0 0.0 0.0
1,668 2,464 100.0 100.0
DUE FROM CREDIT INSTITUTIONSBY RATING
AAA
AA
A
BBB
BB
Not rated
Unallocated
Due from credit institutions
201620162017
Figure 6.41
2017
Cattle producers
Pig producers
Plant cultivation
Mink farmers
Leasing
Miscellaneous
Total
AGRICULTURAL EXPOSURES BY PRODUCTION LINE
Shareimpaired
875 45 526 60.1
595 7 264 44.3
738 4 57 7.7
106 0 41 38.6
452 0 24 5.2
330 3 8 2.4
3,096 59 919 29.7
Of whichimpaired
Non-performing
loans
Loans and advances and
guarantees
2017 2016
AGRICULTURAL IMPAIRMENT BY PRODUCTION LINE
Cattle producers
Pig producers
Plant cultivation
Mink farmers
Leasing
Miscellaneous
Total
DKKm/%
Percent-age
impaired
326 88 -26 37.3 62.0
145 88 -23 24.4 54.9
27 30 9 3.7 47.6
15 2 1 13.9 36.0
4 1 2 0.9 17.7
5 9 -1 1.6 68.8
522 218 -38 16.9 56.8
Impairment ratio of
exposure
Impairmentfor the
yearImpairment
account Impaired
Percent-age
impaired
425 84 103 38.2 62.1
248 120 0 31.0 59.9
50 18 7 7.3 48.7
16 1 11 14.0 38.6
2 3 0 0.5 11.7
14 0 2 4.4 68.4
755 226 121 22.2 59.0
Impairment ratio of
exposure
Impairmentfor the
yearImpairment
account Impaired
Shareimpaired
1,113 60 685 61.6
799 60 414 51.8
685 8 103 15.0
114 3 41 36.3
361 1 17 4.6
322 0 21 6.4
3,394 132 1,280 37.7
Of whichimpaired
Non-performing
loans
Loans and advances and
guaranteesDKKm
2017 2016
Figure 6.39
Figure 6.38

33Spar Nord · Risk Report · 2017Credit risk
COUNTERPARTY RISK
Derivatives with positive market value
Netting
Exposure after netting
Collateral received
Exposure after netting and collateral
2016DKKm
1,030 1,284
215 250
815 1,034
44 13
771 1,021
2017
Figure 6.42
8 7
34 45
274 279
832 951
790 1,159
41 47
4 6
18 17
2,001 2,513
DKKm
COUNTERPARTY RISK – REGULATORY EXPOSURE
Public-sector entities
Exposures secured by mortgages on real property
Retail customers
Business customers
Institutions
Regional and local authorities
High-risk exposures
Exposures in arrears or overdrawn
Total
20162017
Figure 6.43
6.9 COUNTERPARTY RISK Counterparty risk is the risk of loss because a financial counterpar-ty or an institutional customer defaults on its obligations under a financial contract. In addition, settlement risks may arise when fi-nancial contracts are concluded and settled, as principals in dif-ferent currencies are not necessarily exchanged at the same time or securities are not received simultaneously with the appropriate payment.
Utilisation of lines with respect to financial contracts is calculated on a gross basis as weighted principals of all transactions concluded, to which is added the sum of all positive market values, whereas negative market values are not offset. The size of principal weight-ing for the individual financial transactions is calculated based on the volatility of interest rates and currencies, and due consideration is paid to the outstanding term to maturity of the specific financial transaction.
Spar Nord’s business procedures specify the maximum term to ma-turity for the individual financial transactions, and compliance is fol-lowed up on a daily basis, as is compliance with the granted lines.
In connection with lines granting and registration of lines, a check is performed to verify whether the registered lines accord with the au-thorisation details. Additionally, Spar Nord has a controller depart-ment that conducts random sampling of compliance as concerns granting of lines, procedures and business procedures.
In regulatory terms, counterparty risk is calculated according to the market-value approach without netting. The difference between the value for accounting purposes and the regulatory value is at-tributable to the add-on of potential future credit exposure that is included in the regulatory calculation.
6.9.1 COUNTERPARTY RISK AGAINST CUSTOMERS Customers’ trading in financial instruments forms part of the author-isation of credit for the individual customer. The credit responsibility for such transactions is decentralised in accordance with the credit authorisation powers of the respective customer advisers, and the day-to-day follow-up on/monitoring of the granted lines is per-formed decentrally by the relevant customer advisers on an equal footing with the follow-up on/monitoring of other granted credits/ lines. The establishment procedures in connection with transactions are executed centrally.
6.9.2 COUNTERPARTY RISK AGAINST FINANCIAL AND INSTITUTIONAL CUSTOMERS Before lines are granted to financial counterparties and institution-al customers, a thorough credit assessment is made of the finan-cial counterparties/institutional customers based on the financial statements of the individual credit institution/institutional customer. As concerns foreign and major Danish credit institutions, attention is also paid to how the credit institutions are rated by international rating bureaus, such as Standard & Poor’s, Fitch or Moody’s.
6.9.3 FRAMEWORK AND COLLATERAL AGREEMENTS To mitigate counterparty risk, Spar Nord concludes framework, net-ting and collateral agreements to the extent possible. As concerns small Danish credit institutions, such agreements will be based on the framework agreement prepared by Finance Denmark for forex and securities transactions, and when assessed to be necessary, also a collateral agreement, according to which it is agreed that if the net market value of the concluded financial contracts exceeds an individually fixed maximum for each credit institution, then ap-propriate collateral must be furnished, in most cases by way of cash deposits.
For foreign and large Danish credit institutions and institutional cus-tomers, netting and framework agreements will be based on the international ISDA Master Agreements, often with associated Credit Support Annexes (CSA), according to which it is agreed that if the net market value of the concluded financial contracts exceeds an individually fixed maximum for each agreement, then collateral will have to be exchanged, most frequently by way of cash deposits in EUR or DKK.
In addition, Global Master Repurchase Agreements (GMRA) and Global Master Securities Lending Agreements (GMSLA) will be con-cluded to secure reverse repo transactions and stock lending trans-actions.
Both Danish and foreign collateral agreements are followed up on a daily basis, as are exchanges of collateral in step with fluctuations in the market values of the transactions concluded. In addition, to the widest extent possible, Spar Nord settles transactions via CLS, VP or Euroclear, which serves to minimise settlement risks as much as possible.
Spar Nord is an indirect member of London Clearing House via se-lected clearing brokers, and expects to regularly clear a large share of the clearing-approved transactions.
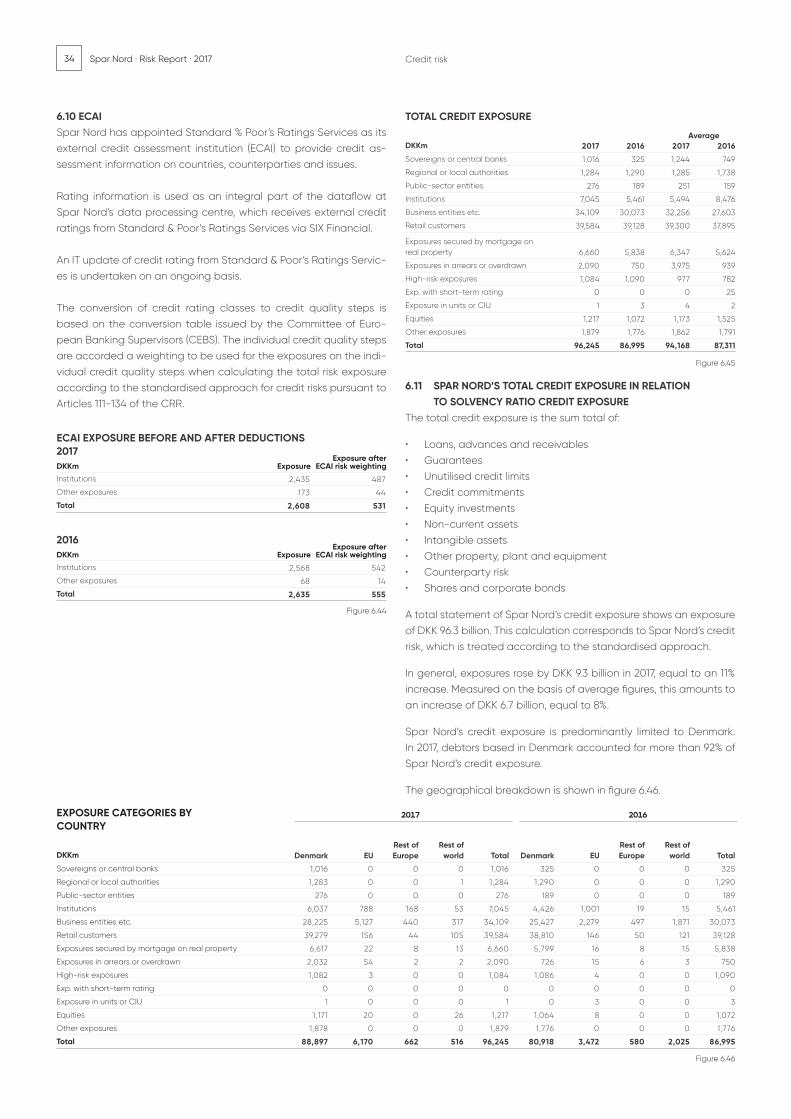
34 Spar Nord · Risk Report · 2017 Credit risk
6.10 ECAISpar Nord has appointed Standard % Poor’s Ratings Services as its external credit assessment institution (ECAI) to provide credit as-sessment information on countries, counterparties and issues.
Rating information is used as an integral part of the dataflow at Spar Nord’s data processing centre, which receives external credit ratings from Standard & Poor’s Ratings Services via SIX Financial.
An IT update of credit rating from Standard & Poor’s Ratings Servic-es is undertaken on an ongoing basis.
The conversion of credit rating classes to credit quality steps is based on the conversion table issued by the Committee of Euro-pean Banking Supervisors (CEBS). The individual credit quality steps are accorded a weighting to be used for the exposures on the indi-vidual credit quality steps when calculating the total risk exposure according to the standardised approach for credit risks pursuant to Articles 111-134 of the CRR.
ECAI EXPOSURE BEFORE AND AFTER DEDUCTIONS 2017
Institutions
Other exposures
Total
Exposure afterECAI risk weightingDKKm
2,435 487
173 44
2,608 531
Exposure
DKKm
2016
Institutions
Other exposures
Total
Exposure afterECAI risk weighting
2,568 542
68 14
2,635 555
Exposure
Figure 6.44
6.11 SPAR NORD’S TOTAL CREDIT EXPOSURE IN RELATION TO SOLVENCY RATIO CREDIT EXPOSUREThe total credit exposure is the sum total of:
• Loans, advances and receivables• Guarantees• Unutilised credit limits• Credit commitments• Equity investments• Non-current assets• Intangible assets• Other property, plant and equipment• Counterparty risk• Shares and corporate bonds
A total statement of Spar Nord’s credit exposure shows an exposure of DKK 96.3 billion. This calculation corresponds to Spar Nord’s credit risk, which is treated according to the standardised approach.
In general, exposures rose by DKK 9.3 billion in 2017, equal to an 11% increase. Measured on the basis of average figures, this amounts to an increase of DKK 6.7 billion, equal to 8%. Spar Nord’s credit exposure is predominantly limited to Denmark. In 2017, debtors based in Denmark accounted for more than 92% of Spar Nord’s credit exposure.
The geographical breakdown is shown in figure 6.46.
TOTAL CREDIT EXPOSURE
DKKm
Sovereigns or central banks
Regional or local authorities
Public-sector entities
Institutions
Business entities etc.
Retail customers
Exposures secured by mortgage on real property
Exposures in arrears or overdrawn
High-risk exposures
Exp. with short-term rating
Exposure in units or CIU
Equities
Other exposures
Total
2017 2016 2017 2016
1,016 325 1,244 749
1,284 1,290 1,285 1,738
276 189 251 159
7,045 5,461 5,494 8,476
34,109 30,073 32,256 27,603
39,584 39,128 39,300 37,895
6,660 5,838 6,347 5,624
2,090 750 3,975 939
1,084 1,090 977 782
0 0 0 25
1 3 4 2
1,217 1,072 1,173 1,525
1,879 1,776 1,862 1,791
96,245 86,995 94,168 87,311
Figure 6.45
Average
EXPOSURE CATEGORIES BY COUNTRY
DKKm
Sovereigns or central banks
Regional or local authorities
Public-sector entities
Institutions
Business entities etc.
Retail customers
Exposures secured by mortgage on real property
Exposures in arrears or overdrawn
High-risk exposures
Exp. with short-term rating
Exposure in units or CIU
Equities
Other exposures
Total
Rest of Rest of Rest of Rest of Denmark EU Europe world Total Denmark EU Europe world Total
1,016 0 0 0 1,016 325 0 0 0 325
1,283 0 0 1 1,284 1,290 0 0 0 1,290
276 0 0 0 276 189 0 0 0 189
6,037 788 168 53 7,045 4,426 1,001 19 15 5,461
28,225 5,127 440 317 34,109 25,427 2,279 497 1,871 30,073
39,279 156 44 105 39,584 38,810 146 50 121 39,128
6,617 22 8 13 6,660 5,799 16 8 15 5,838
2,032 54 2 2 2,090 726 15 6 3 750
1,082 3 0 0 1,084 1,086 4 0 0 1,090
0 0 0 0 0 0 0 0 0 0
1 0 0 0 1 0 3 0 0 3
1,171 20 0 26 1,217 1,064 8 0 0 1,072
1,878 0 0 0 1,879 1,776 0 0 0 1,776
88,897 6,170 662 516 96,245 80,918 3,472 580 2,025 86,995
Figure 6.46
2017 2016

35Spar Nord · Risk Report · 2017
EXPOSURES TO SMES
Business entities etc.
Retail customers
Exposures secured by mortgage on real property
Total
DKKm 18,152 17,921
14,447 14,478
1,237 1,333
33,836 33,732
2017 2016
Figure 6.48
CREDIT RISK MITIGATION BY VIRTUE OF COLLATERAL
Institutions
Business entities etc.
Retail customers
Exposures secured by mortgage on real property
Exposures in arrears or overdrawn
High-risk exposures
Total
DKKm
0 1,095 0 2,732
106 10,374 108 6,911
37 458 60 547
0 12 4 12
19 16 14 18
0 6 0 71
163 11,960 187 10,290
Figure 6.47
Other financial
collateral
Exp.covered byguarantee
2017Other
financialcollateral
Exp.covered byguarantee
2016
Credit risk
A major share of Spar Nord’s business exposure is towards small and medium-sized enterprises (SMEs). At end-2017, the exposure to SMEs represented 35% of the total exposure.

36 Spar Nord · Risk Report · 2017 Market risk
7. Market risk
In 2017, the net interest rate risk was mainly positive, av-eraging around DKK 65 million, which is about DKK 20 million lower than in 2016.
Compared with end-2016, the net interest rate risk was reduced by DKK 26 million to DKK 55 million at end-2017. The change was driven by a decline in net interest rate risk in the trading book of DKK 44 million and a DKK 18 million increase in net interest rate risk outside the trad-ing book.
The net portfolio of bonds was reduced by DKK 3.4 bil-lion in 2017. In 2017, the portfolio of mortgage bonds was reduced by DKK 3.0 billion, while bonds issued by finan-cial issuers were reduced by DKK 0.4 billion.
In addition, there was a decrease in the foreign ex-change risk in 2017 compared with 2016.
Shares outside the trading book were increased by DKK 69 million to DKK 1,533 million in 2017, primarily driven by value appreciation in shares in credit and financing in-stitutions. The shares held in the trading book increased by DKK 10 million to DKK 223 million in 2017.
Developments in 2017
Market risk is an umbrella heading for the risk of loss caused by changes in the value of a portfolio of finan-cial instruments due to fluctuations in exchange rates or prices in financial markets.
Market risk breaks down into:
• Interest rate risk• Foreign exchange risk• Equity risk• Commodity risk• Option risk• Own properties
Spar Nord deals and takes positions in products that involve a number of market-based risks. Most of Spar Nord’s activities regarding trading and position-tak-ing comprise relatively simple products, of which inter-est-based products are the most frequently traded. Spar Nord also deals and takes positions in shares and foreign exchange instruments, whereas trading in com-modities is very limited.
Definition of market risk
TOTAL RISK EXPOSURE AMOUNT
DKK 3.2 bn2016: DKK 3.5 bn
INTEREST RATE RISK
DKK 55 million2016: DKK 81 million
FOREIGN EXCHANGE RISK
DKK 0.8 million2016: DKK 2.2 million
EQUITY RISK
DKK 1,756 million2016: DKK 1,677 million

37Spar Nord · Risk Report · 2017
risk in foreign currencies into Danish kroner and offsets the neg-ative interest rate risk against the positive one to calculate the net interest rate risk.
7.3.1 INTEREST RATE RISK DEVELOPMENTS Figure 7.1 shows the total net interest rate risk that Spar Nord will encounter if interest rates rise by 1 percentage point. This implies a parallel shift of all yield curves.
Spar Nord’s net interest rate risk was mainly positive in 2017 as Spar Nord was exposed to a drop in market interest rates.
Figure 7.2 shows the percentage impact of Spar Nord’s interest rate risk on shareholders’ equity on a 1 percentage point upward shift in the yield curve. A positive interest rate risk will have a negative impact on equity.
In addition, Spar Nord calculates the interest rate risk relative to duration and exchange rates. This shows the risk of changes for a given time interval on the yield curve. Figure 7.3 shows the interest rate risk broken down on the individual time intervals, given a 1 percentage point increase in interest rates.
Market risk
(DKKM)
150
100
50
0
-50
31.12.15
DEVELOPMENTS IN NET INTEREST RATE RISK
31.12.17
Figure 7.1
31.12.16
7.1 MARKET RISK POLICY The market risk policy determines Spar Nord’s overall risk profile for market risk, as well as the overall organisational delegation of responsibilities in the market risk area with a view to profitably supporting Spar Nord’s business model.
The policy identifies and sets limits for the various types of mar-ket risk, setting out specific limits for how much risk Spar Nord is prepared to assume. The principal market risks for Spar Nord are the credit spread risk on the Bank’s bond portfolio and the Bank’s interest rate risk, followed by equity risk in and outside the trading book and, lastly, very limited foreign exchange, option and commodity risks. The policy establishes the methods to be used in calculating the various risk targets.
7.2 Management, monitoring and reporting For its management of market risks, the Bank has established a three-tier instruction hierarchy. At the first tier, the Board of Directors issues the definition of the limits for Spar Nord, which are delegated to the Executive Board. At the second tier, the Executive Board delegates limits to the other entities of Spar Nord, with Trading, Financial Markets & the International Divi-sion being the distinctly largest entity. At the third and last tier, the executives of Trading, Financial Markets & the International Division are granted the limits within which they may operate.The Finance & Accounts Department is responsible for estimat-ing, monitoring, controlling and reporting market risks. Market risk is calculated for the following purposes:
• Daily follow-up on individual business units, both intraday and end of day• Regular reporting to the Executive Board and the Board of Directors• Reporting of regulatory capital
Market risks are controlled and monitored through an integrat-ed risk management system, with day-to-day follow-up action taken with respect to all market risk categories for all units sub-ject to instructions, and any failure to comply with instructions is reported upstream in the hierarchy.
7.3 INTEREST RATE RISK The interest rate risk is the risk of loss due to interest rate fluctua-tions. Most of Spar Nord’s interest rate risks derive from activities involving ordinary banking transactions, such as deposits and lending, as well as trading and position-taking in fixed income products. Most of these activities incorporate fixed income products such as interest swaps, bonds, futures and standard interest rate options.
Spar Nord’s interest-rate risk both within and outside the trad-ing book is calculated on the basis of duration and agreed cash flow. For managing its portfolio of callable Danish mort-gage bonds, Spar Nord uses model-based key risk indicators that provide for the inherent option component. As concerns interest rate options, the above-mentioned key indicators are supplemented by the most important risk factors expressing sensitivity of the option premium on changes in the underlying parameters.
The interest rate risk is assessed on a daily basis, and decisions are made in light of expectations for macroeconomic develop-ments and cyclical trends. Spar Nord converts the interest rate
IMPACT OF INTEREST RATE RISK ON SHAREHOLDERS’ EQUITY
0,5
0,0
-0,5
-1,0
-1,5
-2,0
-2,5
31.12.15 31.12.17
Figure 7.2
31.12.16
(%)
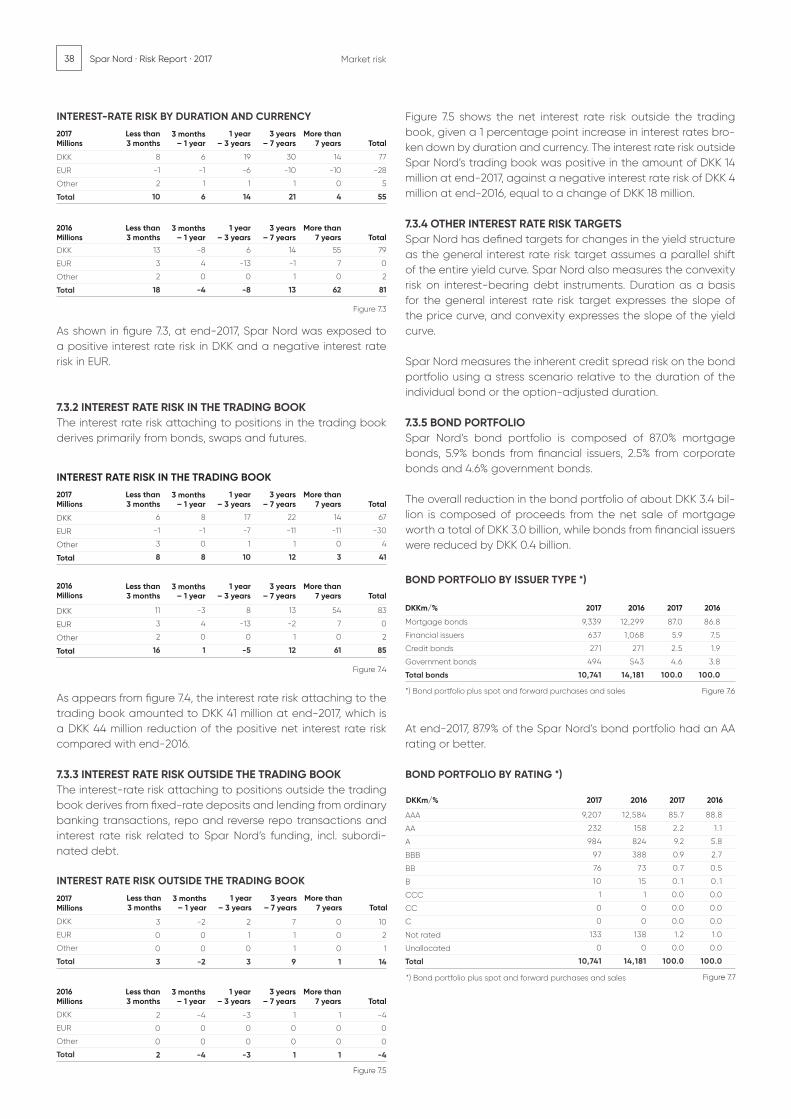
38 Spar Nord · Risk Report · 2017
As shown in figure 7.3, at end-2017, Spar Nord was exposed to a positive interest rate risk in DKK and a negative interest rate risk in EUR.
7.3.2 INTEREST RATE RISK IN THE TRADING BOOK The interest rate risk attaching to positions in the trading book derives primarily from bonds, swaps and futures.
As appears from figure 7.4, the interest rate risk attaching to the trading book amounted to DKK 41 million at end-2017, which is a DKK 44 million reduction of the positive net interest rate risk compared with end-2016.
7.3.3 INTEREST RATE RISK OUTSIDE THE TRADING BOOK The interest-rate risk attaching to positions outside the trading book derives from fixed-rate deposits and lending from ordinary banking transactions, repo and reverse repo transactions and interest rate risk related to Spar Nord’s funding, incl. subordi-nated debt.
Figure 7.5 shows the net interest rate risk outside the trading book, given a 1 percentage point increase in interest rates bro-ken down by duration and currency. The interest rate risk outside Spar Nord’s trading book was positive in the amount of DKK 14 million at end-2017, against a negative interest rate risk of DKK 4 million at end-2016, equal to a change of DKK 18 million.
7.3.4 OTHER INTEREST RATE RISK TARGETSSpar Nord has defined targets for changes in the yield structure as the general interest rate risk target assumes a parallel shift of the entire yield curve. Spar Nord also measures the convexity risk on interest-bearing debt instruments. Duration as a basis for the general interest rate risk target expresses the slope of the price curve, and convexity expresses the slope of the yield curve.
Spar Nord measures the inherent credit spread risk on the bond portfolio using a stress scenario relative to the duration of the individual bond or the option-adjusted duration.
7.3.5 BOND PORTFOLIO Spar Nord’s bond portfolio is composed of 87.0% mortgage bonds, 5.9% bonds from financial issuers, 2.5% from corporate bonds and 4.6% government bonds.
The overall reduction in the bond portfolio of about DKK 3.4 bil-lion is composed of proceeds from the net sale of mortgage worth a total of DKK 3.0 billion, while bonds from financial issuers were reduced by DKK 0.4 billion.
At end-2017, 87.9% of the Spar Nord’s bond portfolio had an AA rating or better.
Market risk
13 -8 6 14 55 79
3 4 -13 -1 7 0
2 0 0 1 0 2
18 -4 -8 13 62 81
Figure 7.3
2017Millions
2016Millions
8 6 19 30 14 77
-1 -1 -6 -10 -10 -28
2 1 1 1 0 5
10 6 14 21 4 55
Total1 year
– 3 years3 years
– 7 yearsMore than
7 years3 months
– 1 yearLess than3 months
Total1 year
– 3 years3 years
– 7 yearsMore than
7 years3 months
– 1 yearLess than3 months
INTEREST-RATE RISK BY DURATION AND CURRENCY
DKK
EUR
Other
Total
DKK
EUR
Other
Total
INTEREST RATE RISK IN THE TRADING BOOK
DKK
EUR
Other
Total
DKK
EUR
Other
Total
Figure 7.4
2017Millions
2016Millions
6 8 17 22 14 67
-1 -1 -7 -11 -11 -30
3 0 1 1 0 4
8 8 10 12 3 41
11 -3 8 13 54 83
3 4 -13 -2 7 0
2 0 0 1 0 2
16 1 -5 12 61 85
Total1 year
– 3 years3 years
– 7 yearsMore than
7 years3 months
– 1 yearLess than3 months
Total1 year
– 3 years3 years
– 7 yearsMore than
7 years3 months
– 1 yearLess than3 months
Total1 year
– 3 years3 years
– 7 yearsMore than
7 years3 months
– 1 yearLess than3 months
INTEREST RATE RISK OUTSIDE THE TRADING BOOK
DKK
EUR
Other
Total
DKK
EUR
Other
Total
Figure 7.5
2017Millions
3 -2 2 7 0 10
0 0 1 1 0 2
0 0 0 1 0 1
3 -2 3 9 1 14
2 -4 -3 1 1 -4
0 0 0 0 0 0
0 0 0 0 0 0
2 -4 -3 1 1 -4
2016Millions Total
1 year– 3 years
3 years– 7 years
More than7 years
3 months– 1 year
Less than3 months
DKKm/%
9,339 12,299 87.0 86.8
637 1,068 5.9 7.5
271 271 2.5 1.9
494 543 4.6 3.8
10,741 14,181 100.0 100.0
BOND PORTFOLIO BY ISSUER TYPE *)
Mortgage bonds
Financial issuers
Credit bonds
Government bonds
Total bonds
*) Bond portfolio plus spot and forward purchases and sales
201620162017
Figure 7.6
2017
9,207 12,584 85.7 88.8
232 158 2.2 1.1
984 824 9.2 5.8
97 388 0.9 2.7
76 73 0.7 0.5
10 15 0 . 1 0 . 1
1 1 0.0 0.0
0 0 0.0 0.0
0 0 0.0 0.0
133 138 1.2 1.0
0 0 0.0 0.0
10,741 14,181 100.0 100.0
BOND PORTFOLIO BY RATING *)
AAA
AA
A
BBB
BB
B
CCC
CC
C
Not rated
Unallocated
Total
2016DKKm/% 20162017
Figure 7.7
2017
*) Bond portfolio plus spot and forward purchases and sales
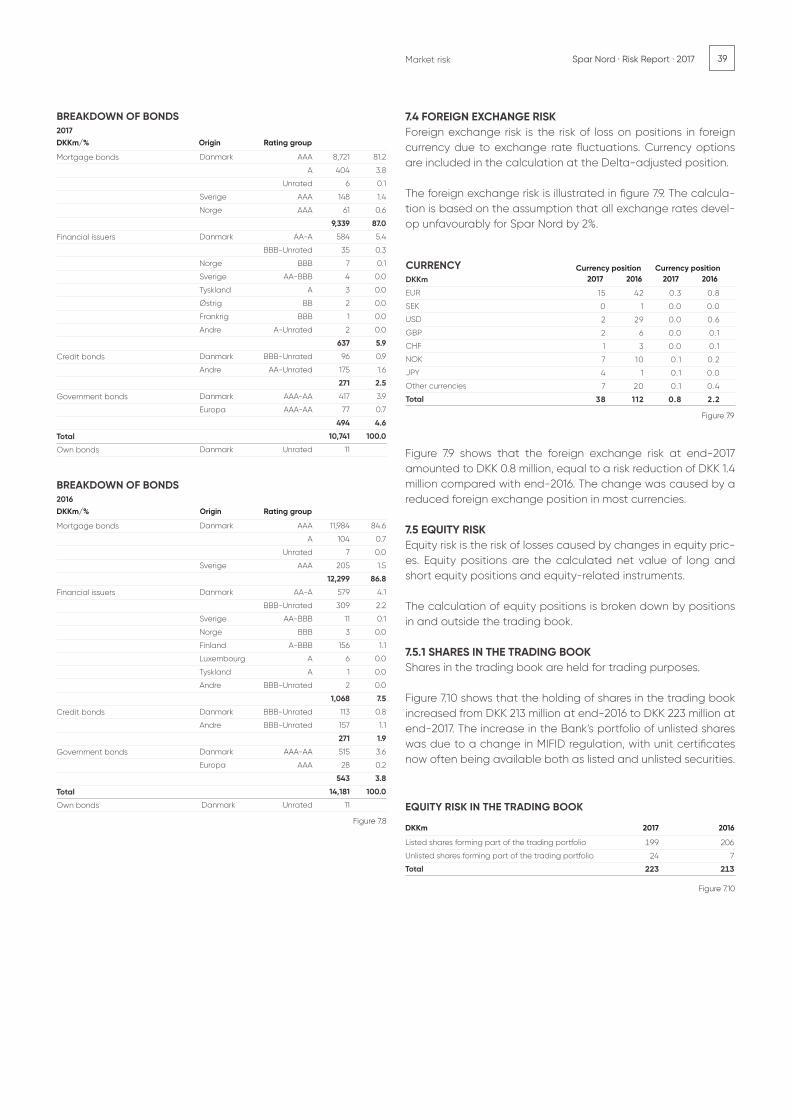
39Spar Nord · Risk Report · 2017Market risk
7.4 FOREIGN EXCHANGE RISK Foreign exchange risk is the risk of loss on positions in foreign currency due to exchange rate fluctuations. Currency options are included in the calculation at the Delta-adjusted position.
The foreign exchange risk is illustrated in figure 7.9. The calcula-tion is based on the assumption that all exchange rates devel-op unfavourably for Spar Nord by 2%.
Figure 7.9 shows that the foreign exchange risk at end-2017 amounted to DKK 0.8 million, equal to a risk reduction of DKK 1.4 million compared with end-2016. The change was caused by a reduced foreign exchange position in most currencies.
7.5 EQUITY RISK Equity risk is the risk of losses caused by changes in equity pric-es. Equity positions are the calculated net value of long and short equity positions and equity-related instruments.
The calculation of equity positions is broken down by positions in and outside the trading book.
7.5.1 SHARES IN THE TRADING BOOK Shares in the trading book are held for trading purposes.
Figure 7.10 shows that the holding of shares in the trading book increased from DKK 213 million at end-2016 to DKK 223 million at end-2017. The increase in the Bank’s portfolio of unlisted shares was due to a change in MIFID regulation, with unit certificates now often being available both as listed and unlisted securities.
Danmark AAA 8,721 81.2
A 404 3.8
Unrated 6 0.1
Sverige AAA 148 1.4
Norge AAA 61 0.6
9,339 87.0
Danmark AA-A 584 5.4
BBB-Unrated 35 0.3
Norge BBB 7 0.1
Sverige AA-BBB 4 0.0
Tyskland A 3 0.0
Østrig BB 2 0.0
Frankrig BBB 1 0.0
Andre A-Unrated 2 0.0
637 5.9
Danmark BBB-Unrated 96 0.9
Andre AA-Unrated 175 1.6
271 2.5
Danmark AAA-AA 417 3.9
Europa AAA-AA 77 0.7
494 4.6
10,741 100.0
Danmark Unrated 11
BREAKDOWN OF BONDS2017
Mortgage bonds
Financial issuers
Credit bonds
Government bonds
Total
Own bonds
DKKm/% Rating groupOrigin
BREAKDOWN OF BONDS2016
Mortgage bonds
Financial issuers
Credit bonds
Government bonds
Total
Own bonds
DKKm/%
Danmark AAA 11,984 84.6
A 104 0.7
Unrated 7 0.0
Sverige AAA 205 1.5
12,299 86.8
Danmark AA-A 579 4.1
BBB-Unrated 309 2.2
Sverige AA-BBB 11 0.1
Norge BBB 3 0.0
Finland A-BBB 156 1.1
Luxembourg A 6 0.0
Tyskland A 1 0.0
Andre BBB-Unrated 2 0.0
1,068 7.5
Danmark BBB-Unrated 113 0.8
Andre BBB-Unrated 157 1.1
271 1.9
Danmark AAA-AA 515 3.6
Europa AAA 28 0.2
543 3.8
14,181 100.0
Danmark Unrated 11
Rating groupOrigin
Figure 7.8
Figure 7.9
CURRENCYDKKm
EUR
SEK
USD
GBP
CHF
NOK
JPY
Other currencies
Total
15 42 0.3 0.8
0 1 0.0 0.0
2 29 0.0 0.6
2 6 0.0 0.1
1 3 0.0 0.1
7 10 0.1 0.2
4 1 0.1 0.0
7 20 0.1 0.4
38 112 0.8 2.2
2016201720162017Currency position Currency position
199 206
24 7
223 213
2017
EQUITY RISK IN THE TRADING BOOK
Listed shares forming part of the trading portfolio
Unlisted shares forming part of the trading portfolio
Total
Figure 7.10
DKKm 2016
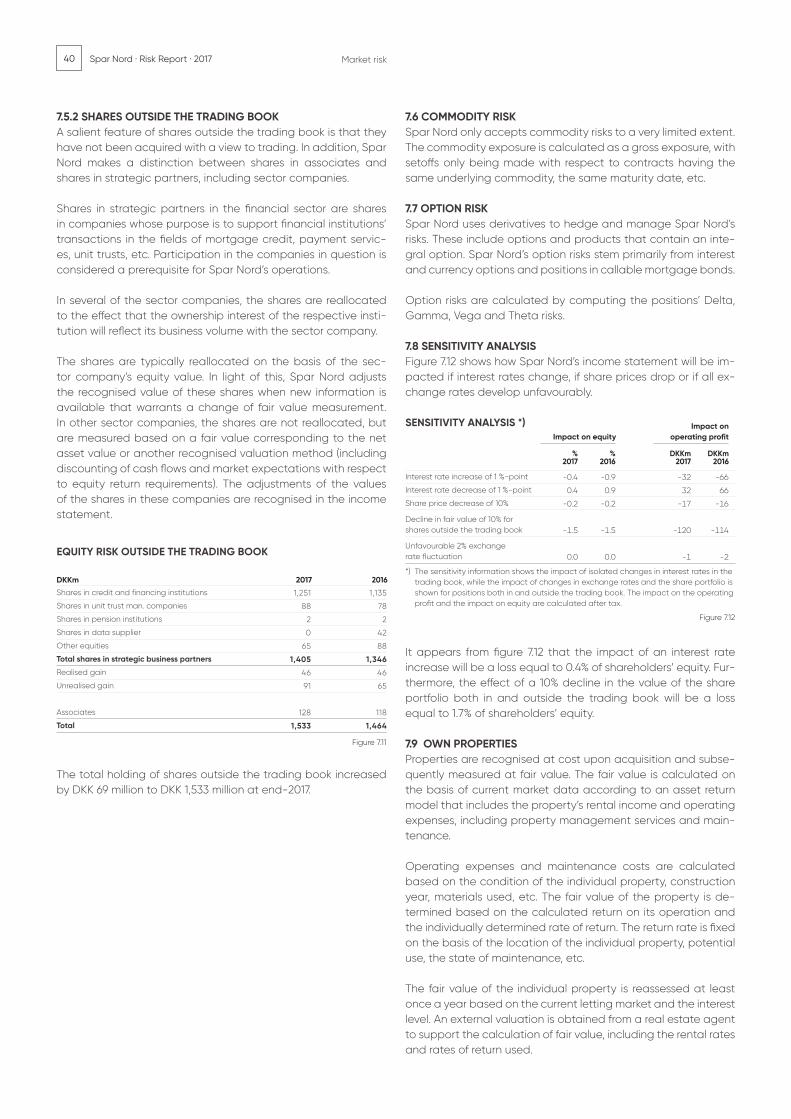
40 Spar Nord · Risk Report · 2017 Market risk
7.5.2 SHARES OUTSIDE THE TRADING BOOK A salient feature of shares outside the trading book is that they have not been acquired with a view to trading. In addition, Spar Nord makes a distinction between shares in associates and shares in strategic partners, including sector companies.
Shares in strategic partners in the financial sector are shares in companies whose purpose is to support financial institutions’ transactions in the fields of mortgage credit, payment servic-es, unit trusts, etc. Participation in the companies in question is considered a prerequisite for Spar Nord’s operations.
In several of the sector companies, the shares are reallocated to the effect that the ownership interest of the respective insti-tution will reflect its business volume with the sector company.
The shares are typically reallocated on the basis of the sec-tor company’s equity value. In light of this, Spar Nord adjusts the recognised value of these shares when new information is available that warrants a change of fair value measurement. In other sector companies, the shares are not reallocated, but are measured based on a fair value corresponding to the net asset value or another recognised valuation method (including discounting of cash flows and market expectations with respect to equity return requirements). The adjustments of the values of the shares in these companies are recognised in the income statement.
The total holding of shares outside the trading book increased by DKK 69 million to DKK 1,533 million at end-2017.
7.6 COMMODITY RISK Spar Nord only accepts commodity risks to a very limited extent. The commodity exposure is calculated as a gross exposure, with setoffs only being made with respect to contracts having the same underlying commodity, the same maturity date, etc.
7.7 OPTION RISK Spar Nord uses derivatives to hedge and manage Spar Nord’s risks. These include options and products that contain an inte-gral option. Spar Nord’s option risks stem primarily from interest and currency options and positions in callable mortgage bonds.
Option risks are calculated by computing the positions’ Delta, Gamma, Vega and Theta risks.
7.8 SENSITIVITY ANALYSIS Figure 7.12 shows how Spar Nord’s income statement will be im-pacted if interest rates change, if share prices drop or if all ex-change rates develop unfavourably.
It appears from figure 7.12 that the impact of an interest rate increase will be a loss equal to 0.4% of shareholders’ equity. Fur-thermore, the effect of a 10% decline in the value of the share portfolio both in and outside the trading book will be a loss equal to 1.7% of shareholders’ equity.
7.9 OWN PROPERTIES Properties are recognised at cost upon acquisition and subse-quently measured at fair value. The fair value is calculated on the basis of current market data according to an asset return model that includes the property’s rental income and operating expenses, including property management services and main-tenance.
Operating expenses and maintenance costs are calculated based on the condition of the individual property, construction year, materials used, etc. The fair value of the property is de-termined based on the calculated return on its operation and the individually determined rate of return. The return rate is fixed on the basis of the location of the individual property, potential use, the state of maintenance, etc.
The fair value of the individual property is reassessed at least once a year based on the current letting market and the interest level. An external valuation is obtained from a real estate agent to support the calculation of fair value, including the rental rates and rates of return used.
EQUITY RISK OUTSIDE THE TRADING BOOK
Shares in credit and financing institutions
Shares in unit trust man. companies
Shares in pension institutions
Shares in data supplier
Other equities
Total shares in strategic business partners
Realised gain
Unrealised gain
Associates
Total
2016
1,251 1,135
88 78
2 2
0 42
65 88
1,405 1,346
46 46
91 65
128 118
1,533 1,464
2017
Figure 7.11
DKKm
SENSITIVITY ANALYSIS *)
Interest rate increase of 1 %-point
Interest rate decrease of 1 %-point
Share price decrease of 10%
Decline in fair value of 10% for shares outside the trading book
Unfavourable 2% exchange rate fluctuation
Figure 7.12
-0.4 -0.9 -32 -66
0.4 0.9 32 66
-0.2 -0.2 -17 -16
-1.5 -1.5 -120 -114
0.0 0.0 -1 -2
Impact on operating profit
DKKm2016
DKKm2017
%2016
%2017
Impact on equity
*) The sensitivity information shows the impact of isolated changes in interest rates in the trading book, while the impact of changes in exchange rates and the share portfolio is shown for positions both in and outside the trading book. The impact on the operating profit and the impact on equity are calculated after tax.
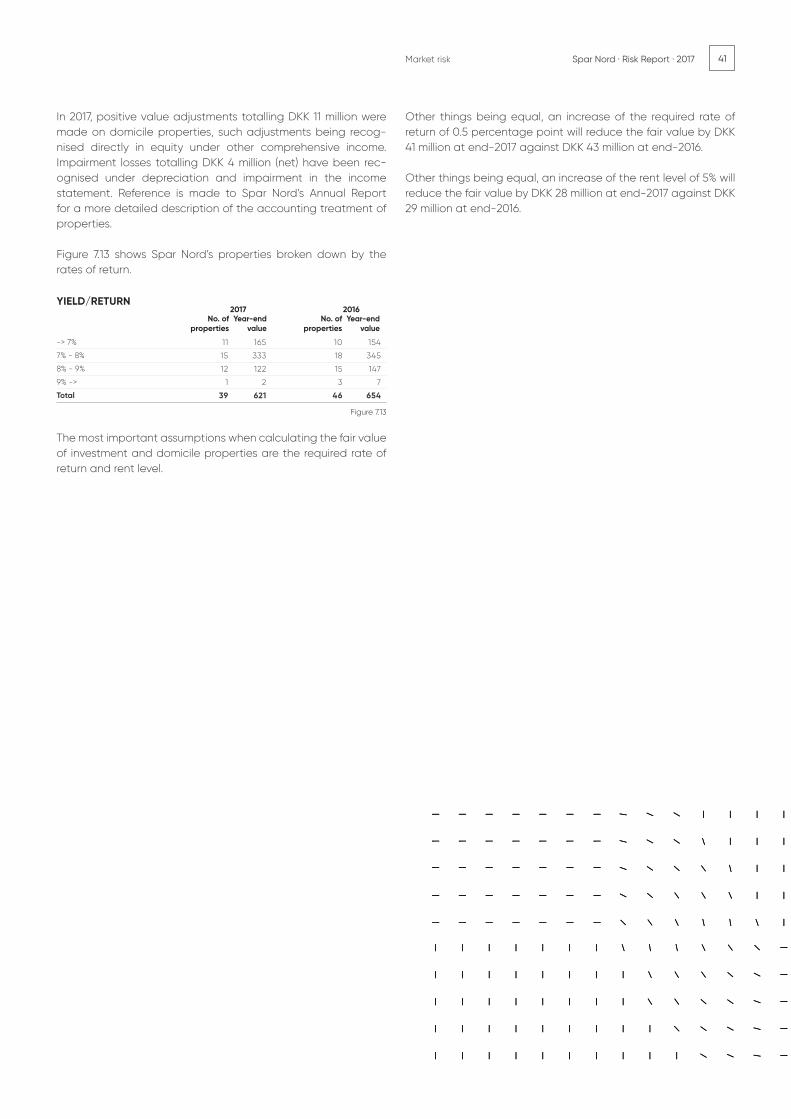
41Spar Nord · Risk Report · 2017Market risk
In 2017, positive value adjustments totalling DKK 11 million were made on domicile properties, such adjustments being recog-nised directly in equity under other comprehensive income. Impairment losses totalling DKK 4 million (net) have been rec-ognised under depreciation and impairment in the income statement. Reference is made to Spar Nord’s Annual Report for a more detailed description of the accounting treatment of properties.
Figure 7.13 shows Spar Nord’s properties broken down by the rates of return.
The most important assumptions when calculating the fair value of investment and domicile properties are the required rate of return and rent level.
Other things being equal, an increase of the required rate of return of 0.5 percentage point will reduce the fair value by DKK 41 million at end-2017 against DKK 43 million at end-2016.
Other things being equal, an increase of the rent level of 5% will reduce the fair value by DKK 28 million at end-2017 against DKK 29 million at end-2016.
YIELD/RETURN
-> 7%
7% - 8%
8% - 9%
9% ->
Total
11 165 10 154
15 333 18 345
12 122 15 147
1 2 3 7
39 621 46 654
Figure 7.13
Year-endvalue
No. ofproperties
Year-endvalue
No. ofproperties
2017 2016

42 Spar Nord · Risk Report · 2017
In 2017, the Bank focused on improving the level of compe-tencies and increasing awareness of new systems with a view to reducing operational risk.
In 2017, there was an overall decline in external fraud, although there was a substantial increase in card abuse. Developments in the world around us include increased digitalisation, and for Spar Nord this calls for enhanced focus on cyber crime and external fraud on Spar Nord’s self-service systems.
Operational risk
8. Operational risk
Operational risk is understood as the risk of loss that re-sults from inefficient or deficient internal procedures, from human or systemic errors or from external events, including legal risks.
Model risk, which is the risk of loss as a consequence of de-cisions based mainly on output from internal models and occurring due to errors in the development, implementa-tion or use of such models, is also defined as operational risk.
Operational risks are categorised on the basis of the seven event types defined by Basel III:
• employment practices and workplace safety • external fraud • business disruption and systems failures • internal fraud • clients, products and business practice • execution/delivery and process management • damage to physical assets
Definition of operational risk8.1 OPERATIONAL RISK POLICY Spar Nord’s Board of Directors has defined a policy for oper-ational risk, the aim of which is to provide an overview of Spar Nord’s operational risk and thus to minimise the number of errors and losses.
To ensure that operational risk is kept at an acceptable level, Spar Nord’s Board of Directors has defined the Group’s risk ap-petite. If risks are identified that exceed the defined risk appe-tite, scenario analyses are conducted and used to draw up risk mitigation proposals.
8.2 MANAGEMENT, MONITORING AND REPORTING All of Spar Nord’s activities are subject to operational risk. The Bank strives to limit the operational risk level as much as pos-sible.
Operational risk is managed across Spar Nord through a com-prehensive system of business procedures and control measures developed to ensure an optimum process environment. Efforts to minimise operational risks include separating the execution and the management of activities.
The Legal Department is charged with handling operational risk, a responsibility that includes the role as risk facilitator.
Responsibility for dealing with risks lies with the units responsible for the relevant business activities, the risk owners.
Throughout Spar Nord, events that result in a loss of more than DKK 10,000 are recorded and categorised, and identified risks are recorded on an ongoing basis, followed up by reporting to the Chief Risk Officer, the Executive Board and the Board of Di-rectors.
Scenarios are prepared for risks that may result in potential loss-es of more than DKK 10 million.
TOTAL RISK EXPOSURE AMOUNT
DKK 5.7 bn2016: DKK 5.7 bn
Developments in 2017

43Spar Nord · Risk Report · 2017Operational risk
20152011 2012 2013 2014
2.757
1.727
1.0302.159
1.676
483
2.239
1.677
562
2.572
1.849
723
2.663
1.800
863
Indesign udgave
0 0
Empl
oym
ent
cond
ition
s an
d w
orkp
lace
saf
ety
Exte
rnal
frau
d
Busi
ness
dis
rupt
ion
and
syst
em e
rrors
Inte
rnal
frau
d
Cus
tom
ers,
pro
duct
s an
d bu
sine
ss p
ract
ice
Ord
er e
xecu
tion/
deliv
ery
and
proc
ess
man
agem
ent
Dam
age
to
phys
ical
ass
ets
0
10
20
30
40
50
60
20162017
49 54 0 0 0 0 18 28 33 18 0 0
NO. OF OPERATIONAL LOSS EVENTS BROKEN DOWN BY RISK TYPE(%)
Figure 8.1
Reports are submitted quarterly to the Executive Board and the risk owners, and an annual risk report is submitted to the Board of Directors. Actual and potential loss events exceeding DKK 1 million are reported on an ongoing basis to both the Executive Board and the Board of Directors.
In the quarterly reports, the risk owners are informed about the loss events and new risks identified for the relevant business area during the period under review.
The systematic registration and categorisation of loss events provide an overview of sources of loss and the experience base which the Bank uses proactively in its management of opera-tional risks.
8.3 LOSS EVENTS Spar Nord’s operational loss events are primarily the result of external fraud; clients, products and business practices; and ex-ecution/delivery and process management.
External fraud accounted for 49% in 2017; clients, products and business practice represented 18%; and execution/delivery and process management made up 33% of the Bank’s loss events. The breakdown on these loss events was 54%, 28% and 18%, re-spectively, in 2016. The majority of loss events consist of events with a minor financial impact. External fraud includes events like card abuse and online banking fraud.
A breakdown of the Bank’s operational risk events by amounts in 2017 shows that external fraud accounted for 34%, clients prod-ucts and business practice 31% and order execution and pro-cess management 35%. The breakdown on these loss events in 2016 was 37%, 37% and 22%, respectively.
In view of the regular reporting provided to Spar Nord’s Board of Directors and Executive Board, Management believes that the Bank has satisfactory measures to counter the risk of being exposed to fraud.
8.4. IT SECURITY Information and information systems are vital to Spar Nord, and IT security is therefore essential to the Bank’s credibility and continued existence. An IT security function has been estab-lished, and Spar Nord’s Executive Board and Board of Directors regularly review the Bank’s IT security.
The work of the IT security function is based on a defined secu-rity and risk level aimed at ensuring that the Bank’s day-to-day business and activities are consistently supported by a secure and reliable IT infrastructure. The IT security function is respon-sible for complying with the adopted IT security level and the Spar Nord Group’s IT contingency plan. The IT security function contributes to ensuring and controlling that Spar Nord’s IT ac-tivities to the best possible extent are protected against inter-nal and external threats. The IT security function is thus charged with ensuring compliance with legislative and sector-specific requirements, Spar Nord’s own requirements and customer ex-pectations in terms of Spar Nord’s availability, confidentiality and integrity.
Spar Nord’s activity in the area of IT security is based on reg-ulatory requirements as well as considerations for day-to-day operations. All IT installations running at Spar Nord and its ser-vice providers must operate according to documented sched-ules and guidelines. The operation must be secure and stable, a requirement ensured through the highest possible degree of automation and ongoing capacity adjustments. IT services run by external service providers must be based on written agree-ments. The Bank’s IT security efforts include the preparation of contingency plans and recovery procedures and periodic test of such measures aimed to ensure continued operation at a satisfactory level in the case of extraordinary events.
20152011 2012 2013 2014
2.757
1.727
1.0302.159
1.676
483
2.239
1.677
562
2.572
1.849
723
2.663
1.800
863
Indesign udgave
0 0
05
10152025303540
34 37 0 0 0
4
31 37 35 22 0 0
20162017
Empl
oym
ent
cond
ition
s an
d w
orkp
lace
saf
ety
Exte
rnal
frau
d
Busi
ness
di
srup
tion
and
syst
em e
rrors
Inte
rnal
frau
d
Cus
tom
ers,
pro
duct
s an
d bu
sine
ss p
ract
ice
Ord
er e
xecu
tion/
deliv
ery
and
proc
ess
man
agem
ent
Dam
age
to
phys
ical
ass
ets
OPERATIONAL LOSS AMOUNTS BROKEN DOWN BY RISK TYPE(%)
Figure 8.2

44 Spar Nord · Risk Report · 2017 Operational risk
The IT security function also promotes in-house knowledge of IT security by regularly arranging awareness activities. In 2017, the function teamed up with the HR department to conduct a large-scale awareness event involving all of the Bank’s employ-ees and dedicated to general IT security and cyber security. In addition, the IT security function held an event for a represent-ative group of employees focusing on phishing.
8.5 COMPLIANCE RISK Operational risk also includes compliance risk, which is the risk associated with non-compliance with applicable legislation, market standards and ethical standards. The compliance func-tion is thus charged with assisting the Management in identi-fying compliance risks in order to mitigate the risk of sanctions being imposed on the Bank, a risk of loss of reputation or that the Bank or its customers suffer material financial losses. The Bank has defined a policy for the compliance function setting out the function’s objective, risk profile and strategy.
The Bank also retains a strong focus on anti-money-launder-ing (AML) measures, including the risk-mitigating measures that must be implemented to prevent the Bank from being used for money-laundering activities and terrorism financing purposes.
The Bank’s AML function is charged with ensuring that the Bank complies with the Danish Act on Measures to Prevent Money Laundering and Financing of Terrorism, EU Funds Transfer Reg-ulation and EU anti-terrorism regulations. The AML function is anchored in the Legal Department and reports directly to the Executive Board and Board of Directors.
In 2017, the AML function focused on optimising the Bank’s exist-ing KYC systems and processes, increased transaction monitor-ing, training of the Bank’s employees and registration of bene-ficial owners as a result of new requirements under the new act on anti-money laundering.
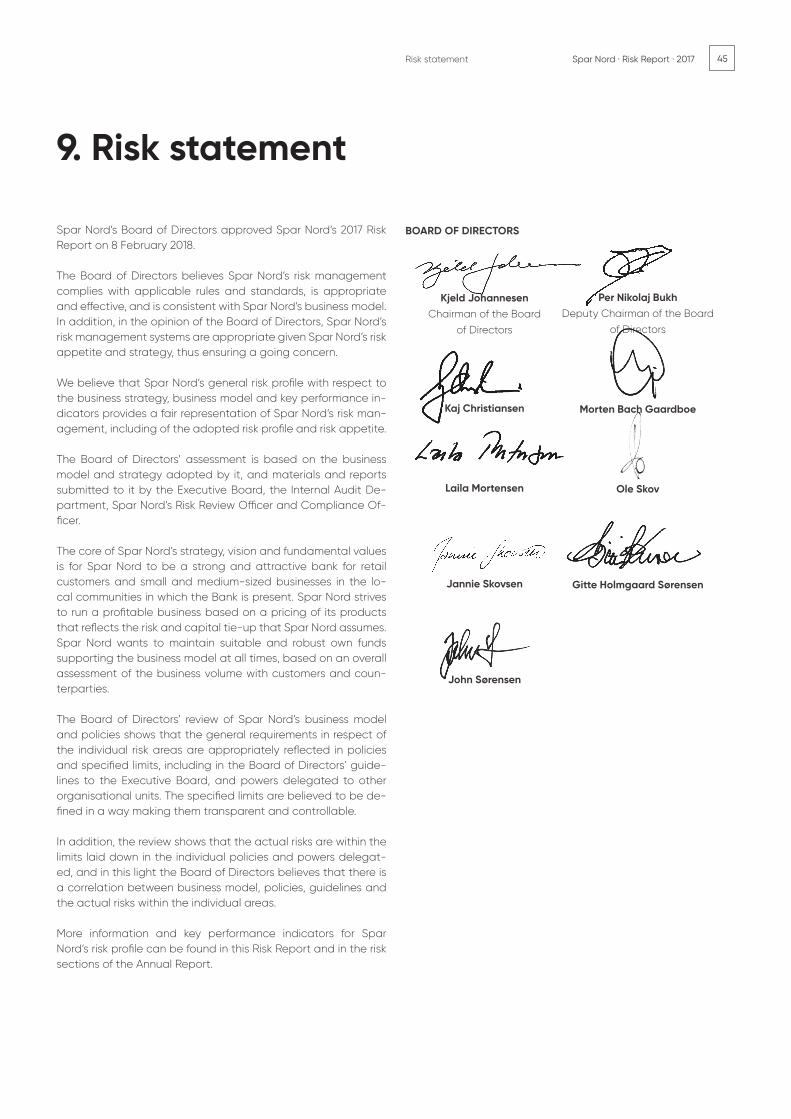
45Spar Nord · Risk Report · 2017
Spar Nord’s Board of Directors approved Spar Nord’s 2017 Risk Report on 8 February 2018.
The Board of Directors believes Spar Nord’s risk management complies with applicable rules and standards, is appropriate and effective, and is consistent with Spar Nord’s business model. In addition, in the opinion of the Board of Directors, Spar Nord’s risk management systems are appropriate given Spar Nord’s risk appetite and strategy, thus ensuring a going concern.
We believe that Spar Nord’s general risk profile with respect to the business strategy, business model and key performance in-dicators provides a fair representation of Spar Nord’s risk man-agement, including of the adopted risk profile and risk appetite.
The Board of Directors’ assessment is based on the business model and strategy adopted by it, and materials and reports submitted to it by the Executive Board, the Internal Audit De-partment, Spar Nord’s Risk Review Officer and Compliance Of-ficer.
The core of Spar Nord’s strategy, vision and fundamental values is for Spar Nord to be a strong and attractive bank for retail customers and small and medium-sized businesses in the lo-cal communities in which the Bank is present. Spar Nord strives to run a profitable business based on a pricing of its products that reflects the risk and capital tie-up that Spar Nord assumes. Spar Nord wants to maintain suitable and robust own funds supporting the business model at all times, based on an overall assessment of the business volume with customers and coun-terparties.
The Board of Directors’ review of Spar Nord’s business model and policies shows that the general requirements in respect of the individual risk areas are appropriately reflected in policies and specified limits, including in the Board of Directors’ guide-lines to the Executive Board, and powers delegated to other organisational units. The specified limits are believed to be de-fined in a way making them transparent and controllable.
In addition, the review shows that the actual risks are within the limits laid down in the individual policies and powers delegat-ed, and in this light the Board of Directors believes that there is a correlation between business model, policies, guidelines and the actual risks within the individual areas.
More information and key performance indicators for Spar Nord’s risk profile can be found in this Risk Report and in the risk sections of the Annual Report.
9. Risk statement
Risk statement
BOARD OF DIRECTORS
Kjeld JohannesenChairman of the Board
of Directors
Per Nikolaj BukhDeputy Chairman of the Board
of Directors
Morten Bach Gaardboe
Ole Skov
Gitte Holmgaard Sørensen
Kaj Christiansen
Laila Mortensen
Jannie Skovsen
John Sørensen
46 Spar Nord · Risk Report · 2017
10. Appendix
Appendix
A Spar Nord’s disclosure obligations 47
B Balance Sheet Reconciliation Methodology 48
C Capital Instruments 49
D Transitional own funds 51
E Institution-specific countercyclical capital buffer 2017 56
F CRR Leverage Ratio 57
G LCR disclosure 59
H Asset encumbrance 60
I Credit exposure 61

47Spar Nord · Risk Report · 2017
Subject Location of information
Risk and risk management Annual report 2017, pp. 23-24
https://www.sparnord.com/en/investor-relations/financial-communication/risk-reports/
Organisation and corporate governance Annual report 2017, pp. 25-30
https://www.sparnord.com/en/investor-relations/financial-communication/risk-reports/
Remuneration policy https://www.sparnord.com/investor-relations/organisation/governance/
Spar Nord’s disclosure obligationsAPPENDIX A
Appendix
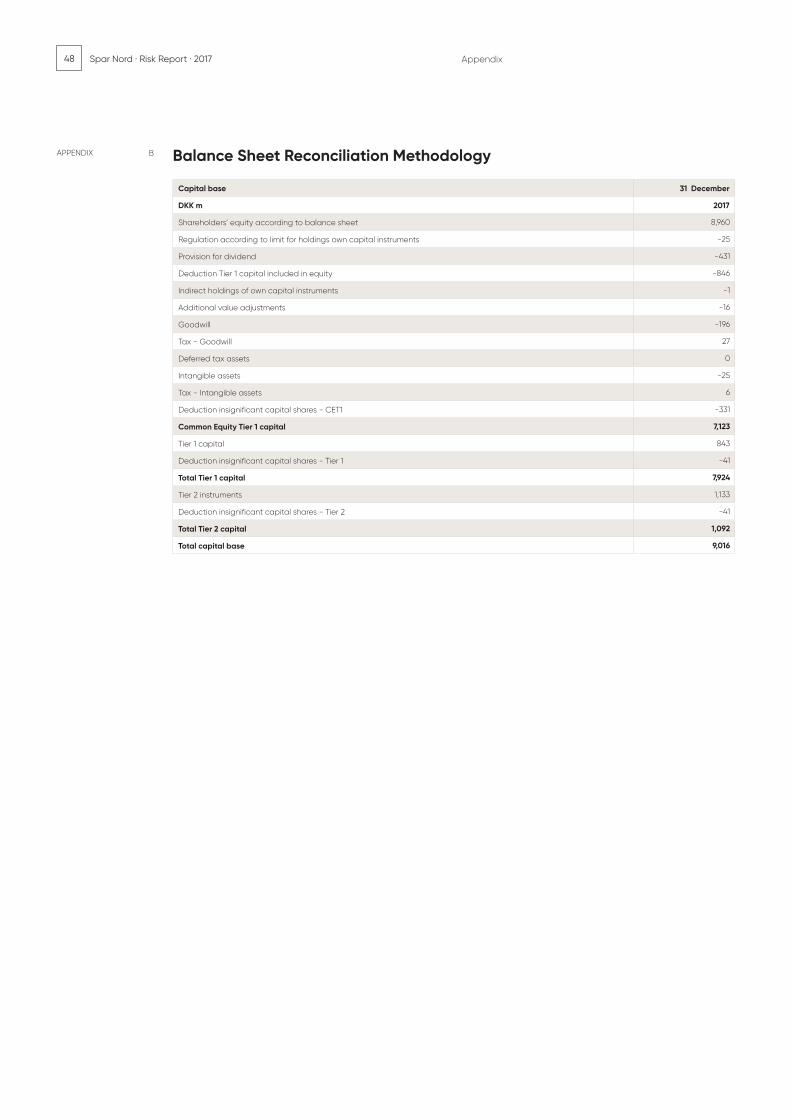
48 Spar Nord · Risk Report · 2017
Balance Sheet Reconciliation MethodologyAPPENDIX B
Capital base 31 December
DKK m 2017
Shareholders’ equity according to balance sheet
Regulation according to limit for holdings own capital instruments
Provision for dividend
Deduction Tier 1 capital included in equity
Indirect holdings of own capital instruments
Additional value adjustments
Goodwill
Tax - Goodwill
Deferred tax assets
Intangible assets
Tax - Intangible assets
Deduction insignificant capital shares - CET1
Common Equity Tier 1 capital
Tier 1 capital
Deduction insignificant capital shares - Tier 1
Total Tier 1 capital
Tier 2 instruments
Deduction insignificant capital shares - Tier 2
Total Tier 2 capital
Total capital base
Appendix
8,960
-25
-431
-846
-1
-16
-196
27
0
-25
6
-331
7,123
843
-41
7,924
1,133
-41
1,092
9,016

49Spar Nord · Risk Report · 2017
Capital instrumentsAPPENDIX C
Fortsættes næste side
Appendix
Capital instruments’ main features template (1)
1 Issuer Spar Nord Bank A/S Spar Nord Bank A/S Spar Nord Bank A/S Spar Nord Bank A/S
2 Unique identifier (eg CUSIP, ISIN or Bloomberg identifier for private placement
DK0030362512 DK0030330311 NO0010808033 DK0030386297
3 Governing law(s) of the instrument Danish Danish Danish Danish
Regulatory treatment
4 Transitional CRR rules Additional Tier 1 Tier 2 Tier 2 Additional Tier 1
5 Post-transitional CRR rules Additional Tier 1 Tier 2 Tier 2 Additional Tier 1
6 Eligible at solo/(sub-)consolidated/solo & (sub-)consolidated
Solo & Consolidated Solo & Consolidated Solo & Consolidated Solo & Consolidated
7 Instrument type (types to be specified by each jurisdiction)
Additional Tier 1 as pub-lished in Regulation (EU) No 575/2013 article 51, 52
Tier 2 as published in Regulation (EU) No 575/2013 article 63
Tier 2 as published in Regulation (EU) No 575/2013 article 63
Additional Tier 1 as pub-lished in Regulation (EU) No 575/2013 article 51, 52
8 Amount recognised in regulatory capital (curren-cy in million, as of most recent reporting date)
DKK 400m DKK 700m DKK 454m DKK 450m
9 Nominal amount of instrument DKK 400m DKK 700m SEK 600m DKK 450m
9a Issue price 100 per cent 100 per cent 100 per cent 100 per cent
9b Redemption price 100 per cent of Nominal amount
100 per cent of Nominal amount
100 per cent of Nominal amount
100 per cent of Nominal amount
10 Accounting classification Liability - amortised cost Liability - amortised cost Liability - amortised cost Liability - amortised cost
11 Original date of issuance 10/Jun/15 18/Dec/13 18/Oct/17 06/Dec/16
12 Perpeptual or dated Perpetual Dated Dated Perpetual
13 Original maturity date No maturity 18/Dec/23 18/Oct/27 No maturity
14 Issuer call subjet to prior supervisory approval Yes Yes Yes Yes
15 Optional call date, contingent call dates, and redemption amount
10-Jun-20 100 per cent of Nominal amount In addition Tax/Regulato-ry call
18-Dec-18 100 per cent of Nominal amount In addition Tax/Regula-tory call
18-Oct-22 100 per cent of Nominal amount In addition Tax/Regulato-ry call
6-Dec-21 100 per cent of Nominal amount In addition Tax/Regula-tory call
16 Subsequent call dates, if applicable 10-Jun and 10-Dec each year after first call date
18-Mar, 18-Jun, 18-Sep and 18-Dec each year after first call date
18-Jan, 18-Apr, 18-Jul and 18-Oct each year after first call date
6-Jun and 6-Dec each year after first call date
Coupons / dividends
17 Fixed or floating dividend/coupon Fixed to floating Floating Floating Fixed to floating
18 Coupon rate and any related index Fixed 6.052 per cent per annum, until first call date. Thereafter floating Cibor 6-month +5.40 per cent per annum
Floating Cibor 3-month + 3.90 per cent per annum
Floating Stibor 3-month + 2.50 per cent per annum
Fixed 5.5 per cent per annum, until first call date. Thereafter floating Cibor 6-month +5.166 per cent per annum
19 Existence of a dividend stopper No No No No
20a Fully discretionary, partially discretionary or mandatory (in terms of timing
Fully discretionary Mandatory Mandatory Fully discretionary
20b Fully discretionary, partially discretionary or mandatory (in terms of amount)
Fully discretionary Mandatory Mandatory Fully discretionary
21 Existence of step up or other incentive to redeem
No No No No
22 Noncumulative or cumulative Non cumulative Non cumulative Non cumulative Non cumulative
23 Convertible or non-convertible Non-convertible Non-convertible Non-convertible Non-convertible
24 If convertible, conversion trigger (s) N/A N/A N/A N/A
25 If convertible, fully or partially N/A N/A N/A N/A
26 If convertible, conversion rate N/A N/A N/A N/A
27 If convertible, mandatory or optional conversion N/A N/A N/A N/A
28 If convertible, specifiy instrument type convert-ible into
N/A N/A N/A N/A
29 If convertible, specifiy issuer of instrument it converts into
N/A N/A N/A N/A
30 Write-down features Yes Yes Yes Yes
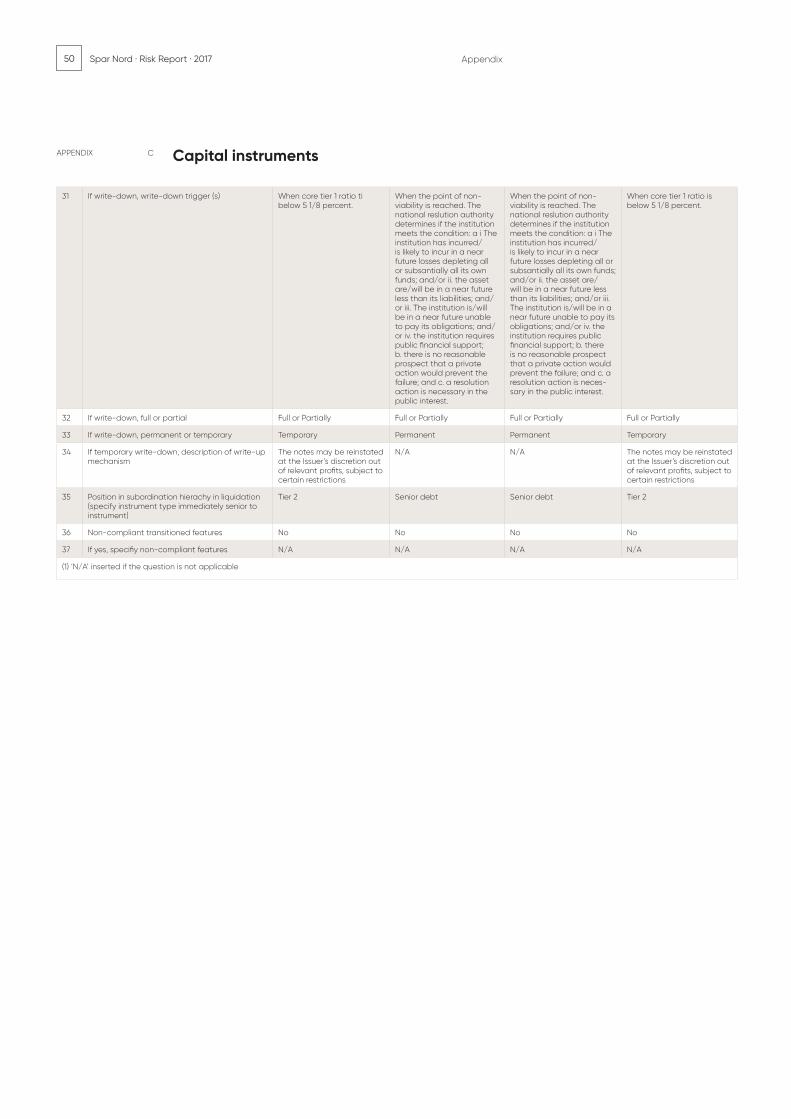
50 Spar Nord · Risk Report · 2017
APPENDIX C Capital instruments
Appendix
31 If write-down, write-down trigger (s) When core tier 1 ratio ti below 5 1/8 percent.
When the point of non-viability is reached. The national reslution authority determines if the institution meets the condition: a i The institution has incurred/is likely to incur in a near future losses depleting all or subsantially all its own funds; and/or ii. the asset are/will be in a near future less than its liabilities; and/or iii. The institution is/will be in a near future unable to pay its obligations; and/or iv. the institution requires public financial support; b. there is no reasonable prospect that a private action would prevent the failure; and c. a resolution action is necessary in the public interest.
When the point of non-viability is reached. The national reslution authority determines if the institution meets the condition: a i The institution has incurred/is likely to incur in a near future losses depleting all or subsantially all its own funds; and/or ii. the asset are/will be in a near future less than its liabilities; and/or iii. The institution is/will be in a near future unable to pay its obligations; and/or iv. the institution requires public financial support; b. there is no reasonable prospect that a private action would prevent the failure; and c. a resolution action is neces-sary in the public interest.
When core tier 1 ratio is below 5 1/8 percent.
32 If write-down, full or partial Full or Partially Full or Partially Full or Partially Full or Partially
33 If write-down, permanent or temporary Temporary Permanent Permanent Temporary
34 If temporary write-down, description of write-up mechanism
The notes may be reinstated at the Issuer’s discretion out of relevant profits, subject to certain restrictions
N/A N/A The notes may be reinstated at the Issuer’s discretion out of relevant profits, subject to certain restrictions
35 Position in subordination hierachy in liquidation (specify instrument type immediately senior to instrument)
Tier 2 Senior debt Senior debt Tier 2
36 Non-compliant transitioned features No No No No
37 If yes, specifiy non-compliant features N/A N/A N/A N/A
(1) ‘N/A’ inserted if the question is not applicable

51Spar Nord · Risk Report · 2017
APPENDIX D Transitional own funds
Common Equity Tier 1 capital: Instruments and reserves (1)
31 December 2017 DKKm
(B) REGULATION (EU) No 575/2013 ARTICLE REF-ERENCE
(C) AMOUNTS SUBJECT TO PRE-REGULATION (EU) No 575/2013 TREAT-MENT OR PRESCRIBED RESIDUAL AMOUNT OF REGULATION (EU) 575/2013
1 Capital instruments and the related share premium accounts
26 (1), 27, 28, 29, EBA list 26 (3)
of which: Instrument type 1 EBA list 26 (3)
of which: Instrument type 2 EBA list 26 (3)
of which: Instrument type 3 EBA list 26 (3)
2 Retained earnings 26 (1) (c)
3 Accumulated other comprehensive income (and any other reserves)
26 (1)
3a Funds for general banking risk 26 (1) (f)
4 Amount of qualifying items referred to in Article 484 (3) and the related share premium accounts subject to phase out from CET1
486 (2)
Public sector capital injections grandfa-thered until 1 January 2018
483 (2)
5 Minority interests (amount allowed in consolidated CET1)
84, 479, 480
5a Independently reviewed interim profits net of any foreseeable charge or dividend
26 (2)
6 Common Equity Tier 1 (CET1) capital before regulatory adjustments
Common Equity Tier 1 (CET1) capital: regulatory adjustments
7 Additional value adjustments (negative amount)
34, 105
8 Intangible assets (net of related tax liability) (negative amount)
36 (1) (b), 37, 472 (4)
9 Empty set in the EU
10 Deferred tax assets that rely on future profitability excluding those arising from temporary difference (net of related tax liability where the conditions in Article 38 (3) are met) (negative amount)
36 (1) (c), 38, 472 (5)
11 Fair value reserves related to gains or losses on cash flow hedges
33 (a)
12 Negative amounts resulting from the calculation of expected loss amounts
36 (1) (d), 40, 159, 472 (6)
13 Any increase in equity that results from securitised assets (negative amount)
32 (1)
14 Gains or losses on liabilities valued at fair value resulting from changes in own credit standing
33 (1) (b) (c)
15 Defined-benefit pension fund assets (negative amount)
36 (1) (e), 41, 472 (7)
16 Direct and indirect holdings by an insti-tution of own CET1 instruments (negative amount)
36 (1) (f), 42, 472 (8)
17 Direct, indirect and synthetic holdings of the CET1 instruments of financial sector entities where those entities have recip-rocal cross-holdings with the institution designed to inflate artificially the own funds of the institution (negative amount)
36 (1) (g), 44, 472 (9)
18 Direct, indirect and synthetic holdings of the CET1 instruments of financial sector entities where the institution does not have a significant investment in those entities (amount above 10% threshold and net of eligible short positions) (neg-ative amount)
36 (1) (h), 43, 45, 46, 49 (2) (3), 79, 472 (10)
Appendix
1,230
5,806
94
559
7,689
-16
-188
0
-31
-331

52 Spar Nord · Risk Report · 2017
APPENDIX D Transitional own funds
19 Direct, indirect and synthetic holdings of the CET1 instruments of financial sector entities where the institution has a signifi-cant investment in those entities (amount above 10% threshold and net of eligible short positions) (negative amount)
36 (1) (i), 43, 45, 47, 48 (1) (b), 49 (1) to (3), 79, 470, 472 (11)
20 Empty set in the EU
20a Exposure amount of the following items which qualify for a RW of 1250%, where the institution opts for the deduction alternative
36 (1) (k)
20b of which: qualifying holdings outside the financial sector (negative amount)
36 (1) (k) (i), 89 to 91
20c of which: securitisation positions (nega-tive amount)
36 (1) (k) (ii) 243 (1) (b) 244 (1) (b) 258
20d of which: free deliveries (negative amount)
36 (1) (k) (iii), 379 (3)
21 Deferred tax assets arising from tempo-rary difference (amount above 10 % threshold, net of related tax liability where the conditions in Article 38 (3) are met) (negative amount)
36 (1) (c), 38, 48 (1) (a), 470, 472 (5)
22 Amount exceeding the 15% threshold (negative amount)
48 (1)
23 of which: direct and indirect holdings by the institution of the CET1 instruments of financial sector entities where the institution has a significant investment in those entities
36 (1) (i), 48 (1) (b), 470, 472 (11)
24 Empty set in the EU
25 of which: deferred tax assets arising from temporary difference
36 (1) (c), 38, 48 (1) (a), 470, 472 (5)
25a Losses for the current financial year (negative amount)
36 (1) (a), 472 (3)
25b Forseeable tax charges relating to CET1 items (negative amount)
36 (1) (l)
26 Regulatory adjustments applied to Com-mon Equity Tier 1 in respect of amounts subject to pre CRR treatment
26a Regulatory adjustments relating to unrealised gains and losses pursuant to Articles 467 and 468
26b Amount to be deducted from or added to Common Equity Tier 1 capital with re-gard to additional filters and deductions required pre-CRR
481
27 Qualifying AT1 deductions that exceeds the AT1 capital of the institution (negative amount)
36 (1) (j)
28 Total regulatory adjustments to Common Equity Tier 1 (CET1)
29 Common Equity Tier 1 (CET1) capital
Additional Tier 1 (AT1) capital: instruments
30 Capital instruments and the related share premium accounts
51, 52
31 of which: classified as equity under applicable accounting standards
32 of which: classified as liabilities under applicable accounting standards
33 Amount of qualifying items referred to in Article 484 (4) and the related share premium accounts subject to phase out from AT1
486 (3)
Public sector capital injections grandfa-thered until 1 january 2018
483 (3)
34 Qualifying Tier 1 capital included in con-solidated AT1 capital (including minority interest not included in row 5) issued by subsidiaries and held by third parties
85, 86, 480
Appendix
-566
7,123
850
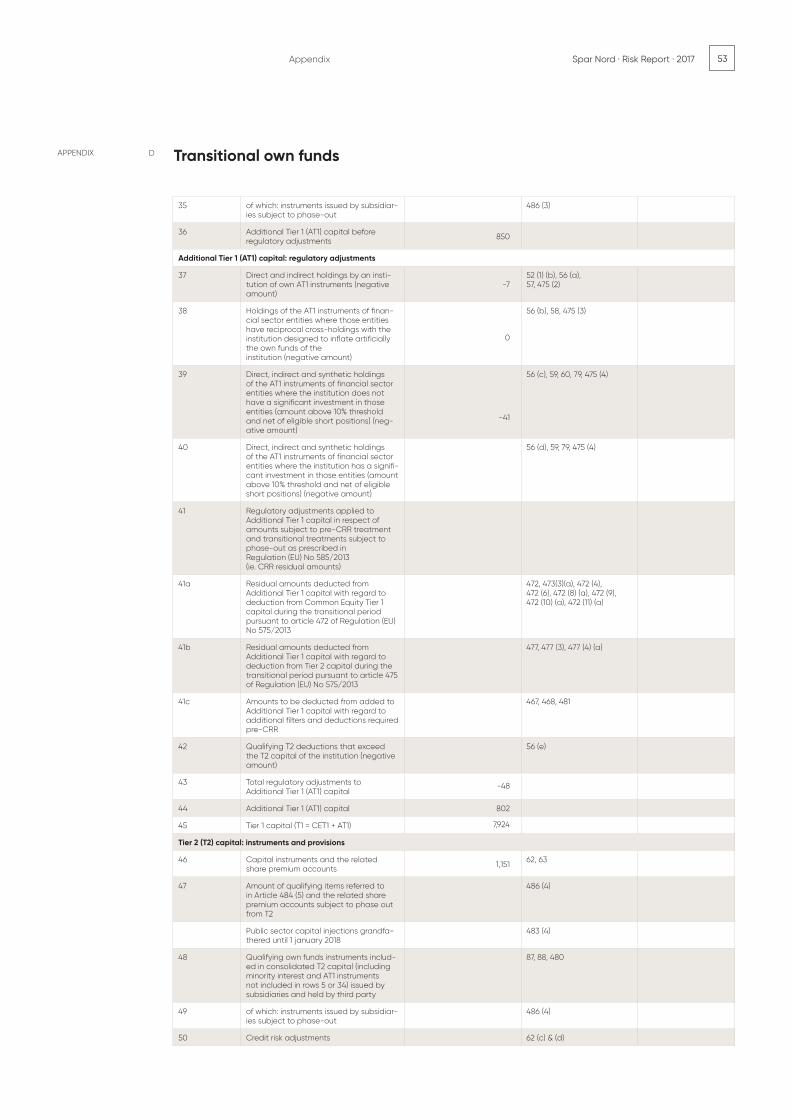
53Spar Nord · Risk Report · 2017
Transitional own funds
35 of which: instruments issued by subsidiar-ies subject to phase-out
486 (3)
36 Additional Tier 1 (AT1) capital before regulatory adjustments
Additional Tier 1 (AT1) capital: regulatory adjustments
37 Direct and indirect holdings by an insti-tution of own AT1 instruments (negative amount)
52 (1) (b), 56 (a), 57, 475 (2)
38 Holdings of the AT1 instruments of finan-cial sector entities where those entities have reciprocal cross-holdings with the institution designed to inflate artificially the own funds of theinstitution (negative amount)
56 (b), 58, 475 (3)
39 Direct, indirect and synthetic holdings of the AT1 instruments of financial sector entities where the institution does not have a significant investment in those entities (amount above 10% threshold and net of eligible short positions) (neg-ative amount)
56 (c), 59, 60, 79, 475 (4)
40 Direct, indirect and synthetic holdings of the AT1 instruments of financial sector entities where the institution has a signifi-cant investment in those entities (amount above 10% threshold and net of eligible short positions) (negative amount)
56 (d), 59, 79, 475 (4)
41 Regulatory adjustments applied to Additional Tier 1 capital in respect of amounts subject to pre-CRR treatment and transitional treatments subject to phase-out as prescribed in Regulation (EU) No 585/2013 (ie. CRR residual amounts)
41a Residual amounts deducted from Additional Tier 1 capital with regard to deduction from Common Equity Tier 1 capital during the transitional period pursuant to article 472 of Regulation (EU) No 575/2013
472, 473(3)(a), 472 (4), 472 (6), 472 (8) (a), 472 (9), 472 (10) (a), 472 (11) (a)
41b Residual amounts deducted from Additional Tier 1 capital with regard to deduction from Tier 2 capital during the transitional period pursuant to article 475 of Regulation (EU) No 575/2013
477, 477 (3), 477 (4) (a)
41c Amounts to be deducted from added to Additional Tier 1 capital with regard to additional filters and deductions required pre-CRR
467, 468, 481
42 Qualifying T2 deductions that exceed the T2 capital of the institution (negative amount)
56 (e)
43 Total regulatory adjustments to Additional Tier 1 (AT1) capital
44 Additional Tier 1 (AT1) capital
45 Tier 1 capital (T1 = CET1 + AT1)
Tier 2 (T2) capital: instruments and provisions
46 Capital instruments and the related share premium accounts
62, 63
47 Amount of qualifying items referred to in Article 484 (5) and the related share premium accounts subject to phase out from T2
486 (4)
Public sector capital injections grandfa-thered until 1 january 2018
483 (4)
48 Qualifying own funds instruments includ-ed in consolidated T2 capital (including minority interest and AT1 instruments not included in rows 5 or 34) issued by subsidiaries and held by third party
87, 88, 480
49 of which: instruments issued by subsidiar-ies subject to phase-out
486 (4)
50 Credit risk adjustments 62 (c) & (d)
APPENDIX D Transitional own funds
Appendix
850
-7
0
-41
-48
802
7,924
1,151

54 Spar Nord · Risk Report · 2017
51 Tier 2 (T2) capital before regulatory adjustment
Tier 2 (T2) capital: regulatory adjustments
52 Direct and indirect holdings by an institution of own T2 instruments and subordinated loans (negative amount)
63 (b) (i), 66 (a), 67, 477 (2)
53 Holdings of the T2 instruments and subordinated loans of financial sector entities where those entities have recip-rocal cross holdings with the institutions designed to inflate artificially the own funds of the institution (negative amount)
66 (b), 68, 477 (3)
54 Direct, indirect and synthetic holdings of the T2 instruments and subordinated loans of financial sector entities where the institution does not have a significant investment in those entities (amount above 10% threshold and net of eligible short positions) (negative amount)
66 (c), 69, 70, 79, 477 (4)
55 Direct, indirect and synthetic holdings of the T2 instruments and subordinated loans of financial sector entities where the institution has a significant invest-ment in those entities (net of eligible short positions) (negative amounts)
66 (d), 69, 79, 477 (4)
56 Regulatory adjustments applied to tier 2 in respect of amounts subject to pre-CRR treatment and transitional treatments subject to phase out as prescribed in Regulation (EU) No 575/2013 (i.e. CRR residual amounts)
56a Residual amounts deducted from Tier 2 capital with regard to deduction from Common Equity Tier 1 capital during the transitional period pursuant to article 472 of Regulation (EU) No 575/2013
472, 472(3)(a), 472 (4), 472 (6), 472 (8), 472 (9), 472 (10) (a), 472 (11) (a)
56b Residual amounts deducted from Tier 2 capital with regard to deduction from Additional Tier 1 capital during the tran-sitional period pursuant to article 475 of Regulation (EU) No 575/2013
475, 475 (2) (a), 475 (3), 475 (4) (a)
56c Amounts to be deducted from or added to Tier 2 capital with regard to additional filters and deductions required pre- CRR
467, 468, 481
57 Total regulatory adjustments to Tier 2 (T2) capital
58 Tier 2 (T2) capital
59 Total capital (TC = T1 + T2)
60 Total risk-weighted assets
Capital ratios and buffers
61 Common Equity Tier 1 (as a percentage of total risk exposure amount)
92 (2) (a), 465
62 Tier 1 (as a percentage of total risk expo-sure amount)
92 (2) (b), 465
63 Total capital (as a percentage of total risk exposure amount)
92 (2) (c)
64 Institution-specific buffer requirement (CET1 requirement in accordance with article 92 (1) (a) plus capital conservation and countercyclical buffer require-ments plus a systemic risk buffer, plus systemically important institution buffer expressed as a percentage of total risk exposure amount)
CRD 128, 129, 140
65 of which: capital conservation buffer requirement
66 of which: countercyclical buffer requirement
67 of which: systemic risk buffer requirement
APPENDIX D Transitional own funds
Appendix
1,151
-18
-41
-59
1,092
9,016
49,546
14.4%
16.0%
18.2%
1.3%
1.3%
0.0%
0.0%

55Spar Nord · Risk Report · 2017
67a of which: Global Systemically Important Institution (G-SII) or Other Systemically Important Institution (O-SII) buffer
CRD 131
68 Common Equity Tier 1 available to meet buffers (as a percentage of risk exposure amount)
CRD 128
69 [non-relevant in EU regulation]
70 [non-relevant in EU regulation]
71 [non-relevant in EU regulation]
Amounts below the thresholds for deduction (before risk-weighting)
72 Direct and indirect holdings of the capital of financial sector entities where the institution does not have a significant investment in those entities (amount below 10% threshold and net of eligible short positions)
36 (1) (h), 45, 46, 472 (10) 56 (c), 59, 60, 475 (4), 66 (c), 69, 70, 477 (4)
73 Direct and indirect holdings of the CET1 instruments of financial sector entities where the institution has a significant investment in those entities (amount below 10% threshold and net of eligible short positions)
36 (1) (i), 45, 48, 470, 472 (11)
74 Empty set in the EU
75 Deferred tax assets arising from tem-porary difference (amount below 10 % threshold, net of related tax liability where the conditions in Article 38 (3) are met)
36 (1) (c), 38, 48, 470, 472 (5)
Applicable caps on the inclusion of provisions in Tier 2
76 Credit risk adjustments included in T2 in respect of exposures subject to standardised approach (prior to the application of the cap)
62
77 Cap on inclusion of credit risk ad-justments in T2 under standardised approach
62
78 Credit risk adjustments included in T2 in respect of exposures subject to internal rating-based approach (prior to the application of the cap)
62
79 Cap for inclusion of credit risk adjust-ments in T2 under internal ratings- based approach
62
Capital instruments subject to phase-out arrangements (only applicable between 1 Jan 2014 and 1 Jan 2022)
80 - Current cap on CET1 instruments sub-ject to phase-out arrangements
484 (3), 486 (2) & (5)
81 - Amount excluded from CET1 due to cap (excess over cap after redemptions and maturities)
484 (3), 486 (2) & (5)
82 - Current cap on AT1 instruments subject to phase-out arrangements
484 (4), 486 (3) & (5)
83 - Amount excluded from AT1 due to cap (excess over cap after redemptions and maturities)
484 (4), 486 (3) & (5)
84 - Current cap on T2 instruments subject to phase-out arrangements
484 (5), 486 (4) & (5)
85 - Amount excluded from T2 due to cap (excess over cap after redemptions and maturities)
484 (5), 486 (4) & (5)
(1) ’N/A’ inserted if the question is not applicable
APPENDIX D Transitional own funds
Appendix
9.9%
745
418

56 Spar Nord · Risk Report · 2017
APPENDIX E Institution-specific countercyclical capital buffer 2017
Appendix
Geo
gra
phi
cal d
istr
ibut
ion
of c
red
it e
xpos
ures
rele
vant
for t
he c
alc
ula
tion
of t
he c
ount
ercy
clic
al c
ap
ital b
uffe
r
Bre
akd
own
by
coun
try:
Gen
era
l cre
dit
exp
osu
res
Tra
din
g b
oo
k ex
po
sure
Secu
ritis
atio
n ex
po
sure
Ow
n fu
nds
req
uire
men
tsO
wn
fund
s re
qui
re-
men
t w
eig
hts
Co
un-
terc
y-cl
ica
l ca
pita
l b
uffe
r ra
te
Exp
osu
re
valu
e fo
r SA
Exp
osu
re
valu
e IR
B
Sum
of l
ong
and
sh
ort
po
sitio
n of
tr
ad
ing
bo
ok
Valu
e of
tr
ad
ing
b
oo
k ex
po
-su
re fo
r in
tern
al
mo
del
s
Exp
osu
re v
alu
e fo
r SA
Exp
osu
re
valu
e fo
r IR
B
Of w
hich
: G
ener
al c
red
it ex
po
sure
s
Of w
hich
: Tr
ad
ing
b
oo
k ex
po
-su
res
Of w
hich
: Se
curi-
tisa
tion
exp
o-
sure
s
Tota
l
010
020
030
040
050
060
070
080
090
100
110
120
010
020
Am
ount
of i
nsti
tuti
on-s
pec
ific
coun
terc
yclic
al c
ap
ital b
uffe
r0
10
010
Tota
l ris
k ex
po
sure
am
oun
t49
,545
,643
,90
4
020
Inst
itutio
n sp
ecifi
c co
unte
rcyc
lica
l buf
fer r
ate
0.0
2%
030
Inst
itut
ion
spec
ific
coun
terc
yclic
al b
uffe
r req
uire
men
t8,
697,6
68
Den
ma
rk
51,9
06,
170
,814
12,7
66,0
11,3
63
3
,161,5
27,5
20
120,
783,
371
3
,282
,310
,891
0
.976
0
.0%
Swed
en
50
4,0
34,7
36
15
4,0
71,6
06
21,1
95,6
71
1,54
6,0
41
2
2,74
1,711
0
.00
7
2.0
%
Ger
ma
ny
448
,654
,519
573
,793
,337
8,7
25,3
04
2
,610
,397
11,3
35,7
00
0
.00
3
0.0
%
No
rwa
y 15
8,56
4,18
8
8
6,19
5,90
2
4
,291
,822
2
,472
,567
6,7
64,3
89
0.0
01
2.0
%
Unite
d Kin
gdom
13
5,0
71,0
43
10
3,34
3,34
1
5,7
84,6
56
2,8
38,7
20
8
,623
,377
0
.00
2
0.0
%
Lux
emb
our
g
129,
675,
742
11,0
84,4
72
9
,991
,918
6
86,5
00
10,6
78,4
18
0.0
03
0
.0%
USA
9
6,0
48,19
9
13
,449
,446
4,17
2,78
7
959
,689
5,13
2,47
6
0.0
01
0.0
%
Switz
erla
nd
94,
624,
980
4,4
35,4
82
4
,165,
00
8
291
,70
8
4
,456
,716
0
.00
1 0
.0%
Spa
in
51,4
02,
843
3,7
69,8
84
-
3,7
69,8
84
0.0
01
0.0
%
Faro
e is
land
s 3
9,011
,00
2
3
,077
,367
-
3
,077
,367
0
.00
1 0
.0%
Net
herla
nds
25,
701,4
07
175,
267
1,27
0,70
8
14,0
21
1,
284,
729
0
.00
0
0.0
%
Pola
nd
25,
061
,872
2,2
27,2
89
-
2,2
27,2
89
0.0
01
0.0
%
Bel
giu
m
22,
606,
601
6
13,9
00
-
6
13,9
00
0
.00
0
0.0
%
Finl
and
15
,415
,296
872
,555
-
8
72,5
55
0.0
00
0
.0%
Fra
nce
13,3
79,4
37
8
84,8
78
-
884
,878
0
.00
0
0.0
%
Czec
h Re
publ
ic
646
,368
159,
150
-
15
9,15
0
0.0
00
0
.5%
Slov
aki
a
30,
380
1,82
3
-
1,82
3
0.0
00
0
.5%
Ho
ng K
ong
1,
918,
434
49,
306
-
4
9,30
6
0.0
00
1.5
%
Icel
and
2
,727
,720
20
9,940
-
2
09,9
40
0.0
00
1.3
%
Oth
er c
ount
ries
89,
797,1
61
1,
923,
963
5,4
19,3
14
153,
917
5,5
73,2
31
0.0
02
0
.0%
53
,760
,542
,744
13,7
14,4
84,1
79
3,
238,
410,
800
13
2,35
6,93
1
3,37
0,76
7,731
1.
00
0
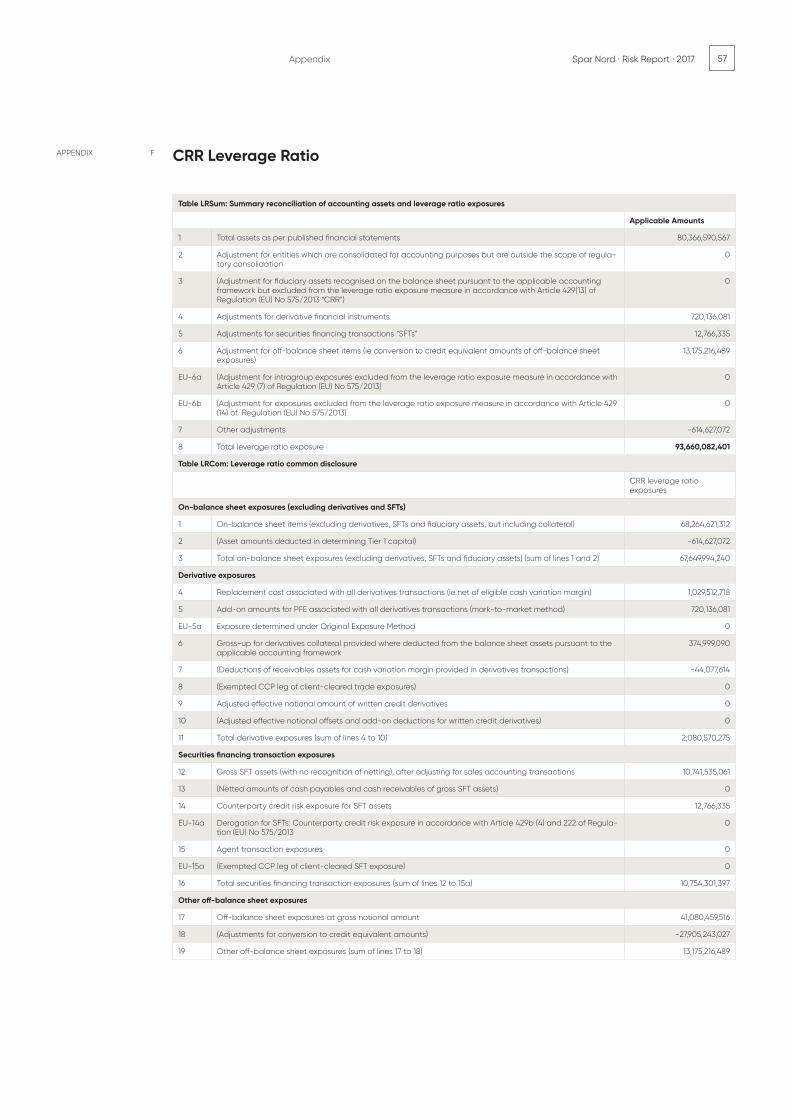
57Spar Nord · Risk Report · 2017
Institution-specific countercyclical capital buffer 2017 APPENDIX F CRR Leverage Ratio
Appendix
Table LRSum: Summary reconciliation of accounting assets and leverage ratio exposures
Applicable Amounts
1 Total assets as per published financial statements 80,366,590,567
2 Adjustment for entities which are consolidated for accounting purposes but are outside the scope of regula-tory consolidation
0
3 (Adjustment for fiduciary assets recognised on the balance sheet pursuant to the applicable accounting framework but excluded from the leverage ratio exposure measure in accordance with Article 429(13) of Regulation (EU) No 575/2013 “CRR”)
0
4 Adjustments for derivative financial instruments 720,136,081
5 Adjustments for securities financing transactions “SFTs” 12,766,335
6 Adjustment for off-balance sheet items (ie conversion to credit equivalent amounts of off-balance sheet exposures)
13,175,216,489
EU-6a (Adjustment for intragroup exposures excluded from the leverage ratio exposure measure in accordance with Article 429 (7) of Regulation (EU) No 575/2013)
0
EU-6b (Adjustment for exposures excluded from the leverage ratio exposure measure in accordance with Article 429 (14) of Regulation (EU) No 575/2013)
0
7 Other adjustments -614,627,072
8 Total leverage ratio exposure 93,660,082,401
Table LRCom: Leverage ratio common disclosure
CRR leverage ratio exposures
On-balance sheet exposures (excluding derivatives and SFTs)
1 On-balance sheet items (excluding derivatives, SFTs and fiduciary assets, but including collateral) 68,264,621,312
2 (Asset amounts deducted in determining Tier 1 capital) -614,627,072
3 Total on-balance sheet exposures (excluding derivatives, SFTs and fiduciary assets) (sum of lines 1 and 2) 67,649,994,240
Derivative exposures
4 Replacement cost associated with all derivatives transactions (ie net of eligible cash variation margin) 1,029,512,718
5 Add-on amounts for PFE associated with all derivatives transactions (mark-to-market method) 720,136,081
EU-5a Exposure determined under Original Exposure Method 0
6 Gross-up for derivatives collateral provided where deducted from the balance sheet assets pursuant to the applicable accounting framework
374,999,090
7 (Deductions of receivables assets for cash variation margin provided in derivatives transactions) -44,077,614
8 (Exempted CCP leg of client-cleared trade exposures) 0
9 Adjusted effective notional amount of written credit derivatives 0
10 (Adjusted effective notional offsets and add-on deductions for written credit derivatives) 0
11 Total derivative exposures (sum of lines 4 to 10) 2,080,570,275
Securities financing transaction exposures
12 Gross SFT assets (with no recognition of netting), after adjusting for sales accounting transactions 10,741,535,061
13 (Netted amounts of cash payables and cash receivables of gross SFT assets) 0
14 Counterparty credit risk exposure for SFT assets 12,766,335
EU-14a Derogation for SFTs: Counterparty credit risk exposure in accordance with Article 429b (4) and 222 of Regula-tion (EU) No 575/2013
0
15 Agent transaction exposures 0
EU-15a (Exempted CCP leg of client-cleared SFT exposure) 0
16 Total securities financing transaction exposures (sum of lines 12 to 15a) 10,754,301,397
Other off-balance sheet exposures
17 Off-balance sheet exposures at gross notional amount 41,080,459,516
18 (Adjustments for conversion to credit equivalent amounts) -27,905,243,027
19 Other off-balance sheet exposures (sum of lines 17 to 18) 13,175,216,489

58 Spar Nord · Risk Report · 2017
APPENDIX F CRR Leverage Ratio
Appendix
Exempted exposures in accordance with CRR Article 429 (7) and (14) (on and off balance sheet)
EU-19a (Exemption of intragroup exposures (solo basis) in accordance with Article 429(7) of Regulation (EU) No 575/2013 (on and off balance sheet))
0
EU-19b (Exposures exempted in accordance with Article 429 (14) of Regulation (EU) No 575/2013 (on and off balance sheet))
0
Capital and total exposures
20 Tier 1 capital 7,924,183,445
21 Total leverage ratio exposures (sum of lines 3, 11, 16, 19, EU-19a and EU-19b) 93,660,082,401
Leverage ratio
22 Leverage ratio 8.5%
Choice on transitional arrangements and amount of derecognised fiduciary items
EU-23 Choice on transitional arrangements for the definition of the capital measure
EU-24 Amount of derecognised fiduciary items in accordance with Article 429(11) of Regulation (EU) NO 575/2013
Table LRSpl: Split-up of on balance sheet exposures (excluding derivatives, SFTs and exempted exposures)
CRR leverage ratio exposures
EU-1 Total on-balance sheet exposures (excluding derivatives, SFTs, and exempted exposures), of which: 68,264,621,312
EU-2 Trading book exposures 25,880,586,636
EU-3 Banking book exposures, of which: 42,384,034,676
EU-4 Covered bonds 0
EU-5 Exposures treated as sovereigns 1,025,948,837
EU-6 Exposures to regional governments, MDB, international organisations and PSE NOT treated as sovereigns 160,921,256
EU-7 Institutions 799,710,789
EU-8 Secured by mortgages of immovable properties 3,287,635,285
EU-9 Retail exposures 16,018,527,520
EU-10 Corporate 16,185,626,685
EU-11 Exposures in default 1,787,579,715
EU-12 Other exposures (eg equity, securitisations, and other non-credit obligation assets) 3,118,084,589
Table LRQua: Free format text boxes for disclosure on qualitative items
1 Description of the processes used to manage the risk of excessive leverage Spar Nord has made several initiatives to avoid excessive leverage risk. Besides having a threshold value and procedures for calculating the leverage ratio, there are defined guidelines for the actions, that will be taken, if the leverage ratio drops to a level below the threshold. In addition, there are methods to measure the risks of excessive leverage and methods to evaluate significant changes to the leverage ratio. Excessive leverage is the risk resulting from an institution’s vul-nerability due to leverage or potential leverage, that may require unforeseen changes. This includes sale of assets which could result in losses or adjustments in the value of its remaining assets .
2 Description of the factors that had an impact on the leverage Ratio during the period to which the disclosed leverage Ratio refers
The balance is considered stable through 2017. The Leverage Ratio has been positively affected by increased core capital, which is mainly affected by the profit of the year.

59Spar Nord · Risk Report · 2017
CRR Leverage Ratio
Exempted exposures in accordance with CRR Article 429 (7) and (14) (on and off balance sheet)
EU-19a (Exemption of intragroup exposures (solo basis) in accordance with Article 429(7) of Regulation (EU) No 575/2013 (on and off balance sheet))
0
EU-19b (Exposures exempted in accordance with Article 429 (14) of Regulation (EU) No 575/2013 (on and off balance sheet))
0
Capital and total exposures
20 Tier 1 capital 7,924,183,445
21 Total leverage ratio exposures (sum of lines 3, 11, 16, 19, EU-19a and EU-19b) 93,660,082,401
Leverage ratio
22 Leverage ratio 8.5%
Choice on transitional arrangements and amount of derecognised fiduciary items
EU-23 Choice on transitional arrangements for the definition of the capital measure
EU-24 Amount of derecognised fiduciary items in accordance with Article 429(11) of Regulation (EU) NO 575/2013
Table LRSpl: Split-up of on balance sheet exposures (excluding derivatives, SFTs and exempted exposures)
CRR leverage ratio exposures
EU-1 Total on-balance sheet exposures (excluding derivatives, SFTs, and exempted exposures), of which: 68,264,621,312
EU-2 Trading book exposures 25,880,586,636
EU-3 Banking book exposures, of which: 42,384,034,676
EU-4 Covered bonds 0
EU-5 Exposures treated as sovereigns 1,025,948,837
EU-6 Exposures to regional governments, MDB, international organisations and PSE NOT treated as sovereigns 160,921,256
EU-7 Institutions 799,710,789
EU-8 Secured by mortgages of immovable properties 3,287,635,285
EU-9 Retail exposures 16,018,527,520
EU-10 Corporate 16,185,626,685
EU-11 Exposures in default 1,787,579,715
EU-12 Other exposures (eg equity, securitisations, and other non-credit obligation assets) 3,118,084,589
Table LRQua: Free format text boxes for disclosure on qualitative items
1 Description of the processes used to manage the risk of excessive leverage Spar Nord has made several initiatives to avoid excessive leverage risk. Besides having a threshold value and procedures for calculating the leverage ratio, there are defined guidelines for the actions, that will be taken, if the leverage ratio drops to a level below the threshold. In addition, there are methods to measure the risks of excessive leverage and methods to evaluate significant changes to the leverage ratio. Excessive leverage is the risk resulting from an institution’s vul-nerability due to leverage or potential leverage, that may require unforeseen changes. This includes sale of assets which could result in losses or adjustments in the value of its remaining assets .
2 Description of the factors that had an impact on the leverage Ratio during the period to which the disclosed leverage Ratio refers
The balance is considered stable through 2017. The Leverage Ratio has been positively affected by increased core capital, which is mainly affected by the profit of the year.
APPENDIX G LCR disclosure
Appendix
Scope of consolidation - ConsolidatedTotal unweighted value Total weighted value
Currency and units - DKK
Quarter ending on 31 Dec. 2017
HIGH-QUALITY LIQUID ASSETS
1 Total high-quality liquid assets (HQLA) 17,342,367,339
CASH-OUTFLOWS
2 Retail deposits and deposits from small business customers, of which: 38,745,722,408 2,617,283,786
3 Stable deposits 28,029,945,595 1,401,497,280
4 Less stable deposits 10,715,776,813 1,215,786,506
5 Unsecured wholesale funding 10,393,198,990 4,981,799,141
6 Operational deposits (all counterparties) and deposits in networks of cooperative banks 0 0
7 Non-operational deposits (all counterparties) 10,393,198,990 4,981,799,141
8 Unsecured debt 0 0
9 Secured wholesale funding 56,584,453
10 Additional requirements 25,597,226,302 2,461,427,112
11 Outflows related to derivative exposures and other collateral requirements 93,343,744 93,343,744
12 Outflows related to loss of funding on debt products 0 0
13 Credit and liquidity facilities 25,503,882,558 2,368,083,368
14 Other contractual funding obligations 3,910,618,204 3,910,618,204
15 Other contingent funding obligations 153,206,656 153,206,656
16 TOTAL CASH OUTFLOWS 14,180,919,352
CASH-INFLOWS
17 Secured lending (eg reverse repos) 10,026,200,587 1,476,048,478
18 Inflows from fully performing exposures 613,538,689 494,287,205
19 Other cash inflows 7,622,910,341 2,928,822,851
EU-19a
(Difference between total weighted inflows and total weighted outflows arising from transactions in third countries where there are transfer restrictions or which are denominated in non-convertible currencies)
0
EU-19b
(Excess inflows from a related specialised credit institution) 0
20 TOTAL CASH INFLOWS 18,262,649,617 4,899,158,534
EU-20a
Fully exempt inflows 0 0
EU-20b
Inflows Subject to 90% Cap 0 0
EU-20c
Inflows Subject to 75% Cap 18,262,649,617 4,899,158,534
TOTAL ADJUSTED VALUE
21 LIQUIDITY BUFFER 17,342,367,339
22 TOTAL NET CASH OUTFLOWS 9,281,760,818
23 LIQUIDITY COVERAGE RATIO (%) 187

60 Spar Nord · Risk Report · 2017
APPENDIX Asset encumbrance
Appendix
H
Carrying amount of encumbered assets
Fair value of encumbered assets
Carrying amount of non-encumbered assets
Fair value of non-encumbered assets
010 040 060 090
010 Assets of the reporting institution 4,249 74,327
030 Equity instruments 0 0 1,644 1,644
040 Debt securities 3,130 3,130 13,251 13,251
120 Other assets 1,119 59,432
Fair value of encumbered col-lateral received or own debt securities issued
Fair value of col-lateral received or own debt securities issued available for encumbrance
010 040
130 Collateral received by the reporting institution 90 6,633
150 Equity instruments 0 23
160 Debt securities 90 6,600
230 Other collateral received 0 10
240 Own debt securities issued other than own covered bonds or ABSs
0 0
Matching liabilities, contingent liabilities or securities lent
Assets, collateral received and own debt securities issued other than covered bonds and ABSs encumbered
010 030
010 Carrying amount of selected financial liabilities 4,190 4,339

61Spar Nord · Risk Report · 2017
Carrying amount of encumbered assets
Fair value of encumbered assets
Carrying amount of non-encumbered assets
Fair value of non-encumbered assets
010 040 060 090
010 Assets of the reporting institution 4,249 74,327
030 Equity instruments 0 0 1,644 1,644
040 Debt securities 3,130 3,130 13,251 13,251
120 Other assets 1,119 59,432
Fair value of encumbered col-lateral received or own debt securities issued
Fair value of col-lateral received or own debt securities issued available for encumbrance
010 040
130 Collateral received by the reporting institution 90 6,633
150 Equity instruments 0 23
160 Debt securities 90 6,600
230 Other collateral received 0 10
240 Own debt securities issued other than own covered bonds or ABSs
0 0
Matching liabilities, contingent liabilities or securities lent
Assets, collateral received and own debt securities issued other than covered bonds and ABSs encumbered
010 030
010 Carrying amount of selected financial liabilities 4,190 4,339
APPENDIX I Credit exposure
Appendix
Cre
dit
exp
osur
e
TERM
TO
MAT
URI
TY B
Y E
XPO
SURE
CAT
EGO
RY20
1720
16
On
dem
and
0 -
3 m
ths
3 m
ths
- 1
yea
rs1
- 5
yea
rsO
ver
5 ye
ars
Tota
lO
n d
ema
nd0
- 3
mth
s3
mth
s -
1 ye
ars
1 -
5 ye
ars
Ove
r 5
yea
rsTo
tal
Cen
tra
l gov
. or c
entr
al b
ank
s1,0
160
00
01,
016
325
00
00
325
Reg
iona
l or l
oca
l aut
horit
ies
039
481
823
491,
284
645
831
246
055
1,29
0
Pub
lic-s
ecto
r ent
ities
00
111
3213
327
649
015
113
1318
9
Inst
itutio
ns
2,92
82,
733
443
9285
07,0
4662
83,
340
459
116
919
5,46
1
Co
rpo
rate
s35
910
,391
16,6
843,
075
3,60
034
,10
94,
228
5,71
412
,792
2,78
94,
550
30,0
73
Reta
il
934
3,31
410
,348
16,2
398,
750
39,5
842,
187
3,0
349,
118
16,4
648,
326
39,1
28
Exp
. sec
ured
by
mo
rtg
. on
imm
. pro
p.
5887
877
940
4,69
76,
660
117
7090
297
83,
772
5,83
8
Exp
. in
def
aul
t12
540
1,076
417
433
2,0
9025
738
239
8513
175
0
Hig
h-ris
k ex
po
sure
s35
1691
266
561,
084
173
3353
729
355
1,0
90
Exp
. with
sho
rt-t
erm
ratin
g0
00
00
00
00
00
0
Exp
. in
units
or C
IU0
00
01
10
00
03
3
Equi
ty e
xpo
sure
00
00
1,217
1,21
70
00
01,0
711,
072
Oth
er e
xpo
sure
s45
528
944
60
689
1,87
944
711
150
10
718
1,77
6
Tota
l5,
909
17,2
6231
,716
20,8
8420
,474
96,2
458,
418
12,7
9624
,873
21,2
9719
,611
86,9
95
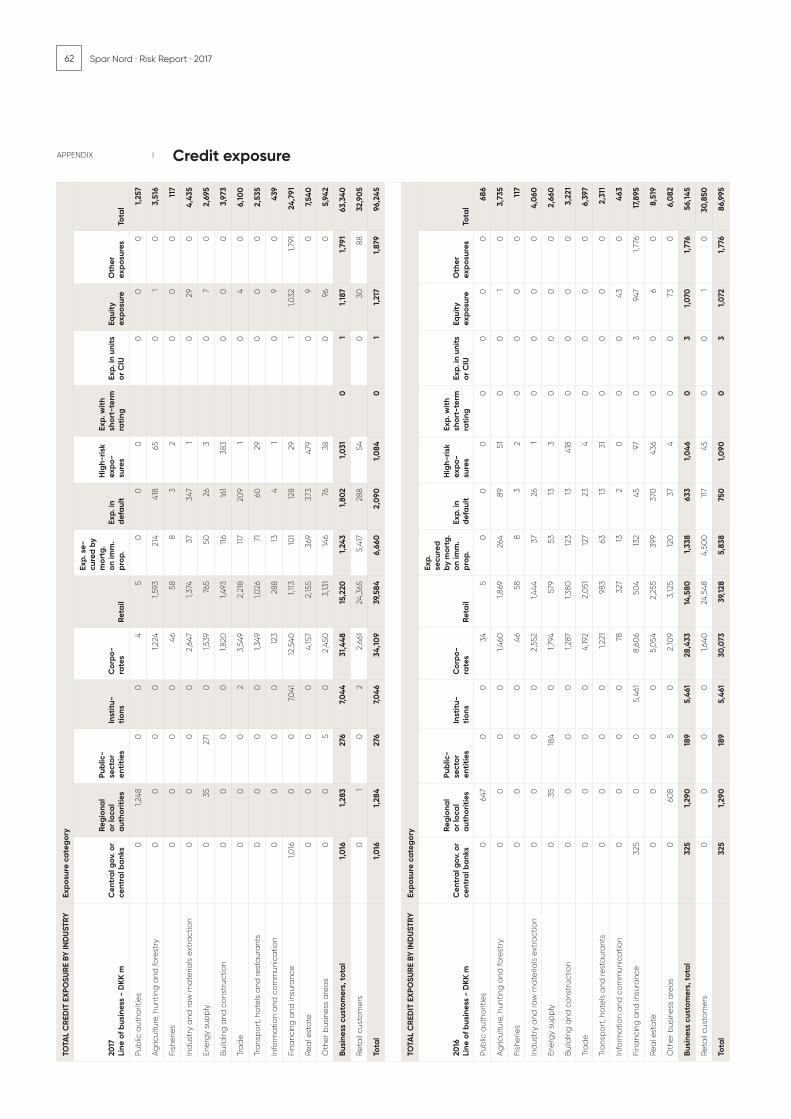
62 Spar Nord · Risk Report · 2017TO
TAL
CRE
DIT
EXP
OSU
RE B
Y IN
DU
STRY
Exp
osur
e ca
teg
ory
2017
Li
ne o
f bus
ines
s -
DKK
mC
entr
al g
ov. o
r ce
ntra
l ba
nks
Reg
iona
l or
loca
l a
utho
ritie
s
Pub
lic-
sect
or
enti
ties
Inst
itu-
tion
sC
orp
o-ra
tes
Reta
il
Exp.
se-
cure
d b
y m
ortg
. on
imm
. p
rop.
Exp.
in
def
aul
t
Hig
h-ris
k ex
po-
sure
s
Exp.
wit
h sh
ort-
term
ra
ting
Exp.
in u
nits
or
CIU
Equi
ty
exp
osur
eO
ther
ex
pos
ures
Tota
l
Pub
lic a
utho
ritie
s0
1,248
00
45
00
00
00
1,25
7
Ag
ricul
ture
, hun
ting
and
fore
stry
00
00
1,224
1,593
214
418
650
10
3,51
6
Fish
erie
s0
00
046
588
32
00
011
7
Ind
ustr
y a
nd ra
w m
ate
rials
ext
ract
ion
00
00
2,64
71,3
7437
347
10
290
4,43
5
Ener
gy
sup
ply
035
271
01,5
3976
550
263
07
02,
695
Bui
ldin
g a
nd c
ons
truc
tion
00
00
1,820
1,493
116
161
383
00
03,
973
Tra
de
00
02
3,54
92,
218
117
209
10
40
6,10
0
Tra
nsp
ort
, ho
tels
and
rest
aur
ant
s0
00
01,3
491,0
2671
6029
00
02,
535
Info
rma
tion
and
co
mm
unic
atio
n0
00
012
328
813
41
09
043
9
Fina
ncin
g a
nd in
sura
nce
1,016
00
7,041
12,5
401,1
1310
112
829
11,0
321,7
9124
,791
Rea
l est
ate
00
00
4,15
72,
155
369
373
479
09
07,5
40
Oth
er b
usin
ess
are
as
00
50
2,45
03,
131
146
7638
096
05,
942
Busi
ness
cus
tom
ers,
tota
l1,
016
1,28
327
67,0
4431
,448
15,2
201,
243
1,80
21,
031
01
1,18
71,
791
63,3
40
Reta
il cu
sto
mer
s0
10
22,
661
24,3
655,
417
288
540
3088
32,9
05
Tota
l1,
016
1,28
427
67,0
4634
,10
939
,584
6,66
02,
090
1,0
840
11,
217
1,87
996
,245
TOTA
L C
RED
IT E
XPO
SURE
BY
IND
UST
RYEx
pos
ure
cate
gor
y
2016
Li
ne o
f bus
ines
s -
DKK
mC
entr
al g
ov. o
r ce
ntra
l ba
nks
Reg
iona
l or
loca
l a
utho
ritie
s
Pub
lic-
sect
or
enti
ties
Inst
itu-
tion
s
Cor
po-
rate
sRe
tail
Exp.
se
cure
d
by m
ortg
. on
imm
. p
rop.
Exp.
in
def
aul
t
Hig
h-ris
k ex
po-
sure
s
Exp.
wit
h sh
ort-
term
ra
ting
Exp.
in u
nits
or
CIU
Equi
ty
exp
osur
eO
ther
ex
pos
ures
Tota
l
Pub
lic a
utho
ritie
s0
647
00
345
00
00
00
068
6
Ag
ricul
ture
, hun
ting
and
fore
stry
00
00
1,460
1,869
264
8951
00
10
3,73
5
Fish
erie
s0
00
046
588
32
00
00
117
Ind
ustr
y a
nd ra
w m
ate
rials
ext
ract
ion
00
00
2,55
21,4
4437
261
00
00
4,0
60
Ener
gy
sup
ply
035
184
01,7
9457
953
133
00
00
2,66
0
Bui
ldin
g a
nd c
ons
truc
tion
00
00
1,287
1,380
123
1341
80
00
03,
221
Tra
de
00
00
4,19
22,
051
127
234
00
00
6,39
7
Tra
nsp
ort
, ho
tels
and
rest
aur
ant
s0
00
01,2
2198
363
1331
00
00
2,31
1
Info
rma
tion
and
co
mm
unic
atio
n0
00
078
327
132
00
043
046
3
Fina
ncin
g a
nd in
sura
nce
325
00
5,46
18,
606
504
132
4597
03
947
1,776
17,8
95
Rea
l est
ate
00
00
5,0
542,
255
399
370
436
00
60
8,51
9
Oth
er b
usin
ess
are
as
060
85
02,
109
3,12
512
037
40
073
06,
082
Busi
ness
cus
tom
ers,
tota
l32
51,
290
189
5,46
128
,433
14,5
801,
338
633
1,0
460
31,
070
1,77
656
,145
Reta
il cu
sto
mer
s0
00
01,6
4024
,548
4,50
011
745
00
10
30,8
50
Tota
l32
51,
290
189
5,46
130
,073
39,1
285,
838
750
1,0
900
31,
072
1,77
686
,995
APPENDIX Credit exposureI

63Spar Nord · Risk Report · 2017
TOTA
L C
RED
IT E
XPO
SURE
BY
IND
UST
RYEx
pos
ure
cate
gor
y
2017
Li
ne o
f bus
ines
s -
DKK
mC
entr
al g
ov. o
r ce
ntra
l ba
nks
Reg
iona
l or
loca
l a
utho
ritie
s
Pub
lic-
sect
or
enti
ties
Inst
itu-
tion
sC
orp
o-ra
tes
Reta
il
Exp.
se-
cure
d b
y m
ortg
. on
imm
. p
rop.
Exp.
in
def
aul
t
Hig
h-ris
k ex
po-
sure
s
Exp.
wit
h sh
ort-
term
ra
ting
Exp.
in u
nits
or
CIU
Equi
ty
exp
osur
eO
ther
ex
pos
ures
Tota
l
Pub
lic a
utho
ritie
s0
1,248
00
45
00
00
00
1,25
7
Ag
ricul
ture
, hun
ting
and
fore
stry
00
00
1,224
1,593
214
418
650
10
3,51
6
Fish
erie
s0
00
046
588
32
00
011
7
Ind
ustr
y a
nd ra
w m
ate
rials
ext
ract
ion
00
00
2,64
71,3
7437
347
10
290
4,43
5
Ener
gy
sup
ply
035
271
01,5
3976
550
263
07
02,
695
Bui
ldin
g a
nd c
ons
truc
tion
00
00
1,820
1,493
116
161
383
00
03,
973
Tra
de
00
02
3,54
92,
218
117
209
10
40
6,10
0
Tra
nsp
ort
, ho
tels
and
rest
aur
ant
s0
00
01,3
491,0
2671
6029
00
02,
535
Info
rma
tion
and
co
mm
unic
atio
n0
00
012
328
813
41
09
043
9
Fina
ncin
g a
nd in
sura
nce
1,016
00
7,041
12,5
401,1
1310
112
829
11,0
321,7
9124
,791
Rea
l est
ate
00
00
4,15
72,
155
369
373
479
09
07,5
40
Oth
er b
usin
ess
are
as
00
50
2,45
03,
131
146
7638
096
05,
942
Busi
ness
cus
tom
ers,
tota
l1,
016
1,28
327
67,0
4431
,448
15,2
201,
243
1,80
21,
031
01
1,18
71,
791
63,3
40
Reta
il cu
sto
mer
s0
10
22,
661
24,3
655,
417
288
540
3088
32,9
05
Tota
l1,
016
1,28
427
67,0
4634
,10
939
,584
6,66
02,
090
1,0
840
11,
217
1,87
996
,245
TOTA
L C
RED
IT E
XPO
SURE
BY
IND
UST
RYEx
pos
ure
cate
gor
y
2016
Li
ne o
f bus
ines
s -
DKK
mC
entr
al g
ov. o
r ce
ntra
l ba
nks
Reg
iona
l or
loca
l a
utho
ritie
s
Pub
lic-
sect
or
enti
ties
Inst
itu-
tion
s
Cor
po-
rate
sRe
tail
Exp.
se
cure
d
by m
ortg
. on
imm
. p
rop.
Exp.
in
def
aul
t
Hig
h-ris
k ex
po-
sure
s
Exp.
wit
h sh
ort-
term
ra
ting
Exp.
in u
nits
or
CIU
Equi
ty
exp
osur
eO
ther
ex
pos
ures
Tota
l
Pub
lic a
utho
ritie
s0
647
00
345
00
00
00
068
6
Ag
ricul
ture
, hun
ting
and
fore
stry
00
00
1,460
1,869
264
8951
00
10
3,73
5
Fish
erie
s0
00
046
588
32
00
00
117
Ind
ustr
y a
nd ra
w m
ate
rials
ext
ract
ion
00
00
2,55
21,4
4437
261
00
00
4,0
60
Ener
gy
sup
ply
035
184
01,7
9457
953
133
00
00
2,66
0
Bui
ldin
g a
nd c
ons
truc
tion
00
00
1,287
1,380
123
1341
80
00
03,
221
Tra
de
00
00
4,19
22,
051
127
234
00
00
6,39
7
Tra
nsp
ort
, ho
tels
and
rest
aur
ant
s0
00
01,2
2198
363
1331
00
00
2,31
1
Info
rma
tion
and
co
mm
unic
atio
n0
00
078
327
132
00
043
046
3
Fina
ncin
g a
nd in
sura
nce
325
00
5,46
18,
606
504
132
4597
03
947
1,776
17,8
95
Rea
l est
ate
00
00
5,0
542,
255
399
370
436
00
60
8,51
9
Oth
er b
usin
ess
are
as
060
85
02,
109
3,12
512
037
40
073
06,
082
Busi
ness
cus
tom
ers,
tota
l32
51,
290
189
5,46
128
,433
14,5
801,
338
633
1,0
460
31,
070
1,77
656
,145
Reta
il cu
sto
mer
s0
00
01,6
4024
,548
4,50
011
745
00
10
30,8
50
Tota
l32
51,
290
189
5,46
130
,073
39,1
285,
838
750
1,0
900
31,
072
1,77
686
,995

64 Spar Nord · Risk Report · 2017Spar Nord Bank A/SSkelagervej 15P.O. Box 162DK-9100 Aalborg
Tel. +45 96 34 40 00Fax + 45 96 34 45 [email protected]
CVR no. 13 73 75 84
The Risk Report has been prepared in a Danish and an English version. In case of discrepancy between the Danish-language original text and the English-language translation, the Danish text shall prevail.