Embed Size (px)
Citation preview
University of New MexicoUNM Digital Repository
Computer Science ETDs Engineering ETDs
Summer 5-28-2017
Spam, Fraud, and Bots: Improving the Integrity ofOnline Social Media DataAmanda Jean MinnichUniversity of New Mexico
Follow this and additional works at: https://digitalrepository.unm.edu/cs_etds
Part of the Artificial Intelligence and Robotics Commons
This Dissertation is brought to you for free and open access by the Engineering ETDs at UNM Digital Repository. It has been accepted for inclusion inComputer Science ETDs by an authorized administrator of UNM Digital Repository. For more information, please contact [email protected].
Recommended CitationMinnich, Amanda Jean. "Spam, Fraud, and Bots: Improving the Integrity of Online Social Media Data." (2017).https://digitalrepository.unm.edu/cs_etds/85

Candidate Department This dissertation is approved, and it is acceptable in quality and form for publication: Approved by the Dissertation Committee: , Chairperson
Spam, Fraud, and Bots: Improving theIntegrity of Online Social Media Data
by
Amanda Jean Minnich
B.A., Integrative Biology, University of California, Berkeley, 2009M.S., Computer Science, University of New Mexico, 2014
DISSERTATION
Submitted in Partial Fulfillment of the
Requirements for the Degree of
Doctor of PhilosophyComputer Science
The University of New Mexico
Albuquerque, New Mexico
July 2017

ii
Dedication
This dissertation is dedicated to my husband Jayson Grace,
my dogs Nala and Archimedes, and my parents.

iii
AcknowledgmentsThere are many people who have helped me these past six years.
First of all I would like to thank my advisor, Professor Abdullah Mueen, for his guid-ance and support. He motivated and pushed me when I needed it, and also helped me tofind the self-motivation and push inside myself. I am the researcher I am now because ofhis tutelage.
Thank you to my committee members, Michalis Faloutsos, Shuang Luan, and JedidiahCrandall, for their time and feedback.
Thanks to Lydia Tapia, who served as a supportive mentor to me throughout this pro-cess. She introduced me to the cause of advancing women in tech and was a constantempowering presence throughout my time at UNM.
Thank you to Darko Stefanovic and Terran Lane for taking a chance on a new studentwho didn’t even know how to code. Your confidence in me has affected the whole courseof my life, and I could not be more grateful.
I could not have gotten through the last 3 years without Hossein and Nikan, who arethe best lab mates I could have asked for. I will miss our long talks, and I so appreciate thesupport and fun that they provided.
I would also like to thank my colleague and friend, Pravallika Devineni, who has amind like a steel trap and keeps track of all the researcher-, conference-, and date-relateddetails that I never seem to be able to. She also taught me how to give a good presentation,which is something that will help me for my entire career.
Thank you to Terri Cheng, who is always just one Hangout message away and alwayskeeps me laughing.
Thank you so much to the University of New Mexico Computer Science Departmentfor its support. I feel that I have really come into my own as a confident academic, and Iattribute that to the kindness that I have received here.
Thank you to my brother, Austin Minnich, for being an inspiration to me in his workethic and his dedication to his family. He really showed me what was possible and throughhis own achievements gave me goals to aspire to. He also made it to both my MS andPhD graduations despite having young children who made both trips quite difficult, and Iappreciate that so much.
I would like to thank my dad, Ronald Minnich, for the limitless love he has shownme. No matter what I do, he thinks it is the greatest thing and never fails to share that factwith me. He has been there when I am feeling the worst to pick me back up and make mebelieve in myself again, and I am beyond lucky to have such a father.

iv
I will never be able to fully express the level of gratitude that I feel for my mother,Maya Gokhale, and the support she has given me throughout this degree. She is the firstperson I call when Jayson or I have any kind of issue, and she always puts her full effortinto helping us. Whether it was when I called her crying my first semester because Ididn’t understand what a method was in Java or when I was pushing to meet the last paperdeadline of my PhD, she has always been there, confident in my abilities and ready withthe dose of reality that I needed, along with the knowledge for how to solve the problemat hand. Thank you Mom, for all that you do.
Thank you to my dogs, Archimedes and Nala, who showered me with love and affec-tion at all times, and helped to get me out of the house and onto the trails.
And lastly, thank you to my husband Jayson Grace, whom I love more than life andwho pushes me to be a better person every day. We have both come a long way in the pastsix years, and I could not be more proud of us nor more excited for our future.

v
Spam, Fraud, and Bots: Improving theIntegrity of Online Social Media Data
by
Amanda Jean Minnich
B.A., Integrative Biology, University of California, Berkeley, 2009M.S., Computer Science, University of New Mexico, 2014
PhD, Computer Science, University of New Mexico, 2017
Abstract
Online data contains a wealth of information, but as with most user-generated content, it
is full of noise, fraud, and automated behavior. The prevalence of “junk” and fraudulent
text affects users, businesses, and researchers alike. To make matters worse, there is a lack
of ground truth data for these types of text, and the appearance of the text is constantly
changing as fraudsters adapt to pressures from hosting sites. The goal of my disserta-
tion is therefore to extract high-quality content from and identify fraudulent and
automated behavior in large, complex social media datasets in the absence of ground
truth data. Specifically, in my dissertation I design a collection of data inspection, fil-
tering, fusion, mining, and exploration algorithms to: automate data cleaning to produce
usable data for mining algorithms, quantify the trustworthiness of business behavior in on-
line e-commerce sites, and efficiently identify automated accounts in large and constantly
changing social networks. The main components of this work include: noise removal, data
fusion, multi-source feature generation, network exploration, and anomaly detection.
vi
Contents
List of Figures x
List of Tables xiv
1 Introduction 1
1.1 Noise removal . . . . . . . . . . . . . . . . . . . . . . . . . . . . . . . . 2
1.2 Behavioral profiling applied to fraud detection . . . . . . . . . . . . . . . 3
1.3 Efficient Adaptive Exploration of the Twitter Bot Network . . . . . . . . 4
1.4 Roadmap . . . . . . . . . . . . . . . . . . . . . . . . . . . . . . . . . . 5
2 ClearView: Cleaning Noisy and Spamming Reviews 6
2.1 Introduction . . . . . . . . . . . . . . . . . . . . . . . . . . . . . . . . . 6
2.2 Background . . . . . . . . . . . . . . . . . . . . . . . . . . . . . . . . . 7
2.3 Related Work . . . . . . . . . . . . . . . . . . . . . . . . . . . . . . . . 9
2.4 Syntactic Cleaning . . . . . . . . . . . . . . . . . . . . . . . . . . . . . 9
2.5 Semantic Cleaning . . . . . . . . . . . . . . . . . . . . . . . . . . . . . 11

Contents vii
2.6 Rating Cleaning . . . . . . . . . . . . . . . . . . . . . . . . . . . . . . . 13
2.6.1 Classifiers . . . . . . . . . . . . . . . . . . . . . . . . . . . . . . 13
2.6.2 Iterative Training . . . . . . . . . . . . . . . . . . . . . . . . . . 14
2.7 Experimental Analysis . . . . . . . . . . . . . . . . . . . . . . . . . . . 15
2.7.1 Data Description . . . . . . . . . . . . . . . . . . . . . . . . . . 15
2.7.2 User Study . . . . . . . . . . . . . . . . . . . . . . . . . . . . . 16
2.7.3 Rating Noise Filtering Results . . . . . . . . . . . . . . . . . . . 16
2.7.4 Results of Overall Pipeline . . . . . . . . . . . . . . . . . . . . . 19
2.7.5 Sensitivity and Scalability . . . . . . . . . . . . . . . . . . . . . 20
2.8 Conclusion . . . . . . . . . . . . . . . . . . . . . . . . . . . . . . . . . 22
3 TrueView: Ranking Hotels Based on Trustworthiness 23
3.1 Introduction . . . . . . . . . . . . . . . . . . . . . . . . . . . . . . . . . 23
3.2 Related Work . . . . . . . . . . . . . . . . . . . . . . . . . . . . . . . . 26
3.3 Location Disambiguation . . . . . . . . . . . . . . . . . . . . . . . . . . 28
3.3.1 Challenges . . . . . . . . . . . . . . . . . . . . . . . . . . . . . 28
3.3.2 Disambiguation techniques . . . . . . . . . . . . . . . . . . . . . 29
3.4 Novel Feature Set . . . . . . . . . . . . . . . . . . . . . . . . . . . . . . 31
3.4.1 Reviewer-Centric Features . . . . . . . . . . . . . . . . . . . . . 31
3.4.2 Hotel-Centric Features . . . . . . . . . . . . . . . . . . . . . . . 34
3.4.3 Review-Centric Features . . . . . . . . . . . . . . . . . . . . . . 38

Contents viii
3.4.4 Cross-Site Feature Preparation . . . . . . . . . . . . . . . . . . . 40
3.5 Trustworthiness Score . . . . . . . . . . . . . . . . . . . . . . . . . . . . 40
3.5.1 Outlier Scores . . . . . . . . . . . . . . . . . . . . . . . . . . . . 41
3.5.2 TrueView Scores . . . . . . . . . . . . . . . . . . . . . . . . . . 43
3.6 Experimental Analysis . . . . . . . . . . . . . . . . . . . . . . . . . . . 44
3.6.1 Parameter Sensitivity . . . . . . . . . . . . . . . . . . . . . . . . 44
3.6.2 Feature Importance . . . . . . . . . . . . . . . . . . . . . . . . . 45
3.6.3 Validation . . . . . . . . . . . . . . . . . . . . . . . . . . . . . . 46
3.7 Case Studies . . . . . . . . . . . . . . . . . . . . . . . . . . . . . . . . . 49
3.8 Conclusion . . . . . . . . . . . . . . . . . . . . . . . . . . . . . . . . . 53
4 BotWalk: Efficient Adaptive Exploration of Twitter Bot Networks 54
4.1 Introduction . . . . . . . . . . . . . . . . . . . . . . . . . . . . . . . . . 54
4.2 Related Work . . . . . . . . . . . . . . . . . . . . . . . . . . . . . . . . 56
4.3 Framework . . . . . . . . . . . . . . . . . . . . . . . . . . . . . . . . . 57
4.4 Feature Selection and Data Collection . . . . . . . . . . . . . . . . . . . 59
4.4.1 Metadata-based features . . . . . . . . . . . . . . . . . . . . . . 60
4.4.2 Content-based features . . . . . . . . . . . . . . . . . . . . . . . 61
4.4.3 Temporal-based features . . . . . . . . . . . . . . . . . . . . . . 62
4.4.4 Network-based features . . . . . . . . . . . . . . . . . . . . . . 62
4.4.5 Feature selection and normalization . . . . . . . . . . . . . . . . 63

Contents ix
4.4.6 Publicly-available dataset . . . . . . . . . . . . . . . . . . . . . 64
4.5 Ensemble Anomaly Detection . . . . . . . . . . . . . . . . . . . . . . . 64
4.5.1 Anomaly Detection Algorithms . . . . . . . . . . . . . . . . . . 65
4.5.2 Combining different anomaly detection scores . . . . . . . . . . 67
4.5.3 Applying domain knowledge to improve performance . . . . . . 68
4.6 Experimental Analysis . . . . . . . . . . . . . . . . . . . . . . . . . . . 68
4.6.1 Real-time data collection . . . . . . . . . . . . . . . . . . . . . . 68
4.6.2 Experimental Design . . . . . . . . . . . . . . . . . . . . . . . . 69
4.6.3 Validation . . . . . . . . . . . . . . . . . . . . . . . . . . . . . . 70
4.7 Conclusion . . . . . . . . . . . . . . . . . . . . . . . . . . . . . . . . . 79
5 Conclusion 81
References 83
x
List of Figures
2.1 (top row) Unintelligible reviews. (second row) Repeated text, spamming
content, and non-English reviews (third row) Positive rating with nega-
tive text (bottom row) Negative rating with positive text . . . . . . . . . 8
2.2 The distribution of semantic scores. . . . . . . . . . . . . . . . . . . . . 12
2.3 Starting with the Sentiment tree bank we will append training data where
human and the classifier agree and continue until convergence. Arrows
represent flow of review data. . . . . . . . . . . . . . . . . . . . . . . . 14
2.4 Overall experimental design. . . . . . . . . . . . . . . . . . . . . . . . 16
2.5 Iterative training results for TripAdvisor . . . . . . . . . . . . . . . . . 17
2.6 Distribution of the number of words in Google Play reviews before and
after filtering. . . . . . . . . . . . . . . . . . . . . . . . . . . . . . . . 20
2.7 Distribution of the number of characters in TripAdvisor titles before and
after filtering. . . . . . . . . . . . . . . . . . . . . . . . . . . . . . . . 21
2.8 Rating distributions of Google Play reviews before and after filtering . . 21

List of Figures xi
3.1 (left) Locations of the hotels the user AmishBoy reviewed around Lan-
caster, PA in TA (right) A snapshot of the reviews tonyk81 wrote in TA.
He left a total of 29 reviews January 22, 2006 for businesses located
across 15 states. . . . . . . . . . . . . . . . . . . . . . . . . . . . . . . 32
3.2 (a) Six reviews for Super 8 hotel in Indiana in the same day (October
19, 2012), all positive, and five of them are singleton reviews where the
authors have not reviewed again in TA. (b) The number of reviews per
day for a this hotel jumps to 6 on that day which was sufficient to give
the hotel a 0.5 star boost in the average rating showing in red. (c) Imme-
diate 5-star ratings after 1-star ratings are frequent in some hotels such as
Cherry Lane Motor Inn in Amish Country. (d) Examples of two succes-
sive opposite reviews on the same day from two reviewers. . . . . . . . 34
3.3 (left) The time series of number of ratings per day for three hotels in
Myrtle Beach, SC. The top two hotels show summer peaks in both TA
and HDC. The bottom hotel does not show any summer effect in HDC.
(top right) Distribution of correlation between ratings of hotels in TA and
HDC. . . . . . . . . . . . . . . . . . . . . . . . . . . . . . . . . . . . . 36
3.4 Distribution of ratings for the same hotel in two websites showing nega-
tive correlation. . . . . . . . . . . . . . . . . . . . . . . . . . . . . . . 37
3.5 Negatively correlated hotels are more abundant in the vicinity of Atlanta,
GA and almost non-existent in Las Vegas, NV area where both the cities
have more than three hundred hotels. . . . . . . . . . . . . . . . . . . . 38
3.6 (left) Percentage of outliers detected in the density-based method as we
vary ✏. (right) The same as we vary neighborhood size k in the LOF
method. . . . . . . . . . . . . . . . . . . . . . . . . . . . . . . . . . . 45
3.7 Feature importance percent scores for our 142 features. Cross-site fea-
tures are more overall important than single-site features. . . . . . . . . 46

List of Figures xii
3.8 Relative importance of review-,reviewer- and hotel-centric features based
on the distance from the centroid. . . . . . . . . . . . . . . . . . . . . . 473.9 (left) Distribution of the number of extreme features (95th percentile)
in the bottom 100 hotels in TrueView ordering (right) Distribution of
the same in the top 100 hotels in TrueView ordering. Distributions are
significantly different. . . . . . . . . . . . . . . . . . . . . . . . . . . . 48
3.10 Empirical cumulative distribution function of TrueView scores. . . . . . 49
3.11 Dissimilar distribution of ratings, temporal bursts in number of ratings
per day and frequent empty reviews are just a few of the suspicious fea-
tures that characterize this hotel. . . . . . . . . . . . . . . . . . . . . . 51
4.1 Overall framework of our bot identification algorithm . . . . . . . . . . 58
4.2 Follower relationships between Twitter bots. Node colors represent
highly-correlated activity stream clusters (see Section 4.6.2). Note the
highly-connected nature of many of the bots. . . . . . . . . . . . . . . . 63
4.3 Distribution of number of extreme features for 17,000 randomly-selected
users versus BotWalk-detected outliers. BotWalk-detected anomalous
users have many more ‘extreme’ feature values when compared to ran-
dom users. . . . . . . . . . . . . . . . . . . . . . . . . . . . . . . . . . 73
4.4 Zoomed in view of the distribution of the number of extreme features
for outliers detected in the 4 experiments. Partitioned anomaly detection
methods identify outliers with more ‘extreme’ feature values. . . . . . . 74
4.5 Comparison of of the distribution of the number of extreme features for
exploration Levels 1, 2, and 3. Level 1 anomalies have a different extreme
feature distribution compared to Level 2 and Level 3 anomalies, which
are very similar. . . . . . . . . . . . . . . . . . . . . . . . . . . . . . . 74

List of Figures xiii
4.6 Distributions of number of tweets per user. . . . . . . . . . . . . . . . . 75
4.7 Distribution of the maximum inter-arrival time per user. . . . . . . . . . 76
4.8 Distributions of out-degree of the ego network per user. . . . . . . . . . 77

xiv
List of Tables
2.1 Results of syntax filtering process. . . . . . . . . . . . . . . . . . . . . 11
2.2 Summary of the datasets. . . . . . . . . . . . . . . . . . . . . . . . . . 15
2.3 Sample of reviews identified as inconsistent through iterative sentiment
classification. . . . . . . . . . . . . . . . . . . . . . . . . . . . . . . . 18
2.4 Results of the ClearView pipeline for the TripAdvisor and Google Play
datasets. . . . . . . . . . . . . . . . . . . . . . . . . . . . . . . . . . . 19
3.1 Simple Statistics of the three datasets collected from three prominent
travel websites. . . . . . . . . . . . . . . . . . . . . . . . . . . . . . . . 30
3.2 p-values of Wilcoxon rank-sum test. Bold faced values mean that there
is a significant difference between the top and bottom 40. . . . . . . . . 48
3.3 TrueView scores for suspicious hotels. . . . . . . . . . . . . . . . . . . 50
3.4 TrueView scores for hotels from Hotels.com. . . . . . . . . . . . . . . . 52
4.1 Description of feature set before and after feature selection is performed. 60
4.2 Statistics of our publicly-available dataset . . . . . . . . . . . . . . . . 63
4.3 Results from the user study for the four anomaly detection methods and
the three levels of exploration. . . . . . . . . . . . . . . . . . . . . . . . 71

List of Tables xv
4.4 Percentage of features that have matching distributions . . . . . . . . . . 78
4.5 Detection levels of new bots by known methods . . . . . . . . . . . . . 79

1
Chapter 1
Introduction
We are currently in the age of information overload. The Internet has moved from static
pages to those containing dynamic user-generated content. This gives us increased inter-
activity and information, but also has a downside: in the online sphere, we are deluged by
junk. The rate of data creation is high, but the quality of the data is low. In a world where
people can post whatever they want on virtually every web page they interact with, the
result is noisy, messy, illegible, unintelligible, and at times spamming and fraudulent data.
Whether through negligence or desire for monetary gain, it is hard to understand, much
less trust, much of what you see online.
This lack of trust affects users, businesses, and researchers alike. Users who do
not know any better receive misinformation that can affect their understanding of cur-
rent events, their purchasing decisions, and their perception of the world at large. Busi-
nesses mining these data can at worst get a false view of their clientele if the data are
fraudulent and at best waste time and resources trying to sift through these noisy, messy
data [1][7][14]. Researchers who are trying to learn broad principles about social networks
and user behavior face similar issues, both obtaining spurious results based on fraudulent
behavior and spending large amounts of time cleaning the data to make it usable for their
algorithms. This cleaning and sifting process is repeated over and over by different groups,
Chapter 1. Introduction 2
which is wasteful to an extreme degree. This problem is a severe one, and as the number of
users and the amount of content they generate grow, finding quality and trustworthy con-
tent in the midst of noise becomes increasingly difficult. Furthermore, in addition to the
volume and low quality of data, there often exists no ground truth with which to validate
findings.
For my PhD dissertation, I designed a collection of data inspection, filtering, fusion,
and mining techniques to identify and remove low quality and fraudulent content from
online data. The main components of this work include: noise removal, data fusion, multi-
source feature generation, network exploration, and anomaly detection. All data collected
and code written for this work have been made available to the research community at
large.
There are many types of online data that can take advantage of the analysis techniques
that are presented in this dissertation. For the case studies in my dissertation, I focus on
online review and Twitter data. These types of data contains rich text, complex user net-
works, and are highly longitudinal, allowing for time series analysis as well. Furthermore,
unlike social media sites like Facebook, with strong privacy controls, it is relatively easy
to collect a review system in its entirety, and Twitter has an API specifically designed for
data collection. Furthermore, the inclusion of financial motivations for reviews and tweets,
including fake reviews or check-ins to encourage patronage as well as the use of referral
codes to receive monetary rewards, increases the likelihood of spamming and fraudulent
behavior, making these the perfect online data sources on which to test my fraud-detection
algorithms.
1.1 Noise removal
Broadly, data contamination can be viewed in two categories: noise and deliberate misrep-
resentation. Both of these are a hindrance to extracting value and meaning. To identify and
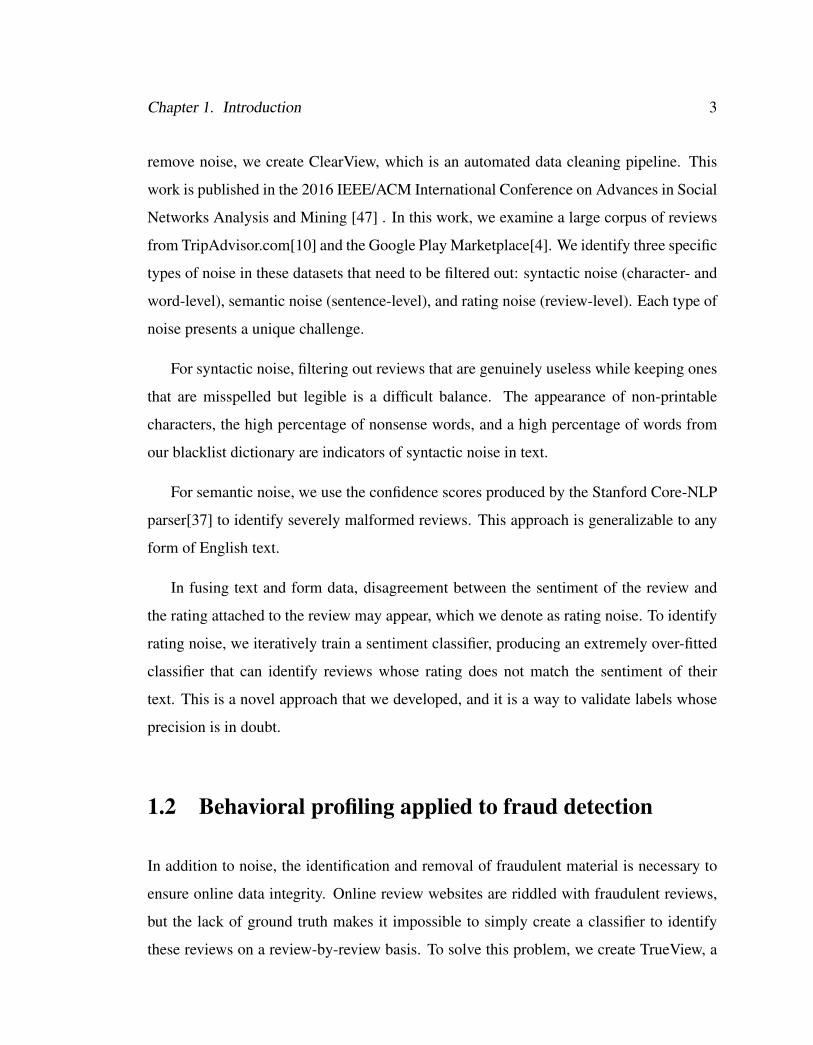
Chapter 1. Introduction 3
remove noise, we create ClearView, which is an automated data cleaning pipeline. This
work is published in the 2016 IEEE/ACM International Conference on Advances in Social
Networks Analysis and Mining [47] . In this work, we examine a large corpus of reviews
from TripAdvisor.com[10] and the Google Play Marketplace[4]. We identify three specific
types of noise in these datasets that need to be filtered out: syntactic noise (character- and
word-level), semantic noise (sentence-level), and rating noise (review-level). Each type of
noise presents a unique challenge.
For syntactic noise, filtering out reviews that are genuinely useless while keeping ones
that are misspelled but legible is a difficult balance. The appearance of non-printable
characters, the high percentage of nonsense words, and a high percentage of words from
our blacklist dictionary are indicators of syntactic noise in text.
For semantic noise, we use the confidence scores produced by the Stanford Core-NLP
parser[37] to identify severely malformed reviews. This approach is generalizable to any
form of English text.
In fusing text and form data, disagreement between the sentiment of the review and
the rating attached to the review may appear, which we denote as rating noise. To identify
rating noise, we iteratively train a sentiment classifier, producing an extremely over-fitted
classifier that can identify reviews whose rating does not match the sentiment of their
text. This is a novel approach that we developed, and it is a way to validate labels whose
precision is in doubt.
1.2 Behavioral profiling applied to fraud detection
In addition to noise, the identification and removal of fraudulent material is necessary to
ensure online data integrity. Online review websites are riddled with fraudulent reviews,
but the lack of ground truth makes it impossible to simply create a classifier to identify
these reviews on a review-by-review basis. To solve this problem, we create TrueView, a

Chapter 1. Introduction 4
metric for the “trustworthiness” of a given entity’s review behavior. This work, as applied
to hotel reviews, was published in the 24th International World Wide Web Conference in
2015[48], and the method was officially patented in 2016[42].
Our approach to detecting fraud leverages the fusion of multiple sources to create
cross-site features. Using cross-site features leads to a more thorough and comprehen-
sive behavior profile of the entity being reviewed, leading to better support for anomaly
detection. When combining data from multiple sources, disambiguating attribute values
in common is a challenging problem. We developed a novel method to match hotels us-
ing latitude and longitude, with which we annotated the large hotel dataset using Google’s
Geocoding API, and a text comparison measure similar to length-normalized edit distance.
This technique is generalizable to any data fusion task where the entities have a name and
a location.
Lastly, we generated a new metric, TrueView, that identifies entities that have unusual
behavior profiles both within and across sites. This score was based on an ensemble of
anomaly detection algorithms, which allowed us to find entities that were anomalous in
different ways. We included a global density-based measure, a local density-based mea-
sure, and a global distance-based measure. We also develop methods to validate our find-
ings in the absence of absolute ground truth.
1.3 Efficient Adaptive Exploration of the Twitter Bot Net-
work
In addition to businesses themselves generating fraudulent content directly, they also can
create automated accounts on social media, called ‘bots,’ to push out sponsored or spam-
ming content. More than a billion people use online social networks, and the presence
of bots compromises the empowerment of these online social communities. An estimated
8.5% of Twitter accounts are bots [62] and the number of bots is growing at a higher rate
Chapter 1. Introduction 5
than the rate at which Twitter removes them. Furthermore, due to suspension pressure,
Twitter bots are constantly changing their behavior to evade detection, which renders tra-
ditional supervised methods ineffective.
To address this problem, we create BotWalk, a near-real time unsupervised adaptive
Twitter exploration framework. This work is arguably the first to employ an unsupervised
approach to intelligently explore the Twitter network and identify bots exhibiting novel
behavior, and will be published at the 2017 IEEE/ACM International Conference on Ad-
vances in Social Networks Analysis and Mining.
Key contributions of this work are the implementation of an adaptive approach to fea-
ture selection and the utilization of domain knowledge to intelligently partition the feature
space, which leads to up to a 30% increase in precision. We perform experiments to evalu-
ate the performance of an ensemble of outlier detection algorithms, achieving an precision
of 90%. We also perform three levels of iterative exploration and show that we are able to
identify bots that exhibit different behavior than the seed users at a higher detection rate
than existing methods.
1.4 Roadmap
This dissertation proceeds as follows: Chapter 2 describes techniques to remove noise
from online review data (ASONAM 2016), Chapter 3 discusses data fusion, feature ex-
traction, and anomaly detection in online review data (WWW 2015), Chapter 4 discusses
network exploration and adaptive bot detection in a huge and rapidly changing network
(ASONAM 2017), and Chapter 5 concludes the work.

6
Chapter 2
ClearView: Cleaning Noisy and
Spamming Reviews
2.1 Introduction
Online reviews form a unique source of unbiased information about products and services
for consumers, manufacturers, distributors, and sellers. Online reviews have been ana-
lyzed and mined for over a decade to extract useful knowledge such as opportunities to
improve services [14] and business planning [7]. Hosting sites have also evolved to collect
various forms of information from mass consumers, such as star ratings, review text, and
helpfulness ratings.
Online reviews are typically noisy and contain many types of abnormalities. In Figure
2.1, we show a set of noisy reviews that contain no informative content. The top row
shows a set of un-intelligible reviews where meaningless sequences of English characters
are posted as legitimate reviews in the Google Play Marketplace. It also shows a review
in Russian, which, while valid content, is not meaningful to English-speaking audiences.
The second row shows repeated text, inconsistently rated reviews in which the sentiment

Chapter 2. ClearView: Cleaning Noisy and Spamming Reviews 7
in the text is the opposite of the rating, and a review containing promotional content and
non-Unicode characters masquerading as standard English characters.
Noisy reviews appear in almost every kind of hosting system, including tourism, e-
commerce[10], real-estate[15], and mobile apps[4]. Surprisingly, there is no formal clean-
ing process for online reviews that can be generically applied before presenting them to
consumers or mining them for knowledge discovery. The absence of clean reviews may
lead to flawed marketing strategies[1] and lack of trust in customers[48].
In this chapter, we discuss various types of abnormalities that exist in different review
sites and develop filtering techniques to clean them. Our methods use natural language
processing (NLP) parsers and classifiers targeting three kinds of noise. To evaluate the
efficacy of our cleaning process, we conduct a user study and find that our pipeline im-
proves the quality of the dataset by up to 3.4 times. We also examine the distributions
of features that have been shown to identify abnormal and fraudulent behavior in online
review hosting sites[48]. We show that our cleaning technique standardizes these feature
distributions and improves the quality of the reviews for knowledge discovery processes.
2.2 Background
Online reviews for products and services are written by consumers with the intention of
helping people make informed decisions when making a purchase. Natural variations in
reviews occur because of the diverse backgrounds of the writers. However, fake reviews,
incentivized reviews, and revengeful reviews introduce unique anomalous variations.
We identify three major types of variations that appear in almost all review datasets.
We describe the categories below.
Syntactic Noise Reviewers often make syntactic errors. For example, misspelled words,
nonsense words, and slang are commonly used in the review space. Another example

Chapter 2. ClearView: Cleaning Noisy and Spamming Reviews 8
Figure 2.1: (top row) Unintelligible reviews. (second row) Repeated text, spamming con-tent, and non-English reviews (third row) Positive rating with negative text (bottom row)Negative rating with positive text
is using non-standard characters to write English words, with the intention of defeating
content-based filtering (see Section 2.4).
Semantic Noise Reviewers often write incorrect sentences that are not intelligible. Such
reviews can be the result of automated text completion during typing, or can simply be due
to the negligence of the reviewer.
Rating Noise Sometimes the review text consists of well-formed, meaningful sentences,
but the star-rating accompanying the text does not match the text sentiment. Such reviews
are confusing for the reader and not trustworthy. Furthermore, using the rating as a feature
or label in a data mining algorithm for reviews with this type of noise would lead to
erroneous results.

Chapter 2. ClearView: Cleaning Noisy and Spamming Reviews 9
We develop detection and filtering techniques for each type of noise.
2.3 Related Work
Current research on online reviews can broadly be classified based on methodology and
application. Researchers have developed topic discovery [46] and sentiment classification
[56] methods from review text. Connecting users, products and reviews in an information
network is another promising method to analyze reviews [18]. Researchers have applied
these methods for fraud detection [50] and recommending products [46].
Current text-cleaning pipelines tend to be limited and interactive [39]. They are de-
signed to prepare text for use in single algorithm specified by a data analyst, rather than
for general use. Existing data cleaning pipelines are created in an iterative [34] rather than
fully automated way. Thus, our method is arguably the first attempt to automatically filter
and normalize noisy and useless reviews.
2.4 Syntactic Cleaning
We perform two types of syntactic cleaning: character-level cleaning and word-level clean-
ing.
Character-level cleaning When examining samples of Google Play reviews, we find
many reviews that contain non-Unicode characters masquerading as normal text. We be-
lieve that this is done in an attempt to evade keyword filters which are used to detect spam-
mers. For example, in the reviews for the app Key Ring: Cards Coupon & Sales, a user
left the review shown in Figure 2.1, bottom right. Although it looks normal in the Google
Play site, when the text is processed by the LaTeX compiler it reads: “Cool ! Also
try "WILD WLL" - Mon Online! Downld "Wild Wllt" Right Now!

Chapter 2. ClearView: Cleaning Noisy and Spamming Reviews 10
Do not forget to ntr nus d: 1050157.” This is because the review con-
tains many words that are hiding non-Unicode characters. These are words that a filter may
be looking for because they indicate a spamming behavior: money, wallet, code, bonus,
enter, and app. This user has left 11 other reviews with this same signature. We catch
such reviews by checking if the characters in the review are printable, which is defined as
digits, letters, punctuation, and whitespace. If the percentage of such non-printable char-
acters (including non-English characters) is above a tunable threshold, we view the review
as not informative and filter out the review. Using a strict threshold value removes a large
number of syntactically unusable reviews.
Word-level cleaning At the word level, we check for black-listed keywords, abnormal
repetitions, and meaningless words. There are only a few valid reasons to have a long se-
quence of alpha-numerals in a review. Reviewers may identify the price, model, and fea-
ture of a product in their review to describe their experience. However, such alpha numer-
als are also a sign of abusive reviews. For example, personal ID or code for referral rewards
and promotions are advertised via reviews, e.g. Please enter my code 8zl12j
to help us both get rewards! We filter such reviews by identifying the per-
centage of words that are in a set of black-listed keywords we compiled. This black-list
contains words that most often represent abusive behavior, for example, promo-code,
invitation code, and HTTP, among many others.
We also check for abnormal repetition of a word or phrase. Some reviewers just copy
and paste words such as good, great, and nice many times. Such reviews contain very
little information compared to the length of the review.
Another type of useless review we see is reviews comprised mainly of nonsense words.
There are many ways meaningless words are written. Sometimes authors use English let-
ters to write another language, which, while obviously containing meaning, is not infor-
mative for English-only reader or a natural-language processing algorithm. Authors also
invent spellings, such as the use of nyc to represent the word nice, the use of gr8

Chapter 2. ClearView: Cleaning Noisy and Spamming Reviews 11
to represent the word great, and so on. Reviews that primarily consist of such words
contain little-to-no usable information about the product, especially from a text analysis
perspective. Using the Enchant library from Python, we identify the percentage of words
in the sentence that are in its large corpus of English words. Since reviews often contain
misspelled words or colloquial words not in this corpus, we set a threshold for our filter: if
less than a threshold of the words in a review are in this corpus, then the review is filtered
out. This threshold is a tunable parameter that can be set depending on the end usage of the
text: sentiment classification needs a high threshold, compared to robust clustering which
requires a lower threshold. We find that the Google Play dataset contains a much greater
percentage of reviews with syntactic errors than the TripAdvisor dataset. A threshold of
90% correctness works well for TripAdvisor reviews, but is much too strict for Google
Play reviews. We find that a threshold of 50% is more appropriate for these. Table 2.1
shows the results from this part of the pipeline.
FullDataset
Non-PrintablePercent
MisspelledPercent
FinalCount
TripAdvisor,90% threshold 3,167,036 0.32% 24.4% 2,292,761
Google Play,90% threshold 21,112,036 26.85% 69.99% 653,866
Google Play,50% threshold 21,112,036 26.85% 22.15% 10,754,606
Table 2.1: Results of syntax filtering process.
2.5 Semantic Cleaning
To identify nonsensical reviews, we analyze the semantic structure of the sentences in a
review. We use the Stanford CoreNLP Parser[37] to label words with part-of-speech tags
and to parse sentences into tree structures. We use the confidence score of the parser as a

Chapter 2. ClearView: Cleaning Noisy and Spamming Reviews 12
B.Bootybootybootybootybootybootybootybootybootybootybootybootybootybootybootybootybootybootybootybootybootybootybootybootybooty...
I'llgive5starsiftheproblemissolved.
Figure 2.2: The distribution of semantic scores.
measure of the semantic correctness of a sentence. The lower the score, the less likely that
the sentence is valid. For example, for the first review in Figure 2.1, the second sentence
contains mostly valid words but does not make any sense: “From me our toward u
eyes on me owned yourself to him but needed not known seems
burl.” The tree generated for this sentence is: From/IN me/PRP our/PRP toward/IN
u/NN eyes/NNS on/IN me/PRP owned/VBN yourself/PRP to/TO him/PRP but/CC needed
/VBN not/RB known/VBN seems/VBZ burl/JJ ./. and the score is �174.3. If we compare
this with a sentence found in many reviews: “I highly recommend it.”, we get a much
higher score of �33.9 because the tree is forms is highly probable: I/PRP highly/RB rec-
ommend/VBP it/PRP ./. In Figure 2.2, we show the distribution of scores of the sentences
of all reviews. Note the log scale in the y-axis.
Chapter 2. ClearView: Cleaning Noisy and Spamming Reviews 13
2.6 Rating Cleaning
The second row of Figure 2.1 shows reviews in which the sentiment of the text does not
match the rating.
We develop a method to clean such reviews by using an ensemble of sentiment clas-
sifiers. We use the sentiment classifiers to iteratively label the sentiment of the reviews to
obtain the maximal agreement with the user-given ratings. When a writer and the classi-
fiers agree on the sentiment, the review is more likely to be high quality. However, when
they mismatch, it can be either writer error or classifier error. For cleaning purposes, pre-
cision is more important than recall rate. Hence, we remain strict on absolute consensus.
2.6.1 Classifiers
The first classifier, Stanford’s Sentiment Classifier in the CoreNLP suite
[44][61], is widely acknowledged to be a top-performing sentiment classifier. This recur-
sive neural tensor net classifier stores sentences in a parsed tree format, rather than the
typical bag-of-words approach. This allows the classifier to take the sentence structure
into account when classifying sentiment. While this approach is thorough, it is also quite
slow, requiring weeks to train and classify our full datasets.
The second classifier we use is based on [52]. This classifier is a simple Naive Bayes
classifier that is smart enough to handle both negation and double negation, and adds a
negated form of the word to the opposing class’s word bank (e.g. if “good” occurs in a
review with a positive label, it adds “not good” to the negative class). This algorithm also
uses bigrams and trigrams in addition to unigrams to further improve performance. Lastly,
low-occurring words are pruned at the end of every training round.
We added in the capability for 5-class classification and iterative training to both of
these classifiers, as well as input and output pipelines including customizable performance
Chapter 2. ClearView: Cleaning Noisy and Spamming Reviews 14
SentimentClassifier
Reviews
Newtrainingset
Rating and machine
agreeRating and machine disagree
Train
Test
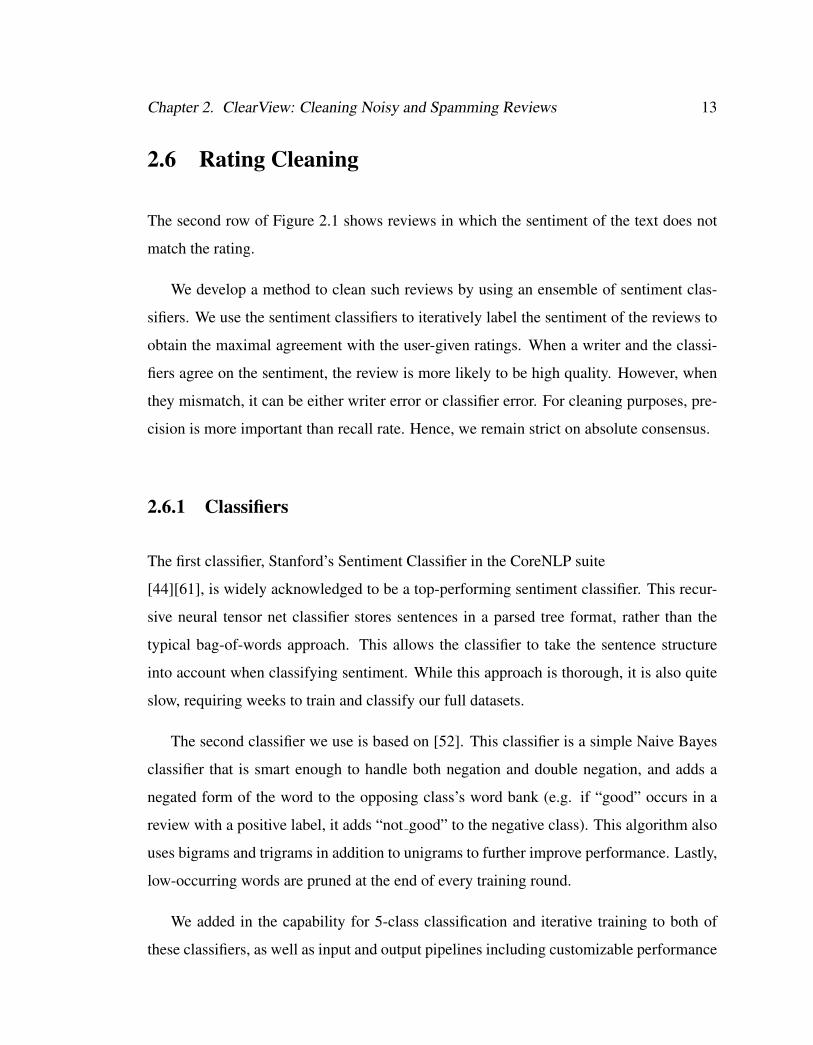
Figure 2.3: Starting with the Sentiment tree bank we will append training data wherehuman and the classifier agree and continue until convergence. Arrows represent flow ofreview data.
visualizations. Note that both of the classifiers rate individual sentences; we aggregate the
ratings to calculate one score for a review that may contain many sentences based on the
sentence scores normalized by the sentence lengths.
2.6.2 Iterative Training
The process starts with a classifier trained on the Standard Tree Bank[60]. This tree
bank contains more than 11,000 sentences from movie reviews on RottenTomatoes.com.
215,000 individual phrases of these sentences were manually labeled from “Very Nega-
tive” to “Very Positive.” We train a classifier on these data and then generate sentiment
labels for our reviews using this classifier. We then form a training set of reviews whose
sentiment scores match the user-given ratings. Reviews whose sentiment scores do not
match their ratings form the new test set. To improve the classifier, we then train the cur-
rent classifier using the new training set and evaluate its performance on the new test set.
We continue this process iteratively, adding matched reviews to the training set at every
iteration. When the process converges, we have an extremely overfitted sentiment classi-
fier that has almost memorized the noisy set, excluding the reviews remaining in the test

Chapter 2. ClearView: Cleaning Noisy and Spamming Reviews 15
set. The leftover test set is more likely to contain erroneous cases, as even an overfitted
classifier has failed to classify its members correctly.
We overfit two classifiers using the above process and filter out any reviews that have
a single disagreement between the sentiment labels and the user-given rating.
2.7 Experimental Analysis
2.7.1 Data Description
Two datasets were used for the experiments described in this section. The first dataset
consists of reviews from TripAdvisor.com. We collected all the reviews and associated
information for almost all of the US hotels on this site. For the second dataset, we collected
reviews and their associated information from nearly all of the applications in the Google
Play Store. A summary of the whole dataset is given in Table 2.2.
TripAdvisor.com Google Play Store
Number of reviews 11,275,833 50,358,932Number of Hotels or Apps 52,696 1,057,497
Number of users 1,462,460 23,575,301Average number of reviews 213.98 47.62
Average rating 3.35 3.80Date range 09-30-2009 - 05-17-2014 06-2014 - 07-2014
Table 2.2: Summary of the datasets.

Chapter 2. ClearView: Cleaning Noisy and Spamming Reviews 16
Subsetof60,000reviews
Finalsetofreviews
Entirereviewdataset
Syntactic Filtering
Semantic filtering
Rating noise filtering
Subsetof10,000reviewsLabeled by
Turkers
GroundTruth
Figure 2.4: Overall experimental design.
2.7.2 User Study
We run these datasets through the ClearView pipeline and filter out 874,275 malformed
reviews from the TripAdvisor dataset and 10,357,430 from the Google Play dataset. We
then perform semantic filtering and rating validation for a randomly selected subset of
60,000 reviews from each of our filtered datasets.
We also randomly select 10,000 reviews from each subset to evaluate in our user study.
For this study, we use the Amazon Mechanical Turk Marketplace to have readers evaluate
the sentiment of 10,000 reviews from each dataset. We require three different Turkers
to score each review and average these scores. The annotators can pick a score from 1-
5, just like the ratings on review websites, and we provide text examples for each rating
classification to standardize the scoring process.
2.7.3 Rating Noise Filtering Results
This user study allows us to both validate the performance of the sentiment classifier and
the filtering process as whole. Figure 2.5 shows the convergence of the sentiment clas-
sifiers over 20 training rounds for the TripAdvisor dataset. Note that the Naive Bayes

Chapter 2. ClearView: Cleaning Noisy and Spamming Reviews 17
Figure 2.5: Iterative training results for TripAdvisor
classifier starts out with lower precision but surpasses the performance of the neural net
classifier after a few training iterations. Furthermore, the entire 20 rounds ran in a few
minutes for this Naive Bayes classifier, as opposed to days for the neural net. We find
that Google Play reviews are much more difficult to properly classify. They contain many
more colloquialisms than the TripAdvisor reviews and have less consistent structure. Ta-
ble 2.3 shows some examples of rating noise identified using this filtering process. We
find that many of these examples have to do with some kind of app update or change in the
entity being reviewed. Thus, this method could potentially be utilized by app developers
to find reviews describing update issues. This would help them to more quickly assist with
remediation of the issue and could lead to an increase in customer satisfaction.

Chapter 2. ClearView: Cleaning Noisy and Spamming Reviews 18
Review Writer Turker NLP
I cant log in...i try to update the game but i still cant log in.please fix this bug.
5 1 1.67
beautiful view of the lake and really enjoyed sitting on ourprivate balcony. free wifi and no problems...
1 4 4.19
Loving it. Not too long ago i mention to the developers thatthe game was crashing out on my galaxy note 2 it seems likethey fixed it so now i’m playing the game again thank you.
3 4.33 5
Back to a 5 star status. Plus a cookie for devs who care abouttheir product. my s5 went back to the store for fixing andduring this process they performed a factory reset. i don’thave the issue anymore and can’t replicate the previous issueeither so i am back to a happy customer!
1 4 5
Try star girl. You guys won’t get disappointed trust me hasbeautiful clothes. you can join in contest once you reachlevel 5. i’ve been playing celebrity story trust me i’m atlevel 7 there’s not even a contest. try out star girl.
2 4 5
I cant log in. One month ago i can log in and play. but nowit says authentication failed. i try to update the game but istill cant log in. please fix this bug.
5 1.67 1
I cant play the game. Is anybody know how to fix it and iwill appriciate it if somebody could let me know how to fixit thank you for the attention and maybe you need space forthe game in internal storage.
3 1.67 1
Latest update keeps crashing. This is annoying especiallywhen im trying to make use of the mobile coupon and theapp keeps crashing when i want to make payment. thiscauses multiple payments deducted from my account but notcaptured on the system.
3 1.67 1
Game hanging. Remove the halloween update. the game ishanging a lot. and the bike is going in slow motion.
5 2 1
Crashes without reason. I’ve gotten a new phone yesterdayand immediately installed this. today it’s begun to crashmultiple times even though i’ve closed all other apps. it’dbe nice if you fixed this. otherwise a very good game. i lovethe animations!
4 2 1
Table 2.3: Sample of reviews identified as inconsistent through iterative sentiment classif-ication.

Chapter 2. ClearView: Cleaning Noisy and Spamming Reviews 19
2.7.4 Results of Overall Pipeline
Full Dataset PercentFiltered
AgreementBefore Filtering
Agreement AfterFiltering
TripAdvisor 3,167,036 30% 17.7% 59.9%Google Play 21,112,036 70% 18.7% 36.9%
Table 2.4: Results of the ClearView pipeline for the TripAdvisor and Google Play datasets.
Table 2.4 shows the results of the ClearView filtering pipeline as a whole. We use the
agreement between the rating of the review and the averaged sentiment score from the
user study as a measure of the quality of the review. If a review is nonsensical, then it is
unlikely that the Turkers’ sentiment score would agree with the review’s rating. There-
fore an increase in ‘agreement’ signifies an increase in quality of the dataset. TripAdvisor
agreement increases from 17.7% to 59.9%, which is an over three times increase. Fur-
thermore, only 30% of the reviews were filtered, which is a reasonable level. Google Play
agreement increases from 18.7% to 36.9%, which is a two times increase. Considering the
highly noisy nature of app reviews, this represents a significant improvement. However,
70% of the dataset had to be filtered out to achieve this improvement. This suggests that
for text typed on mobile phones, filtering individual sentences on a review level may be
more effective than filtering whole reviews.
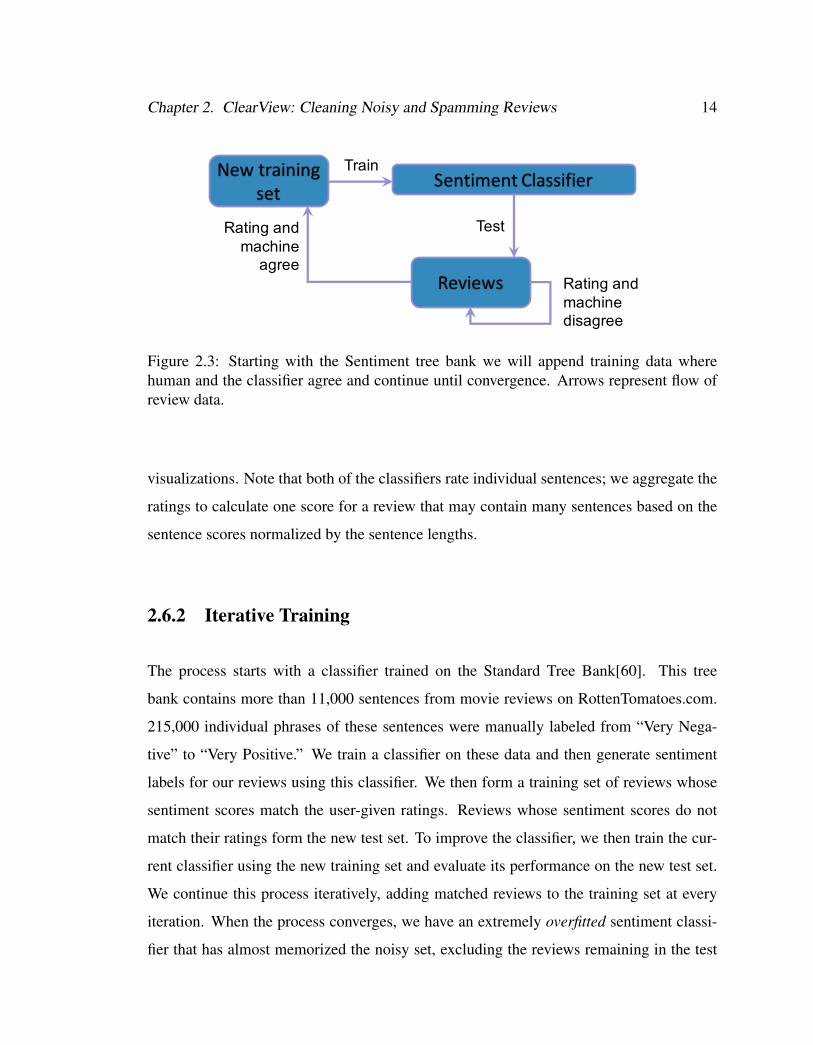
Figures 2.6, 2.7, and 2.8 show feature distributions before and after filtering. These
features were shown in [48] to be effective in characterizing anomalous hotels on three
different online review websites. In all three subfigures, filtering either reduces the skew-
ness of the distribution or removes an abnormal bump, even though there was no specific
filtering done on title/ review length or rating.
Chapter 2. ClearView: Cleaning Noisy and Spamming Reviews 20
Figure 2.6: Distribution of the number of words in Google Play reviews before and afterfiltering.
2.7.5 Sensitivity and Scalability
Sensitivity In the ClearView pipeline we have several thresholds that can be set depend-
ing on the needs of the user. The percentage of non-printable characters, blacklisted words,
and misspelled words, as well as the minimum semantic score, can all be set separately,
allowing for customization of this pipeline depending on the desired end-use of the data.
Scalability The Stanford sentiment classifier is unusable for the large set of reviews
we consider. For example, our training data consisted of a collection of 1.75GB for the
TripAdvisor dataset and 6.62GB for the Google Play dataset. Processing such data using
a single classification process would take on the order of days.
To calibrate the runtime of a single iteration, we run the entire workload on a single
“fat” server with 2TB memory, 120 hyperthreaded Xeon E7-4870 1.2GHz cores. Both
input and output files were accessed in tmpfs[59], making all file I/O in-memory. We use

Chapter 2. ClearView: Cleaning Noisy and Spamming Reviews 21
Figure 2.7: Distribution of the number of characters in TripAdvisor titles before and afterfiltering.
Figure 2.8: Rating distributions of Google Play reviews before and after filtering
Chapter 2. ClearView: Cleaning Noisy and Spamming Reviews 22
a taskbag model in which a pool of compute server processes (i.e. workers) iteratively
fetches and executes work from the taskbag. The workers invoke the Stanford NLP sen-
timent classifier with preset parameters and input/output file names tagged with the id of
the fetched task. The whole job is self load-balancing and the task dispatch algorithm was
written in 200 lines of Go code. One iteration to classify the review set with this highly
optimized setup takes 30 hours, showing that implementation on a single laptop is clearly
infeasible for this classifier.
2.8 Conclusion
In this chapter, we presented ClearView, an automated data cleaning pipeline. We dis-
cussed various types of abnormalities that exist in different review sites and developed
filtering techniques to identify and remove them. We evaluated the performance of our
pipeline through an in-depth user study and found that our pipeline improves the quality
of the dataset by up to 3.4 times. We also examined the distributions of significant fea-
tures and found that our cleaning technique standardized these feature distributions. These
evaluations show that ClearView is an effective first step in the cleaning of review data in
preparation for a variety of data mining algorithms.
23
Chapter 3
TrueView: Ranking Hotels Based on
Trustworthiness
3.1 Introduction
Online reviews on products and services can be very useful for customers, affecting many
aspects of our day-to-day life (where to eat, what to buy, what to watch, where to travel).
These reviews provide an unprecedented mechanism for current customers to share infor-
mation with potential customers. However, review hosting sites can suffer from fraudulent
behavior, generated by “biased” users or the product providers themselves. So far, most
studies have focused on analyzing online reviews from a single hosting site. The key ques-
tion of this chapter is: how could one leverage information from multiple review hosting
sites to detect fraud?
Currently, the existence of multiple review sites can add to the confusion of the user.
Each of these sites may give a different view of a hotel, and it can be difficult for the
consumer to know whom to trust. We focus on reviews of hotels for reasons we discuss
below, and we frame the problem as follows: we are given several review sites that review

Chapter 3. TrueView: Ranking Hotels Based on Trustworthiness 24
a set of partially overlapping hotels. The reviews typically include a score, user comments,
time of review and possibly a user-id. The required output is a trustworthiness score for
the reviews of a hotel that take into consideration the reviews from each site. We use the
term suspicious hotel to refer to hotels whose reviews seem to have been manipulated,
e.g. padded with fake reviews. Note that we only focus on trustworthiness and not the
relevance of reviews for a particular user, e.g. whether a hotel is a pet-friendly, which is
an important but distinct problem.
We focus on hotel reviews for a combination of reasons. First, the hospitality industry
exhibits relative stability and consistency. Proximity to the beach does not change, un-
like product properties which quickly lose their attractiveness, let alone that the products
themselves may be replaced altogether by newer models. Second, hotel properties pro-
vide some structure and ubiquitousness. Hotels are consistently evaluated on a relatively
limited number of factors (cleanliness, service, location, noise, comfort) as opposed to say
electronic goods which can vary significantly depending on the interests and intent of the
user (e.g. think digital cameras, or TVs). Our work could easily be expanded to reviews of
other “well-defined and persistent” services, such as restaurants. Thus, our overall frame-
work and fundamental functions are a great starting point for expanding our work to other
commercial sectors, even if some sector-specific adjustments are required.
Most previous work so far has focused on analyzing a single review site, and typically,
focus on temporal [29], textual [63], behavioral [51], distributional [30] and graphical
features [18] to detect fraudulent reviews. In section 3.2, we discuss the existing work in
more detail.
As our key contribution, we develop a systematic methodology to analyze, compare,
and synthesize reviews from multiple review sites. First, we introduce and evaluate fea-
tures that capture cross-site discrepancies effectively. Second, we conduct arguably the
first extensive study of cross-site discrepancies using real data. Third, we provide the
TrueView score, a non-trivial synthesis of multi-site reviews, that assesses the trustwor-
thiness of a group of reviews. We provide TrueView as a proof of concept that cross-site
Chapter 3. TrueView: Ranking Hotels Based on Trustworthiness 25
analysis can significantly improve the information that the user sees. In our study, we use
more than 15M reviews from more than 3.5M users spanning three prominent travel sites,
TripAdvisor, Hotels.com, Booking.com.
We highlight our contributions and key results below.
a. A systematic approach to cross-site review evaluation using behavioral fea-
tures. We propose a comprehensive methodology for comparing and synthesizing reviews
from different sites. We use 142 features that go beyond simple rating analysis to consider
a set of behavioral and contextual features including review-centric, reviewer-centric, and
hotel-centric features. Our features capture temporal, spatial, behavioral, and graph-based
characteristics, which provides a multi-faceted view of the reviewing process of a hotel.
A key feature of the work is that we evaluate the trustworthiness of the overall hotel in
one site using cross-site features leveraging information from the other sites. We find that
using cross-site features significantly increases the number of suspicious hotels that we
find in our experiments.
b. An extensive study of cross-site review differences. We apply our approach to our
15M reviews spanning three sites. As a necessary step, we develop an automated method
to match hotel identities across different sites, which is a non-trivial problem. Our study
provides several interesting observations:
1. Our identity-matching method matches hotels with 93% precision which we validate
manually. This method could be of independent interest even outside the scope of
this work.
2. There are big differences in the overall score of a hotel across different sites. We
find that 10.4% of common hotels from Booking.com and TripAdvisor.com and
9.3% from Hotels.com and TripAdvisor.com, exhibit significantly different rating
characteristics, which is often a sign of suspicious behavior.
3. Using multiple sites can help us detect 7 times more suspicious hotels than the union
Chapter 3. TrueView: Ranking Hotels Based on Trustworthiness 26
of suspicious hotels found for each site in isolation.
c. Developing a cross-site scoring system: TrueView. We develop the TrueView
score as a proof-of-concept that leveraging multiple sites can be very informative and
change our assessment of the hotels significantly. TrueView is a sophisticated score, com-
bining: (a) temporal, contextual, and behavioral features from each site, and (b) cross-site
features across the sites. By applying our algorithm, we find that 20% of all hotels ap-
pearing in all three sites have a low trustworthiness score (TrueView score less than 0.75).
Although there may be better ways to combine cross-site reviews, we argue that TrueView
already demonstrates the potential of such an approach.
Our work in perspective. Our work is arguably the first effort that focuses on the
synthesis of reviews from different sites. Our goal is to raise the awareness of the oppor-
tunity and the challenges related to this problem. At the same time, our approach provides
a foundation for follow up studies in the following directions: (a) detection of fraudulent
behaviors, (b) assessing the trustworthiness of review sites, since some may have policies
that enable misbehavior, and (c) creating effective review aggregation solutions. Ulti-
mately, the collective wisdom of the users is valuable and empowering, and we would like
to protect this from fraudulent behaviors.
3.2 Related Work
Existing works focus on identifying fraud reviews and reviewers, while we focus on busi-
nesses such as hotels that promote fraudulent reviews. Existing work can be categorized
based on the methodologies they adopt to detect frauds. Fraud detection using Graphi-
cal/Network structure is studied in [18][21][67] where authors exploit network effects and
clique structures among reviewers and products to identify fraud. Text-based detection
of fraud is studied to spot a fake review without having the context of the reviewer and
reviewed product in [54][35][63]. Temporal patterns, such as bursts, have been identified

Chapter 3. TrueView: Ranking Hotels Based on Trustworthiness 27
as fraudulent behavior of businesses [69][29].
There has been work on joining multiple criteria from single sources to better detect
fraud [68]. Various types of fraud have been identified in the literature: groups of fraud-
sters [51][50], unusual behavioral footprints [49], unusual distributional footprints [30],
unexpected rules [36] and unusual rating behaviors [40].
Existing works deal with a diverse set of review data in both supervised and unsuper-
vised manners. In [18], 15,094 apps are ranked based on network effects. In [68], 45 hotels
are ranked based on an unsupervised hedge algorithm. In [30], 4000 hotels located in 21
big cities are analyzed to identify distributional anomalies. In [35], reviews on 700,000
products for a month are analyzed using review-, reviewer-, and product-centric features.
In [57], 7,345 car repair shops are crawled to collect 270,121 reviews and the data of their
195,417 reviewers.
Our work considers 15 million reviews for over 10 years from three websites and
thus considers significantly more data than existing works do. None of the existing work
considers reviews from multiple sites to understand fraudulent behavior. Our work is
fundamentally different from most existing work, since our focus is on evaluating ho-
tels/businesses instead of reviews.
The closest commercial competitor of TrueView is the TrustYou score [11], which
calculates a trustworthiness score for a hotel based on the reviews about that hotel from
multiple sites. TrustYou is fundamentally different in that it scores the goodness of the
hotel itself based mainly on semantic text analysis, while TrueView scores the trustwor-
thiness of the hotel based on a wide range of features.
Chapter 3. TrueView: Ranking Hotels Based on Trustworthiness 28
3.3 Location Disambiguation
We crawled TripAdvisor.com, Hotels.com, and Booking.com. We collected all the reviews
for almost all of the hotels in these sites. For each review, we collected its text, reviewer-
name, date-time and rating. For each hotel, we collected its name, address, and overall
average rating and any overall sub-category ratings (cleanliness, etc.). A summary of the
whole dataset is given in Table 3.1.
These three websites have a lot of hotels in common and thus, provide rich cross-site
information about those hotels. We focus on the location disambiguation problem across
these three websites.
3.3.1 Challenges
The most significant challenge in location disambiguation is that hotel names are not
unique. Therefore, a full name and address is needed to uniquely identify a hotel. Un-
fortunately, addresses are also not standard across websites, and the differences between
sites are seemingly random. Differences can be as simple as Street versus St. versus St
or as complex as Hotel Atlantico Buzios Convention & Resort - Estrada da Usina, s/n,
Humaita, Buzios, CEP 28950-000 and Hotel Atlantico Buzios Convention and Resort,
strada da Usina 294Morro do Humait, Buzios, RJ, 28950-000, Brazil. For international
addresses, words can be in different orders, names can be formatted differently, country
names can be excluded, and numbers can be morphed. Addresses can even use waypoints
as reference, such as 1000 Yang Gao Road N Pudong Near Pilot Free Trade Zone Gate
3, which are not standard across websites. Even US addresses, which one might assume
follow a standard format, are not immune. For example: Hilton New Orleans Riverside,
Two Poydras Street, New Orleans Central Business District, New Orleans, LA 70130 and
Hilton New Orleans Riverside, 2 Poydras St, New Orleans, LA 70130, United States. We
can look at these two addresses and tell that they are describing the same hotel, but their

Chapter 3. TrueView: Ranking Hotels Based on Trustworthiness 29
differences are non-trivial: the use of ‘Two’ versus 2 and the inclusion of ‘New Orleans
Central Business District’. Another domestic example: Mauna Kea Beach Hotel, 62-
100 Mauna Kea Beach Drive, Waikoloa, HI 96743 and Mauna Kea Beach Hotel, 62-100
Mauna Kea Beach Dr, Kamuela, HI, 96743 United States. These two addresses have every
field in common but one: one city is listed as Waikoloa and the other as Kamuela. How
much weight should be given to each field? Due to the variety of differences possible, this
is a difficult problem to automate.
3.3.2 Disambiguation techniques
We use a combination of hotel name analysis and geodesic distance to disambiguate ho-
tels. Geodesic distance ensures that the addresses are located in the same place, despite
differences in formatting, and name comparison makes sure the hotels’ names are similar
enough to likely refer to the same business.
Hotel name comparison To compare two hotel names, we devise a similarity measure
comparing the number of letters they have in common. The similarity measure we use is
the length of the set intersection of the hotel names divided by the length of the longer
name. This measure is faster to compute than edit distance and succeeds in the face of
small spelling differences or omitted words. This measure on its own has very high pre-
cision but low recall, so when combined with geodesic distance we are able to loosen this
matching requirement.
Geodesic distance To compare the physical location of the hotels, we employ geocoding.
Using the Google Geocoding API, we translate hotel addresses into latitude and longitude
coordinates for all of our hotels. This API works well with strangely formatted addresses,
both domestic and international. We use a cluster of computers to speed up the coordinate
generation process as there is a limit on the number of requests per day. We then calcu-
late the geodesic distance between two sets of latitude and longitudes. To do this we first
convert latitude and longitude to spherical coordinates in radians, compute the arc length,
then multiply this by the radius of earth in miles to get the distance in miles between the

Chapter 3. TrueView: Ranking Hotels Based on Trustworthiness 30
two addresses.
Combining measures: By combining geodesic distance with a distance measure of the
hotel names, we are able to have efficient, high-precision matching. To find the ideal dis-
tance maximum and similarity minimum, we explored the parameter space for distances
from 90 miles to 0 miles and similarities from .1 to .9. By sampling 30 hotels at each
parameter combination and manually checking matching fidelity, we found a local maxi-
mum in precision at a geodesic distance max of 1 mile and a name similarity minimum of
0.66. Since we want high-quality matching results, we err on the side of caution with our
matching constraints.
Results of disambiguation Using these constraints, we find 13,100 total matches. 848
hotels were matched across all three sites, 1007 between Booking.com and Hotels.com,
655 between Booking.com and TripAdvisor.com, and 10,590 between Hotels.com and Tri-
pAdvisor.com. Booking.com is a much newer site, and we hypothesize that is the reason
for its reduced coverage.
Booking.com Hotels.com TripAdvisor.com
Number of reviews 11,275,833 9,050,133 3,167,035Number of hotels 52,696 155,763 51,395Number of unique
usernames 1,462,460 1,020,054 1,426,252
Average number ofreviews 213.98 74.3 68.71
Average rating 3.35 3.07 3.99Percent empty reviews 24.4% 19.6% 0.0039%
Date range 09-30-2009 -05-17-2014
02/01/2006 -06-01-2014
02/28/2001 -09/08/2013
Geographic range International International United States
Table 3.1: Simple Statistics of the three datasets collected from three prominent travelwebsites.

Chapter 3. TrueView: Ranking Hotels Based on Trustworthiness 31
3.4 Novel Feature Set
Hotels show various inconsistencies within and across hosting sites. In this section, we
present several such inconsistencies that are not discussed previously in the literature and
derive relevant features for our trustworthiness scoring. We categorize our features in a
similar way to Jindal et al. [35]: reviewer-centric features, review-centric features and
hotel-centric features. Features are either generated using one site or multiple sites after
the hotels are joined based on location. All the single-site features are combined to put
them in the context of multiple sites.
A note worth mentioning is that the location information of these hotels provide an
unprecedented opportunity to validate goodness of the reviewers and reviews. All of our
novel features described below show promising capabilities in identifying suspicious be-
havior, and most of the time it is possible to spot such behavior for our novel location
disambiguation and merging.
For the rest of this chapter, we will use HDC for Hotels.com, TA for TripAdvisor.com
and BDC for Booking.com.
3.4.1 Reviewer-Centric Features
We identify three new scenarios involving inconsistent and unlikely reviews and capture
these scenarios through reviewer-centric features. Since it is not possible to disambiguate
users across sites, all of the reviewer-centric features are based on individual sites.
Spatial Inconsistency
We first focus on identifying reviewing behaviors that are spatially inconsistent. We find a
user named “AmishBoy” who reviewed 34 hotels in Amish Country located in Lancaster,
PA over 5 years. Lancaster County spans only 984 square miles, meaning that many of

Chapter 3. TrueView: Ranking Hotels Based on Trustworthiness 32
the hotels this user reviewed are right next door to each other. He gave 32 out of these
34 hotels 4 or 5 star ratings, which means he was pleased with his stay. Why then would
he continually switch to new hotels? Even if he is simply visiting the area for business
or pleasure every couple of months, his pattern of continually switching to new hotels is
suspicious. Whether innocent or not, the reviews of this user should be discounted on the
grounds that he does not represent a ‘typical’ traveler visiting this area.
We create a feature that identifies if a user has such a bias to a specific location and ac-
cumulate the contributions of such reviewers to every hotel. This feature is first calculated
as the maximum count of the number of reviews a reviewer made in a given zip-code. If
this value is greater than a threshold, typically 5, the reviewer is marked as a suspicious
user. To propagate the feature up to the hotel level, we then sum the number of reviews
each hotel has that came from suspicious users. If a hotel has many reviewers who have
such spatial preference, it strongly suggests potential review manipulation by the hotel.
Figure 3.1: (left) Locations of the hotels the user AmishBoy reviewed around Lancaster,PA in TA (right) A snapshot of the reviews tonyk81 wrote in TA. He left a total of 29reviews January 22, 2006 for businesses located across 15 states.
Temporal Inconsistency
Another type of suspicious behavior of a reviewer is writing many reviews on the same
day. Typically a traveler may review a set of businesses after he comes back from a trip.

Chapter 3. TrueView: Ranking Hotels Based on Trustworthiness 33
However, the frequency of such trips and the spatial distribution of the businesses can
provide valuable insights. For example, a user named “tonyk81” reviewed 29 businesses
on January 22, 2006, which are located across 15 states. Additionally, 21 of these reviews
are “first time reviews” for the respective hotels. The reviews describe visit dates starting
from May, 2005 till January, 2006 and all of the reviews have the words great and good in
the titles. Furthermore, many sentences in the review titles and text are repeated verbatim,
for example “Cleanliness seems to be a high priority at this hotel and the rooms are in like
new condition.” and “This hotel lives up to Marriotts high standards of quality.” The user
has only reviewed 3 hotels in the last eight years after this burst, all on the same day in
2007. Putting these pieces of evidence together, it is clear that tonyk81 is likely a spam
account.
Singleton bursts have been identified as potential indicator of manipulating hotels in
[69]. The above example suggests non-singleton bursts can show evidence of spamming
users as well. If a hotel has a large number of such reviewers, it likely has manipulated
its reviews. To calculate this feature, we find the maximum number of reviews a reviewer
left in a given day. If this is greater than a threshold, typically 3, that user is marked as
suspicious. We then propagate up to the hotel level as described above, by summing the
number of reviews each hotel has that came from suspicious users.
Graphical Inconsistency
Bipartite cliques in user-store graphs can identify groups of users that boost a set of stores
by doing a number of small transactions in the form of positive reviews [21]. Inspired by
this, we create a feature to capture information about the cliques a reviewer participates
in. We restrict ourselves only to cliques of size two and search for the maximum number
of hotels a user has reviewed in common with any other user. We find several cases where
such a clique points to an abnormal pattern in reviews. One such case we identify is two
users who have reviewed over 95% of the hotels in common on nearly the same dates,

Chapter 3. TrueView: Ranking Hotels Based on Trustworthiness 34
usually off by one day. Upon researching the reviewers further we discovered that they are
married! While a valid reason for such behavior, this shows that our method for finding
anomalous behavior by identifying bipartite cliques is successful. Another example is two
users from Germany, who have reviewed 117 of the same restaurants, hotels, or landmarks
all over the world in the past 5 years out of 189 and 186, respectively. Furthermore,
they each are ‘first to review’ (meaning they were one of the first five reviewers of that
location in their native language) for 136 and 144 locations. They also have surprising
synchronicity in both the review dates and stay dates for the hotels they have in common.
These facts indicate that these may be two accounts may be held by the same person,
which is the behavior of a paid spammer.
3.4.2 Hotel-Centric Features
Hotel-centric features are relatively more successful in identifying outliers (see Experi-
ments). As before, we have three types of inconsistencies for hotels.
1"
2"
3"
4"
5"
6/1/11"
7/1/11"
8/1/11"
9/1/11"
10/1/11"
11/1/11"
12/1/11"
1/1/12"
2/1/12"
3/1/12"
4/1/12"
5/1/12"
6/1/12"
7/1/12"
8/1/12"
9/1/12"
10/1/12"
11/1/12"
12/1/12"
1/1/13"
2/1/13"
3/1/13"
4/1/13"
5/1/13"
6/1/13"
7/1/13"
8/1/13"
9/1/13"
Ra#n
g&
Date&
(c)(a)
11.522.533.544.55
July 18, 2004 Nov 24, 2013
RunningAverageofRatings
Review
sperday
1
2
3
4
5
6
Burstinaverageandcount
(b)
(d)
Figure 3.2: (a) Six reviews for Super 8 hotel in Indiana in the same day (October 19, 2012),all positive, and five of them are singleton reviews where the authors have not reviewedagain in TA. (b) The number of reviews per day for a this hotel jumps to 6 on that daywhich was sufficient to give the hotel a 0.5 star boost in the average rating showing in red.(c) Immediate 5-star ratings after 1-star ratings are frequent in some hotels such as CherryLane Motor Inn in Amish Country. (d) Examples of two successive opposite reviews onthe same day from two reviewers.
Chapter 3. TrueView: Ranking Hotels Based on Trustworthiness 35
Temporal Bursts and Oscillations
Bursts of positive reviews for a hotel specifically aimed to increase the average rating is
well identified in the literature. We find several such cases where there are bursts of sin-
gleton reviews with an increase in the average rating. Typically such behavior is prevalent
in the early years of the inception of a hotel in the hosting site. Figure 3.2 shows an ex-
ample of such a burst. Bursts were calculated by taking the difference between maximum
number of reviews in a day and average number of reviews in a day for each hotel.
In addition to bursts, we show cases of oscillation in ratings that are targeted to keep
a high rating at the top of the “new-to-old” sorted list. We created two features to char-
acterize oscillation: the number of times a 5 star review was immediately followed by a
1 star review for each hotel, and the number of times a 1 star review was immediately
followed by a 5 star review for each hotel. These summed feature values capture the level
of oscillation of ratings for a given hotel.
An example of oscillating ratings is shown in Figure 3.2. We see that eight out of ten
1 star ratings were followed immediately by 5 star ratings.
Temporal Correlation
The correlation between the number of ratings a hotel receives over time on different sites
is a valuable indicator of consistent customer satisfaction. Commonly, a hotel should have
very similar behavior across sites in terms of number of ratings. For example, since the
number of occupants at hotels in Myrtle Beach, SC [6] decreases from 80% in the summer
to 30% in the winter, any hotel in Myrtle Beach, SC should show a high number of ratings
per day in summer, decreasing in the winter, as the number of ratings per day follows
the average occupants of the hotel. In Figure 3.3, we show hotels and their number of
ratings per day in HDC and TA. We see the top two hotels have summer peaks in both of
the sites. However, Bluewater Resort has dense summer ratings in TA but no significant
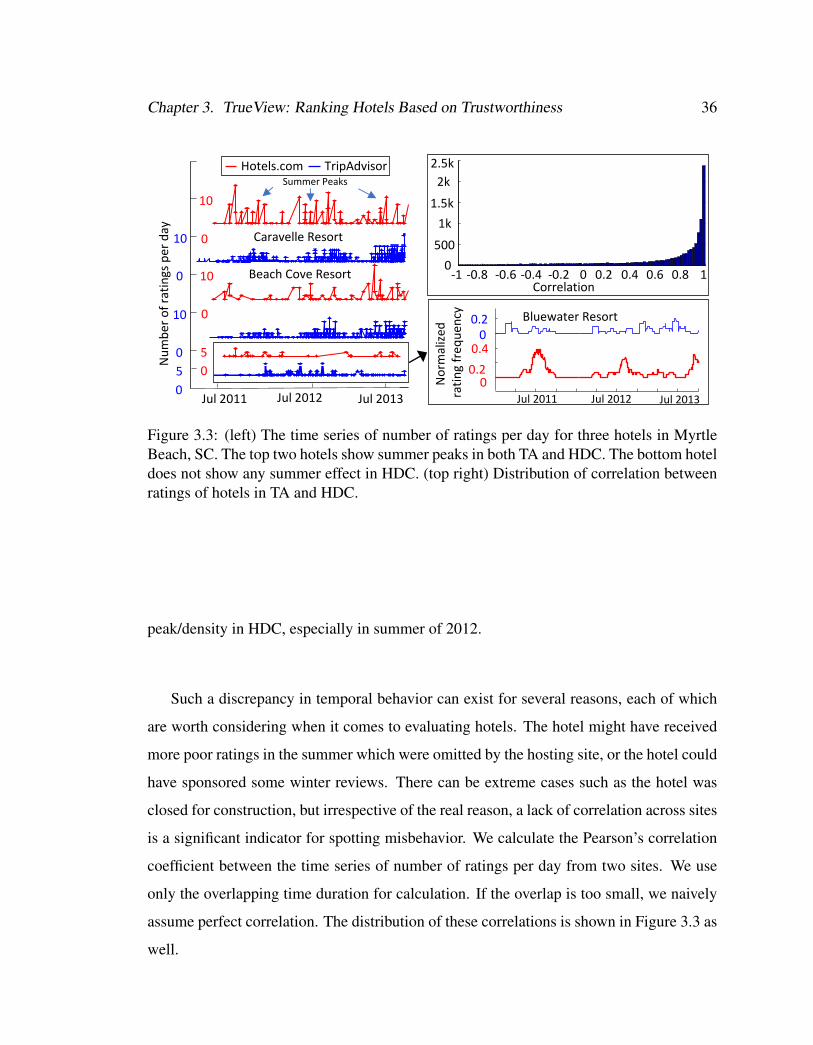
Chapter 3. TrueView: Ranking Hotels Based on Trustworthiness 36
Jul2011 Jul2012 Jul20130
0.20.40
0.2
Norm
alize
dratin
gfre
quen
cy BluewaterResort
-1 -0.8 -0.6 -0.4 -0.2 0 0.2 0.4 0.6 0.8 10
5001k
1.5k2k2.5k
Correlation
Numbe
rofratingsperday
SummerPeaks
0
5
10
0
10
10
5 00
0
10
0 Caravelle Resort
BeachCoveResort
Jul2012 Jul2013Jul2011
Hotels.com TripAdvisor
Figure 3.3: (left) The time series of number of ratings per day for three hotels in MyrtleBeach, SC. The top two hotels show summer peaks in both TA and HDC. The bottom hoteldoes not show any summer effect in HDC. (top right) Distribution of correlation betweenratings of hotels in TA and HDC.
peak/density in HDC, especially in summer of 2012.
Such a discrepancy in temporal behavior can exist for several reasons, each of which
are worth considering when it comes to evaluating hotels. The hotel might have received
more poor ratings in the summer which were omitted by the hosting site, or the hotel could
have sponsored some winter reviews. There can be extreme cases such as the hotel was
closed for construction, but irrespective of the real reason, a lack of correlation across sites
is a significant indicator for spotting misbehavior. We calculate the Pearson’s correlation
coefficient between the time series of number of ratings per day from two sites. We use
only the overlapping time duration for calculation. If the overlap is too small, we naively
assume perfect correlation. The distribution of these correlations is shown in Figure 3.3 as
well.

Chapter 3. TrueView: Ranking Hotels Based on Trustworthiness 37
0" 0.1" 0.2" 0.3" 0.4"
1"
2"
3"
4"
5"
Booking'
Booking.com
0" 0.1" 0.2" 0.3" 0.4"
1"
2"
3"
4"
5"
TripAdvisor*
TripAdvisor.com
Figure 3.4: Distribution of ratings for the same hotel in two websites showing negativecorrelation.
Rating Distributions
In [30], authors have suggested that the shape of rating distribution has a strong tie to the
spamming hotels. Typically, a “J” shaped distribution has a large number of 5-star and 1-
star ratings but a small number of 4-, 3-, and 2-star ratings. Such a distribution may occur
if users review only when they are extremely happy or disappointed. However, it is suspi-
cious to have nearly equal numbers of people who hated and loved a hotel. This suggests
that one of those rating groups has been artificially inflated by spam reviews. Whereas
in [30] they had to compare distributions between hotels, we take a multi-site approach
to validate the consistency of distributions across sites for individual hotels. To find this
value we calculate the Pearson’s correlation coefficient between the rating distributions of
a hotel across different sites, represented by two vectors of counts of integer ratings. We
also directly compare the distributions of the real-valued ratings by using the one-sided
p-value from the Mann Whitney U Test as a feature.
Figure 3.4 shows the correlation coefficients of the distributions between HDC and TA.
We take a threshold of -0.9 and locate all the hotels that show less than -0.9 correlation.
As shown in Figure 3.5, we find an interesting co-location pattern for negatively correlated
hotels around Atlanta, GA which is more densely populated with such hotels than any
major urban area or popular vacation spot, such as Las Vegas, NV or Los Angeles, CA.

Chapter 3. TrueView: Ranking Hotels Based on Trustworthiness 38
Figure 3.5: Negatively correlated hotels are more abundant in the vicinity of Atlanta, GAand almost non-existent in Las Vegas, NV area where both the cities have more than threehundred hotels.
Around 5% of the hotels in GA show negative correlation, which is much greater than that
(1%) in CA and NV.
3.4.3 Review-Centric Features
Review-centric features are based on review text and titles. We do not use any natural
language processing techniques to spot a spam review by only text, but rather focus on
structural properties of reviews.
Empty Reviews
Reviewers often write empty reviews with no title and no comment. The incentive for
such reviews is that they can be submitted without any typing. We find an abundance of
empty reviews in HDC and BDC, with 20% and 25% empty reviews, respectively, while
TA has only 3% empty reviews. In addition to these reviews being potentially suspicious,
Chapter 3. TrueView: Ranking Hotels Based on Trustworthiness 39
we find that hosting sites treat these reviews differently. For example, in HDC, empty
reviews were visible during the time when we collected the data; however, HDC now
hides the empty reviews, while keeping counts of them in their overall review tallies. For
example, Excalibur Hotel and Casino in Las Vegas, NV has 2500 empty reviews out of
13,144 reviews in HDC, but none of them are visible through the website. Such behavior
of hiding consumer reviews has been reported several times in [3], and clearly such an
omission is not fair to consumers.
There exist some hotels that have a significantly greater proportion of empty reviews
than average. For example, Comfort Suites Newark in New Jersey has 86 empty reviews
out of 193 reviews which is more than 44% of the reviews. We find 66 hotels that have
only empty reviews in HDC. BDC has a similar-sized body of empty reviews.
Matching Reviews
Inspired by tonyk81’s matching review text described above, we create a feature that cap-
tures the proportion of sentences any pair of reviews from the same reviewer share to the
total number of reviews that reviewer made. While repeating the occasional phrase is to be
expected, having reviews that share the majority of the sentences, or are completely iden-
tical, is not. We calculate this score by comparing pairwise all reviews made by a given
user. We keep a count of the number of sentences these reviews share, and then divide
this value by the total number of reviews a reviewer wrote. We then attach this score to
each review a reviewer left. For each hotel we aggregate this score for all of its reviews
to characterize the lack of uniqueness of its review set. A hotel with many reviewers who
use the same sentences repeatedly is likely soliciting spam reviews.
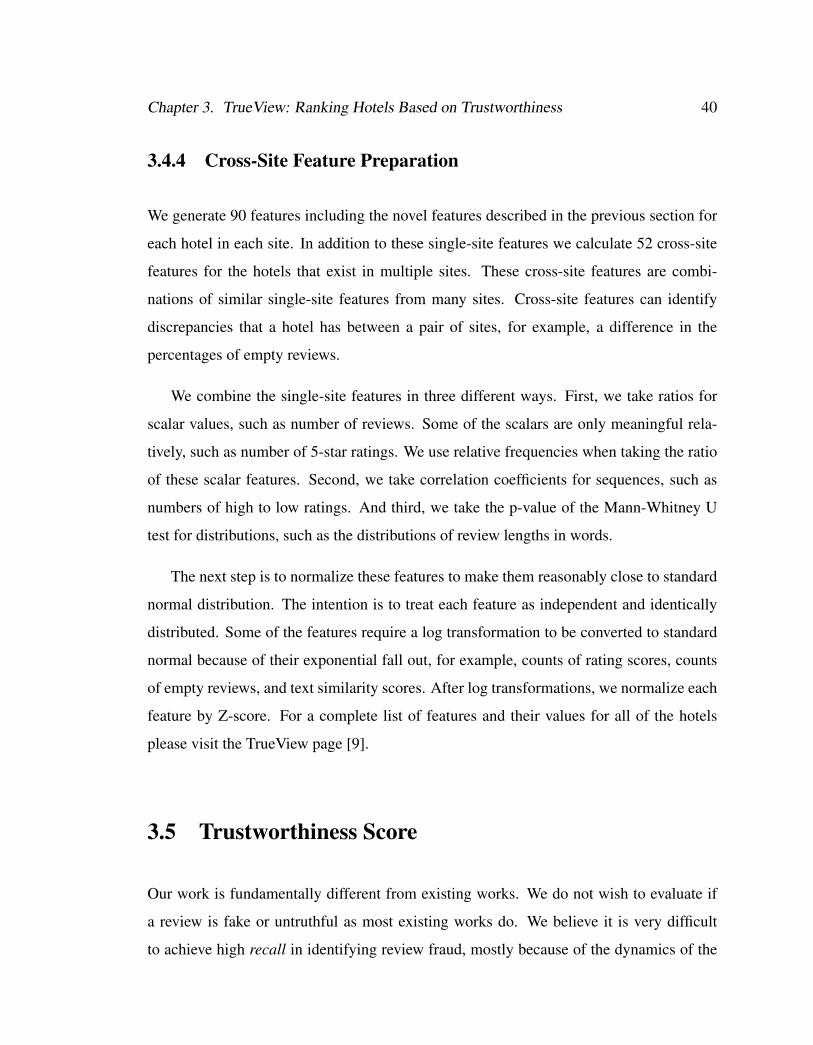
Chapter 3. TrueView: Ranking Hotels Based on Trustworthiness 40
3.4.4 Cross-Site Feature Preparation
We generate 90 features including the novel features described in the previous section for
each hotel in each site. In addition to these single-site features we calculate 52 cross-site
features for the hotels that exist in multiple sites. These cross-site features are combi-
nations of similar single-site features from many sites. Cross-site features can identify
discrepancies that a hotel has between a pair of sites, for example, a difference in the
percentages of empty reviews.
We combine the single-site features in three different ways. First, we take ratios for
scalar values, such as number of reviews. Some of the scalars are only meaningful rela-
tively, such as number of 5-star ratings. We use relative frequencies when taking the ratio
of these scalar features. Second, we take correlation coefficients for sequences, such as
numbers of high to low ratings. And third, we take the p-value of the Mann-Whitney U
test for distributions, such as the distributions of review lengths in words.
The next step is to normalize these features to make them reasonably close to standard
normal distribution. The intention is to treat each feature as independent and identically
distributed. Some of the features require a log transformation to be converted to standard
normal because of their exponential fall out, for example, counts of rating scores, counts
of empty reviews, and text similarity scores. After log transformations, we normalize each
feature by Z-score. For a complete list of features and their values for all of the hotels
please visit the TrueView page [9].
3.5 Trustworthiness Score
Our work is fundamentally different from existing works. We do not wish to evaluate if
a review is fake or untruthful as most existing works do. We believe it is very difficult
to achieve high recall in identifying review fraud, mostly because of the dynamics of the
Chapter 3. TrueView: Ranking Hotels Based on Trustworthiness 41
fraudsters and the lack of labeled data. Even if we assume hypothetically that we can
achieve high recall and prevent fake reviews from being shown to the readers, the hotels
and sites that promote fraudsters are not penalized and site users are not notified of which
hotels are trying to lie to their customers.
We believe that a better approach to this problem is to evaluate hotels and sites to find
ones that promote untruthful reviews, and to produce a trustworthiness score to present to
the user. We think such scores are more beneficial to the review readers as they can use
these scores in their ultimate judgment.
3.5.1 Outlier Scores
Once all the features are generated, we use an ensemble of anomaly detection algorithms to
generate the TrueView score. This ensemble consists of a global density-based score, local
outlier factor, and a hierarchical cluster-based score. Using these algorithms in ensemble
allows for different types of normal and anomalous behavior. We describe each technique
in this section.
Global Density-based Score
To calculate this score, we need to find how different a hotel is from the centroid of hotels
in the feature space. To do this, we take the mode of each feature and form a hypothetical
hotel which lies in the center of a large “normal” cluster. We use the simple intuition
that most hotels are playing fair and only a small fraction of hotels are generating fake
and untruthful reviews. If a hotel is largely dissimilar to the mode/centroid hotel, the hotel
might disagree with the mode in many features, which makes its behavior less trustworthy.
We use the concept of density connectedness to form a large cluster of points (i.e.
hotels) carrying the mode. A point is a core point if it has k or more points within ✏
distance in the Euclidean space. Two points are density-connected if there is a sequence

Chapter 3. TrueView: Ranking Hotels Based on Trustworthiness 42
of core points from one to another where every point is within ✏-neighborhood of the
previous point. Thus, any point that is not in the core cluster is an outlier and the degree of
outlying is proportional to the distance from the nearest core point. This method is inspired
from the original density based clustering algorithm, DBSCAN. This method has a unique
advantage that the core cluster can be of any shape and based on the two parameters (i.e. ✏
and k) we can control the size of the core cluster and thus, the size of the outlying cluster.
Local Outlier Factor (LOF)
The global method assumes that all normal hotels form a core cluster. However, there
can be alternative structures with numerous small clusters of normal hotels with varying
densities in the feature space. We use local outlier factor to score outliers. Local outlier
factor uses the notion of k-distance (distk(x)) which is defined as the distance to the k-
th nearest neighbor of a point. Local reachability distance (lrdk) of x is the average of
the reachability distances from x’s neighbors to x. Here Nk(x) is the set of k-nearest
neighbors of x.
lrdk(x) =||Nk(x)||P
y2Nk(x) max(distk(y),dist(x,y))
The LOF of a point x is the average of the ratios of the local reachability of x and its
k-nearest neighbors. LOF can capture several normal clusters of arbitrary densities that
makes it robust for any data domain. Formally, LOF is defined as below
LOFk(x) =P
y2Nk(x)lrdk(y)lrdk(x)
||Nk(x)||
Hierarchical Cluster-based Score
Both of the density-based methods above use k-neighborhoods to estimate densities or
connectivities. Our third approach differs from that and uses a hierarchical clustering ap-
proach. We cluster the data hierarchically using the single linkage method. The single

Chapter 3. TrueView: Ranking Hotels Based on Trustworthiness 43
linkage method starts with singleton clusters and evaluates pairs of clusters based on the
minimum distance between any pair of points that form the two clusters. It then merges
the closest two clusters at every step. This simple bottom-up strategy can produce a den-
drogram over the points without any input parameters.
Once the complete hierarchy is built, a set of clusters can be obtained by cutting the
hierarchy at a cutoff level. Here again, we assume there is a global normal cluster that
contains most hotels and any hotel not in this cluster is an outlier. Under this assumption,
we can tune the cutoff level to get a certain percentage of points in the set of outliers.
3.5.2 TrueView Scores
One of the major challenges of creating a method based on an ensemble of anomaly de-
tection algorithms is that it requires the combination of multiple scores that are not on the
same scale. There are several different methods that can be used to combine these scores,
depending on the potential application. Some methods focus on unifying rankings, while
others focus on normalizing and combining scores [58]. For our application, having one
unified score is preferable to having an overall ranking, thus we seek to normalize and
combine these four scores. Our method is as follows, based on [38][58].
Let a hotel be x and the outlier score of x is S(x). We first do a log transform
z = � logS(x)/Smax for each hotel x to obtain a trustworthiness score, and then we
scale it using a Gaussian distribution to produce a probability P (x) of the hotel x being
trustworthy. Such a probability score is useful because it is bounded within [0,1].
TV (x) = max(0, erf( z�µzp2�z
))
Here, TV (x) is the TrueView score. The TrueView score describes the probability of
a hotel’s reviews being truthful and is unitless. As described above, we can now produce
TrueView scores from any feature set of these hotels. We define two intermediate scores
Chapter 3. TrueView: Ranking Hotels Based on Trustworthiness 44
that can be created as well as the overall TrueView score. First, TV1 is produced only
using features from one site. Second, TV2 is produced using an union of features from all
sites. Third, the TrueView score is produced using the union of all single-site features and
the cross-site features from all three sites. Each outlier detection algorithm produces its
own scores, and we average them to get the overall TrueView score. We provide empirical
evidence in Section 3.6 that TrueView identifies successfully identifies outliers.
There are two weaknesses of the above approaches. First, the score of a hotel can
change if other hotels connect it to the core cluster. Second, there can be hotels which are
unusually good labeled as untrustworthy. These cases are pathological and become rare
with more reviews per hotel.
3.6 Experimental Analysis
We start with our reproducibility statement: all of the experiments in this section are ex-
actly reproducible with the code and data provided in the supporting page [9]. We also
have additional materials such as presentation slides, the complete feature set, and more
experiments.
3.6.1 Parameter Sensitivity
The three algorithms we use for outlier detection have a set of parameters to tune. Based on
the values of these parameters, we can have different sized sets of outliers. We experiment
to test the sensitivities of these parameters and select appropriate values for subsequent
experiments.
In the global density-based method, we have ✏ and k as parameters. We fix k = 10 and
vary ✏ and record the percentage of the dataset labeled as outliers. In LOF, we have the
neighborhood size k as the sole tunable parameter. In the hierarchical method we use the

Chapter 3. TrueView: Ranking Hotels Based on Trustworthiness 45
0 0.5 1 1.5 2 2.5 3 3.5 4 4.5 50
0.1
0.2
0.3
0.4
0.5
0.6
Epsilon
Percento
utliers
Cross-sitefeaturesSingle-sitefeatures
0 5 10 15 20 25 30 35 400
0.02
0.04
0.06
0.08
0.1
0.12
K
Percento
utliers
Cross-sitefeaturesSingle-sitefeatures
Figure 3.6: (left) Percentage of outliers detected in the density-based method as we vary✏. (right) The same as we vary neighborhood size k in the LOF method.
cutoff value as the parameter and record the percentage of the dataset labeled as outliers.
Figure 3.6 shows the behavior of the mode-distance and LOF methods. We select the
parameters such that we can rank order 30% of the hotels using all three methods. This
number is an arbitrary choice and can be different in other systems.
3.6.2 Feature Importance
We evaluate feature importance in the calculation of the TrueView score. We use two
different and independent approaches to evaluate the features.
Spectral Feature Selection
We use the method in [71] to evaluate the importance of our 142 features. The method
identifies redundancy in the feature values and properly demotes dependent features. The
result is shown in Figure 3.7, where more than 100 features show very uniform impor-
tance scores, which supports the validity of our feature set. In addition, we categorize the
features into cross-site and single-site classes. We see that the most important features
are cross-site features, showing the importance of multiple-site data for evaluating hotels.
Note that the feature selection algorithm does not take into account the ultimate usage of

Chapter 3. TrueView: Ranking Hotels Based on Trustworthiness 46
these features in the algorithm, which is outlier detection in this work, but rather their
intrinsic informativeness.
0 50 100 150 0
0.2
0.4
0.6
0.8
1
1.2
Features(
Impo
rtance(Score(in(%(
Cross3site(Features(Single3site(Features(
Figure 3.7: Feature importance percent scores for our 142 features. Cross-site features aremore overall important than single-site features.
Distance from Mode
In this section, we consider the outliers produced by our global density-based approach.
We pick the most different feature of an outlier with respect to the mode of that feature as
the representative for that outlier. We see a massive shift in importance of our cross-site
features, especially the star rating-based ones, that are important for more than half of the
outliers. In Figure 3.8, we show the results for other feature categories as described in
Section 3.4.
3.6.3 Validation
Since the algorithm for computing TrueView score is unsupervised, and we do not have
labeled data that identifies fraudulent hotels, we cannot directly validate with ground truth
information. We therefore take two alternate approaches to validate the soundness of our
method.

Chapter 3. TrueView: Ranking Hotels Based on Trustworthiness 47
02468
10121416
65.34
Spatial
Clique Bu
rsts
Oscillatio
n
Ratin
gs
Empty Matching
Length Coun
t
Reviewer-Centric Hotel-Centric Review-Centric
Tempo
ral
Percen
tFeatureIm
portance
Figure 3.8: Relative importance of review-,reviewer- and hotel-centric features based onthe distance from the centroid.
Sanity Check on Synthetic Frauds
First we generate a synthetic set of outlying hotels to validate that our global density-
based approach correctly identifies outliers. To create these outliers, we copy the center
point representing the mode of all features and mutate random feature values, randomly
setting them to either the ninety-fifth or the fifth percentile. We then calculate their True-
View score based on the global density-based method described above. This experiment
is repeated 100 times. We find the distributions of TrueView scores are heavily skewed
towards zero, showing that on the whole, they were given very low TrueView scores. Thus
our algorithm passes this sanity check, classifying 100% of our synthetic data as outliers
and giving them correspondingly low TrueView scores.
Evaluation of Extreme Features
Second, we validate that the hotels with low TrueView scores show a significant difference
in the number of extreme feature values from the hotels with high TrueView scores. To
evaluate this we find the number of features that are below the fifth percentile or above

Chapter 3. TrueView: Ranking Hotels Based on Trustworthiness 48
the ninety-fifth percentile for each hotel. We use the Wilcoxon rank-sum test to determine
whether the 40 most trustworthy hotels significantly differ in the number of extreme fea-
tures from the 40 least trustworthy accounts. A p-value of < 0.05 rejects the null hypoth-
esis, and asserts that the two populations are distinct. Table 3.2 lists the p-values for each
outlier algorithm and each feature subset. The cross-site and combined single-site feature
sets show statistically significant results for every algorithm, meaning that these feature
sets are effective in differentiating outliers. It also means that hotels given high TrueView
scores are indeed trustworthy, as most of them have only a few extreme features.
LOF Mode Density Linkage
Cross-site 3.93E-07 1.63E-08 4.60E-11Single-site 1.63E-06 8.04E-15 1.08E-12
Booking.com 1.49E-05 0.419 0.019Hotels.com 0.308 4.41E-04 0.038
TripAdvisor.com 0.379 0.052 0.002
Table 3.2: p-values of Wilcoxon rank-sum test. Bold faced values mean that there is asignificant difference between the top and bottom 40.
10 20 30 40 50 60 70 800
5
10
15
20
25
Extremefeaturecounts
Freq
uency Bottom100
0 10 20 30 40 50 60 700
10
20
30
40
50
60
Freq
uency
Extremefeaturecounts
Top100
Figure 3.9: (left) Distribution of the number of extreme features (95th percentile) in thebottom 100 hotels in TrueView ordering (right) Distribution of the same in the top 100hotels in TrueView ordering. Distributions are significantly different.

Chapter 3. TrueView: Ranking Hotels Based on Trustworthiness 49
3.7 Case Studies
We want to provide some initial ideas on how the TrueView score could be used in practice.
We identify two possibilities: (a) enabling the site owner to detect misbehaving hotels, and
(b) by the end user.
0 0.1 0.2 0.3 0.4 0.5 0.6 0.7 0.8 0.90
0.1
0.2
0.3
0.4
0.5
0.6
0.7
0.8
0.9
1
Cumulativeprob
ability
TrueView score
Figure 3.10: Empirical cumulative distribution function of TrueView scores.
A. TrueView for the site administrator. The usage here is fairly straightforward as
a way to identify misbehaving hotels. The administrator can apply TrueView on the data
from his own site alone, in which case TrueView resolves to TV1. Assuming cross-site
cooperation, the administrator could use data from other sites.
B. TrueView for the end user. The TrueView score could help the user select ho-
tels that are more likely to have non-altered scores. In other words, the user can be more
confident that a rating of say 3.5 stars is the true reflection of unbiased customers. True-
View could be used when only a single site is available, but its power lies in its ability to
combine reviews from multiple sites.
We see two basic ways the TrueView could be used. (a) as a way to re-rank hotels, by
altering the the rate of the hotels, and (b) as a filtering mechanism, in which hotels with
unreliable TrueView score are not even shown to the user.

Chapter 3. TrueView: Ranking Hotels Based on Trustworthiness 50
Hotel HDCRating
T1-HDC
TAStars
TV1-TA TV2 TrueView Trust-
worthy?
Super 8 TerreHaut 3.30 0.0 3.00 0.765 0.266 0.0 X
Excalibur Hoteland Casino 3.60 0.154 3.50 0.150 0.049 0.239 X
ComfortSuites Newark 3.80 0.312 3.00 0.295 0.227 0.0 X
ParadiseResort, Myrtle
Beach4.20 0.0 4.00 0.427 0.301 0.0 X
BluewaterResort, Myrtle
Beach2.90 0.0 3.00 0.265 0.210 0.538 X
Comfort Inn& Suites,Statesboro
3.60 0.0 3.60 0.217 0.331 0.736 X
Table 3.3: TrueView scores for suspicious hotels.
a. Weighted rating using TrueView. There are many ways that to modify the rating
of a hotel based on the trustworthiness score. The full input is the rating from each site,
the number of reviews per site, the trustworthiness of each site (TV1), and the TrueView
across all sites. One approach would be to take the average rating and multiply it by the
trustworthiness score, but this method’s simplicity is not a proof of effectiveness without
extensive study.
b. Filtering using TrueView. In this method, we need only to find the cut-off threshold
of trustworthiness TV-thres which forms the cut-off point for hotels with a score less than
the threshold. The filtering threshold needs to balance the ability to remove suspicious
hotels with its false positive rate, which would reduce the overall choice for the end user.
This is the fundamental trade-off that needs to be considered. We present some initial
thoughts on how we could develop a threshold like this.
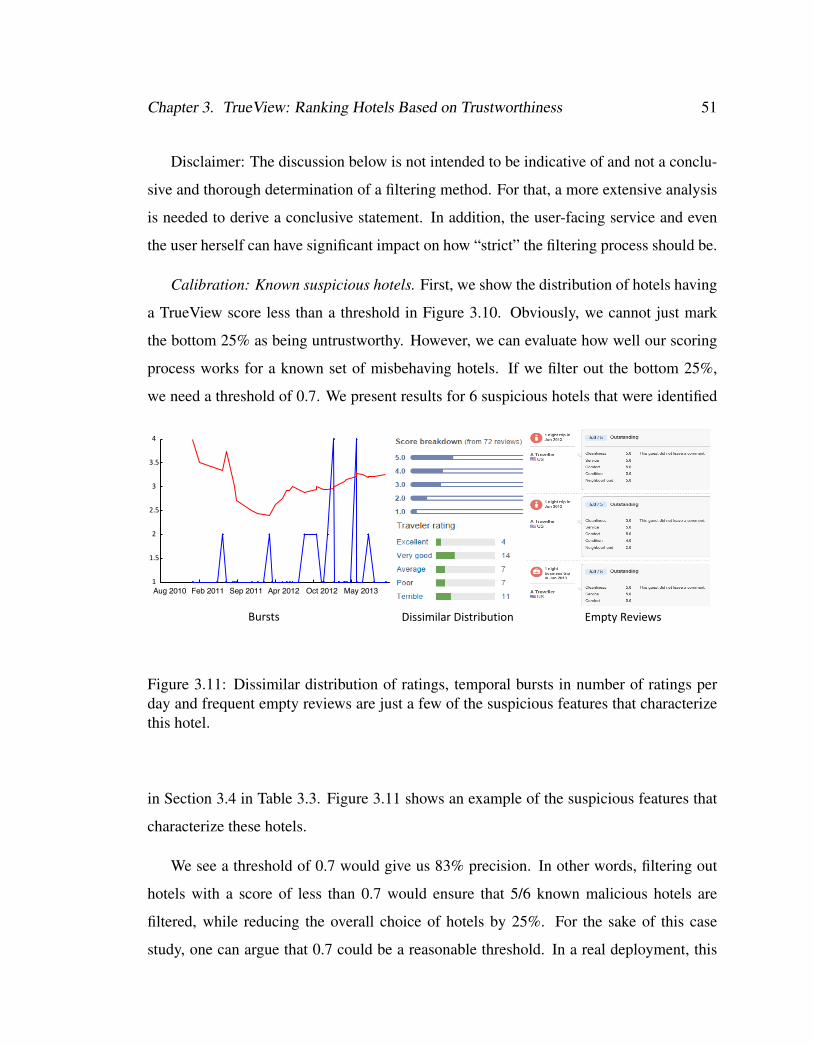
Chapter 3. TrueView: Ranking Hotels Based on Trustworthiness 51
Disclaimer: The discussion below is not intended to be indicative of and not a conclu-
sive and thorough determination of a filtering method. For that, a more extensive analysis
is needed to derive a conclusive statement. In addition, the user-facing service and even
the user herself can have significant impact on how “strict” the filtering process should be.
Calibration: Known suspicious hotels. First, we show the distribution of hotels having
a TrueView score less than a threshold in Figure 3.10. Obviously, we cannot just mark
the bottom 25% as being untrustworthy. However, we can evaluate how well our scoring
process works for a known set of misbehaving hotels. If we filter out the bottom 25%,
we need a threshold of 0.7. We present results for 6 suspicious hotels that were identified
Aug 2010 Feb 2011 Sep 2011 Apr 2012 Oct 2012 May 20131
1.5
2
2.5
3
3.5
4
Bursts DissimilarDistribution EmptyReviews
Figure 3.11: Dissimilar distribution of ratings, temporal bursts in number of ratings perday and frequent empty reviews are just a few of the suspicious features that characterizethis hotel.
in Section 3.4 in Table 3.3. Figure 3.11 shows an example of the suspicious features that
characterize these hotels.
We see a threshold of 0.7 would give us 83% precision. In other words, filtering out
hotels with a score of less than 0.7 would ensure that 5/6 known malicious hotels are
filtered, while reducing the overall choice of hotels by 25%. For the sake of this case
study, one can argue that 0.7 could be a reasonable threshold. In a real deployment, this

Chapter 3. TrueView: Ranking Hotels Based on Trustworthiness 52
needs to be based on a much large labeled dataset.
Case study: Finding hotels in Amish Country. We choose the top 20 hotels in Amish
Country, Lancaster County, PA from Hotels.com and TripAdvisor. We choose hotels in
Amish Country because during our initial investigation many potentially suspicious hotels
were present. Amish Country is a small area with many competing hotels trying to access
a similar market, so the competition is fierce. We calculate the TrueView scores for those
that are part of our matched dataset. The results of this study are show in Table 3.4. We
find that all of these hotels have scores below our threshold of 0.7. We validate these
results we manually assess these hotels and find that they all do show suspicious behavior.
Hotel HDCRating
TV1-HDC TV2 TrueView Trustworthy?
After Eight Bed &Breakfast 4.80 0.139 0.182 0.233 X
Comfort Suites AmishCountry 4.70 0.063 0.642 0.392 X
Bird In Hand VillageInn & Suites 4.60 0.039 0.0 0.092 X
Amish Country Motel 4.60 0.0 0.285 0.501 XCountry Inn & SuitesBy Carlson Lancaster 4.60 0.0 0.325 0.522 X
Strasburg Village Inn 4.50 0.376 0.218 0.0 XHawthorn Suites byWyndham Lancaster 4.10 0.329 0.406 0.442 X
Sleep Inn & SuitesRonks 4.10 0.437 0.264 0.224 X
Table 3.4: TrueView scores for hotels from Hotels.com.

Chapter 3. TrueView: Ranking Hotels Based on Trustworthiness 53
3.8 Conclusion
The goal of our work is to show the significant benefits we can gain by combining reviews
from multiple review sites. As a key contribution, we develop a systematic methodology
to collect, match, and analyze hotels from multiple review sites. The novelty of our ap-
proach relies one the introduction and assessment of 142 features that capture single-site
and cross-site discrepancies effectively. Our approach culminates with the introduction
of the TrueView score, in three different variants, as a proof-of-concept that the synthesis
of multi-site reviews can provide important and usable information to the end user. We
conduct arguably the first extensive study of cross-site discrepancies using real data from
15M reviews from more than 3.5M users spanning three prominent travel sites. We find
that there are significant variations in reviews, and we find evidence of review manipula-
tion.
54
Chapter 4
BotWalk: Efficient Adaptive
Exploration of Twitter Bot Networks
4.1 Introduction
More than a billion people use online social networks for information dissemination, en-
tertainment, and social interaction. Unfortunately, these platforms are exploited by abusive
automated accounts, also known as bots, for financial or political gain. The presence of
these bots is a constantly growing problem that compromises the empowerment of online
social communities. Automated accounts easily allow botmasters to spam inappropriate
content [5], participate in sponsored activities [31], and make money by selling accounts
with human followers [65]. An estimated 8.5% of Twitter accounts are bots [62] and the
bots are growing at a higher rate than the rate at which Twitter suspends them.
The identification and suspension of bots is a challenging problem for several reasons:
these social networks are massive – Twitter alone is estimated to contain over 300 million
users and billions of edges. Furthermore, the amortized cost of creating a bot1 is much
1Cost of creating a bot is equivalent to a mouse click by a human to solve re-captcha.

Chapter 4. BotWalk: Efficient Adaptive Exploration of Twitter Bot Networks 55
less than that of detecting a bot, and the cost of suspending a user incorrectly is much
higher. Lastly, the bot-masters creating these automated accounts are constantly evolving
the bots’ behavior to attempt to evade detection. This is the typical ‘Red Queen’ effect,
well known in biology and cybersecurity, in which “It takes all the running you can do, to
keep in the same place”[45]. As Twitter’s detection methods evolve, so do the botmasters’.
To win this arms race, or to even keep up, a bot detection method must have the following
characteristics:
• Very high detection rate, ideally higher than the rate at which automated accounts
can be created, which would guarantee eradication of bots.
• Scalable, the method is robust in the face of increasing social network size.
• Adaptive, which means it retains the above two properties when bot-masters evolve.
Simply training on labeled data that matches the current state is not enough, for as
the bots’ behaviors change, static classifiers will quickly become obsolete. This in-
dicates that unsupervised solutions that detect novel, anomalous behavior are likely
to be more effective in this quickly evolving environment.
• Completely automated, so that it can keep up with the rate of bot-master activity.
In this chapter, we propose a bot detection technique using Twitter’s restricted API
access for online updates that is adaptive, scalable and has the highest detection rate of
current methods. Our BotWalk algorithm uses an adaptive search strategy to maximize
detection rate in a rapidly changing social network. In the Twitter network, BotWalk can
identify up to 6000 bots per day and adapt to detect novel bot behaviors automatically.
Problem Formulation: The high-level goal of this work is to efficiently explore the
evolving Twitter network and identify bots manifesting continually changing behavioral
patterns.
Contributions:
• Creation of BotWalk, a near-real time adaptive anomaly detection framework with
90% precision in detecting bot behavior in Twitter data

Chapter 4. BotWalk: Efficient Adaptive Exploration of Twitter Bot Networks 56
• Implementation of an adaptive approach to feature selection, necessitated by the
limited amount of data accessible in real-time and the rapidly changing Twitter en-
vironment
• Utilization of domain knowledge to intelligently partition the feature space, leading
to up to a 30% increase in precision
• Assembly of a comprehensive Twitter dataset, collected over the course of formu-
lating this work, and made available to the public [8]
4.2 Related Work
Twitter bot detection has received significant interest in the literature. Most current ap-
proaches focus on supervised, non-adaptive methods [32][28][16]. Unfortunately, a su-
pervised approach has several shortcomings. The classification is only as good as the
labeled data, which is often biased or outdated. Supervised algorithms can be useful when
trying to classify a given user as a bot, but what if the goal is identification of new bots?
And what if these bots are constantly exhibiting new behavioral patterns? It is in these
cases that supervised algorithms fall short.
In [64], the authors present an approach to semi-automatically label users as bots by
identifying several features that can discriminate between obvious bots and human users.
For each feature, the threshold value has to be manually set, and these values can vary
depending on the candidate bot set, which reduces the automated aspect of the work.
Other feature-based approaches use only a few linguistic attributes and test on a small
number of manually-labeled accounts [25], or only temporal features in a supervised [55]
or unsupervised way by identifying highly-correlated activity streams [22]. The latter
approach has high recall and a low false positive rate, but is very easy to evade since it
is just based on one feature. One study extracted a large number of features [26], but
they used them in a supervised fashion. We compare their detection rate to BotWalk’s in
Section 4.6.3.
Chapter 4. BotWalk: Efficient Adaptive Exploration of Twitter Bot Networks 57
Our work is unique because it is an unsupervised exploratory method that is able to
adaptively identify novel bot behavior using a variety of features which capture different
dimensions of behavioral profiles. By using an unsupervised method seeded from known
bots, rather than simply training a classifier on labeled data, BotWalk is able to discover
new, unknown behavioral patterns.
4.3 Framework
Bot detection in a rapidly changing social network with limited external visibility is a
challenging computational problem. As with malware, bot masters continually modify bot
characteristics including communication patterns, content, and connectivity. Additionally,
Twitter’s query interface restrictions place significant limitations on the amount of new
data that can be collected relative to the amount being generated.
Figure 4.1 shows our approach, which combines known data, domain expertise, and
unsupervised anomaly detection. As described in Algorithm 1, we begin by selecting a
seed bots (see Section 4.6.2) and a set of random users. This random set can consist of
both normal users and bots, as it is not labeled. However, since estimates say that at most
8.5% of Twitter users are bots [62], a random sample should on average adhere to this
constraint. The anomaly detection algorithm considers the random user set as containing
the ‘normal’ group.
For each Twitter user from the seed bot one-hop follower neighborhood and the random
user set, metadata such as timeline and user account information is collected (Lines 6 –
10). Features of the seed bot neighborhood and random user sets are then assembled from
these raw data (Lines 11 – 13). Feature selection and assembly is a major contribution of
this work, and is discussed in Section 4.4.
Finally, the ensemble anomaly detection algorithm is applied, resulting in identification
of bots and normal users. Elements from these sets are used to update the seed bot and

Chapter 4. BotWalk: Efficient Adaptive Exploration of Twitter Bot Networks 58
Feature extraction
Seed bots, B
Users U
Exploration
Anomaly detection
Figure 4.1: Overall framework of our bot identification algorithm
random user sets respectively (Lines 14 – 16). The anomaly detection algorithms and our
partitioning approach to ensemble anomaly detection is the topic of Section 4.5.
Our exploration method combines depth-first and breadth-first exploration. Depth-first
exploration constrains the search space but limits the scope, so if a human node is reached
it can be difficult to return to a bot node. Breadth-first exploration maximizes the like-
lihood of reaching other bots at each step, since it is collecting all the followers of the
current anomalous node, but the scale quickly explodes (for example, some Twitter users
have tens of thousands of followers). Our method allows us to maximize the likelihood of
identifying bots by collecting and analyzing the followers of the current seed bot, while
still constraining the search space by continuously repeating the exploration process start-
ing from individual random anomalous users. This has the added benefit of making our
approach scalable by construction; by using a limited, carefully-chosen stream selected

Chapter 4. BotWalk: Efficient Adaptive Exploration of Twitter Bot Networks 59
Algorithm 1 NetworkExploration1: Input: Set of seed bots B, Set of random users U ;
2: while explore = True do
3: b = pop random element from B;
4: Fuser = feature matrix of U ;
5: N(b) = follower neighborhood of b;
6: for neighbor c in N(b) do
7: // Metadata via the Twitter REST API
8: IM(c) = get profile info(c);
9: // Timeline info: 200 most recent tweets
10: IT (c) = get timeline info(c);
11: // Extract metadata-, content-, network-, and
12: // temporal-based features (Secs. 4.4.1-4.4.4)
13: FN(c) = create feat vector(IM(c), IT (c));
14: (Bout,Uout) = UnsupervisedOutlierDet( [Fuser, FN]); // (Secs. 4.4.1)
15: B.update(Bout);
16: U .update(Uout);
from this huge, constantly-changing network, this method is robust in the presence of
increasing network size.
4.4 Feature Selection and Data Collection
To generate a comprehensive behavior profile for a given user, we compile a large collec-
tion of features which capture different aspects of a user’s behavior. Each feature (e.g.,
temporal bursts) alone has been shown to be effective for identifying bots in a supervised
setting (note that we target unsupervised settings). However, bots are a diverse group and
can have many different behavioral patterns. Just looking for bots with spamming content,
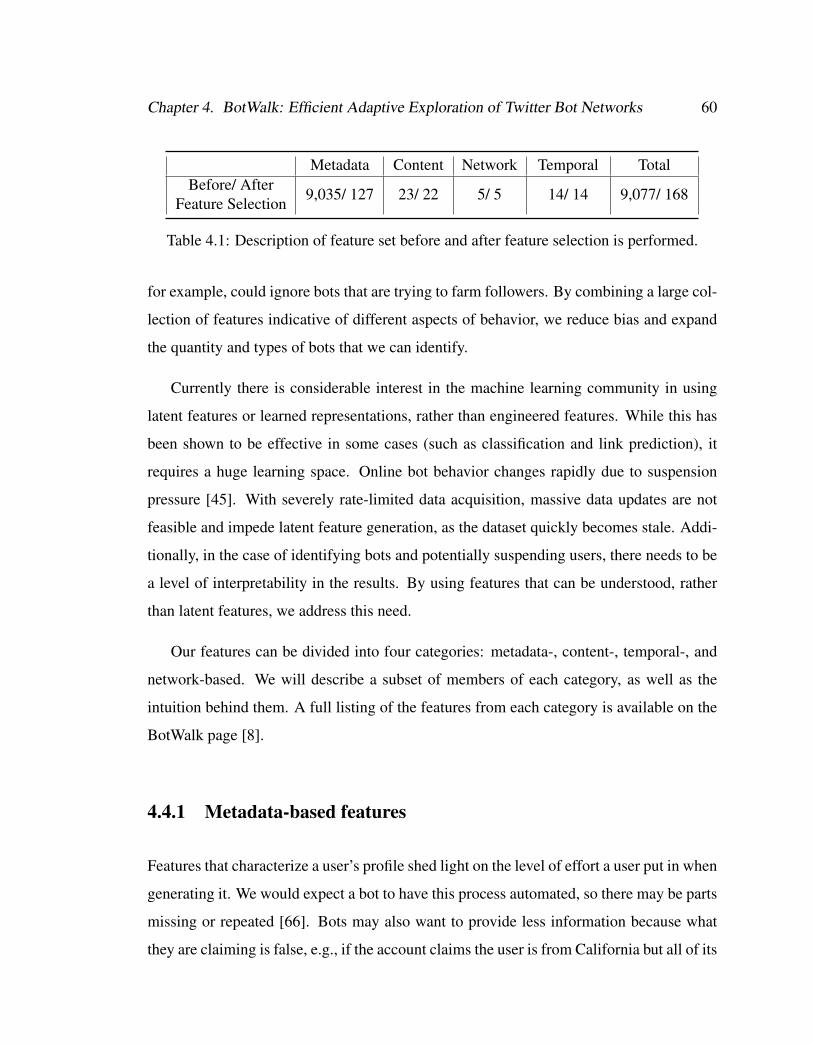
Chapter 4. BotWalk: Efficient Adaptive Exploration of Twitter Bot Networks 60
Metadata Content Network Temporal TotalBefore/ After
Feature Selection 9,035/ 127 23/ 22 5/ 5 14/ 14 9,077/ 168
Table 4.1: Description of feature set before and after feature selection is performed.
for example, could ignore bots that are trying to farm followers. By combining a large col-
lection of features indicative of different aspects of behavior, we reduce bias and expand
the quantity and types of bots that we can identify.
Currently there is considerable interest in the machine learning community in using
latent features or learned representations, rather than engineered features. While this has
been shown to be effective in some cases (such as classification and link prediction), it
requires a huge learning space. Online bot behavior changes rapidly due to suspension
pressure [45]. With severely rate-limited data acquisition, massive data updates are not
feasible and impede latent feature generation, as the dataset quickly becomes stale. Addi-
tionally, in the case of identifying bots and potentially suspending users, there needs to be
a level of interpretability in the results. By using features that can be understood, rather
than latent features, we address this need.
Our features can be divided into four categories: metadata-, content-, temporal-, and
network-based. We will describe a subset of members of each category, as well as the
intuition behind them. A full listing of the features from each category is available on the
BotWalk page [8].
4.4.1 Metadata-based features
Features that characterize a user’s profile shed light on the level of effort a user put in when
generating it. We would expect a bot to have this process automated, so there may be parts
missing or repeated [66]. Bots may also want to provide less information because what
they are claiming is false, e.g., if the account claims the user is from California but all of its
Chapter 4. BotWalk: Efficient Adaptive Exploration of Twitter Bot Networks 61
tweets are coming from China, it would not want the geo-enabled setting to be turned on.
Conversely, real users often like these types of features because they provide intelligent
shortcuts when entering content. Other attributes like age of the account and whether the
username was auto-generated can provide valuable information about the likelihood that
an account is a bot. In addition to these features, we also look at whether an account is
protected or verified, neither of which a bot account is likely to be, the total number of
tweets and number of followers, both of which are likely to be higher in a bot account that
has managed to persist on Twitter, and several other metadata-related features.
4.4.2 Content-based features
Automated accounts are created for a specific purpose. Whether it is to gain followers
for marketing campaigns, disseminate information, spam sponsored content, or collect
data on other users, there is a goal in mind for each account. There are many features
in the content of the tweets themselves that capture this goal-oriented behavior. Features
quantifying items like hashtags, URLs, and domains, both on a tweet and user level, have
been shown to be effective in identifying bots [25][17]. Identifying repetition in these
entities is also informative. For example, a bot trying to direct followers to a certain site
will want to include that site’s URL in as many tweets as possible. Perhaps they try to
use different URL shorteners to camouflage this effort, so looking for repeated domains in
the extended URL is also helpful [19]. For hashtags, URLs, and domains, we look at both
the average number of entity per tweet as well as the average number of tweets with that
entity. We also quantify the number of duplicate hashtags, URLs, and domains. Another
informative feature is the normalized retweet count. Creating original content is costly
for automated accounts, so retweeting is an easy way to add a life-like feel to a profile
without having to generate this content [33]. Additional features we examine include the
maximum, minimum, mean, and standard deviation of the Jaccard similarity of inter-tweet
bags-of-words, the number of special characters, and tweet lengths.

Chapter 4. BotWalk: Efficient Adaptive Exploration of Twitter Bot Networks 62
4.4.3 Temporal-based features
Analyzing the time series of tweets is a powerful way to distinguish between bots and
humans; indeed, whole papers have been written on bot identification based solely on
temporal characteristics [55][22][23]. Because there are limits to how rapidly and how
often a human being can tweet, quantification of burstiness, defined as ��µ�+µ
[55], the av-
erage number of tweets per day, and the duration of the longest tweet session without a
10 minute break are informative features. Statistics describing the minimum, maximum,
mean, standard deviation, and entropy of the inter-arrival time of consecutive tweets help
to identify bots whose goal is to get as much content out as quickly as possible, or whose
activity is on a programmed schedule. Other features we use to identify scheduled be-
havior are the p-values of the �2 test applied to the second-of-minute, minute-of-hour,
and hour-of-day distributions, which evaluates whether tweets are drawn uniformly across
these distributions.
4.4.4 Network-based features
Network-based features can be very helpful in characterizing Twitter user behavior. Re-
search has shown that bots that persist in the Twitter network tend to amass a large num-
ber of followers [27] and friends. Figure 4.2 shows the connections between a set of
previously-labeled bots.
There are a variety of connections that can join nodes, including follow, friends, and
mention connections. We take an ego-based approach to these relationships, quantifying
the out-degree of the user’s follow network, the out-degree of the user’s friend network,
and the out-degree of the user’s mention network. These help to summarize the user’s
connectivity to others in a variety of ways.

Chapter 4. BotWalk: Efficient Adaptive Exploration of Twitter Bot Networks 63
Figure 4.2: Follower relationships between Twitter bots. Node colors represent highly-correlated activity stream clusters (see Section 4.6.2). Note the highly-connected natureof many of the bots.
Number ofNodes
Number ofEdges
Number of completeout-edge sets
Number of 48hrstreams collected
362,000 226 Million 110,800 75,000
Table 4.2: Statistics of our publicly-available dataset
4.4.5 Feature selection and normalization
After encoding categorical features using one-hot encoding we have over 9000 features. It
is likely that not all of these feature are informative, so we choose to remove features that
have the same value in 99.9% of samples, which reduces the feature space to 130 features.
We then use the L2 norm to independently normalize each sample. For the partitioned
outlier detection method, described in Section 4.5.3, we perform feature selection and
feature normalization on each subset separately.

Chapter 4. BotWalk: Efficient Adaptive Exploration of Twitter Bot Networks 64
4.4.6 Publicly-available dataset
Through the course of this research, we collected and analyzed a large body of Twitter
data, which we are releasing for public use on the BotWalk page [8]. This dataset was
collected using the Twitter API and the Tweepy Python library [12]. We collected 5 types
of information: friendship relationships, follower sets, activity streams, timelines (which
includes a user’s 200 most recent tweets), and user metadata. We store the bot and follower
metadata in a PostgreSQL database (exported to CSV files for public release) and the user
stream and timeline data in JSON files. Table 4.2 contains basic statistics of this dataset.
4.5 Ensemble Anomaly Detection
In order to adaptively identify bots with ever-changing behavior, we employ an unsuper-
vised anomaly detection approach. Anomaly detection has been shown to be successful
in identifying samples with previously-unseen or fraudulent behavior [43][48] , so it is
appropriate for this application. We employ true unsupervised anomaly detection in our
method, which learns from the structure of the data itself with no outside guidance or
labels.
To capture a variety of types of anomalous behavior, we use an ensemble of anomaly
detection algorithms, which was shown to be effective in Chapter 3. In general, anomaly
detection algorithms can be classified into four broad categories: density-based; distance-
based; angle-based; and, more recently, isolation-based. For this work we use on from
each of these categories. We choose to use Local Outlier Factor (LOF) as our baseline for
comparison, since it is well-known, commonly used, and shown to be effective on a wide
variety of data [20][48]. We find that this ensembling method improves precision by 5%
when compared to LOF alone.
Chapter 4. BotWalk: Efficient Adaptive Exploration of Twitter Bot Networks 65
Algorithm 2 UnsupervisedOutlierDet1: Input: Feature Matrix F
2: for column c in F do
3: �2
c =
NPi=1
(c�µ)2
N;
4: if �2
c < 0.001 then
5: Remove c from F;
6: for row r in F do
7: x = rpr21+...+r2i+...+r2n
; // Normalize row
8: Normalized LOF score, sLOF = Eq4.8(Eq4.2(x));
9: Normalized distance score, sD = Eq4.8(Eq4.4(x));
10: Normalized cos distance score, sC = Eq4.8(Eq4.5(x));
11: Normalized IF score, sIF = Eq4.8(Eq4.6(x));
12: sr = sLOF+sD+sC+sIF4
;
13: Return: Scores S;
4.5.1 Anomaly Detection Algorithms
Local Outlier Factor
Local Outlier Factor (LOF) was described in detail in Section 3.5.1. We repeat the defini-
tions here for clarity and readability. LOF uses the notion of k-distance (distk(x)), which
is defined as the distance to the k-th nearest neighbor of a point. Local reachability dis-
tance (lrdk) of x is the average of the reachability distances from x’s neighbors to x. Here
Nk(x) is the set of k-nearest neighbors of x.
lrdk(x) =||Nk(x)||P
y2Nk(x)max(distk(y), dist(x, y))
(4.1)
The LOF of a point x is the average of the ratios of the local reachability of x and its
k-nearest neighbors. LOF can capture several normal clusters of arbitrary densities, which

Chapter 4. BotWalk: Efficient Adaptive Exploration of Twitter Bot Networks 66
makes it robust for any data domain. Formally, LOF is defined as below:
LOFk(x) =
Py2Nk(x)
lrdk(y)lrdk(x)
||Nk(x)||(4.2)
Distance- and Angle-Based Methods
In addition to a density-based measure, we use distance- and angle-based measures. We
first generate an ideal ‘normal’ node by calculating the median of each feature (because
we have many categorical features, we use the median, rather than the mode, which was
used in Section 3.5.1).
c = median(col) 8 col in F (4.3)
We then find the Euclidean distance between every user x and this ideal individual c,
giving us a distance-based outlier score.
DBD(x) =
p(x
1
� c1
)
2
+ ...+ (xn � cn)2 (4.4)
To calculate an angle-based outlier score, we use the same center node but calculate the
cosine distance between the two nodes.
ABD(x) =
x · c||x|| ||c|| (4.5)
Isolation-based Method
Lastly, we use an Isolation Forest algorithm [41]. Rather than constructing an idea of
normality and identifying instances that differ from that, this algorithm instead isolates
outliers from normal samples. Given our feature matrix F, this algorithm recursively splits
the rows of F by randomly selecting a column c and a split value s, where min(c) <=
s <= max(c). This recursive splitting forms a tree structure, and an Isolation Forest
contains k such trees. The anomaly score is then defined based on the path length h(x),
which is the number of edges a sample traverses before terminating in an external node.
Chapter 4. BotWalk: Efficient Adaptive Exploration of Twitter Bot Networks 67
Specifically, the anomaly score for a sample x from a size n dataset is defined by the
equation:
s(x, n) = 2
�E(h(x))c(n) (4.6)
where E(h(x)) is the average of h(x) from a collection of isolation trees, and c(n) is the
average path length of an unsuccessful search in a Binary Search Tree, which is defined as
c(n) = 2H(n� 1)� (2(n� 1)/n) (4.7)
Intuitively, if a sample has very anomalous feature values, it is going to be easily split from
the remaining samples and thus will have, on average, a much shorter path length than a
normal sample. Thus, when E(h(x)) is close to 0, s(x, n) is close to 1, indicating it is very
likely an anomalous sample. When E(h(x)) is close to n, s(x, n) is close to 0, indicating
it is a normal sample.
4.5.2 Combining different anomaly detection scores
As discussed in Section 3.5.2, each of the above methods produces a different type of
score: Equation 4.2 returns a local reachability score, Equation 4.4 returns a distance,
Equation 4.5 returns a cosine distance, and Equation 4.6 returns a score based on an av-
eraged path length. Before combining these scores, we need to regularize and normalize
them. We take the approach used in Chapter 3 from [38][58], which employs Gaussian
scaling to normalize each outlier score separately before combining them into a single
score.
Let a user be x and the outlier score of x is s(x). We scale each s(x) using a Gaussian
distribution to produce a probability p(x) between 0 and 1 of the user x being an outlier.
p(x) = max(0, erf(s(x)� µsp
2�s
)) (4.8)
We then can average these probabilities to produce one outlier score per user.
Chapter 4. BotWalk: Efficient Adaptive Exploration of Twitter Bot Networks 68
4.5.3 Applying domain knowledge to improve performance
In addition to the interpretability of the bot labels produced by this method, another ad-
vantage to using observed features is that we can employ domain knowledge of the feature
space to improve performance. As described in Section 4.4, we have four feature cate-
gories: metadata-, content-, temporal-, and network-based. These feature subsets describe
different aspects of a user’s online behavior and have different feature spaces and scales.
For example, the majority of the metadata features are categorical, e.g., language and time
zone, and thus explode into a large feature space when using one-hot encoding. This could
potentially overwhelm other features, leading to results biased towards metadata anoma-
lies. Based on this observation, we choose to partition the feature space into these four
subdomains and apply feature selection, sample normalization, and anomaly detection
separately in each feature sub-space. We then combine these scores using the method de-
scribed in the previous section. We perform this partitioned anomaly detection both with
the ensemble of outlier detection algorithms and local outlier factor, as a baseline. Our
experimental results show that this separation increases the precision of LOF by 30% and
the ensemble method by 25%, achieving an precision of 90% for both methods.
4.6 Experimental Analysis
4.6.1 Real-time data collection
Section 4.3 described the high-level exploration algorithm. We now go into the details of
the actual execution. All code from these experiments is available on GitHub [2].
To expand from a seed user using the Twitter REST API [13], we first collect the fol-
lower set of this user, limited to the 5000 most recent followers to constrain the search
space. (These followers are also less likely to be suspended since they have performed
a recent activity, so in this way we avoid wasting queries.) We then collect the timeline,

Chapter 4. BotWalk: Efficient Adaptive Exploration of Twitter Bot Networks 69
which is the 200 most recent tweets by the user, and the user information, which is the
metadata associated with this account, for every follower in this set. We can collect 180
timelines every 15 minutes and metadata for 90,000 users every 15 minutes (queries must
be performed sequentially, not concurrently). Once we have collected these data, we ex-
tract our comprehensive set of features and perform anomaly detection.
4.6.2 Experimental Design
We design our experiments to assess the following items:
• Is our algorithm effective at identifying bots?
• As we explore and replace the seed bots, do we continue to find high-quality results?
• Are we able to identify bots with novel behavior as we explore?
For our experiments, we first randomly select 15 non-suspended bots from our labeled
dataset. This dataset contains ⇠ 700, 000 labeled bot accounts identified by DeBot [22],
which finds users with highly-correlated activity streams. Debot has a mathematically
proven false positive rate of very close to zero [23], so we can have high confidence in the
precision of these labels. Note that these users represent a specific subset of bot behavior,
as they are so-called ‘dumb’ bots, with an obvious behavioral giveaway. We start with
these users as seed bots, and then gradually adapt to identify bots with different behavior
patterns.
We explore from these seed bots using the four outlier detection methods described
in Section 4.5: LOF and partitioned LOF as our baselines, the ensemble of four anomaly
detection algorithms (density-, distance-, angle-, and isolation-based), and this ensemble
partitioned across the feature space. We run one round of exploration per seed bot, yielding
a total of 15 rounds explored per method, which we call Level 1 exploration. We then
randomly select 15 followers from our most accurate method with the highest average
pairwise percent agreement, partitioned ensemble, and perform one round of exploration

Chapter 4. BotWalk: Efficient Adaptive Exploration of Twitter Bot Networks 70
for each of these 15 seed bots (again using the partitioned ensemble method), which we
call Level 2 exploration. We repeat this process one more time, and call this Level 3
Exploration. The purpose of these multi-level experiments is twofold: to examine how
the identity of the seed bot affects precision and to understand how the behavior of the
identified bots changes as we explore.
4.6.3 Validation
We use four measures to evaluate our results: manual validation, examination of the dis-
tribution of feature values in the 90th or 10th percentile, differences in the distributions
of specific feature values as modeled by the maximum likelihood estimated of the em-
pirical data, and a comparison with the leading supervised method[26] and the leading
unsupervised method[23].
User Study
In fraud identification research, one challenge is that the ground truth is, in reality, un-
knowable. Only the user or botmaster herself truly knows if a given account is a bot.
User studies are thus typically performed to manually validate the results of the algorithm.
While human labeling can of course contain bias, it is still the standard way to label bot
accounts. We base our experimental design on methods from the literature [16][70] to
reduce bias as much as possible.
We first conduct a manual examination of a random sample of 20 anomalous users
from each of the six experiments to evaluate precision. The procedure for this examina-
tion is as follows: we first train our three annotators by showing them 100 different labeled
bot accounts of different types. Next, we have them label each account with ‘bot’, ‘hu-
man’, or ‘unknown’. We take the majority vote for each account as its label and calculate
the average pairwise percent agreement, which is where the agreements of all possible

Chapter 4. BotWalk: Efficient Adaptive Exploration of Twitter Bot Networks 71
Experiment Type Number ofBotWalk-identified bots Precision Annotator
Agreement
LOF 3984 60% 67%Ensemble 3928 65% 80%
Partitioned LOF 3633 90% 87%Level 1 Exploration
(Partitioned Ensemble) 4040 90% 90%
Level 2 Exploration 2215 85% 83%Level 3 Exploration 3302 75% 87%
Table 4.3: Results from the user study for the four anomaly detection methods and thethree levels of exploration.
pairs are calculated and averaged. Table 4.3 shows the results, along with the number of
anomalous users identified by BotWalk in each experiment. We estimate that starting from
the initial 15 seed bots, over the three rounds of exploration we identify 7,995 new bots,
which is over 500 times more than the initial seed bot set size. This estimate is calculated
by multiplying the number of BotWalk-identified bots found by the calculated precision
for each round and summing them. By scaling these values we avoid over-estimating this
number.
Column 3 in Table 4.3 shows that even humans do not always agree on what a bot looks
like. However, apart from unpartitioned LOF, which also has low precision, indicating it
is not an effective method in this context, all of our experiments have average pairwise
percent agreement values of 80% or higher, which is described as an acceptable level of
agreement in the literature [53]. Without partitioning, using an ensemble of anomaly de-
tection algorithms improves the precision by 5%. However, when partitioning is included,
both LOF and the ensemble have 90% precision. This means that the human annotators
agree with 90% of the bot classifications given by our partitioned anomaly detection al-
gorithms. While partitioned LOF and the partitioned ensemble had the same precision in
this experiment, the ensemble had higher average pairwise percent agreement than par-
titioned LOF. Furthermore, understanding that bot behavior continually changes, having
an ensemble of techniques may still provide better anomaly detection for future evolving

Chapter 4. BotWalk: Efficient Adaptive Exploration of Twitter Bot Networks 72
behaviors.
When examining the results for exploration, we can see that as we explore further,
the precision stays fairly high. Level 3 Exploration contains the followers of followers of
followers of our labeled bots, so the fact that we are still able to identify a high percentage
of bots shows that our exploration method is effective. The slight dip in precision suggests
that adding some guidance into the system when selecting the seed bots could be helpful.
Perhaps choosing a small number of the most anomalous followers and only adding those
into the seed bank, rather than a random set selected from all fairly anomalous users, could
improve performance. Investigations into these types of enhancements are left to potential
future work.
Extreme feature values
To profile the anomalous users identified by BotWalk, we identify how many features each
potential bot has that are in the 10th or 90th percentile when compared to a feature vec-
tor of 17,000 random users. We limit this evaluation to integer- and floating point-valued
features. We then plot the distribution of these values for all of our Level 1 Exploration
experiments in Figure 4.3. We also include the percentiles for these random users for ref-
erence. We can see that our identified anomalies have high numbers of ‘extreme’ features,
which shows that our algorithm is successfully identifying anomalous users. Since we
know that the features in our comprehensive feature set are effective at identifying bots,
these results validate that we are indeed identifying bots in our exploration.
Figure 4.4 is a zoomed-in version comparing these distributions for the different
anomaly detection methods. We can see that the partitioned versions of the outlier detec-
tion algorithms are more effective at identifying highly anomalous users than those applied
to the feature space as a whole.
To examine how multiple iterations of the exploration process affect the type of anoma-
lous users we are identifying, we compare the extreme feature values for the anomalies
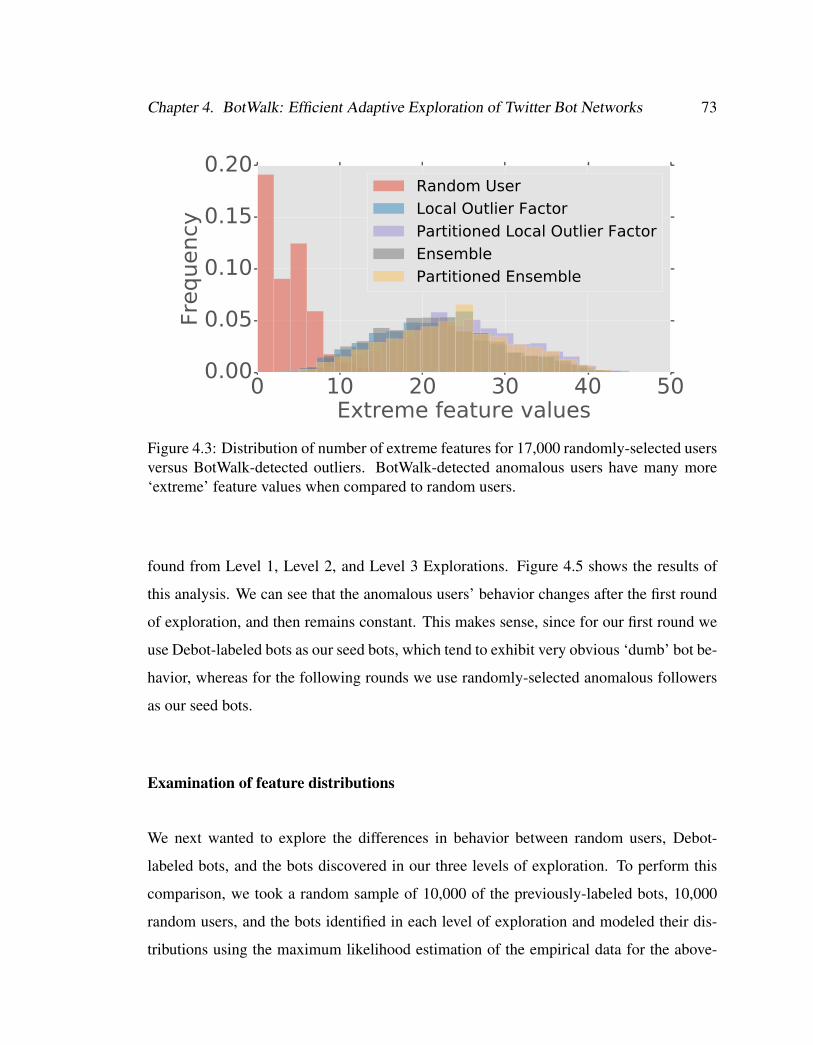
Chapter 4. BotWalk: Efficient Adaptive Exploration of Twitter Bot Networks 73
Figure 4.3: Distribution of number of extreme features for 17,000 randomly-selected usersversus BotWalk-detected outliers. BotWalk-detected anomalous users have many more‘extreme’ feature values when compared to random users.
found from Level 1, Level 2, and Level 3 Explorations. Figure 4.5 shows the results of
this analysis. We can see that the anomalous users’ behavior changes after the first round
of exploration, and then remains constant. This makes sense, since for our first round we
use Debot-labeled bots as our seed bots, which tend to exhibit very obvious ‘dumb’ bot be-
havior, whereas for the following rounds we use randomly-selected anomalous followers
as our seed bots.
Examination of feature distributions
We next wanted to explore the differences in behavior between random users, Debot-
labeled bots, and the bots discovered in our three levels of exploration. To perform this
comparison, we took a random sample of 10,000 of the previously-labeled bots, 10,000
random users, and the bots identified in each level of exploration and modeled their dis-
tributions using the maximum likelihood estimation of the empirical data for the above-

Chapter 4. BotWalk: Efficient Adaptive Exploration of Twitter Bot Networks 74
Figure 4.4: Zoomed in view of the distribution of the number of extreme features foroutliers detected in the 4 experiments. Partitioned anomaly detection methods identifyoutliers with more ‘extreme’ feature values.
Figure 4.5: Comparison of of the distribution of the number of extreme features for explo-ration Levels 1, 2, and 3. Level 1 anomalies have a different extreme feature distributioncompared to Level 2 and Level 3 anomalies, which are very similar.

Chapter 4. BotWalk: Efficient Adaptive Exploration of Twitter Bot Networks 75
(a) Random users are modeled by the exponentiated norm distribution,previously-labeled bots by the lognorm distribution, and bots identifiedin Level 1 exploration by the Beta distribution.
(b) Bots identified in Level 2 exploration are modeled by the power-lognorm distribution, while those from Level 3 exploration are mod-eled by the exponentiated Weibull distribution.
Figure 4.6: Distributions of number of tweets per user.

Chapter 4. BotWalk: Efficient Adaptive Exploration of Twitter Bot Networks 76
(a) Random users are modeled by the Beta distribution, previously-labeled bots by the log-Laplace distribution, and bots identified inLevel 1 exploration by the Beta prime distribution.
(b) Bots identified in Level 2 exploration are modeled by the power-lognorm distribution and those from Level 3 exploration by the Betaprime distribution.
Figure 4.7: Distribution of the maximum inter-arrival time per user.

Chapter 4. BotWalk: Efficient Adaptive Exploration of Twitter Bot Networks 77
(a) Random users are modeled by the exponentiated power distribu-tion, while both previously-labeled bots and bots identified in Level 1exploration 1 are modeled by the exponentiated Weibull distribution.
(b) Bots identified in Levels 1, 2, and 3 exploration are all modeled bythe exponentiated Weibull distribution.
Figure 4.8: Distributions of out-degree of the ego network per user.
described features. We find that BotWalk-discovered bots have significantly different be-
havior than both Debot-labeled bots and random users for many of our features. Fur-

Chapter 4. BotWalk: Efficient Adaptive Exploration of Twitter Bot Networks 78
RandomUser
DebotBots
Level 1Bots
Level 2Bots
Level 3Bots
Random User 100% 22.2 % 22.2% 16.7% 8.33%Debot Bots – 100% 33.3% 8.33% 8.33%
Level 1 Bots – – 100% 40.9% 38.6%Level 2 Bots – – – 100% 59.1%Level 3 Bots – – – – 100%
Table 4.4: Percentage of features that have matching distributions
thermore, we find that as we explore we are identifying bots that are exhibiting novel
behaviors.
Table 4.4 shows the percentage of features that have matching MLE distributions for
each pair of user sets. A subset of these distributions is shown in Figures 4.6, 4.7, and
4.8. These results show that BotWalk bots behave differently than both random users
and Debot-labeled bots. Furthermore, bots identified in Level 3 exploration are the most
dissimilar. This shows that we are continuously identifying bots with novel behavior as
we explore.
Comparison with known methods
We compare BotWalk with the most promising unsupervised algorithm, Debot [22][23],
and the most popular supervised Twitter bot detection algorithm, BotOrNot [26]. We
first evaluate what percentage of our anomalous users these methods are able to detect as
bots. Note that we are examining the relative support of these methods, not comparing
performance, since this is a one-sided comparison. Table 4.5 shows the results of this
study. We see that Debot only identifies between 8.6 and 21% of our anomalous users,
which shows that BotWalk-identified bots are exhibiting novel behavior which is different
from the Debot-labeled seed bots. We find BotOrNot shows between 49-60% detection of
our bots.

Chapter 4. BotWalk: Efficient Adaptive Exploration of Twitter Bot Networks 79
Experiment Debot Detection BotOrNot Detection
LOF 21% 49%Ensemble 21% 51%
Partitioned LOF 17% 64%Level 1 Exploration (Partitioned Ensemble) 19% 60%
Level 2 Exploration 11% 56%Level 3 Exploration 8.6% 49%
Table 4.5: Detection levels of new bots by known methods
We next compare the bot-detection rate of these three methods. This rate necessarily
depends on the rate limitations imposed by Twitter for all three methods. Assuming that
these restrictions are in place, our algorithm has a much higher bot detection rate than these
two leading methods. Since supervised algorithms need to be given specific accounts
to test, the number of bots found depends on the query rate of the algorithm and the
prevalence of bots in Twitter. Using BotOrNot as an example, which has a query rate
of 180 requests per 15 minutes, 17,280 users could be tested per day. Since the current
estimate of bots in Twitter is 8.5%, this method would yield on average 1,469 bots per
day. Debot needs time to collect and analyze users’ data, so it is limited as well: Debot’s
average detection rate is estimated to be 1,619 bots per day [24]. Our method easily beats
both of these, identifying on average 6,000 bots per day. Furthermore, our algorithm is
infinitely linearly scalable: the only shared resource is the two seeds banks, and everything
else can be independent. Therefore, with additional parallel machines and additional API
keys, BotWalk’s detection rate could be even higher.
4.7 Conclusion
This chapter introduces BotWalk, arguably the first near-real time unsupervised Twitter
network exploration algorithm that adaptively identifies bots exhibiting novel behavior.
Key contributions of this work are the implementation of an adaptive approach to feature

Chapter 4. BotWalk: Efficient Adaptive Exploration of Twitter Bot Networks 80
selection and the utilization of domain knowledge to intelligently partition the feature
space, which leads to up to a 30% increase in precision. We perform experiments to
evaluate the performance of an ensemble of outlier detection algorithms, achieving an
precision of 90%. We also perform three levels of iterative exploration and show that
we are able to identify bots that exhibit different behavior than the seed users at a higher
detection rate than existing methods.

81
Chapter 5
Conclusion
The goal of this body of work was to design a collection of data inspection, filtering, fu-
sion, and mining techniques to identify and remove low quality and fraudulent content
from online data. This is a challenging problem in part because of the changing behavior
of fraudsters and the lack of ground truth available. These challenges necessitate the cre-
ation of adaptive, unsupervised methods, which is what this work focuses on. The main
components of this dissertation include: noise removal, data fusion, multi-source feature
generation, network exploration, and anomaly detection. All data collected and code writ-
ten for this work have been made available to the research community at large.
To identify and remove noise in online data, we created ClearView, which is an au-
tomated data cleaning pipeline. We discussed various types of abnormalities that exist in
different review sites and developed filtering techniques to identify and remove them. We
evaluated the performance of our pipeline through an in-depth user study and found that
our pipeline improves the quality of the dataset by up to 3.4 times.
To identify and remove fraud, we created TrueView, a metric for the “trustworthiness”
of a given entity’s review behavior based on multi-source information. The goal of this
work was to show the significant benefits that we can gain by combining reviews from
multiple review sites. As a key contribution, we developed a systematic methodology to

Chapter 5. Conclusion 82
collect, match, and analyze hotels from multiple review sites. The novelty of our approach
relied one the introduction and assessment of 142 features that capture single-site and
cross-site discrepancies effectively. Our approach culminated with the introduction of
the TrueView score, in three different variants, as a proof-of-concept that the synthesis
of multi-site reviews can provide important and usable information to the end user. We
conducted arguably the first extensive study of cross-site discrepancies using real data
from 15M reviews from more than 3.5M users spanning three prominent travel sites. We
found that there are significant variations in reviews, and we found evidence of review
manipulation.
To identify and remove automated accounts, we created BotWalk, arguably the first
near-real time unsupervised Twitter network exploration algorithm that adaptively identi-
fies bots exhibiting novel behavior. Key contributions of this work are the implementation
of an adaptive approach to feature selection and the utilization of domain knowledge to
intelligently partition the feature space, which led to up to a 30% increase in precision.
We performed experiments to evaluate the performance of an ensemble of outlier detec-
tion algorithms, achieving an precision of 90%. We also performed three levels of iterative
exploration and showed that we were able to identify bots that exhibit different behavior
than the seed users at a higher detection rate than existing methods.

83
References
[1] 83% Of SEOs Believe Focusing On Reviews Delivers Good ROI. http://searchengineland.com/local-search-marketers-83-seos-believe-focusing-reviews-delivers-good-roi-220077.
[2] Amanda Minnich’s GitHub. https://github.com/amandajean119.
[3] Consumer Complaints & Reviews.
[4] Google Play Store. https://play.google.com/store/apps.
[5] How Twitter bots fool you into thinking they are real people. http://www.fastcompany.com/3031500/how-twitter-bots-fool-you-into-thinking-they-are-real-people.
[6] Myrtle Beach Area Chamber of Commerce, page 10.
[7] Review your business performance. http://www.infoentrepreneurs.org/en/guides/review-your-business-performance.
[8] Supporting web page containing data, code, case study examples, and user studyresults for BotWalk. www.cs.unm.edu/˜aminnich/botwalk.
[9] Supporting webpage containing data, slides, and code for TrueView.
[10] TripAdvisor. https://www.tripadvisor.com.
[11] TrustScore: The Measurement of Online Reputation Management - TrustYou.
[12] Tweepy, Twitter for Python. http://docs.tweepy.org/.
[13] Twitter REST API. https://dev.twitter.com/rest/public.
[14] Using Online Reviews to Improve Your Business. https://www.reputationloop.com/online-reviews-improve-your-business/.

References 84
[15] Zillow. http://www.zillow.com.
[16] Detecting Automation of Twitter Accounts: Are You a Human, Bot, or Cyborg?IEEE TDSC, 9(6):811–824, Nov. 2012.
[17] S. S. A Chakraborty, J Sundi. Spam: a framework for social profile abuse monitoring.CSE508 report, Stony Brook University, 2012.
[18] L. Akoglu, R. Chandy, and C. Faloutsos. Opinion Fraud Detection in Online Reviewsby Network Effects. In Icwsm, pages 2–11, 2013.
[19] F. Benevenuto, G. Magno, T. Rodrigues, and V. Almeida. Detecting spammers ontwitter. In CEAS, 2010.
[20] M. M. Breunig, H.-P. Kriegel, R. T. Ng, and J. Sander. Lof: Identifying density-basedlocal outliers. SIGMOD, 2000.
[21] D. H. Chau, S. Pandit, and C. Faloutsos. Detecting Fraudulent Personalities in Net-works of Online Auctioneers. In Proceedings of the 10th European conference onPrinciple and Practice of Knowledge Discovery in Databases, PKDD’06, pages 103–114, 2006.
[22] N. Chavoshi, H. Hamooni, and A. Mueen. Debot: Twitter bot detection via warpedcorrelation. In ICDM, pages 817–822, 2016.
[23] N. Chavoshi, H. Hamooni, and A. Mueen. Identifying correlated bots in twitter. InSocInfo, pages 14–21, 2016.
[24] N. Chavoshi, H. Hamooni, and A. Mueen. Temporal patterns in bot activities. InTempWeb, 2017.
[25] E. M. Clark et al. Sifting robotic from organic text: A natural language approach fordetecting automation on twitter. CoRR, abs/1505.04342, 2015.
[26] C. A. Davis et al. Botornot: A system to evaluate social bots. WWW ’16 Companion,pages 273–274, 2016.
[27] S. De Paoli. The automated production of reputation: Musing on bots and the futureof reputation in the cyberworld. IRIE, 2013.
[28] J. P. Dickerson et al. Using sentiment to detect bots on twitter: Are humans moreopinionated than bots? In ASONAM, 2014.
[29] G. Fei, A. Mukherjee, B. Liu, M. Hsu, M. Castellanos, and R. . Exploiting Burstinessin Reviews for Review Spammer Detection. In Proceedings of the Seventh Interna-tional AAAI Conference on Weblogs and Social Media, pages 175–184, 2013.
References 85
[30] S. Feng, L. Xing, A. Gogar, and Y. Choi. Distributional Footprints of DeceptiveProduct Reviews. In Sixth International AAAI Conference on Weblogs and SocialMediaI (CWSM), pages 98–105, 2012.
[31] P. Galan-Garcıa et al. Supervised machine learning for the detection of troll profilesin twitter social network: Application to a real case of cyberbullying. In SOCO13-CISIS13-ICEUTE13, pages 419–428. 2014.
[32] R. Ghosh, T. Surachawala, and K. Lerman. Entropy-based classification of ’retweet-ing’ activity on twitter. CoRR, 2011.
[33] M. Giatsoglou et al. Retweeting activity on twitter: Signs of deception. In PAKDD,pages 122–134, 2015.
[34] D. Haas, S. Krishnan, J. Wang, M. J. Franklin, and E. Wu. Wisteria: Nurturingscalable data cleaning infrastructure. Proc. VLDB Endow., 8(12):2004–2007, Aug.2015.
[35] N. Jindal and B. Liu. Opinion spam and analysis. In Proceedings of the internationalconference on Web search and web data mining WSDM 08, WSDM ’08, page 219,2008.
[36] N. Jindal, S. Morgan, and B. Liu. Finding Unusual Review Patterns Using Unex-pected Rules. In Information Systems Journal, CIKM ’10, pages 1549–1552, 2010.
[37] D. Klein and C. D. Manning. Accurate unlexicalized parsing. In ACL’03, pages423–430, 2003.
[38] H. Kriegel, P. Kroger, E. Schubert, and A. Zimek. Interpreting and Unifying OutlierScores. In Sdm, pages 13–24, 2011.
[39] S. Krishnana et al. ActiveClean: interactive data cleaning for statistical modeling.volume 9, pages 948–959. VLDB Endowment, 2016.
[40] E.-P. Lim, V.-A. Nguyen, N. Jindal, B. Liu, and H. W. Lauw. Detecting ProductReview Spammers using Rating Behaviors. In Proceedings of the 19th ACM Inter-national Conference on Information and Knowledge Management, CIKM ’10, pages939–948, 2010.
[41] F. T. Liu, K. M. Ting, and Z.-H. Zhou. Isolation forest. In ICDM, pages 413–422,2008.
[42] S. Luan, A. Mueen, M. Faloutsos, and A. Minnich. Online Review Assessment UsingMultiple Sources. (US Patent 20,160,070,709), 2016.
References 86
[43] M. V. Mahoney and P. K. Chan. Learning nonstationary models of normal networktraffic for detecting novel attacks. In KDD, 2002.
[44] C. D. Manning et al. The Stanford CoreNLP natural language processing toolkit.In Association for Computational Linguistics (ACL) System Demonstrations, pages55–60, 2014.
[45] J. L. Marble et al. The human factor in cybersecurity: Robust & intelligent defense.In Cyber Warfare: Building the Scientific Foundation, pages 173–206, 2015.
[46] J. McAuley and J. Leskovec. Hidden factors and hidden topics: Understanding ratingdimensions with review text. In RecSys’13, pages 165–172, 2013.
[47] A. J. Minnich, N. Abu-El-Rub, M. Gokhale, R. Minnich, and A. Mueen. Clearview:Data cleaning for online review mining. In 2016 IEEE/ACM International Confer-ence on Advances in Social Networks Analysis and Mining, ASONAM 2016, SanFrancisco, CA, USA, August 18-21, 2016, pages 555–558, 2016.
[48] A. J. Minnich, N. Chavoshi, A. Mueen, S. Luan, and M. Faloutsos. TrueView: Har-nessing the Power of Multiple Review Sites. In Proceedings of the 24th InternationalConference on World Wide Web, WWW ’15, pages 787–797, 2015.
[49] A. Mukherjee, A. Kumar, B. Liu, J. Wang, M. Hsu, M. Castellanos, and R. Ghosh.Spotting opinion spammers using behavioral footprints. In Proceedings of the 19thACM SIGKDD international conference on Knowledge discovery and data mining -KDD ’13, KDD ’13, page 632, 2013.
[50] A. Mukherjee, B. Liu, and N. Glance. Spotting fake reviewer groups in consumerreviews. In Proceeding WWW ’12 Proceedings of the 21st international conferenceon World Wide Web, WWW ’12, pages 191–200, 2012.
[51] A. Mukherjee, B. Liu, J. Wang, N. Glance, and N. Jindal. Detecting Group ReviewSpam. In Evaluation, WWW ’11, pages 93–94, 2011.
[52] V. Narayanan, I. Arora, and A. Bhatia. Fast and accurate sentiment classificationusing an enhanced naive bayes model. CoRR, abs/1305.6143, 2013.
[53] K. Neuendorf. The Content Analysis Guidebook. SAGE Pub., 2002.
[54] M. Ott, Y. Choi, C. Cardie, and J. T. Hancock. Finding Deceptive Opinion Spam byAny Stretch of the Imagination. In Proceedings of the 49th Annual Meeting of theAssociation for Computational Linguistics: Human Language Technologies - Volume1, HLT ’11, pages 309–319, 2011.
[55] J. Pan, Y. Liu, X. Liu, and H. Hu. Discriminating bot accounts based solely ontemporal features of microblog behavior. Physica A, 450(C):193–204, 2016.
References 87
[56] B. Pang, L. Lee, and S. Vaithyanathan. Thumbs up?: sentiment classification usingmachine learning techniques. In EMNLP’02, pages 79–86.
[57] M. Rahman, J. Ballesteros, G. Burri, and G. Tech. Turning the Tide : Curbing De-ceptive Yelp Behaviors. In SIAM International Conference on Data Mining (SDM),pages 244–252, 2014.
[58] E. Schubert et al. On evaluation of outlier rankings and outlier scores. In SDM, pages1047–1058, 2012.
[59] P. Snyder. tmpfs: A virtual memory file system. In Proceedings of the Autumn 1990EUUG Conference, pages 241–248, 1990.
[60] R. Socher et al. Parsing With Compositional Vector Grammars. In EMNLP’13. 2013.
[61] R. Socher et al. Recursive deep models for semantic compositionality over a senti-ment treebank. In EMNLP 2013, pages 1631–1642, 2013.
[62] V. S. Subrahmanian et al. The DARPA twitter bot challenge. CoRR, abs/1601.05140,2016.
[63] H. Sun, A. Morales, and X. Yan. Synthetic review spamming and defense. In Pro-ceedings of the 19th ACM SIGKDD international conference on Knowledge discov-ery and data mining - KDD ’13, WWW ’13 Companion, page 1088, 2013.
[64] C. Teljstedt, M. Rosell, and F. Johansson. A semi-automatic approach for labelinglarge amounts of automated and non-automated social media user accounts. ENIC,00:155–159, 2015.
[65] K. Thomas et al. Trafficking Fraudulent Accounts : The Role of the UndergroundMarket in Twitter Spam and Abuse Trafficking Fraudulent Accounts. In USENIX,pages 195–210, 2013.
[66] B. Wang, A. Zubiaga, M. Liakata, and R. Procter. Making the most of tweet-inherentfeatures for social spam detection on twitter. CoRR, abs/1503.07405, 2015.
[67] G. Wang, S. Xie, B. Liu, and P. S. Yu. Review graph based online store review spam-mer detection. In Proceedings - IEEE International Conference on Data Mining,ICDM, ICDM ’11, pages 1242–1247, 2011.
[68] G. Wu, D. Greene, and P. Cunningham. Merging multiple criteria to identify sus-picious reviews. In Proceedings of the fourth ACM conference on Recommendersystems - RecSys ’10, RecSys ’10, page 241, 2010.
[69] S. Xie, G. Wang, S. Lin, and P. S. Yu. Review spam detection via temporal patterndiscovery. In Proceedings of the 18th ACM SIGKDD international conference onKnowledge discovery and data mining - KDD ’12, KDD ’12, page 823, 2012.

References 88
[70] C. M. Zhang and V. Paxson. Detecting and analyzing automated activity on twitter.In PAM, pages 102–111, 2011.
[71] Z. Zhao and H. Liu. Spectral feature selection for supervised and unsupervised learn-ing. In Proceedings of the 24th international conference on Machine learning, ICML’07, pages 1151–1157, 2007.


![On Pro ling Bots in Social Media - arXiv › pdf › 1609.00543.pdf · Fig.1: Examples of broadcast, consumption and spam bots in Twitter of pro ling bots in social media [21,17,13,4,12,20,10,11,2,8,1,18],](https://img.pdfslide.us/doc/110x75/5f0c373f7e708231d4344f30/on-pro-ling-bots-in-social-media-arxiv-a-pdf-a-160900543pdf-fig1-examples.jpg)
![DNS Based Spam Bots Detection in a University · 2012-04-10 · the spam bots activity is high in the campus network [8]. This is probably because the spam bots activity can be easily](https://img.pdfslide.us/doc/110x75/5f0833927e708231d420d704/dns-based-spam-bots-detection-in-a-2012-04-10-the-spam-bots-activity-is-high-in.jpg)