Embed Size (px)
Citation preview
Space for WastePlanning for the
Informal Recycling Sector
Chintan Environment Research and Action Group
This study was undertaken by
Chintan Environmental Researchand Action Group and the
report prepared in collaboration with
Hazards Centre.
Financial assistance for this project
was made available by the Heinrich
Boell Stiftung, Berlin.
Chintan is a registered, non-profit
organization working on issues of
sustainable, equitable, consumption
through grass roots work, research
and outreach. We work in the area
of the informal sector and recycling,
waste management and toxics,
environmental education and child
environmental health.
Our work includes organizing the
informal recycling sector, helping
build their capacities and collectively
finding opportunities for them to
equitably participate in the delivery
of urban environmental services.
To learn more about us,
see www.chintan-india.orgChintan can also be contacted at
238 Sidhartha Enclave
New Delhi - 110014
T: 0091-11-24314478
Chintan has been working on environmental issuesfor almost five years now. An important focal areafor us has been the issue of sustainable, equitableconsumption. Chintan’s entry point into this issueis through the issue of waste. One of our concernsrevolves around the functioning of the informalsector, comprising waste pickers, kabaris or wastetraders and reprocessors. This sector both enablesand subsidizes consumption by the middle classes,while supplementing the inadequate waste handlinginfrastructure that exists. Yet, they remain withoutany official recognition.
This is indeed a strange position, because verbally,the recycling sector is praised for its contributionin many seminars and workshops across the country.Indeed, even the Planning Commission, in the BajajCommittee Report, 1994, stresses home theimportance of the sector and its poor workingconditions. However, the ground reality remainsdifferent. The sector works in conditions of greatinsecurity, collecting and segregating waste underhazardous, unplanned conditions. The waste is soldto waste dealers, or kabaris, who also operate fromshanties under unplanned conditions. Ironically,they pay substantial amounts to various agencies,formally or otherwise, for using this land. The workof this sector was earlier estimated to have savedthe city of Delhi, for example, at least Rs. 12 lakhsdaily in costs of sheer manpower. However, thisreport shows that the amount is much higher. Thepicture that emerges is one of the poorest personsin urban India subsidizing the life-styles andconsumption of the richest.
One of the important reasons why the sector isforced to work in this invisible way is the absence
Prefaceof any provisions for their work in the planning ofcities. This puts them beyond the margins of legality.Without official sanction of their work, the activityof the recyclers itself becomes illegal and morevulnerable to various pressures from civic authorities.In general, by planning for a sector as vital as this,the activity of recycling itself receives a boost, andthe benefits extend to the government as well.
Chintan decided to understand the planning needsof this sector by undertaking a study in Delhi, acity we know well. Our team comprised bothmembers of the recycling industry and professionalswho were well versed with planning andenvironmental issues. Our approach was tounderstand the needs layer by layer, from the levelof the ragpicker to the biggest waste dealers. Ineach case, questionnaires were administered anddata collected through observations andmeasurements. We then worked intensively withHazards Centre, to understand the data within theplanning framework. The emerging picture waspresented to various sections of the informalrecycling sector and their comments and suggestionsincorporated. A final report was then generated.
This is that report. It offers policy makers both arationale and the means by which the needs ofthe informal sector should be included in planningfor a big city. We hope that this report helps policymakers see the possibilities of partnering the sectorwith new eyes, but also, encourages them toactualize these possibilities.
Bharati ChaturvediDirector, Chintan May 2003
Contents1.0 Introduction Page 1
1.1 About the Study Page 1
1.2 Solid Waste Management Page 2
2.0 The Informal Sector in Solid Waste Management Page 4
2.1 An Overview Page 4
2.2 Waste Generation and Collection Page 5
2.3 Waste Collection by Self-employed Waste Pickers Page 8
2.4 Collection and Segregation by Employed Labourers Page 10
2.5 Small Kabaris Page 11
2.6 Thiawalas Page 14
2.7 Big Kabaris Page 14
3.0 Planning Norms Page 15
4.0 Recommendations Page 17
References Page 18
1.1 About the StudyIndia has traditionally been a nation whosepopulation predominantly (80%) lives in its villages.However, another reality is slowly but surelyemerging: the great urban boom. By 2021, it isestimated that 40% of Indians will be living inurban areas. As urban conurbations and corridorsemerge in various parts of India, how will theyimpact on the urban poor, their livelihoods, andthe environment?
For several years now, Chintan has been workingamongst one of the most underprivileged sectionsof the urban poor – the sector of self-employedpeople called waste pickers. In Delhi itself, whereit is said they may number upto 70,000 persons,they save the municipalities at least 6 lakh rupeesdaily, picking up between 9-15% of the waste,but their own professional and personal situationis far from empowered and profitable. A studycurrently being undertaken by Chintan shows thatthis informal sector itself feels that cuts, beatings,vehicle hits on roads, unsegregated waste, toxicchemicals in the waste, and breathing ailments,including acute breathlessness through fumes andallergies, are amongst the most commonoccupational hazards they face. This is also beingborne out by clinical tests. This is furthercompounded by poor living conditions, which arealso the cause of diseases seen in the study: worminfestations and stomach ailments - a direct resultof poor sanitation. Often they are unable to accessadequate care for these ailments. Owing to theirstatus/image, they are unwelcome in Governmenthospitals and are under-confident about accessingeven the most basic facilities. Thus, recycling takesplace at the cost of human health. It no longerremains a green activity.
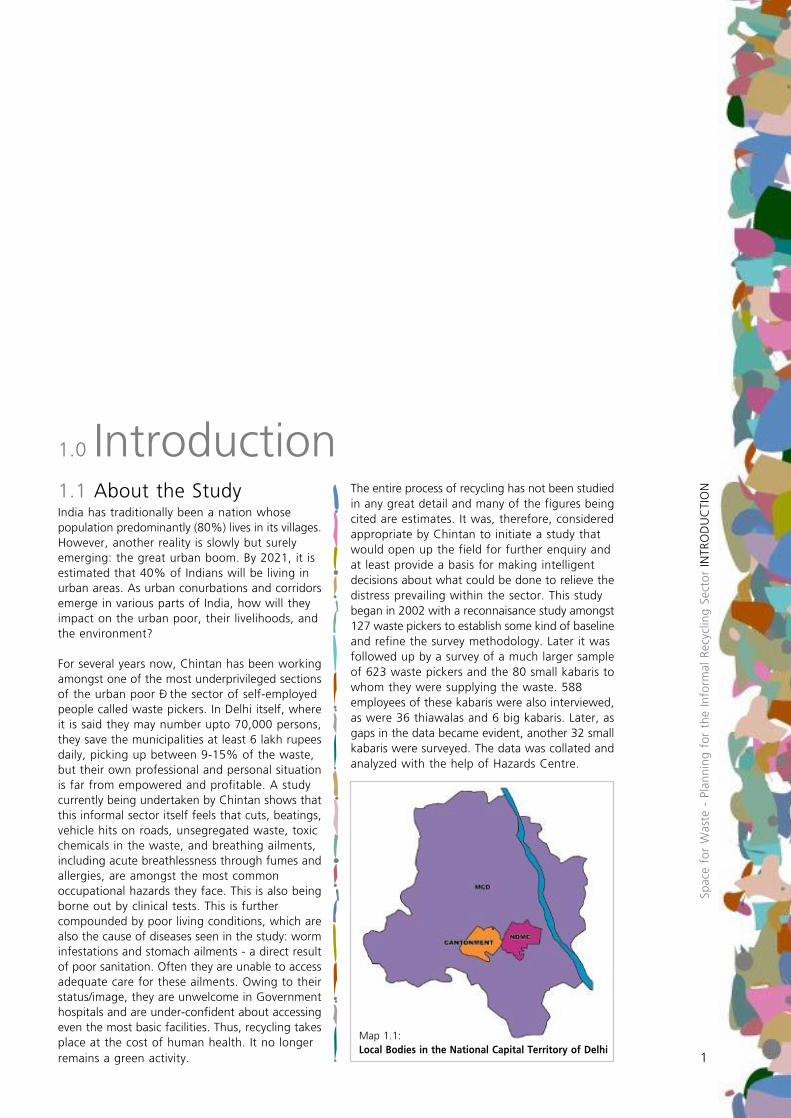
1.0 IntroductionThe entire process of recycling has not been studiedin any great detail and many of the figures beingcited are estimates. It was, therefore, consideredappropriate by Chintan to initiate a study thatwould open up the field for further enquiry andat least provide a basis for making intelligentdecisions about what could be done to relieve thedistress prevailing within the sector. This studybegan in 2002 with a reconnaisance study amongst127 waste pickers to establish some kind of baselineand refine the survey methodology. Later it wasfollowed up by a survey of a much larger sampleof 623 waste pickers and the 80 small kabaris towhom they were supplying the waste. 588employees of these kabaris were also interviewed,as were 36 thiawalas and 6 big kabaris. Later, asgaps in the data became evident, another 32 smallkabaris were surveyed. The data was collated andanalyzed with the help of Hazards Centre.
Map 1.1:Local Bodies in the National Capital Territory of Delhi
Spac
e fo
r W
aste
- P
lan
nin
g f
or
the
Info
rmal
Rec
yclin
g S
ecto
r IN
TRO
DU
CTI
ON
1
One of the unique features of this study has beenthat all the data has been collected by waste pickersalong with other researchers from Chintan. Thisprovides a wealth of qualitative detail, and bringsto the fore the innate knowledge of the terrainby the surveyors. The draft report was also presentedbefore a public meeting of waste pickers to obtaintheir responses and consent to the findings of thestudy. Since Chintan’s organizational work at thetime of beginning the study was in the New andCentral Delhi area, most of the respondents wereeither from here or the immediate periphery.Furthermore, the entire area has not beencompletely covered because of obvious limitationsof time and money. Nevertheless, the conclusionsdrawn in this final report will, we hope, prove tobe of great value to all those practitioners andresearchers and policy makers who are concernedwith this sector.
1.2 Solid Waste ManagementCurrently, Municipalities across India are facing upto a new challenge: handling greater amounts andtypes of waste each year, as consumption levels rise.The provision of basic services is primarily theresponsibility of the three local bodies in the NationalCapital Territory (NCT) of Delhi - the MunicipalCorporation of Delhi (MCD), the New Delhi MunicipalCommittee (NDMC) and the Cantonment Board (CB)[Map 1.1]. Among the three the MCD is the largestlocal body with the responsibility of providing thebasic amenities to both rural and urban areasencompassing 1397.3 sq kms or 95 per cent of thewhole NCT area. The figures for waste generationhave increased from 4,000 metric tonnes (MT) in1994-95 to almost 8,000 MT in 2002. By 2020, itis estimated that waste will rise up to 23,000 MT.In the absence of instruments to reduce the wastegenerated, how can a Municipality tackle thisincreasing mess?
It is now widely recognised that Solid WasteManagement is an integrated affair comprising ofvarious interlinked steps (ISS, 2000): Minimising waste generation Maximising the reuse of recyclables Promoting safe and sound disposal Extending full coverage of services
Map 1.2:Landfill Sitesin Delhi
Spac
e fo
r W
aste
- P
lan
nin
g f
or
the
Info
rmal
Rec
yclin
g S
ecto
r IN
TRO
DU
CTI
ON
2
However, in actual practice, the MCD continues withthe traditional practice of providing for: Neighbourhood bins for collection of household waste Primary transport of street waste to bins and collection points Secondary transport to disposal sites Actual disposal
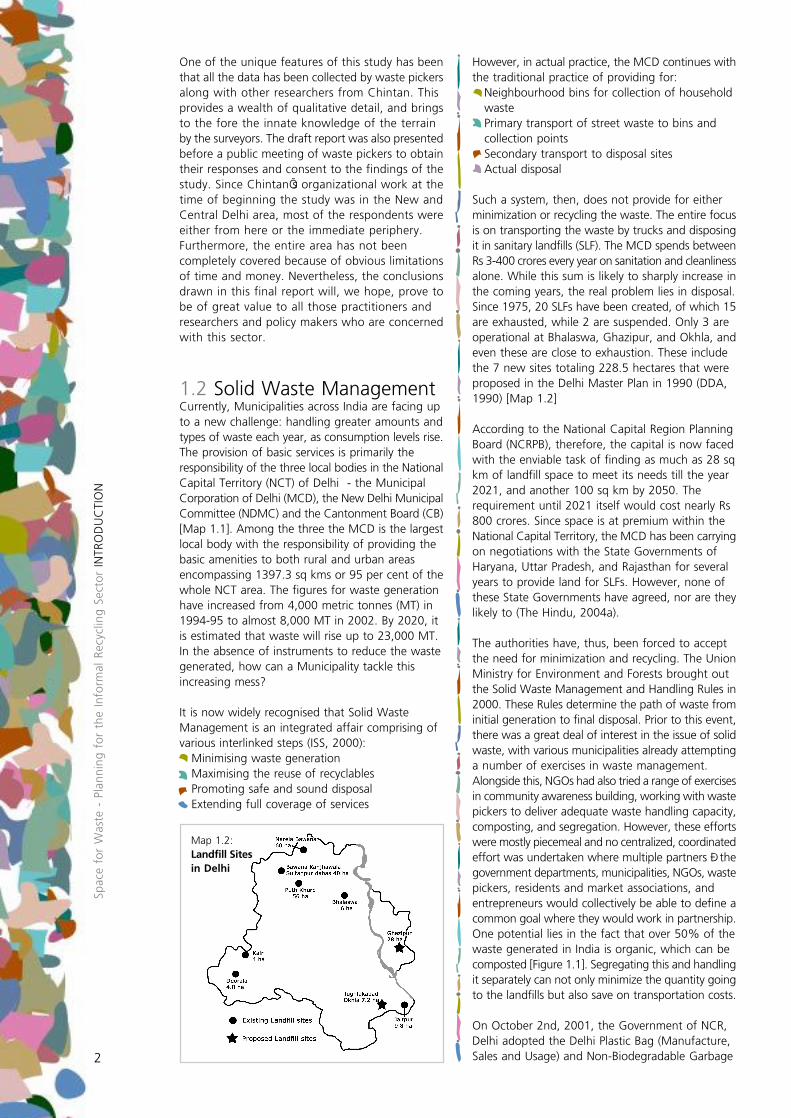
Such a system, then, does not provide for eitherminimization or recycling the waste. The entire focusis on transporting the waste by trucks and disposingit in sanitary landfills (SLF). The MCD spends betweenRs 3-400 crores every year on sanitation and cleanlinessalone. While this sum is likely to sharply increase inthe coming years, the real problem lies in disposal.Since 1975, 20 SLFs have been created, of which 15are exhausted, while 2 are suspended. Only 3 areoperational at Bhalaswa, Ghazipur, and Okhla, andeven these are close to exhaustion. These includethe 7 new sites totaling 228.5 hectares that wereproposed in the Delhi Master Plan in 1990 (DDA,1990) [Map 1.2]
According to the National Capital Region PlanningBoard (NCRPB), therefore, the capital is now facedwith the enviable task of finding as much as 28 sqkm of landfill space to meet its needs till the year2021, and another 100 sq km by 2050. Therequirement until 2021 itself would cost nearly Rs800 crores. Since space is at premium within theNational Capital Territory, the MCD has been carryingon negotiations with the State Governments ofHaryana, Uttar Pradesh, and Rajasthan for severalyears to provide land for SLFs. However, none ofthese State Governments have agreed, nor are theylikely to (The Hindu, 2004a).
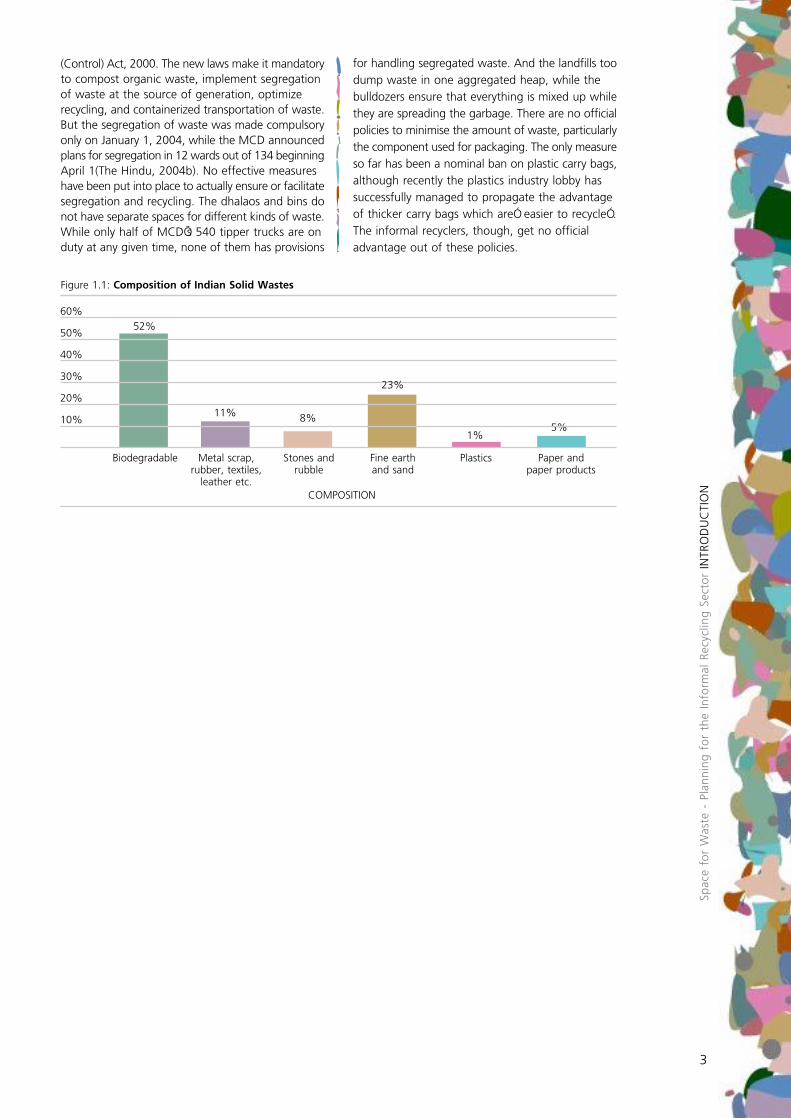
The authorities have, thus, been forced to acceptthe need for minimization and recycling. The UnionMinistry for Environment and Forests brought outthe Solid Waste Management and Handling Rules in2000. These Rules determine the path of waste frominitial generation to final disposal. Prior to this event,there was a great deal of interest in the issue of solidwaste, with various municipalities already attemptinga number of exercises in waste management.Alongside this, NGOs had also tried a range of exercisesin community awareness building, working with wastepickers to deliver adequate waste handling capacity,composting, and segregation. However, these effortswere mostly piecemeal and no centralized, coordinatedeffort was undertaken where multiple partners – thegovernment departments, municipalities, NGOs, wastepickers, residents and market associations, andentrepreneurs would collectively be able to define acommon goal where they would work in partnership.One potential lies in the fact that over 50% of thewaste generated in India is organic, which can becomposted [Figure 1.1]. Segregating this and handlingit separately can not only minimize the quantity goingto the landfills but also save on transportation costs.
On October 2nd, 2001, the Government of NCR,Delhi adopted the Delhi Plastic Bag (Manufacture,Sales and Usage) and Non-Biodegradable Garbage
(Control) Act, 2000. The new laws make it mandatoryto compost organic waste, implement segregationof waste at the source of generation, optimizerecycling, and containerized transportation of waste.But the segregation of waste was made compulsoryonly on January 1, 2004, while the MCD announcedplans for segregation in 12 wards out of 134 beginningApril 1(The Hindu, 2004b). No effective measureshave been put into place to actually ensure or facilitatesegregation and recycling. The dhalaos and bins donot have separate spaces for different kinds of waste.While only half of MCD’s 540 tipper trucks are onduty at any given time, none of them has provisions
for handling segregated waste. And the landfills toodump waste in one aggregated heap, while thebulldozers ensure that everything is mixed up whilethey are spreading the garbage. There are no officialpolicies to minimise the amount of waste, particularlythe component used for packaging. The only measureso far has been a nominal ban on plastic carry bags,although recently the plastics industry lobby hassuccessfully managed to propagate the advantageof thicker carry bags which are” easier to recycle”.The informal recyclers, though, get no officialadvantage out of these policies.
Spac
e fo
r W
aste
- P
lan
nin
g f
or
the
Info
rmal
Rec
yclin
g S
ecto
r IN
TRO
DU
CTI
ON
3
Figure 1.1: Composition of Indian Solid Wastes
Biodegradable Metal scrap,rubber, textiles,
leather etc.
Stones andrubble
Fine earthand sand
Plastics Paper andpaper products
60%
50%
40%
30%
20%
10%
52%
COMPOSITION
8%5%
11%
1%
23%
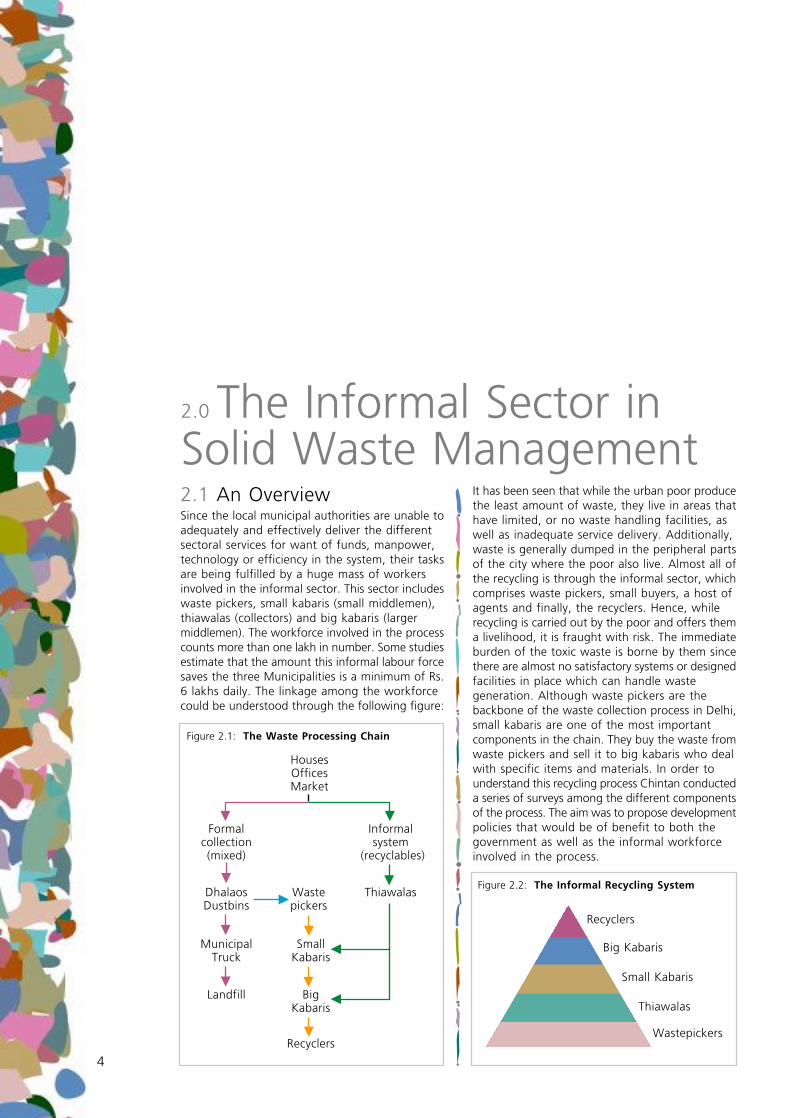
2.1 An OverviewSince the local municipal authorities are unable toadequately and effectively deliver the differentsectoral services for want of funds, manpower,technology or efficiency in the system, their tasksare being fulfilled by a huge mass of workersinvolved in the informal sector. This sector includeswaste pickers, small kabaris (small middlemen),thiawalas (collectors) and big kabaris (largermiddlemen). The workforce involved in the processcounts more than one lakh in number. Some studiesestimate that the amount this informal labour forcesaves the three Municipalities is a minimum of Rs.6 lakhs daily. The linkage among the workforcecould be understood through the following figure:
2.0 The Informal Sector inSolid Waste Management
4
HousesOfficesMarket
Formalcollection(mixed)
Informalsystem
(recyclables)
DhalaosDustbins
MunicipalTruck
Landfill
Wastepickers
Thiawalas
SmallKabaris
BigKabaris
Recyclers
Figure 2.1: The Waste Processing Chain
It has been seen that while the urban poor producethe least amount of waste, they live in areas thathave limited, or no waste handling facilities, aswell as inadequate service delivery. Additionally,waste is generally dumped in the peripheral partsof the city where the poor also live. Almost all ofthe recycling is through the informal sector, whichcomprises waste pickers, small buyers, a host ofagents and finally, the recyclers. Hence, whilerecycling is carried out by the poor and offers thema livelihood, it is fraught with risk. The immediateburden of the toxic waste is borne by them sincethere are almost no satisfactory systems or designedfacilities in place which can handle wastegeneration. Although waste pickers are thebackbone of the waste collection process in Delhi,small kabaris are one of the most importantcomponents in the chain. They buy the waste fromwaste pickers and sell it to big kabaris who dealwith specific items and materials. In order tounderstand this recycling process Chintan conducteda series of surveys among the different componentsof the process. The aim was to propose developmentpolicies that would be of benefit to both thegovernment as well as the informal workforceinvolved in the process.
Figure 2.2: The Informal Recycling System
Recyclers
Big Kabaris
Small Kabaris
Thiawalas
Wastepickers
The informal sector of recycling works like a pyramid[Figure 2.2]. The first layer comprises several hundredthousand men, women and children in urban pocketswho mine garbage heaps and bins for recyclablewastes like plastics, paper and metals. At the secondlayer come the small middlemen, often poorthemselves, who buy waste from the rag pickers. Theyin turn sell the waste to the third layer, comprisinglarge buyers who own huge godowns. Finally, at thetop, devouring all the labor and materials from beloware the actual recyclers themselves. Most of the cityinteracts with the first and the second layer, whoselabor actually propels recycling in India. These arealso the repositories of knowledge and informationabout waste at the local level, and have no inhibitions– caste-based or otherwise – about handling waste.It is precisely for these reasons that Chintan decidedto conduct the study with their participation andinvolvement.
2.2 Waste Generationand CollectionBefore detailing the results of the study, it would beuseful to compute how much waste is generated inDelhi and how much of it would be collected by wastepickers. According to the Central Pollution ControlBoard (ISS, 2000), in 1995 the solid waste generatedby the city of Delhi was 4,600 tonnes per day (tpd)and this had climbed to 5,500 tpd by 1997. This wascomputed at the rate of 0.45 kilograms of wastegenerated per capita per day (kcd). At the same rate,the waste generated in 2001 would be 6,200 tpd.However, there are reasons to believe that the wastegenerated may be much higher than this. The DelhiMaster Plan (DDA, 1990) provides a figure of 0.67kcd for the NDMC area and 0.60 kcd for the MCDarea, as a standard against which to provide dhalaos.By this reckoning, the total waste generated in Delhiin 2001 should be around 8,300 tpd.
The standard of 0.60 kcd appears to be a morereasonable figure based on data available fromindependent sources. For instance, household wasteis collected from several colonies in Delhi and theaverage waste per household per day works out to1.6 kg (ISS, 2000). Given that most of this isbiodegradable kitchen waste that is used forcomposting, it would be reasonable to assume thatthe total waste per household is about 3.2 kg, andfor an average family size of 5, the per capita wastegeneration would be about 0.61 kcd.
Spac
e fo
r W
aste
- P
lann
ing
for
the
Info
rmal
Rec
yclin
g Se
ctor
TH
E IN
FORM
AL
SEC
TOR
IN S
OLI
D W
AST
E M
AN
AG
EMEN
T
5
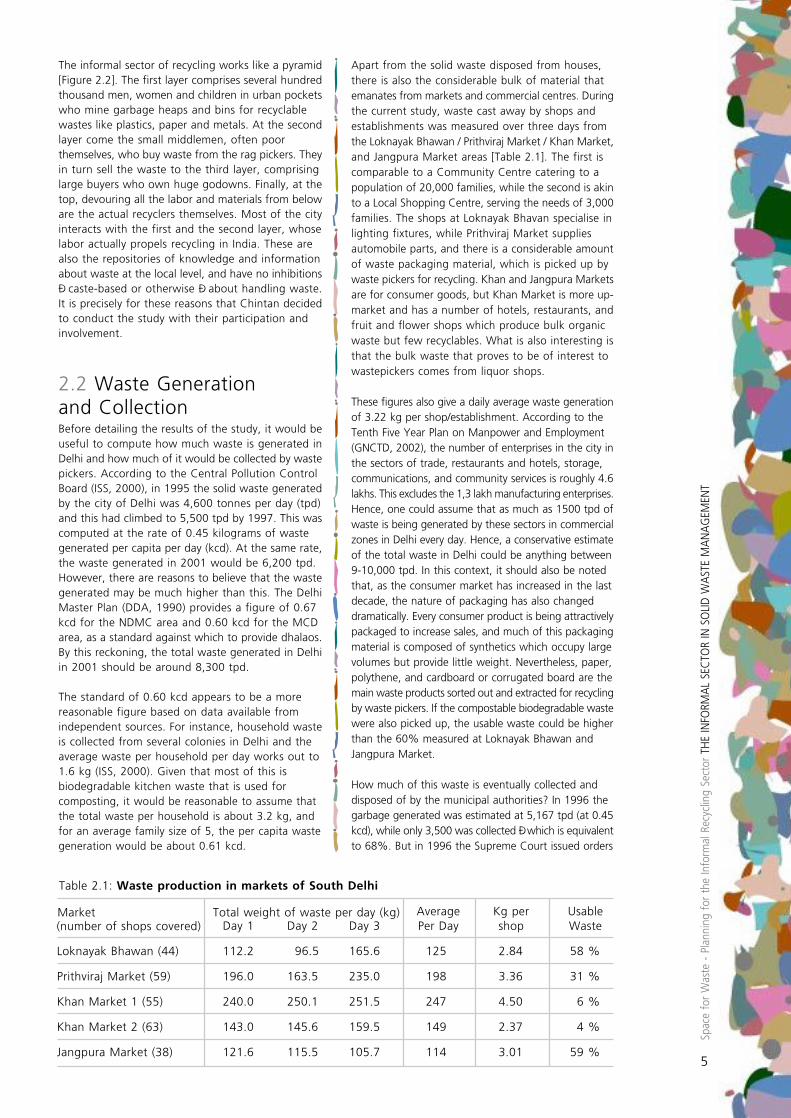
Table 2.1: Waste production in markets of South Delhi
Day 1 Day 2 Day 3
Loknayak Bhawan (44) 112.2 96.5 165.6 125 2.84 58 %
Prithviraj Market (59) 196.0 163.5 235.0 198 3.36 31 %
Khan Market 1 (55) 240.0 250.1 251.5 247 4.50 6 %
Khan Market 2 (63) 143.0 145.6 159.5 149 2.37 4 %
Jangpura Market (38) 121.6 115.5 105.7 114 3.01 59 %
Market Total weight of waste per day (kg)
AveragePer Day
Kg pershop
UsableWaste(number of shops covered)
Apart from the solid waste disposed from houses,there is also the considerable bulk of material thatemanates from markets and commercial centres. Duringthe current study, waste cast away by shops andestablishments was measured over three days fromthe Loknayak Bhawan / Prithviraj Market / Khan Market,and Jangpura Market areas [Table 2.1]. The first iscomparable to a Community Centre catering to apopulation of 20,000 families, while the second is akinto a Local Shopping Centre, serving the needs of 3,000families. The shops at Loknayak Bhavan specialise inlighting fixtures, while Prithviraj Market suppliesautomobile parts, and there is a considerable amountof waste packaging material, which is picked up bywaste pickers for recycling. Khan and Jangpura Marketsare for consumer goods, but Khan Market is more up-market and has a number of hotels, restaurants, andfruit and flower shops which produce bulk organicwaste but few recyclables. What is also interesting isthat the bulk waste that proves to be of interest towastepickers comes from liquor shops.
These figures also give a daily average waste generationof 3.22 kg per shop/establishment. According to theTenth Five Year Plan on Manpower and Employment(GNCTD, 2002), the number of enterprises in the city inthe sectors of trade, restaurants and hotels, storage,communications, and community services is roughly 4.6lakhs. This excludes the 1,3 lakh manufacturing enterprises.Hence, one could assume that as much as 1500 tpd ofwaste is being generated by these sectors in commercialzones in Delhi every day. Hence, a conservative estimateof the total waste in Delhi could be anything between9-10,000 tpd. In this context, it should also be notedthat, as the consumer market has increased in the lastdecade, the nature of packaging has also changeddramatically. Every consumer product is being attractivelypackaged to increase sales, and much of this packagingmaterial is composed of synthetics which occupy largevolumes but provide little weight. Nevertheless, paper,polythene, and cardboard or corrugated board are themain waste products sorted out and extracted for recyclingby waste pickers. If the compostable biodegradable wastewere also picked up, the usable waste could be higherthan the 60% measured at Loknayak Bhawan andJangpura Market.
How much of this waste is eventually collected anddisposed of by the municipal authorities? In 1996 thegarbage generated was estimated at 5,167 tpd (at 0.45kcd), while only 3,500 was collected – which is equivalentto 68%. But in 1996 the Supreme Court issued orders
for better management of waste in urban areas andby 1998, MCD claimed that their collection had jumpedto 5,000 tpd. However, in 1999, CPCB was estimatingthat collection still remained below par at 4,000 tpd(ISS, 2000). In other words, MCD’s collection has gonebelow 50% over the years. This is borne out by theperformance of the actual collection mechanism set upby MCD. In 1996, the Sanitation wing of the MCD wasclaiming that it had put up 337 dhalaos and 1428dustbins. But, in the same year, NEERI came up withan estimate of 412 dhalaos and 1184 dustbins, alongwith 176 open sites. In either case, the total numberof collection points does not exceed 1.5 per 10,000population, which is well below the actual requirement.The Master Plan suggests that there should be 4 dhalaosat the Neighbourhood level, which has a population of1,000 families or 5,000 persons.
Spac
e fo
r W
aste
- P
lann
ing
for
the
Info
rmal
Rec
yclin
g Se
ctor
TH
E IN
FORM
AL
SEC
TOR
IN S
OLI
D W
AST
E M
AN
AG
EMEN
T
6
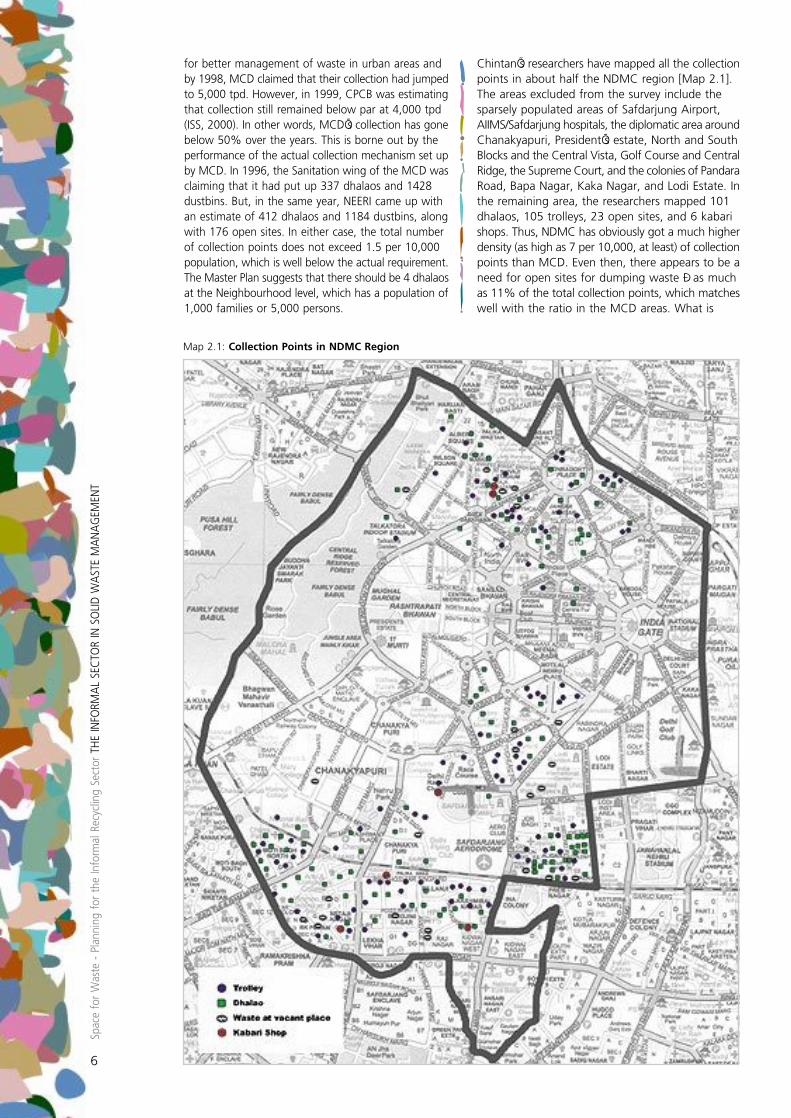
Map 2.1: Collection Points in NDMC Region
Chintan’s researchers have mapped all the collectionpoints in about half the NDMC region [Map 2.1].The areas excluded from the survey include thesparsely populated areas of Safdarjung Airport,AIIMS/Safdarjung hospitals, the diplomatic area aroundChanakyapuri, President’s estate, North and SouthBlocks and the Central Vista, Golf Course and CentralRidge, the Supreme Court, and the colonies of PandaraRoad, Bapa Nagar, Kaka Nagar, and Lodi Estate. Inthe remaining area, the researchers mapped 101dhalaos, 105 trolleys, 23 open sites, and 6 kabarishops. Thus, NDMC has obviously got a much higherdensity (as high as 7 per 10,000, at least) of collectionpoints than MCD. Even then, there appears to be aneed for open sites for dumping waste – as muchas 11% of the total collection points, which matcheswell with the ratio in the MCD areas. What is
Spac
e fo
r W
aste
- P
lann
ing
for
the
Info
rmal
Rec
yclin
g Se
ctor
TH
E IN
FORM
AL
SEC
TOR
IN S
OLI
D W
AST
E M
AN
AG
EMEN
T
7
important to note is that the NDMC is a high-profilehigh-security area in which ‘unauthorised’ activitiesare strictly prohibited, and yet the imperatives ofgarbage disposal are such that open sites exist, asdo the 6 kabaris who provide an outlet for recyclingthe waste.
It is from these collection points that the waste pickersextract the recyclable waste and supply it to themiddlemen. If the data given above are any indication,then the volume of trade must be staggering. If MCDis realistically collecting and transporting only 4-4,500tpd, then the informal sector may be lifting muchof the remaining 4,500-6,000 tpd. This also calls intoquestion the assumption of most SWM specialiststhat only 13-20% of this waste is recyclable.
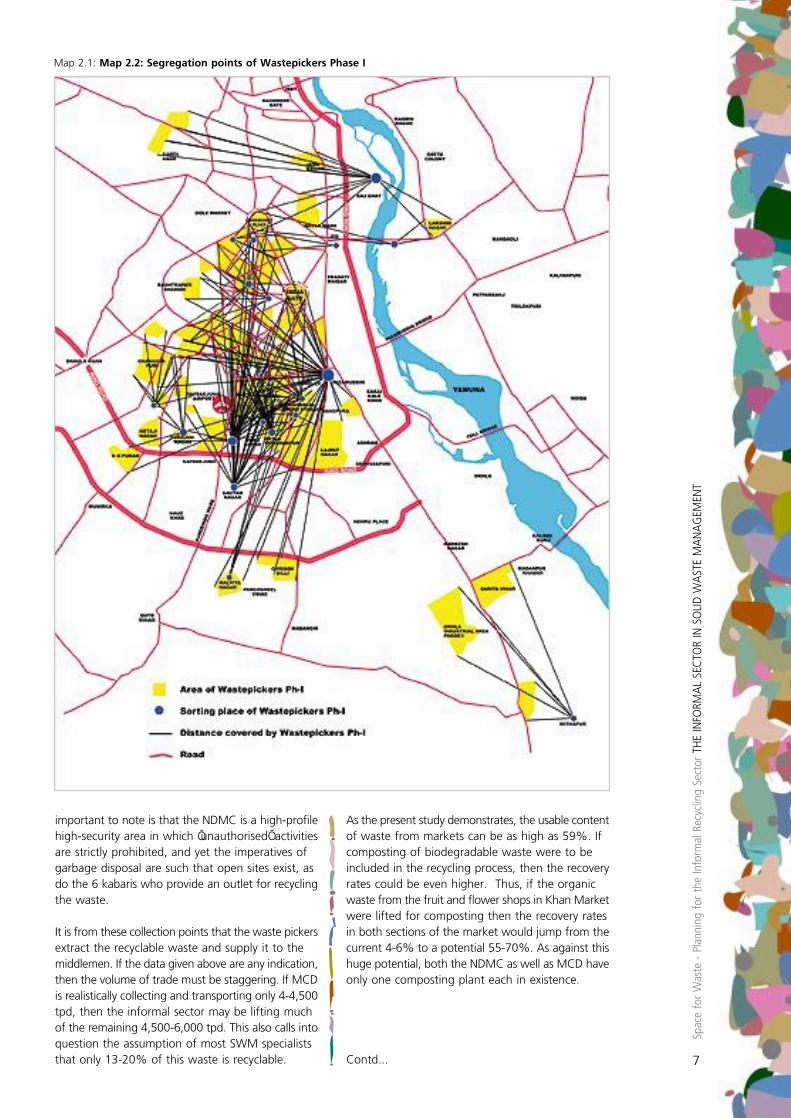
Map 2.1: Map 2.2: Segregation points of Wastepickers Phase I
As the present study demonstrates, the usable contentof waste from markets can be as high as 59%. Ifcomposting of biodegradable waste were to beincluded in the recycling process, then the recoveryrates could be even higher. Thus, if the organicwaste from the fruit and flower shops in Khan Marketwere lifted for composting then the recovery ratesin both sections of the market would jump from thecurrent 4-6% to a potential 55-70%. As against thishuge potential, both the NDMC as well as MCD haveonly one composting plant each in existence.
Contd...
2.3 Waste Collection bySelf-employed Waste PickersThe waste picker is the lowest member of the recyclingchain, who actually forages in the markets and atthe collection points or open sites for the materialwhich has value in recycling. S/he is typically a youngperson (though not a child) with a large woven HDPEsack flung on her/his shoulder. A waste picker normallybegins her/his work as early as 4 am in the morningotherwise s/he’ll miss the waste. After the collectionof material, before s/he sells the material to kabari,it should be sorted out according to different typesof waste. The transaction at the selling point iscomplex: one could get paid less if the waste is sub-standard and wet, and the rates vary depending uponmarket fluctuations. The waste pickers mostly liveeither in the slums (usually near the shop of a kabari),
Spac
e fo
r W
aste
- P
lann
ing
for
the
Info
rmal
Rec
yclin
g Se
ctor
TH
E IN
FORM
AL
SEC
TOR
IN S
OLI
D W
AST
E M
AN
AG
EMEN
T
8
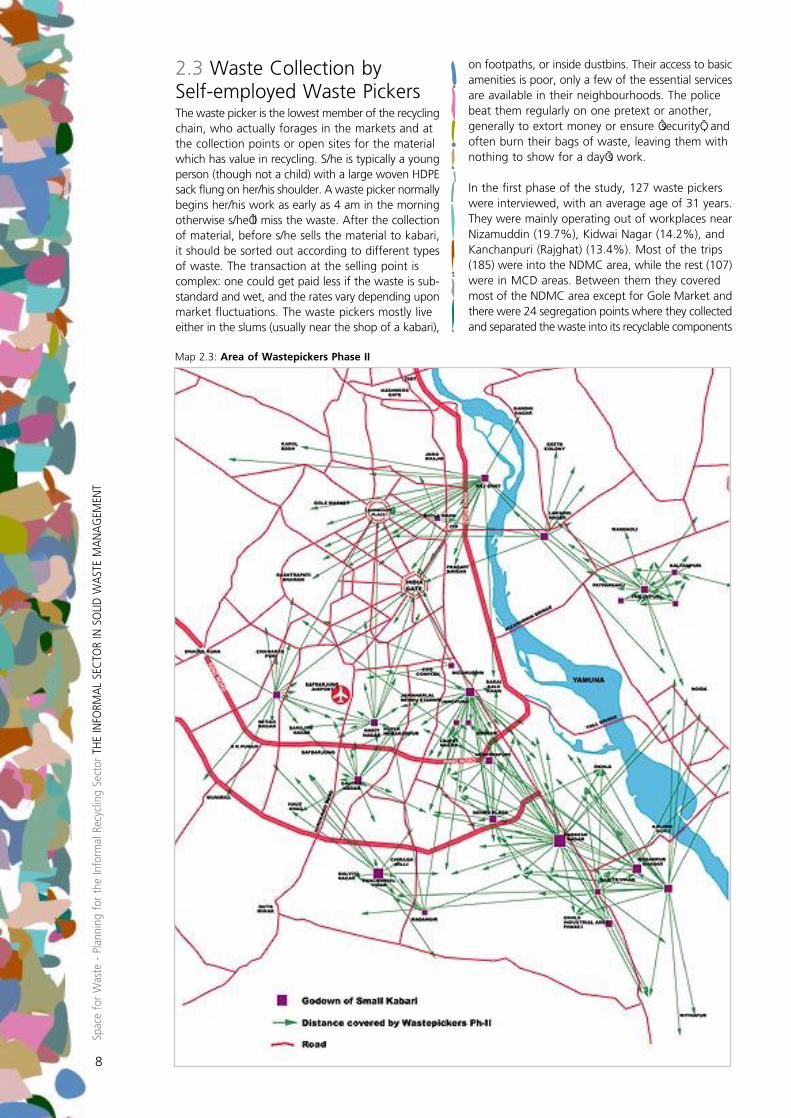
Map 2.3: Area of Wastepickers Phase II
on footpaths, or inside dustbins. Their access to basicamenities is poor, only a few of the essential servicesare available in their neighbourhoods. The policebeat them regularly on one pretext or another,generally to extort money or ensure ‘security’, andoften burn their bags of waste, leaving them withnothing to show for a day’s work.
In the first phase of the study, 127 waste pickerswere interviewed, with an average age of 31 years.They were mainly operating out of workplaces nearNizamuddin (19.7%), Kidwai Nagar (14.2%), andKanchanpuri (Rajghat) (13.4%). Most of the trips(185) were into the NDMC area, while the rest (107)were in MCD areas. Between them they coveredmost of the NDMC area except for Gole Market andthere were 24 segregation points where they collectedand separated the waste into its recyclable components
Spac
e fo
r W
aste
- P
lann
ing
for
the
Info
rmal
Rec
yclin
g Se
ctor
TH
E IN
FORM
AL
SEC
TOR
IN S
OLI
D W
AST
E M
AN
AG
EMEN
T
9
[Map 2.2]. These segregation points were roughly1.5 km apart. An idea of the high degree of‘protection’ offered by security personnel to theNDMC area emerges from the fact that only 8 ofthese segregation points were able to operate in thisarea, the rest were outside NDMC. Interestinglyenough, 54.4% said they were segregating theirwaste in or in front of the kabari’s godown, while33.1% conducted this activity on the footpath. Butcloseness to the eventual buyer is obviously criticalfor the trade itself.
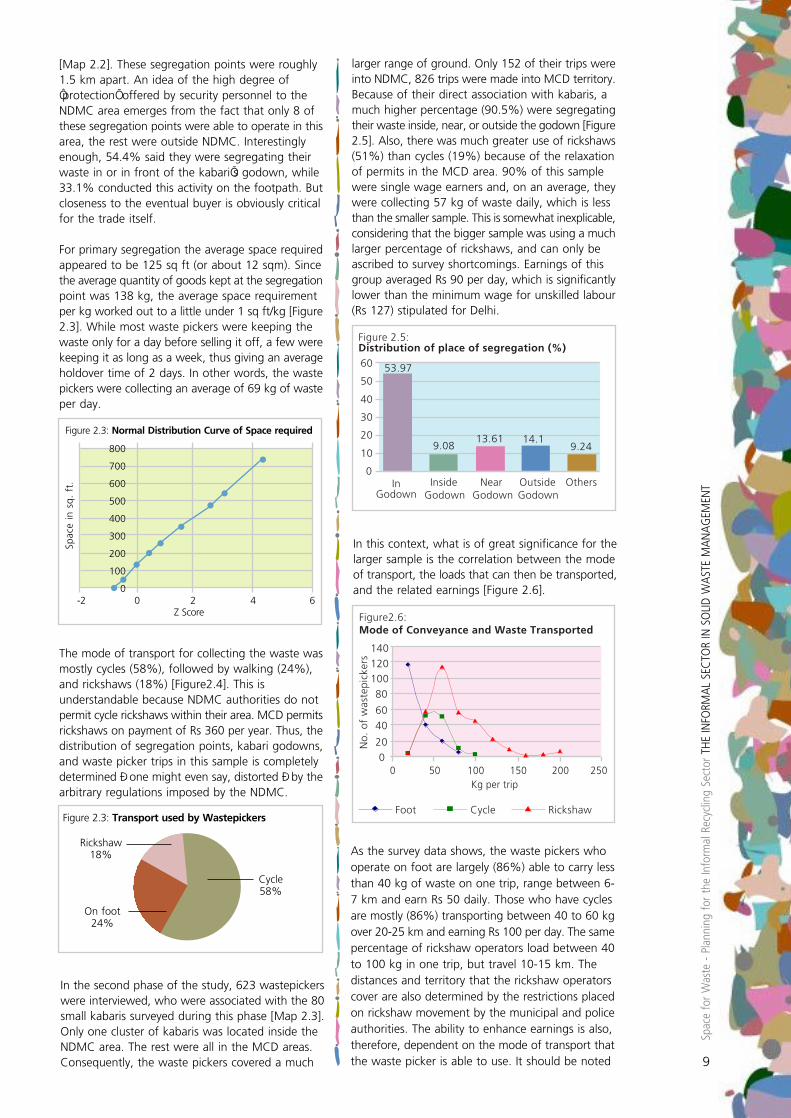
For primary segregation the average space requiredappeared to be 125 sq ft (or about 12 sqm). Sincethe average quantity of goods kept at the segregationpoint was 138 kg, the average space requirementper kg worked out to a little under 1 sq ft/kg [Figure2.3]. While most waste pickers were keeping thewaste only for a day before selling it off, a few werekeeping it as long as a week, thus giving an averageholdover time of 2 days. In other words, the wastepickers were collecting an average of 69 kg of wasteper day.
The mode of transport for collecting the waste wasmostly cycles (58%), followed by walking (24%),and rickshaws (18%) [Figure2.4]. This isunderstandable because NDMC authorities do notpermit cycle rickshaws within their area. MCD permitsrickshaws on payment of Rs 360 per year. Thus, thedistribution of segregation points, kabari godowns,and waste picker trips in this sample is completelydetermined – one might even say, distorted – by thearbitrary regulations imposed by the NDMC.
Figure 2.3: Transport used by Wastepickers
Rickshaw18%
On foot24%
Cycle58%
In the second phase of the study, 623 wastepickerswere interviewed, who were associated with the 80small kabaris surveyed during this phase [Map 2.3].Only one cluster of kabaris was located inside theNDMC area. The rest were all in the MCD areas.Consequently, the waste pickers covered a much
larger range of ground. Only 152 of their trips wereinto NDMC, 826 trips were made into MCD territory.Because of their direct association with kabaris, amuch higher percentage (90.5%) were segregatingtheir waste inside, near, or outside the godown [Figure2.5]. Also, there was much greater use of rickshaws(51%) than cycles (19%) because of the relaxationof permits in the MCD area. 90% of this samplewere single wage earners and, on an average, theywere collecting 57 kg of waste daily, which is lessthan the smaller sample. This is somewhat inexplicable,considering that the bigger sample was using a muchlarger percentage of rickshaws, and can only beascribed to survey shortcomings. Earnings of thisgroup averaged Rs 90 per day, which is significantlylower than the minimum wage for unskilled labour(Rs 127) stipulated for Delhi.
In this context, what is of great significance for thelarger sample is the correlation between the modeof transport, the loads that can then be transported,and the related earnings [Figure 2.6].
Figure2.6:Mode of Conveyance and Waste Transported
No
. o
f w
aste
pic
kers
0
20
40
60
80
100
120
140
0 50 100 150 200 250Kg per trip
RickshawCycleFoot
Figure 2.5:Distribution of place of segregation (%)
9.0813.61 14.1
9.24
53.97
0
10
20
30
40
50
60
InGodown
InsideGodown
NearGodown
OutsideGodown
Others
Figure 2.3: Normal Distribution Curve of Space required
Spac
e in
sq
. ft
.
-2Z Score
0 2 4 6
800
700
600
500
400
300
200
100
0
As the survey data shows, the waste pickers whooperate on foot are largely (86%) able to carry lessthan 40 kg of waste on one trip, range between 6-7 km and earn Rs 50 daily. Those who have cyclesare mostly (86%) transporting between 40 to 60 kgover 20-25 km and earning Rs 100 per day. The samepercentage of rickshaw operators load between 40to 100 kg in one trip, but travel 10-15 km. Thedistances and territory that the rickshaw operatorscover are also determined by the restrictions placedon rickshaw movement by the municipal and policeauthorities. The ability to enhance earnings is also,therefore, dependent on the mode of transport thatthe waste picker is able to use. It should be noted
that while the rickshaw could belong to the kabari,the cycle often has to be purchased by the wastepicker herself/himself. Hence, the waste picker musthave the capital saved to indulge in this purchasewhich, in turn, is dependent on the extent of her/hisearnings. Quite clearly, this is related to the extentto which the waste picker is able to get formalrecognition and space for his vehicle in the designof civic life.
For understanding the nature of this formalrecognition, we can now also make some intelligentestimates about the number of waste pickers requiredfor servicing the entire city. The first assumption,based on the data provided by this study, is that theaverage waste picked up daily by the waste pickeris 60 kg, which goes down to 40 kg if s/he is confinedto walking, and goes up to 100 kg if rickshaws arepermitted. The second assumption is that the wastepicker is currently picking up as much as 40% of thewaste at the collection points and markets, and thatthis could go up to 70% if there were arrangementsfor segregating and processing the biodegradablesinto compost. And the third assumption is that theMCD is not picking up between 4,500-6,000 tonnesper day of urban waste. Thus, it can be estimatedthat currently the city needs 30-40,000 waste pickersjust to collect the usable waste and transport it tothe small kabari. This figure does not include, as weshall see later, the other participants in the informalsector such as the employees of the kabari and thethiawalas. Each waste picker will also require 60 sqft of space for segregating the waste and this issomething that can be easily built into the design ofthe collection point or dhalao.
2.4 Collection and segregationby Employed LabourersApart from the self-employed waste pickers who finda livelihood in the waste management trade, thereis another section of labourers who are employedby the middlemen kabaris. While the survey of smallkabaris (see next section) disclosed that the kabaristhemselves claim to employ an average of 3 labourerseach, the labourers themselves have a differentperspective. 588 employees associated with 80 kabariswere surveyed. On an average each kabari was thusfound to have 7 employees, although some had asmany as 20. The task distribution between themappeared to be 40% as waste pickers, 32% on pheriand 25% for segregation, loading and unloading,and roughly 3% were engaged in supervisory tasks[Table 2.2]. It is possible that only some of thesewere regarded as ‘employees’ by the kabaris – whichwould explain the difference in perception betweenthe kabaris and their associated workers. This is alsosupported by the observation that 77% of the workersmaintained that they had no filial or personalrelationship with the owner.
Spac
e fo
r W
aste
- P
lann
ing
for
the
Info
rmal
Rec
yclin
g Se
ctor
TH
E IN
FORM
AL
SEC
TOR
IN S
OLI
D W
AST
E M
AN
AG
EMEN
T
10
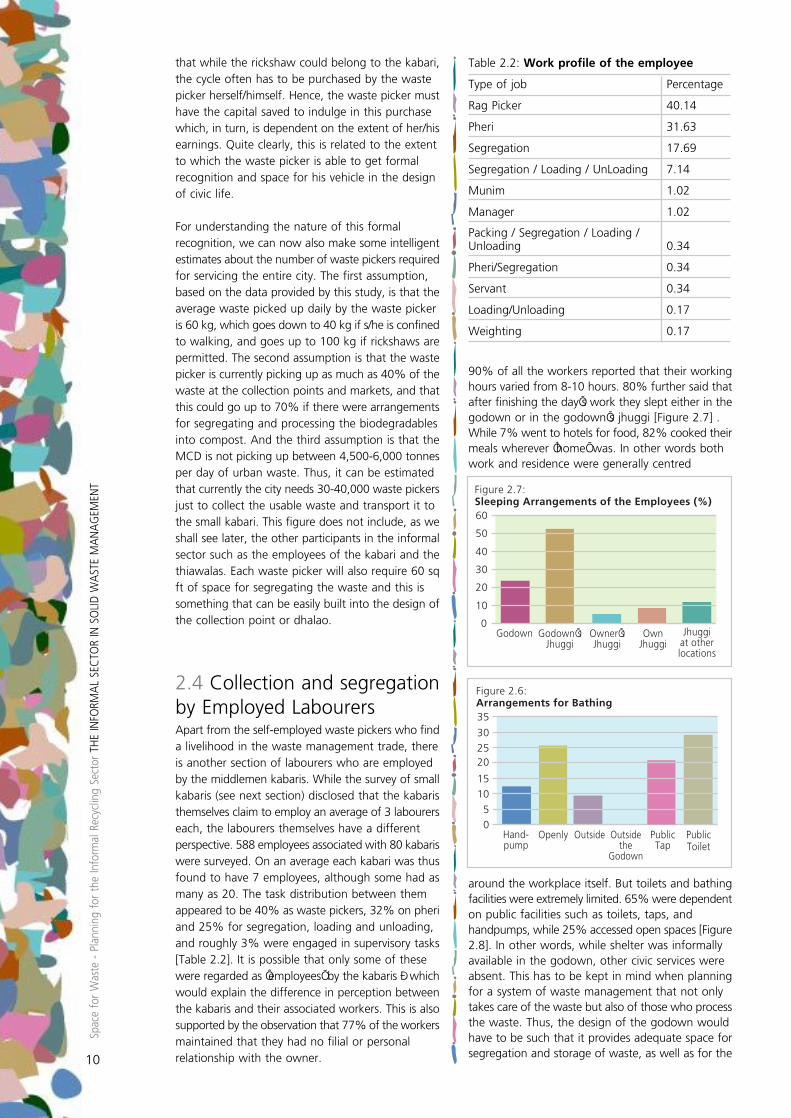
90% of all the workers reported that their workinghours varied from 8-10 hours. 80% further said thatafter finishing the day’s work they slept either in thegodown or in the godown’s jhuggi [Figure 2.7] .While 7% went to hotels for food, 82% cooked theirmeals wherever ‘home’ was. In other words bothwork and residence were generally centred
Table 2.2: Work profile of the employee
Type of job Percentage
Rag Picker 40.14
Pheri 31.63
Segregation 17.69
Segregation / Loading / UnLoading 7.14
Munim 1.02
Manager 1.02
Packing / Segregation / Loading /Unloading 0.34
Pheri/Segregation 0.34
Servant 0.34
Loading/Unloading 0.17
Weighting 0.17
Figure 2.7:Sleeping Arrangements of the Employees (%)
0
10
20
30
40
50
60
Godown Godown’sJhuggi
Jhuggiat otherlocations
Owner’sJhuggi
OwnJhuggi
Figure 2.6:Arrangements for Bathing
0
5
10
15
2025
30
Hand-pump
Openly Outside Outsidethe
Godown
35
PublicTap
PublicToilet
around the workplace itself. But toilets and bathingfacilities were extremely limited. 65% were dependenton public facilities such as toilets, taps, andhandpumps, while 25% accessed open spaces [Figure2.8]. In other words, while shelter was informallyavailable in the godown, other civic services wereabsent. This has to be kept in mind when planningfor a system of waste management that not onlytakes care of the waste but also of those who processthe waste. Thus, the design of the godown wouldhave to be such that it provides adequate space forsegregation and storage of waste, as well as for the
Spac
e fo
r W
aste
- P
lann
ing
for
the
Info
rmal
Rec
yclin
g Se
ctor
TH
E IN
FORM
AL
SEC
TOR
IN S
OLI
D W
AST
E M
AN
AG
EMEN
T
11
living requirements of the associated workers (seenext section).
If we assume that the 72% employees of the smallkabaris, who are waste pickers and on pheri, areincluded in the total estimate of 30-40,000 wastepickers in the city, then that would mean that theother 28% can be assumed to be engaged insegregation and supervisory tasks. This gives anotherestimate of a further 12-16,000 workers in the trade.Thus, the total number of men, women, and childrenearning a livelihood from waste collection, segregation,and recycling in the informal sector could be as highas 42,000 to 56,000. In the absence of a formalcensus this is a reasonable estimate, particularly sinceit matches with other qualitative assessments madeby those who have been involved with the trade formany years. If we take even the figure for the minimumwage stipulated for unskilled workers in Delhi, itmeans that this work force is saving MCD an annualwage bill of at least Rs 20 to 26 crores, or 14-19%of its annual budget. This, once again, underlinesthe need for the city to look anew at the entireinformal sector of waste management and deviseways of recognising, appreciating, and strengtheningits contribution to civic life.
2.5 Small KabarisA small kabari is a person who looks after storage,segregation, and circulation of the waste. This section,though much smaller than the number of wastepickers, plays an important role not only inemployment generation but also in terms of recyclingof resources and promoting waste disposal. However,as in the case of the waste pickers, the functioningof the kabaris appears to be greatly distorted by therules and regulations that govern the city. A morescientific and organised effort is required to makethis section economically viable and, thus, promoterational solid waste management.
Table 2.3: Prior work experience
Type of Work Percentage
Pheri 54
Work with kabari 15
At Redlight 3
Paper collection, pheri 3
Ragpicker 3
Rickshaw 3
Rickshaw, Pheri 3
Service 3
No data 15
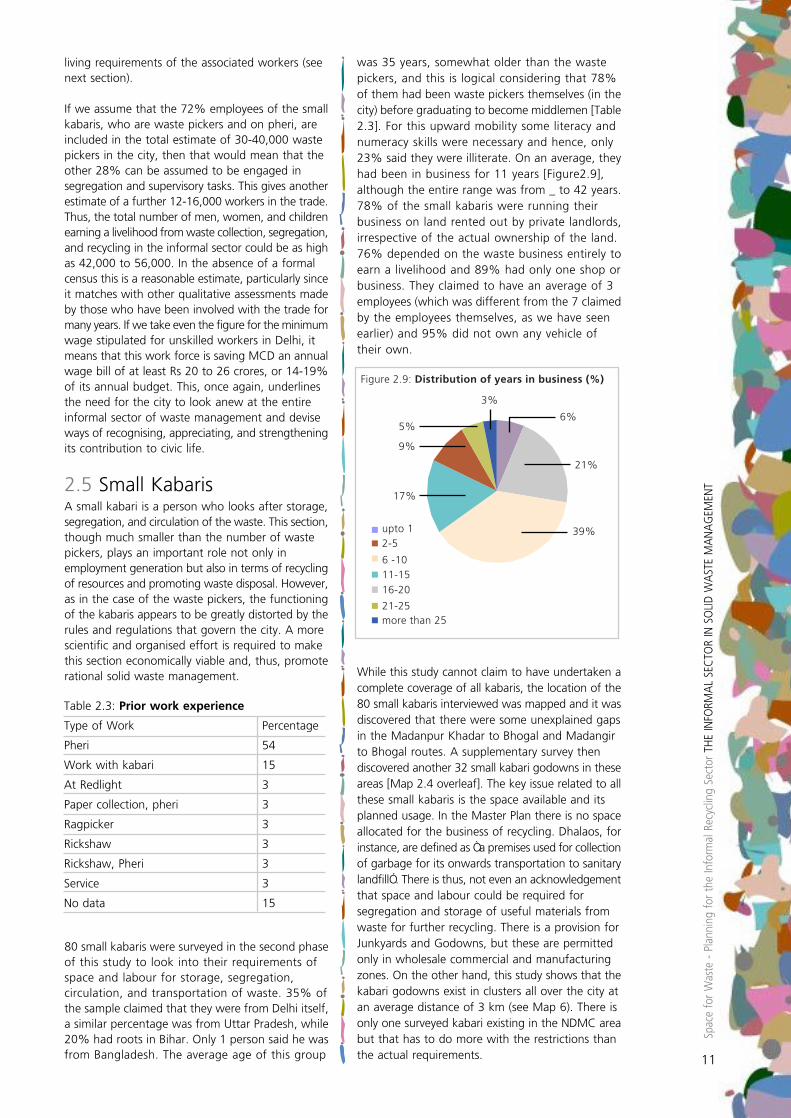
80 small kabaris were surveyed in the second phaseof this study to look into their requirements ofspace and labour for storage, segregation,circulation, and transportation of waste. 35% ofthe sample claimed that they were from Delhi itself,a similar percentage was from Uttar Pradesh, while20% had roots in Bihar. Only 1 person said he wasfrom Bangladesh. The average age of this group
was 35 years, somewhat older than the wastepickers, and this is logical considering that 78%of them had been waste pickers themselves (in thecity) before graduating to become middlemen [Table2.3]. For this upward mobility some literacy andnumeracy skills were necessary and hence, only23% said they were illiterate. On an average, theyhad been in business for 11 years [Figure2.9],although the entire range was from _ to 42 years.78% of the small kabaris were running theirbusiness on land rented out by private landlords,irrespective of the actual ownership of the land.76% depended on the waste business entirely toearn a livelihood and 89% had only one shop orbusiness. They claimed to have an average of 3employees (which was different from the 7 claimedby the employees themselves, as we have seenearlier) and 95% did not own any vehicle oftheir own.
While this study cannot claim to have undertaken acomplete coverage of all kabaris, the location of the80 small kabaris interviewed was mapped and it wasdiscovered that there were some unexplained gapsin the Madanpur Khadar to Bhogal and Madangirto Bhogal routes. A supplementary survey thendiscovered another 32 small kabari godowns in theseareas [Map 2.4 overleaf]. The key issue related to allthese small kabaris is the space available and itsplanned usage. In the Master Plan there is no spaceallocated for the business of recycling. Dhalaos, forinstance, are defined as “a premises used for collectionof garbage for its onwards transportation to sanitarylandfill”. There is thus, not even an acknowledgementthat space and labour could be required forsegregation and storage of useful materials fromwaste for further recycling. There is a provision forJunkyards and Godowns, but these are permittedonly in wholesale commercial and manufacturingzones. On the other hand, this study shows that thekabari godowns exist in clusters all over the city atan average distance of 3 km (see Map 6). There isonly one surveyed kabari existing in the NDMC areabut that has to do more with the restrictions thanthe actual requirements.
Figure 2.9: Distribution of years in business (%)
upto 12-5
6 -1011-15
16-20
21-25more than 25
6%
21%
17%
9%
5%
3%
39%
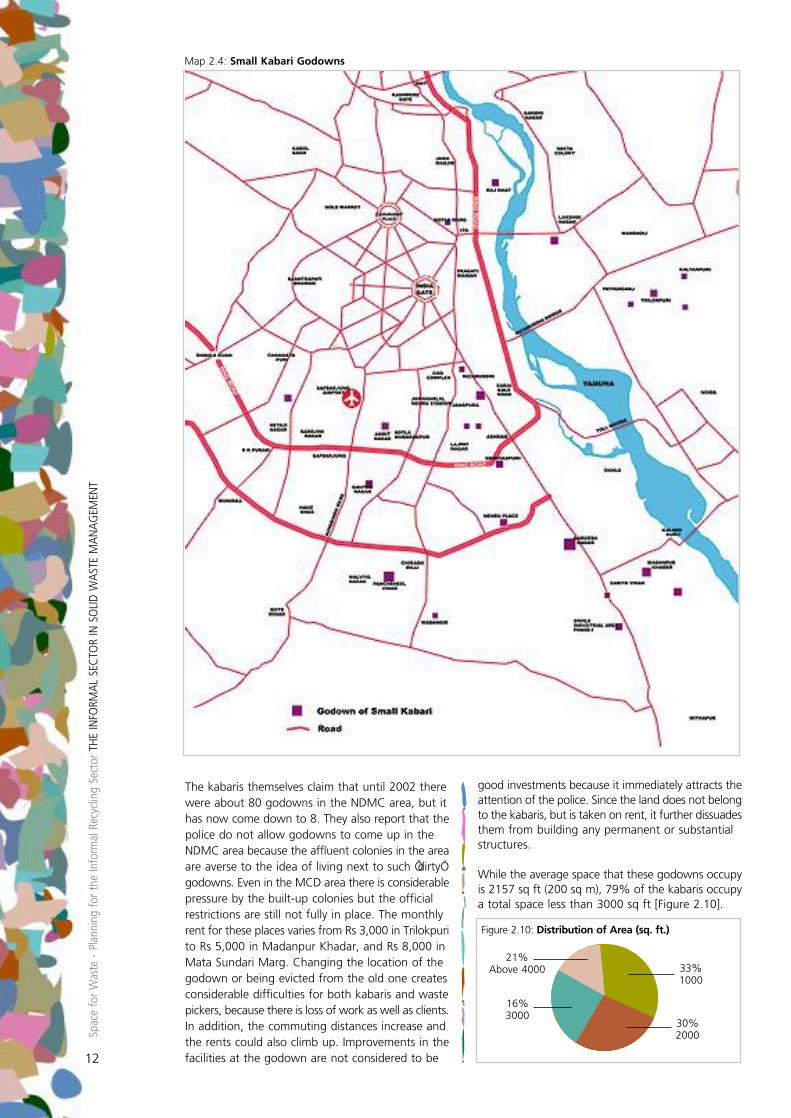
The kabaris themselves claim that until 2002 therewere about 80 godowns in the NDMC area, but ithas now come down to 8. They also report that thepolice do not allow godowns to come up in theNDMC area because the affluent colonies in the areaare averse to the idea of living next to such ‘dirty’godowns. Even in the MCD area there is considerablepressure by the built-up colonies but the officialrestrictions are still not fully in place. The monthlyrent for these places varies from Rs 3,000 in Trilokpurito Rs 5,000 in Madanpur Khadar, and Rs 8,000 inMata Sundari Marg. Changing the location of thegodown or being evicted from the old one createsconsiderable difficulties for both kabaris and wastepickers, because there is loss of work as well as clients.In addition, the commuting distances increase andthe rents could also climb up. Improvements in thefacilities at the godown are not considered to be
Spac
e fo
r W
aste
- P
lann
ing
for
the
Info
rmal
Rec
yclin
g Se
ctor
TH
E IN
FORM
AL
SEC
TOR
IN S
OLI
D W
AST
E M
AN
AG
EMEN
T
12
Map 2.4: Small Kabari Godowns
good investments because it immediately attracts theattention of the police. Since the land does not belongto the kabaris, but is taken on rent, it further dissuadesthem from building any permanent or substantialstructures.
While the average space that these godowns occupyis 2157 sq ft (200 sq m), 79% of the kabaris occupya total space less than 3000 sq ft [Figure 2.10].
Figure 2.10: Distribution of Area (sq. ft.)
21%Above 4000
16%3000
33%1000
30%2000
Spac
e fo
r W
aste
- P
lann
ing
for
the
Info
rmal
Rec
yclin
g Se
ctor
TH
E IN
FORM
AL
SEC
TOR
IN S
OLI
D W
AST
E M
AN
AG
EMEN
T
13
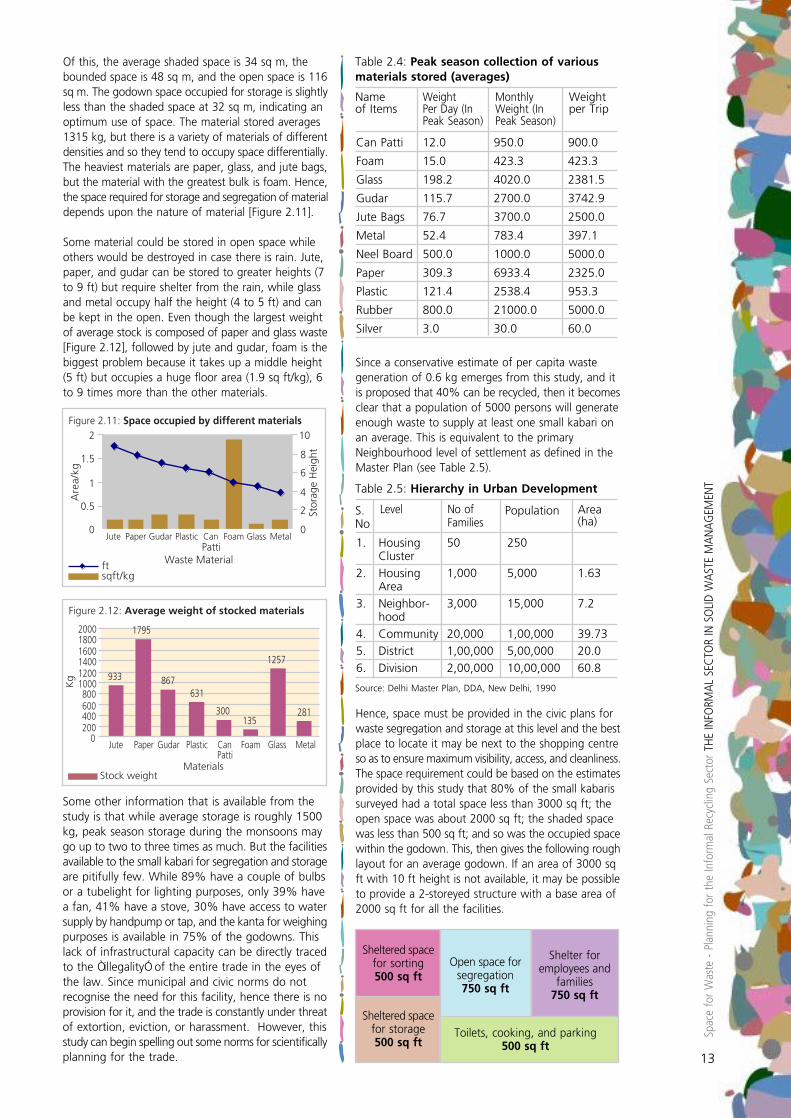
Of this, the average shaded space is 34 sq m, thebounded space is 48 sq m, and the open space is 116sq m. The godown space occupied for storage is slightlyless than the shaded space at 32 sq m, indicating anoptimum use of space. The material stored averages1315 kg, but there is a variety of materials of differentdensities and so they tend to occupy space differentially.The heaviest materials are paper, glass, and jute bags,but the material with the greatest bulk is foam. Hence,the space required for storage and segregation of materialdepends upon the nature of material [Figure 2.11].
Some material could be stored in open space whileothers would be destroyed in case there is rain. Jute,paper, and gudar can be stored to greater heights (7to 9 ft) but require shelter from the rain, while glassand metal occupy half the height (4 to 5 ft) and canbe kept in the open. Even though the largest weightof average stock is composed of paper and glass waste[Figure 2.12], followed by jute and gudar, foam is thebiggest problem because it takes up a middle height(5 ft) but occupies a huge floor area (1.9 sq ft/kg), 6to 9 times more than the other materials.
Some other information that is available from thestudy is that while average storage is roughly 1500kg, peak season storage during the monsoons maygo up to two to three times as much. But the facilitiesavailable to the small kabari for segregation and storageare pitifully few. While 89% have a couple of bulbsor a tubelight for lighting purposes, only 39% havea fan, 41% have a stove, 30% have access to watersupply by handpump or tap, and the kanta for weighingpurposes is available in 75% of the godowns. Thislack of infrastructural capacity can be directly tracedto the “illegality” of the entire trade in the eyes ofthe law. Since municipal and civic norms do notrecognise the need for this facility, hence there is noprovision for it, and the trade is constantly under threatof extortion, eviction, or harassment. However, thisstudy can begin spelling out some norms for scientificallyplanning for the trade.
Figure 2.11: Space occupied by different materials
0
0.5
1
1.5
2
Jute Paper Gudar Plastic CanPatti
Foam Glass Metal
Waste Material
0
2
4
6
8
10
sqft/kg
Are
a/kg
Stor
age
Hei
ght
ft
Figure 2.12: Average weight of stocked materials
933
1795
867631
300135
1257
281
0200400600800
100012001400160018002000
Jute Paper Gudar Plastic CanPatti
Foam Glass Metal
MaterialsStock weight
Kg
Since a conservative estimate of per capita wastegeneration of 0.6 kg emerges from this study, and itis proposed that 40% can be recycled, then it becomesclear that a population of 5000 persons will generateenough waste to supply at least one small kabari onan average. This is equivalent to the primaryNeighbourhood level of settlement as defined in theMaster Plan (see Table 2.5).
Can Patti 12.0 950.0 900.0
Foam 15.0 423.3 423.3
Glass 198.2 4020.0 2381.5
Gudar 115.7 2700.0 3742.9
Jute Bags 76.7 3700.0 2500.0
Metal 52.4 783.4 397.1
Neel Board 500.0 1000.0 5000.0
Paper 309.3 6933.4 2325.0
Plastic 121.4 2538.4 953.3
Rubber 800.0 21000.0 5000.0
Silver 3.0 30.0 60.0
Table 2.4: Peak season collection of variousmaterials stored (averages)
Nameof Items
WeightPer Day (InPeak Season)
MonthlyWeight (InPeak Season)
Weightper Trip
1. Housing 50 250Cluster
2. Housing 1,000 5,000 1.63Area
3. Neighbor- 3,000 15,000 7.2hood
4. Community 20,000 1,00,000 39.73
5. District 1,00,000 5,00,000 20.0
6. Division 2,00,000 10,00,000 60.8
Table 2.5: Hierarchy in Urban Development
S.No
Level No ofFamilies
Population Area(ha)
Source: Delhi Master Plan, DDA, New Delhi, 1990
Hence, space must be provided in the civic plans forwaste segregation and storage at this level and the bestplace to locate it may be next to the shopping centreso as to ensure maximum visibility, access, and cleanliness.The space requirement could be based on the estimatesprovided by this study that 80% of the small kabarissurveyed had a total space less than 3000 sq ft; theopen space was about 2000 sq ft; the shaded spacewas less than 500 sq ft; and so was the occupied spacewithin the godown. This, then gives the following roughlayout for an average godown. If an area of 3000 sqft with 10 ft height is not available, it may be possibleto provide a 2-storeyed structure with a base area of2000 sq ft for all the facilities.
Sheltered spacefor sorting500 sq ft
Sheltered spacefor storage500 sq ft
Open space forsegregation750 sq ft
Shelter foremployees and
families750 sq ft
Toilets, cooking, and parking500 sq ft
Spac
e fo
r W
aste
- P
lann
ing
for
the
Info
rmal
Rec
yclin
g Se
ctor
TH
E IN
FORM
AL
SEC
TOR
IN S
OLI
D W
AST
E M
AN
AG
EMEN
T
14
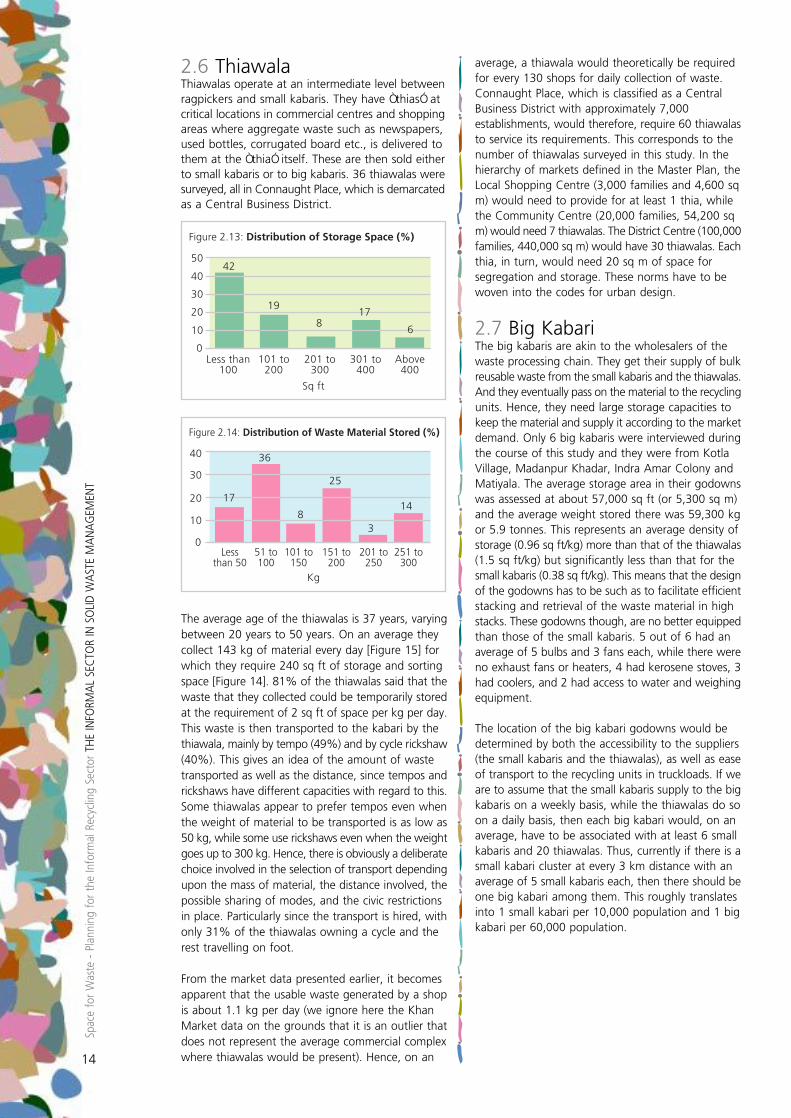
2.6 ThiawalaThiawalas operate at an intermediate level betweenragpickers and small kabaris. They have “thias” atcritical locations in commercial centres and shoppingareas where aggregate waste such as newspapers,used bottles, corrugated board etc., is delivered tothem at the “thia” itself. These are then sold eitherto small kabaris or to big kabaris. 36 thiawalas weresurveyed, all in Connaught Place, which is demarcatedas a Central Business District.
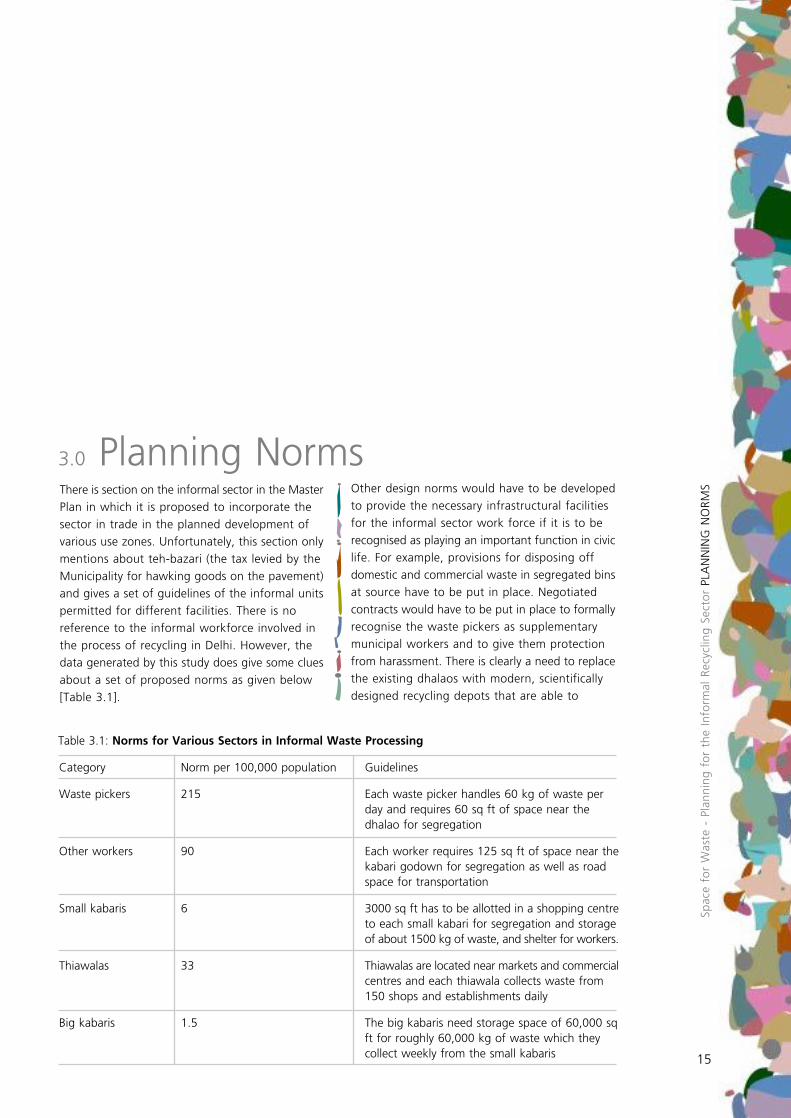
The average age of the thiawalas is 37 years, varyingbetween 20 years to 50 years. On an average theycollect 143 kg of material every day [Figure 15] forwhich they require 240 sq ft of storage and sortingspace [Figure 14]. 81% of the thiawalas said that thewaste that they collected could be temporarily storedat the requirement of 2 sq ft of space per kg per day.This waste is then transported to the kabari by thethiawala, mainly by tempo (49%) and by cycle rickshaw(40%). This gives an idea of the amount of wastetransported as well as the distance, since tempos andrickshaws have different capacities with regard to this.Some thiawalas appear to prefer tempos even whenthe weight of material to be transported is as low as50 kg, while some use rickshaws even when the weightgoes up to 300 kg. Hence, there is obviously a deliberatechoice involved in the selection of transport dependingupon the mass of material, the distance involved, thepossible sharing of modes, and the civic restrictionsin place. Particularly since the transport is hired, withonly 31% of the thiawalas owning a cycle and therest travelling on foot.
From the market data presented earlier, it becomesapparent that the usable waste generated by a shopis about 1.1 kg per day (we ignore here the KhanMarket data on the grounds that it is an outlier thatdoes not represent the average commercial complexwhere thiawalas would be present). Hence, on an
Figure 2.13: Distribution of Storage Space (%)
19
8
42
0
10
20
30
40
50
Less than100
101 to200
201 to300
301 to400
Above400
17
6
Sq ft
Figure 2.14: Distribution of Waste Material Stored (%)
36
8
0
10
20
30
40
Lessthan 50
51 to100
101 to150
151 to200
251 to300
25
14
Kg
201 to250
3
17
average, a thiawala would theoretically be requiredfor every 130 shops for daily collection of waste.Connaught Place, which is classified as a CentralBusiness District with approximately 7,000establishments, would therefore, require 60 thiawalasto service its requirements. This corresponds to thenumber of thiawalas surveyed in this study. In thehierarchy of markets defined in the Master Plan, theLocal Shopping Centre (3,000 families and 4,600 sqm) would need to provide for at least 1 thia, whilethe Community Centre (20,000 families, 54,200 sqm) would need 7 thiawalas. The District Centre (100,000families, 440,000 sq m) would have 30 thiawalas. Eachthia, in turn, would need 20 sq m of space forsegregation and storage. These norms have to bewoven into the codes for urban design.
2.7 Big KabariThe big kabaris are akin to the wholesalers of thewaste processing chain. They get their supply of bulkreusable waste from the small kabaris and the thiawalas.And they eventually pass on the material to the recyclingunits. Hence, they need large storage capacities tokeep the material and supply it according to the marketdemand. Only 6 big kabaris were interviewed duringthe course of this study and they were from KotlaVillage, Madanpur Khadar, Indra Amar Colony andMatiyala. The average storage area in their godownswas assessed at about 57,000 sq ft (or 5,300 sq m)and the average weight stored there was 59,300 kgor 5.9 tonnes. This represents an average density ofstorage (0.96 sq ft/kg) more than that of the thiawalas(1.5 sq ft/kg) but significantly less than that for thesmall kabaris (0.38 sq ft/kg). This means that the designof the godowns has to be such as to facilitate efficientstacking and retrieval of the waste material in highstacks. These godowns though, are no better equippedthan those of the small kabaris. 5 out of 6 had anaverage of 5 bulbs and 3 fans each, while there wereno exhaust fans or heaters, 4 had kerosene stoves, 3had coolers, and 2 had access to water and weighingequipment.
The location of the big kabari godowns would bedetermined by both the accessibility to the suppliers(the small kabaris and the thiawalas), as well as easeof transport to the recycling units in truckloads. If weare to assume that the small kabaris supply to the bigkabaris on a weekly basis, while the thiawalas do soon a daily basis, then each big kabari would, on anaverage, have to be associated with at least 6 smallkabaris and 20 thiawalas. Thus, currently if there is asmall kabari cluster at every 3 km distance with anaverage of 5 small kabaris each, then there should beone big kabari among them. This roughly translatesinto 1 small kabari per 10,000 population and 1 bigkabari per 60,000 population.
Spac
e fo
r W
aste
- P
lan
nin
g f
or
the
Info
rmal
Rec
yclin
g S
ecto
r PL
AN
NIN
G N
OR
MS
15
There is section on the informal sector in the Master
Plan in which it is proposed to incorporate the
sector in trade in the planned development of
various use zones. Unfortunately, this section only
mentions about teh-bazari (the tax levied by the
Municipality for hawking goods on the pavement)
and gives a set of guidelines of the informal units
permitted for different facilities. There is no
reference to the informal workforce involved in
the process of recycling in Delhi. However, the
data generated by this study does give some clues
about a set of proposed norms as given below
[Table 3.1].
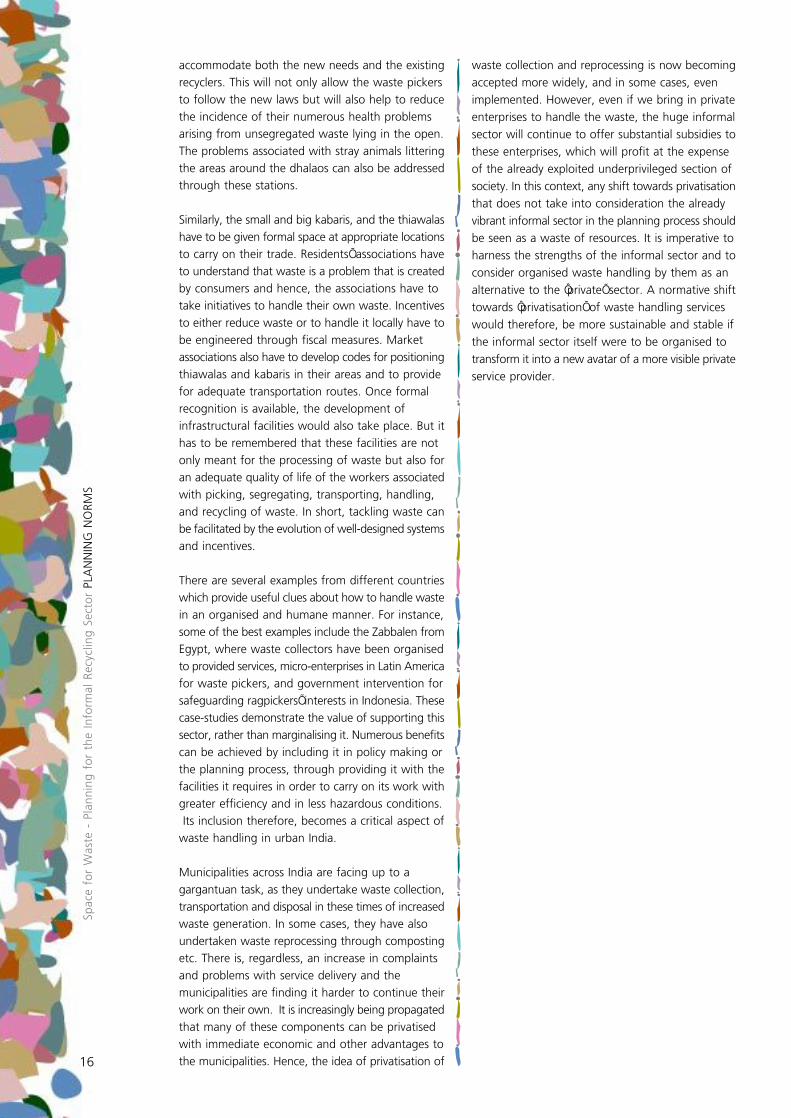
3.0 Planning Norms
Table 3.1: Norms for Various Sectors in Informal Waste Processing
Category Norm per 100,000 population Guidelines
Waste pickers 215 Each waste picker handles 60 kg of waste per day and requires 60 sq ft of space near the dhalao for segregation
Other workers 90 Each worker requires 125 sq ft of space near thekabari godown for segregation as well as road space for transportation
Small kabaris 6 3000 sq ft has to be allotted in a shopping centreto each small kabari for segregation and storageof about 1500 kg of waste, and shelter for workers.
Thiawalas 33 Thiawalas are located near markets and commercialcentres and each thiawala collects waste from 150 shops and establishments daily
Big kabaris 1.5 The big kabaris need storage space of 60,000 sqft for roughly 60,000 kg of waste which they collect weekly from the small kabaris
Other design norms would have to be developed
to provide the necessary infrastructural facilities
for the informal sector work force if it is to be
recognised as playing an important function in civic
life. For example, provisions for disposing off
domestic and commercial waste in segregated bins
at source have to be put in place. Negotiated
contracts would have to be put in place to formally
recognise the waste pickers as supplementary
municipal workers and to give them protection
from harassment. There is clearly a need to replace
the existing dhalaos with modern, scientifically
designed recycling depots that are able to
Spac
e fo
r W
aste
- P
lan
nin
g f
or
the
Info
rmal
Rec
yclin
g S
ecto
r PL
AN
NIN
G N
OR
MS
16
accommodate both the new needs and the existing
recyclers. This will not only allow the waste pickers
to follow the new laws but will also help to reduce
the incidence of their numerous health problems
arising from unsegregated waste lying in the open.
The problems associated with stray animals littering
the areas around the dhalaos can also be addressed
through these stations.
Similarly, the small and big kabaris, and the thiawalas
have to be given formal space at appropriate locations
to carry on their trade. Residents’ associations have
to understand that waste is a problem that is created
by consumers and hence, the associations have to
take initiatives to handle their own waste. Incentives
to either reduce waste or to handle it locally have to
be engineered through fiscal measures. Market
associations also have to develop codes for positioning
thiawalas and kabaris in their areas and to provide
for adequate transportation routes. Once formal
recognition is available, the development of
infrastructural facilities would also take place. But it
has to be remembered that these facilities are not
only meant for the processing of waste but also for
an adequate quality of life of the workers associated
with picking, segregating, transporting, handling,
and recycling of waste. In short, tackling waste can
be facilitated by the evolution of well-designed systems
and incentives.
There are several examples from different countries
which provide useful clues about how to handle waste
in an organised and humane manner. For instance,
some of the best examples include the Zabbalen from
Egypt, where waste collectors have been organised
to provided services, micro-enterprises in Latin America
for waste pickers, and government intervention for
safeguarding ragpickers’ interests in Indonesia. These
case-studies demonstrate the value of supporting this
sector, rather than marginalising it. Numerous benefits
can be achieved by including it in policy making or
the planning process, through providing it with the
facilities it requires in order to carry on its work with
greater efficiency and in less hazardous conditions.
Its inclusion therefore, becomes a critical aspect of
waste handling in urban India.
Municipalities across India are facing up to a
gargantuan task, as they undertake waste collection,
transportation and disposal in these times of increased
waste generation. In some cases, they have also
undertaken waste reprocessing through composting
etc. There is, regardless, an increase in complaints
and problems with service delivery and the
municipalities are finding it harder to continue their
work on their own. It is increasingly being propagated
that many of these components can be privatised
with immediate economic and other advantages to
the municipalities. Hence, the idea of privatisation of
waste collection and reprocessing is now becoming
accepted more widely, and in some cases, even
implemented. However, even if we bring in private
enterprises to handle the waste, the huge informal
sector will continue to offer substantial subsidies to
these enterprises, which will profit at the expense
of the already exploited underprivileged section of
society. In this context, any shift towards privatisation
that does not take into consideration the already
vibrant informal sector in the planning process should
be seen as a waste of resources. It is imperative to
harness the strengths of the informal sector and to
consider organised waste handling by them as an
alternative to the ‘private’ sector. A normative shift
towards ‘privatisation’ of waste handling services
would therefore, be more sustainable and stable if
the informal sector itself were to be organised to
transform it into a new avatar of a more visible private
service provider.
Spac
e fo
r W
aste
- P
lan
nin
g f
or
the
Info
rmal
Rec
yclin
g S
ecto
r R
ECO
MM
END
ATI
ON
S
17
There is an immediate need for the city to
look anew at the entire informal sector of
waste management and devise ways of
recognising, appreciating, and strengthening
its contribution to civic life.
While planning for a system of waste
management, it has to be kept in mind that
it not only takes care of the waste but also
of those who process the waste.
Although the waste picker is the lowest
member of the recycling chain, s/he plays
the most important role in it. Waste pickers
should get formal recognition and space in
the design of civic life.
The Small Kabari is one of the key
components in the recycling chain. Majority
of the waste pickers is associated with small
kabaris. Space requirement is the key issue
of small kabaris. A total of 3000 sq ft of
total space should be provided for the
godown of small kabaris (see the layout
plan for an average godown in section 2.5)
Thiawalas operate at an intermediate level
between wastepickers and small kabaris.
They have “thias” at critical locations in
4.0 Recommendationscommercial centres and shopping areas. There
should be adequate numbers of thiawalas
in commercial and shopping areas and foreach thia, 20 sq m of space should beprovided (see section 2.6).
Certain planning norms have to be adoptedfor the various sectors in the informal wasteprocessing, as per Table 3.1, section 3.
Spac
e fo
r W
aste
- P
lan
nin
g f
or
the
Info
rmal
Rec
yclin
g S
ecto
r R
EFER
ENC
ES
18
Indian Institute of Social Science (ISS), SOLID WASTE MANAGEMENT IN DELHI – An Exploratory Study
on Local Government- Community Interface, New Delhi, 2000
Delhi Development Authority (DDA), Delhi Master Plan, Government of India, New Delhi, 1990
The Hindu, No Landfill Site Available for Solid Waste, New Delhi, 2004 (a)
The Hindu, MCD Plans Garbage segregation for 12 Wards, New Delhi, 2004 (b)
References
© Copyright 2004 Chintan Environmental Research and Action GroupNo part of this brochure may be reproduced in any form without written permission from ChintanFor more information, www.chintan-india.org or contact us at:Chintan Environmental Research and Action Group 238 Sidhartha Enclave, New Delhi - 110014, IndiaT: 0091-11-24314478 E: [email protected]
Gra
ph
ic D
esig
n:
May
ank
Bh
atn
agar
Space for Waste is basedupon the planning andspatial needs of theinformal recycling sector,comprising waste-pickers,kabari-walas (junk dealersand traders ), thiawalas(temporary , individualwaste buyers ), amongstmany other players. It isbased upon the premisethat in order to undertakeproper segregation andrecycling of waste, it is vitalto recognize andstrengthen the sector byplanning for them andfacilitating their improvedworking conditions. Thisstudy details the norms andneeds, determinedcollectively with theinformal sector in Delhi.