Embed Size (px)
DESCRIPTION
manual
Citation preview
FIELD PROCEDURE MANUAL FOR
SELF-POTENTIAL SURVEYS
Charles E. Corry
Gregory T. DeMoully
Michael T. Gerety
Original: December, 1980
Revised: February, 1982
Revised and Published by
Zonge Engineering & Research Organization
Tucson, Arizona
August, 1983


FIELD PROCEDURE MANUAL FOR
SELF-POTENTIAL SURVEYS

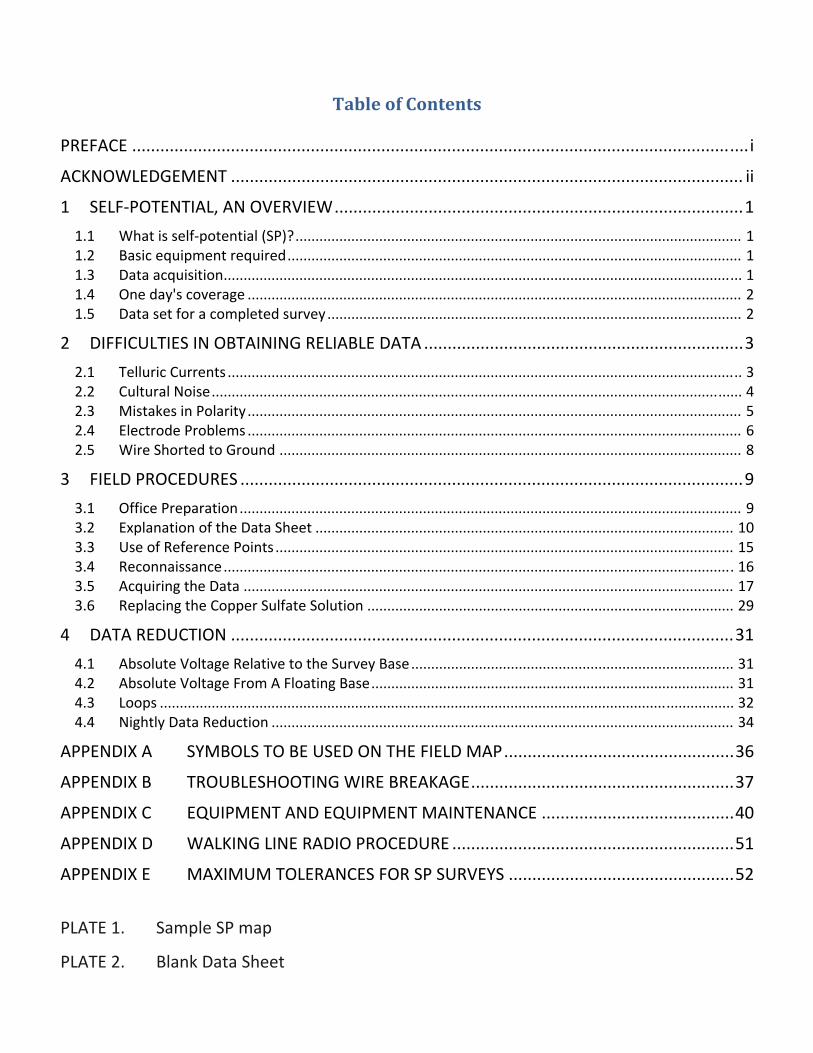
Table of Contents
PREFACE ................................................................................................................................... i
ACKNOWLEDGEMENT ............................................................................................................. ii
1 SELF‐POTENTIAL, AN OVERVIEW ....................................................................................... 1
1.1 What is self‐potential (SP)? ................................................................................................................ 1 1.2 Basic equipment required .................................................................................................................. 1 1.3 Data acquisition .................................................................................................................................. 1 1.4 One day's coverage ............................................................................................................................ 2 1.5 Data set for a completed survey ........................................................................................................ 2
2 DIFFICULTIES IN OBTAINING RELIABLE DATA .................................................................... 3
2.1 Telluric Currents ................................................................................................................................. 3 2.2 Cultural Noise ..................................................................................................................................... 4 2.3 Mistakes in Polarity ............................................................................................................................ 5 2.4 Electrode Problems ............................................................................................................................ 6 2.5 Wire Shorted to Ground .................................................................................................................... 8
3 FIELD PROCEDURES ........................................................................................................... 9
3.1 Office Preparation .............................................................................................................................. 9 3.2 Explanation of the Data Sheet ......................................................................................................... 10 3.3 Use of Reference Points ................................................................................................................... 15 3.4 Reconnaissance ................................................................................................................................ 16 3.5 Acquiring the Data ........................................................................................................................... 17 3.6 Replacing the Copper Sulfate Solution ............................................................................................ 29
4 DATA REDUCTION ........................................................................................................... 31
4.1 Absolute Voltage Relative to the Survey Base ................................................................................. 31 4.2 Absolute Voltage From A Floating Base ........................................................................................... 31 4.3 Loops ................................................................................................................................................ 32 4.4 Nightly Data Reduction .................................................................................................................... 34
APPENDIX A SYMBOLS TO BE USED ON THE FIELD MAP ................................................. 36
APPENDIX B TROUBLESHOOTING WIRE BREAKAGE ........................................................ 37
APPENDIX C EQUIPMENT AND EQUIPMENT MAINTENANCE ......................................... 40
APPENDIX D WALKING LINE RADIO PROCEDURE ............................................................ 51
APPENDIX E MAXIMUM TOLERANCES FOR SP SURVEYS ................................................ 52
PLATE 1. Sample SP map
PLATE 2. Blank Data Sheet
List of Figures
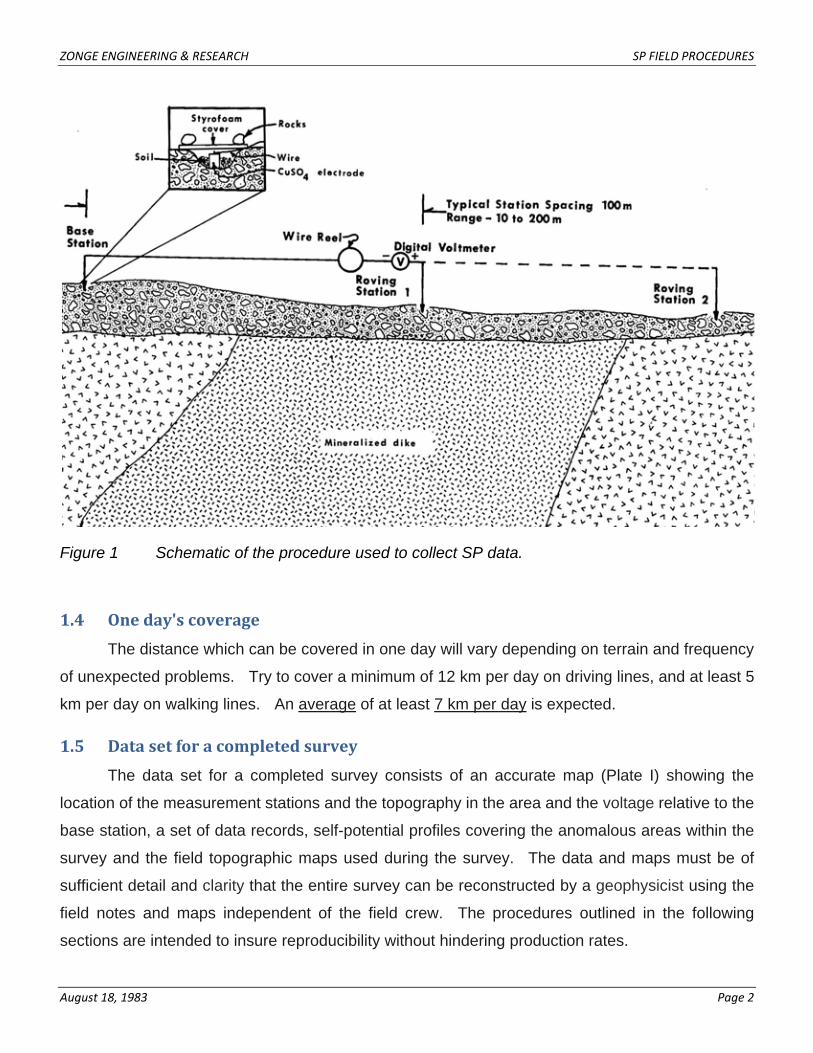
Figure 1 Schematic of the procedure used to collect SP data. .................................................. 2
Figure 2 Measurement of telluric currents and what they look like. The electrode separation is normally 100 m. The strip chart drive speed is set to 10 cm/hr. A sensitivity of 10 mV full scale can be used in normal conditions. ................................ 4
Figure 3 Example of Completed Data Sheet. .......................................................................... 13
Figure 4 A Blank Data Sheet (reduction) (a full-sized sheet is on last page) ........................... 14
Figure 5 Preparing a base pot or telluric monitor pot. .............................................................. 18
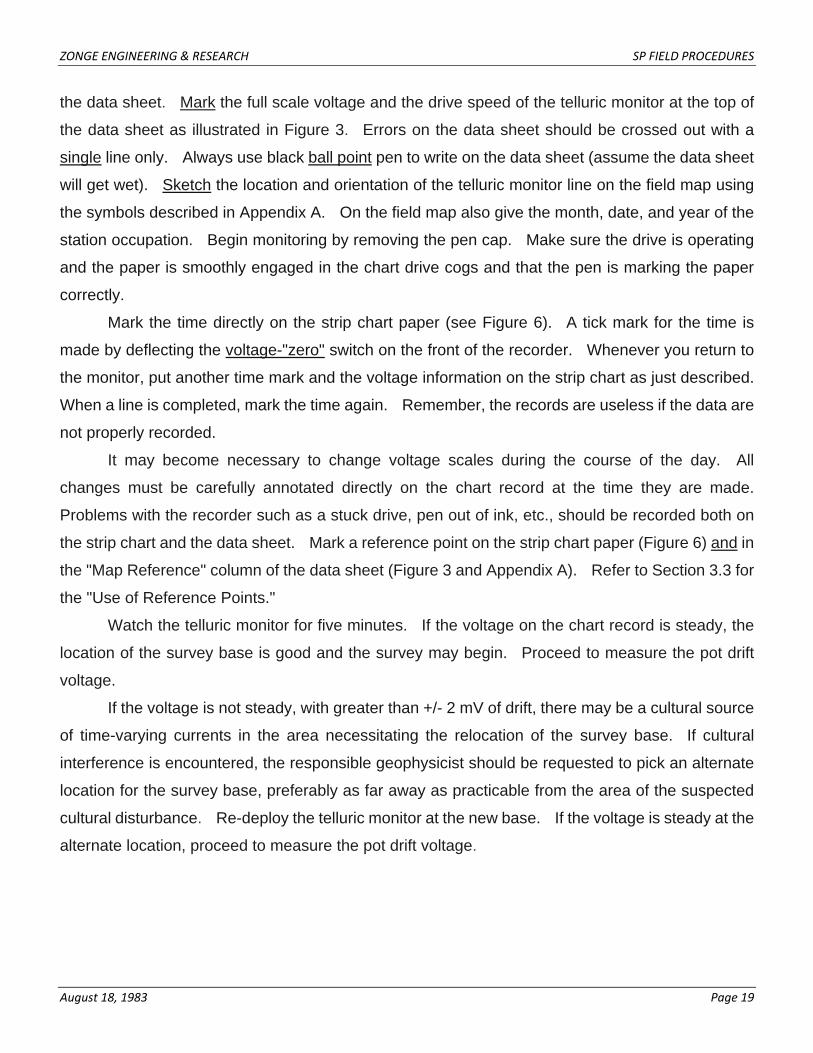
Figure 6 The telluric monitor strip chart. This is an illustration of what a typical strip chart record should look like. The base designation given to a strip chart record is the same as that given to the nearest base station. .................................................. 20
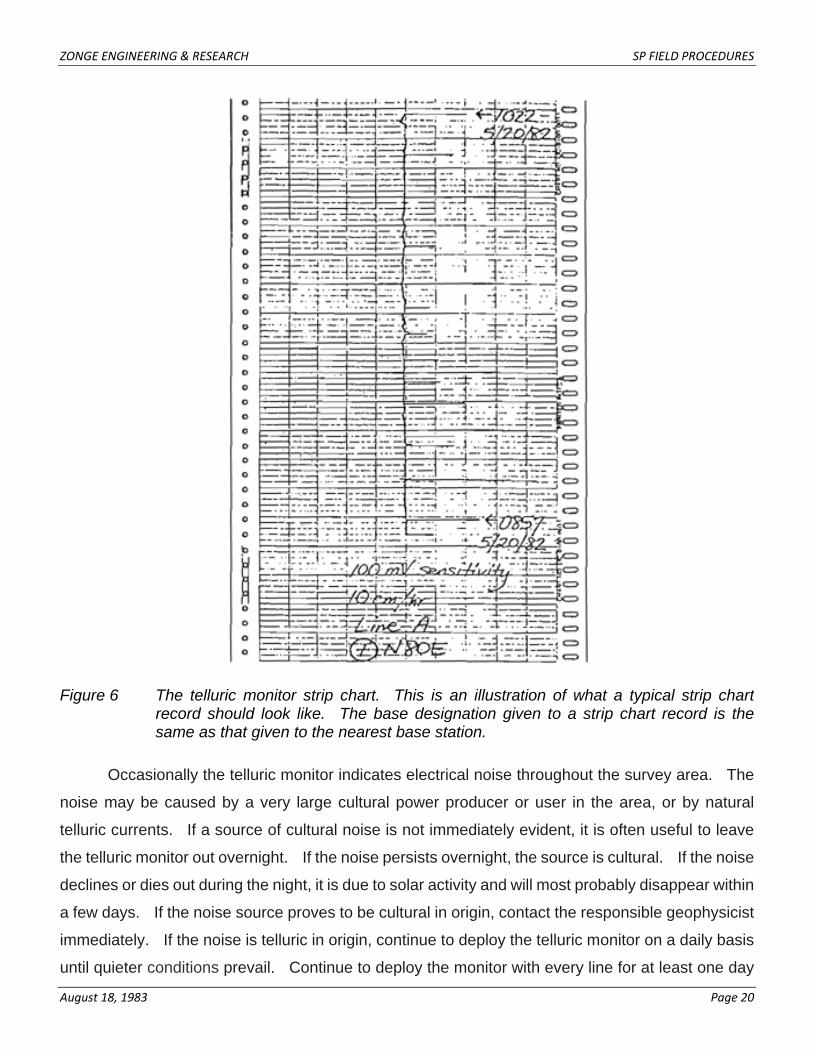
Figure 7 Equipment set-up in vehicle for driving lines. ............................................................ 22
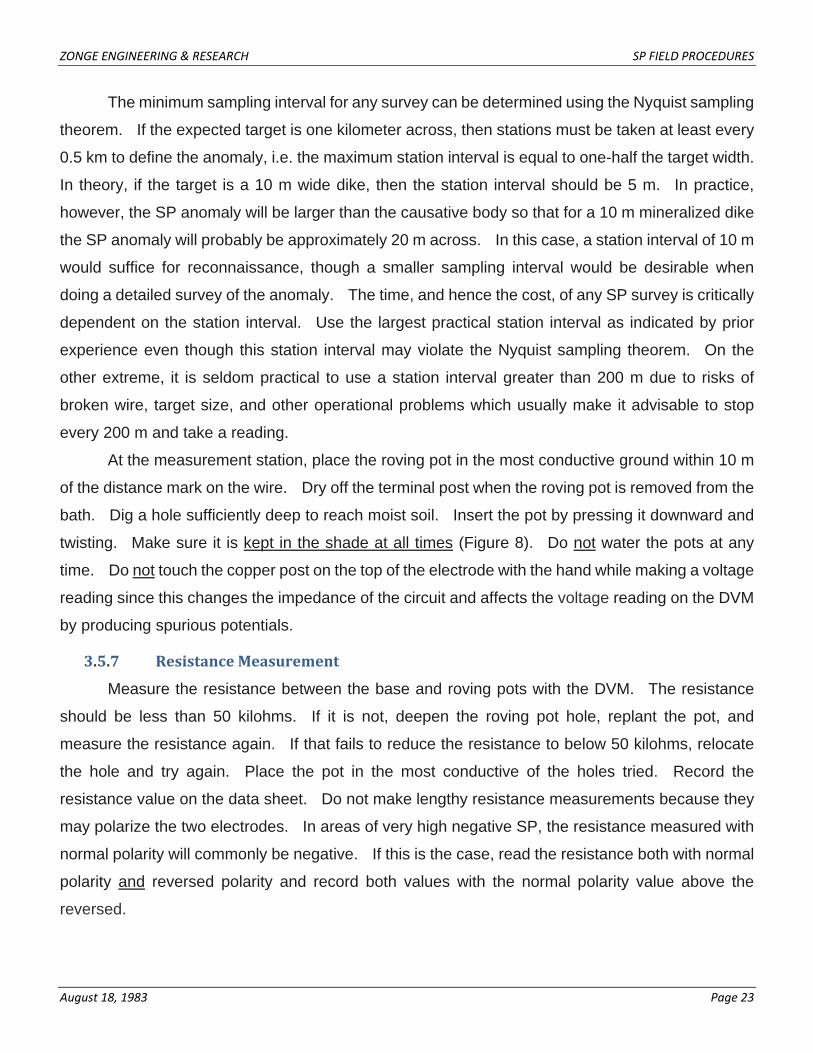
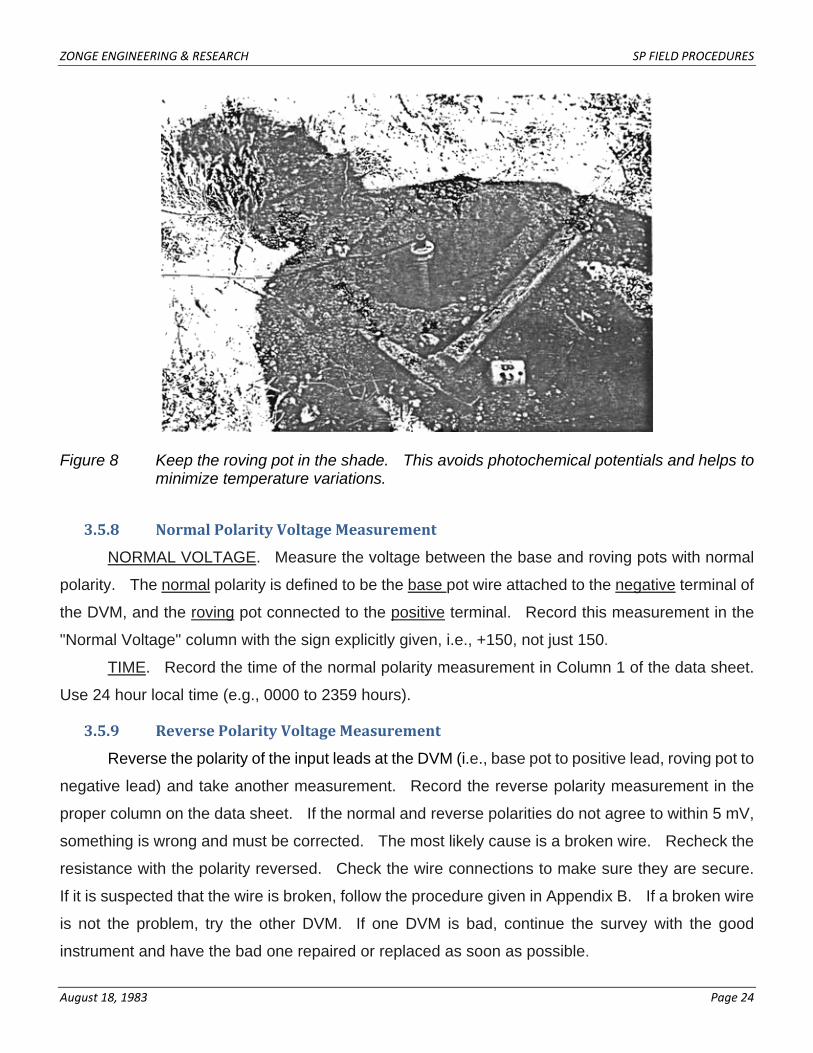
Figure 8 Keep the roving pot in the shade. This avoids photochemical potentials and helps to minimize temperature variations. ................................................................. 24
Figure 9 Always clean the ceramic base of a pot whenever vou pull it from the ground. Keep pots covered if they are not returned to the pot bath promptly. ........................ 30
Figure 10 A completed data sheet using a "floating" base. Note the different base tie-in corrections used for the data stations and the re-occupation points. ......................... 33
Figure 11 Example of an SP line profile. .................................................................................... 35
Figure 12 Troubleshooting procedure for finding a break somewhere along the wire. .............. 38
Figure 13 The method used to find the location of an internal stress fracture in the wire. The entire wire is laid out with one end grounded to a porous pot, and a resistance measurement is made at some point P. ................................................... 39
Figure 14 Porous pot electrodes and an insulated pot bath with wood rack in bottom to hold electrodes. Foam padding placed under rack. ................................................. 41
Figure 15 A walking reel, DVM, roving pots, and a spare spool. ............................................... 44
i
PREFACE
The self-potential (SP) method has a long history of successful exploration for minerals.
However, the technique has fallen into disuse, partly for reasons of fashion, but primarily because of
problems with repeatability and reproducibility of the data. A very high degree of data
reproducibility and repeatability can be obtained using the techniques and procedures given in this
manual. Careful attention to the field techniques stated here should allow any reasonably careful
field crew to obtain low cost, reliable SP data with minimum difficulty. Conversely, carelessness on
the part of the field crew and lack of proper supervision by the responsible geophysicist can lead to
the same old problems of poor repeatability and reproducibility. We hope that this manual will be of
some use in obtaining high quality self-potential data, and help rekindle interest in the self-potential
method.
This manual defines the field procedures and data presentation to be used by self-potential
field crews in mineral surveys. With few modifications, it should also be useful in other types of SP
surveys (e.g., geothermal, hydrocarbon, geologic, environmental contaminants, etc.) as well.
Section 1 is a short overview of SP and the method used to acquire the data. Section 2 discusses
some of the difficulties encountered. Section 3 consists of the step-by-step procedure used to
acquire SP data. Section 4 discusses the data reduction procedures. At the end of the manual
are a series of appendices which discuss in detail: (A) the symbols to be used on the field map for
recording the locations of the measurement or anything else of interest; (B) troubleshooting wire
breakage; (C) the equipment used and its maintenance; (D) walking line radio procedure; and (E)
maximum tolerances for SP surveys.
An attempt has been made to present a fairly detailed picture of SP data acquisition,
although many problems encountered by the crew will almost certainly not be covered by this
manual. Of these, many can be corrected easily by the crew. Other difficulties and any occasion
that the crew is in doubt concerning the appropriate course of action are to be reported to the
responsible geophysicist at once.
It is expected that the field crew will read and understand this manual before going into the
field. It is also the responsibility of the field crews to insure that the tolerances specified in this
manual and its appendices are met. If for any reason the tolerances specified cannot be met, the
field crew must contact the responsible geophysicist as soon as practical.

ii
ACKNOWLEDGEMENT
This manual was originally written while the authors were employed by the Climax
Molybdenum division of AMAX. Inc., Golden. Colorado. We would like to thank AMAX for
permission to publish this revision of the original manual.
ZONGE ENGINEERING & RESEARCH SP FIELD PROCEDURES
August 18, 1983 Page 1
1 SELFPOTENTIAL, AN OVERVIEW
1.1 What is selfpotential (SP)?
Self-potential (SP) is the naturally occurring electrical potential of the earth resulting from
geologic, geochemical, and hydrologic interactions which cause electric potentials to exist in the
earth in the vicinity of the measurement point. Since 1830 the SP method has been employed in
the search for minerals. Anomalous surface potentials are commonly measured in the vicinity of
pyrite (marcasite), chalcopyrite, pyrrhotite, sphalerite, and graphite. These potentials are
measured in millivolts (mV) relative to a "survey base", where the potential is arbitrarily assigned to
be zero volts. Amplitudes of SP anomalies in mineralized areas range from a few millivolts to one
volt or more. The potentials of interest are always negative above a mineralized body relative to a
point outside the mineralization. The observed potentials are the result of oxidation, or valence
electron stripping, of sulfides; hence, the negative potential.
1.2 Basic equipment required
The basic equipment required is simple, consisting of a pair of electrodes connected by wire
to a digital multimeter (DVM) with a high input impedance capable of a reading accuracy of +/-
0.0001 volts. There are, however, two restrictions on the electrodes and voltmeter which are most
important. They are: (1) no spurious potentials can be introduced by the measurement technique,
and (2) the reference or base electrode must be placed outside the system, above the water table,
and not in a reducing environment such as a bog or swamp. The avoidance of these errors is the
primary reason for this manual.
1.3 Data acquisition
Figure 1 shows schematically the method of conventional SP data acquisition. The operator
attaches one end of the wire to the base station electrode. The wire is unreeled to station 1 where
the roving electrode is placed in a shallow hole in the ground. The voltage between the base
station electrode and the roving electrode is recorded with the defined sign convention. The base
pot is always attached to the negative lead of the voltmeter. After making the voltage
measurement the roving electrode is picked up and more wire is unreeled to station 2. The roving
electrode is again placed in the earth, and another voltage measurement is made. This procedure
is repeated until the end of the wire is reached, at which point the wire is rewound, and the base
station is moved to the end of the completed line, where a secondary base station is established.
This process is repeated until the survey is complete.
ZONGE ENGINEERING & RESEARCH SP FIELD PROCEDURES
August 18, 1983 Page 2
1.4 One day's coverage
The distance which can be covered in one day will vary depending on terrain and frequency
of unexpected problems. Try to cover a minimum of 12 km per day on driving lines, and at least 5
km per day on walking lines. An average of at least 7 km per day is expected.
1.5 Data set for a completed survey
The data set for a completed survey consists of an accurate map (Plate I) showing the
location of the measurement stations and the topography in the area and the voltage relative to the
base station, a set of data records, self-potential profiles covering the anomalous areas within the
survey and the field topographic maps used during the survey. The data and maps must be of
sufficient detail and clarity that the entire survey can be reconstructed by a geophysicist using the
field notes and maps independent of the field crew. The procedures outlined in the following
sections are intended to insure reproducibility without hindering production rates.
Figure 1 Schematic of the procedure used to collect SP data.
ZONGE ENGINEERING & RESEARCH SP FIELD PROCEDURES
August 18, 1983 Page 3
2 DIFFICULTIES IN OBTAINING RELIABLE DATA
The potential of a point on the earth's surface results from the superposition of several
different electric fields. The direct current (DC) field contains the SP field and possibly cultural
noise. The time-varying field consists of telluric currents and cultural noise. In SP surveys, only
the DC field is of interest; all other electric potentials are regarded as "noise" and are to be avoided.
2.1 Telluric Currents
2.1.1 Definition
Telluric currents are time-varying electric fields originating with magnetospheric fluctuations
resulting from the interaction of the solar wind with the earth's magnetic field. They can be
observed by monitoring the potential difference between two arbitrarily placed electrodes on the
ground (Figure 2). The amplitude of the telluric field, in part, depends on the resistivity of the
material through which it is flowing. Ten mV/km of AC voltage fluctuation may be considered
common in mid-latitudes.
Telluric current activity is by no means constant; it varies with the time of day, latitude, and
solar activity. There are times when it is almost nonexistent e.g. at night; other times it may exceed
250 mV/km.
2.1.2 Frequency Range
Telluric currents commonly contain high energy components in a frequency range from 0.001
Hz to 100 Hz. Frequencies lower than 1 Hz are difficult, if not impossible, to observe in the few
seconds required to take an SP reading. However, the potential of a point on the ground may be
slowly raised and lowered with respect to the survey base in response to the tellurics, thereby
introducing an undesirable component in the self-potential being measured.
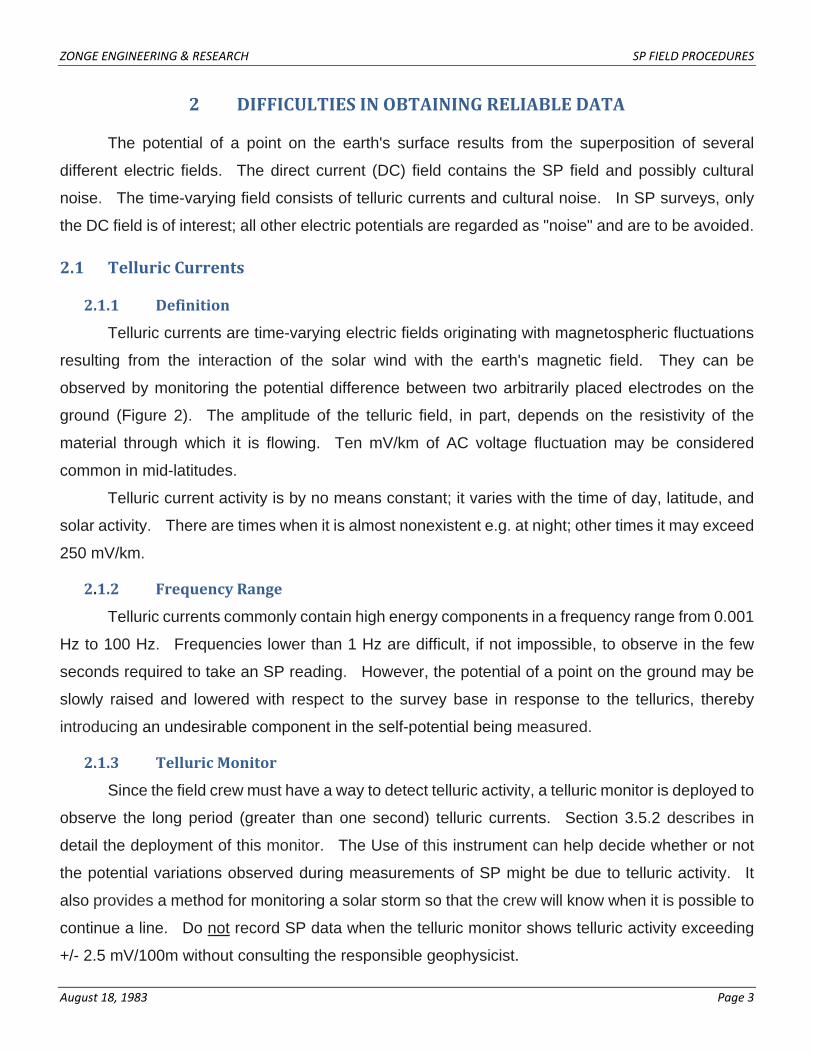
2.1.3 Telluric Monitor
Since the field crew must have a way to detect telluric activity, a telluric monitor is deployed to
observe the long period (greater than one second) telluric currents. Section 3.5.2 describes in
detail the deployment of this monitor. The Use of this instrument can help decide whether or not
the potential variations observed during measurements of SP might be due to telluric activity. It
also provides a method for monitoring a solar storm so that the crew will know when it is possible to
continue a line. Do not record SP data when the telluric monitor shows telluric activity exceeding
+/- 2.5 mV/100m without consulting the responsible geophysicist.
ZONGE ENGINEERING & RESEARCH SP FIELD PROCEDURES
August 18, 1983 Page 4
2.2 Cultural Noise
Changes in the "natural" SP field can result from power lines, radio (mainly ULF)
communications, buildings, fences, pipelines, etc. Noise from such sources may be common in
many SP survey areas. Care should be taken to avoid measurements suspected of significant
cultural noise. The following is a list of the more common noise sources.
2.2.1 Power lines
Sixty hertz alternating current (AC) is used for power transmission in the United States.
Near high tension lines or generating stations, this signal may be strong enough to saturate the
voltmeter and cause major fluctuations in the voltage readings.
Power lines are often grounded on every, or every other pole. The ground wires alter the ground
potential for several meters. No measurement should be made within 10m of a ground wire to
avoid any cultural DC offset. Base stations should not be located within 500m of any power 1ines.
If it proves impossible to avoid cultural noise due to power transmission, it is sometimes
possible to filter out the 60 Hz with a suitable notch or low pass filter.
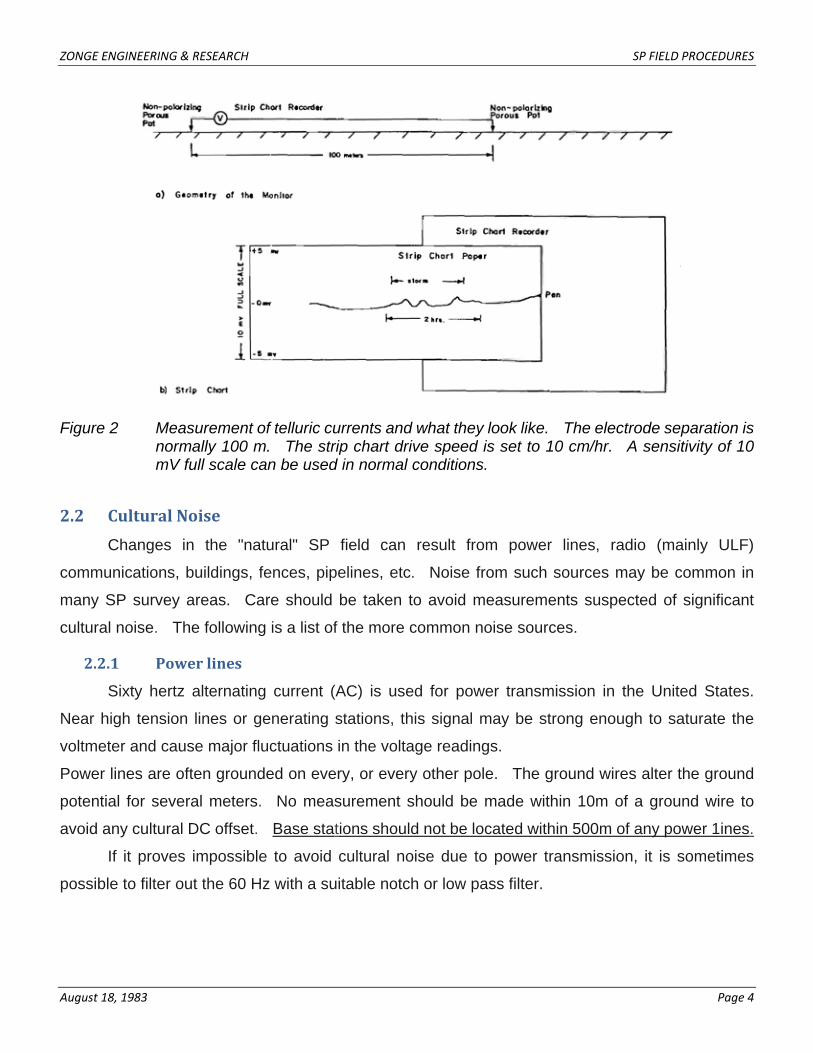
Figure 2 Measurement of telluric currents and what they look like. The electrode separation is
normally 100 m. The strip chart drive speed is set to 10 cm/hr. A sensitivity of 10mV full scale can be used in normal conditions.
ZONGE ENGINEERING & RESEARCH SP FIELD PROCEDURES
August 18, 1983 Page 5
2.2.2 Telephone lines
Telephone lines are grounded at regular intervals. No measurement should be made within
10m of a ground wire to avoid any cultural DC offset. Base stations should not be located within
500m of any telephone line.
2.2.3 Metal pipes, gas lines, cased drill holes, railroad tracks, fences. etc.
These objects alter the electrical potential field of the earth wherever they are in contact with
the ground. They either "short out" the potential or interfere with the earth's natural state with
cathodic protection devices as are commonly found on pipelines. If possible, measurements
should not be made within 20m of any metal object. Pipelines are often electrically charged in
order to prevent corrosion. Measurements should not be made within 500m of an
electrically-protected pipeline. This includes all gas lines and most other metal pipe lines. When a
measurement must be taken near such objects, the distance to the object and description of the
object should be recorded on the data sheet. A note should be made stating that cultural
interference is suspected. Use as much space on the data sheet as necessary for a satisfactory
description. Obviously, a base station must not be located within 500m of any of these objects.
Field studies also indicate that old drill casing will affect the SP, and thus should be avoided if
possible as far as 500 meters away.
2.2.4 Industry
Mines, mills, power plants, substations, and factories all produce or use large amounts of
electricity. The potential of the ground may be affected for tens of kilometers around them. The
data quality surrounding these objects is uncertain. Large scale power producers and consumers
should be documented by the SP crew on the map and in their notes so the area can be critically
reviewed. Areas where the data are obviously affected should be avoided. In the event the
survey must be done near such sources, consult the responsible geophysicist before proceeding.
In some cases, such as near large operating mines, it may be impossible to run an SP survey
because of the extreme interference unless the mine operations are shut down.
2.3 Mistakes in Polarity
SP measurements are made and recorded with both possible polarities as an aid to
minimizing errors. The normal polarity is the first potential measurement taken. It consists of the
base pot connected to the negative terminal of the voltmeter and the roving pot to the positive. The
normal voltage is used in preparing the SP map (Plate 1). Accidently reversing the polarity
ZONGE ENGINEERING & RESEARCH SP FIELD PROCEDURES
August 18, 1983 Page 6
recorded in the normal column of the data sheet can have devastating effects on the SP survey.
Take the utmost care to insure proper polarity. The instrumentation is normally designed so that
this mistake is not possible; however, field modifications and repairs may negate the fail-safe
design. After field repair or modification of the equipment, check the polarity by measuring the
voltage of a known source such as a car or transistor battery.
2.4 Electrode Problems
Copper-copper sulfate, non-polarizing electrodes are used to make contact with the ground.
They consist of a plastic container filled with a saturated solution of copper sulfate. Immersed in
this solution is a copper rod to which the DVM lead is attached. The base of the container is porous
and allows the solution to leak slowly into the ground. The porous pot itself can affect the SP
readings made by the crew in a variety of ways as detailed below.
2.4.1 Chemical Differences
Chemical differences in the copper sulfate solution between the porous pots can result in a
potential difference of several millivolts, independent of the earth. It can be measured with the
DVM when both are placed in the copper sulfate bath. If necessary, this voltage may be reduced to
less than 1 mV by mixing the solutions together or changing the solutions. Cleaning the ceramic
surface on the bottom of the pots after each station will also help in this respect.
2.4.2 Sunlight
Ultraviolet radiation on the copper sulfate solution will change its electrical potential. This
effect can be as high as 50 mV, though it is generally less. For this reason, keep the pots out of
sunlight.
2.4.3 Temperature
Temperature can also have an effect on the potential of one pot relative to another. This
effect is generally less than 10 mV, but an attempt must be made to shield the pots from radical
temperature changes. Keep the base pot insulated after it is emplaced. Keep the roving pot out of
the sunlight when making a reading, and in the constant temperature bath when not making a
reading.
2.4.4 Pot drift
During the course of measuring an SP line, the potential between the base pot and roving pot
will change due to chemical and temperature variations. These variations result in pot drift. The
ZONGE ENGINEERING & RESEARCH SP FIELD PROCEDURES
August 18, 1983 Page 7
drift can be reduced by keeping the pots in the shade, and in the constant temperature bath when
not in use.
Since the drift error is additive it must be removed each time the base pot is moved to a new
location. Suppose the drift correction is not made for a drift voltage of +10 mV. The absolute
voltage at the end point of the first line is then 10 mV too high. The end point of the first line is the
base for the second line.
At the end of the second line the drift voltage is again +10 mV. The potential of the end point
is again 10 mV high relative to its base. That means the absolute voltage assigned to the end point
of the second line is 20 mV high. The same error will then propagate along all subsequent lines run
off this new base, and will result in a bad tie when this line is in any loop.
2.4.5 High Contact Resistance
The current resistance (R contact) between the porous electrodes and the earth may affect
the SP measurement by loading the circuit, and hence, reduce the measured voltage if the contact
resistance approaches within two orders of magnitude of the input impedance (R input) of the DVM
(i.e. R contact must be much less than R input (R contact « R input)).
In order to keep the contact resistance as small as possible, the pot should be placed in the
most conductive ground available within 10 meters of the distance mark on the cable. To minimize
contact resistance, dig a small hole to reach moist soil and plant the pot firmly in it. This procedure
generally results in less than 50 kilohms resistance between the base and roving pots. If the
contact resistance is greater than 50 kilohms, re-position the pot in another hole. Occasionally, it
will not be possible to obtain a contact resistance less than 50 kilohms due to frozen ground, very
dry ground, high resistivity country rock, etc. When this is the case, and if the voltage is stable, take
the voltage reading and continue the survey. Be sure to enter the contact resistance on the data
sheet. Do NOT under any circumstances water the pot holes to reduce the resistance because this
will affect the potential reading. In highly resistive or dry ground, contact resistance between 100
and 200 kilohm can be expected. In frozen ground the contact resistance may easily exceed 1
megohm.
2.4.6 Soil Moisture
The SP survey should not continue under conditions where soil moisture may be changing
during a line. The onset of heavy or persistent rain, or for a period of 12 hours after such a
rainstorm stops, precludes continuation of the survey. However, a brief shower which does not
penetrate more than 1 cm into the soil need not stop the survey. Since changes in soil moisture
ZONGE ENGINEERING & RESEARCH SP FIELD PROCEDURES
August 18, 1983 Page 8
always cause changes in the measured potential, a prime responsibility of the field crews is to avoid
conditions in which the soil moisture is changing while a line is being run.
It is critical that at all base stations the base electrode be located above the water table and
out of any area where reducing conditions (low Eh-high pH) might exist such as peat bogs, swamps,
willow bogs, alongside streams, etc. The base pot is best located on a hillside in previously
undisturbed ground away from road fill, but locating it in road fill would be preferable to marshy
ground at the side of the road.
2.5 Wire Shorted to Ground
2.5.1 Bare Spots
Bare spots on wires which short to the ground between the base pot and the DVM produce
large positive contact potentials (50 to 600 mV) which may be relatively steady with time. Usually
the bare spots will only ground in muddy or very damp earth. Unfortunately, grounded wires are
difficult to diagnose since planting a base in an area of negative potential and measuring in an area
of higher SP also produces these large positive potentials. For this reason, among others, it is not
a good idea to put a base station within an area of large (<-100 mV) negative potential. To deal
with the problem, put base stations in areas of high amplitude negative potential only as a last resort
and immediately question any large positive voltage measurements. Repair any bare spots on
wires where the insulation has broken through, and always keep the wire out of water or mud. This
means when driving lines through muddy areas and stream crossings, the driver must periodically
stop and hang the line in trees and on rocks to prevent the wire from lying in the mud or water. The
same precaution must also be taken on walking lines.
2.5.2 Shorts to the Reel Housing
A similar situation results when a wire shorts to the reel housing. After the reel housing is
placed on the ground, the short circuit is completed. All reels must be checked daily to make sure
there is infinite resistance between the wire and reel housing.
ZONGE ENGINEERING & RESEARCH SP FIELD PROCEDURES
August 18, 1983 Page 9
3 FIELD PROCEDURES
The following is a detailed, step-by-step procedure used to collect SP data. The field
procedure is to be strictly followed by the field crews and contractors. If there are any questions
about the method, please ask the responsible geophysicist. It is assumed the procedure is
understood at the beginning of the survey and will be followed throughout.
3.1 Office Preparation
3.1.1 Field Equipment
Check and make sure that the field equipment is complete and serviceable. A list of this
equipment is found in Appendix C. The wire reels should always be checked for open circuits in the
wire. A reasonable resistance is a few hundred ohms or less per km of wire. To avoid spurious
contact potentials between the reel housing and the earth, the wire must be electrically isolated from
the reel and the resistance reading between the wire and the reel housing must be infinite. Check
that the distance marks on the wire are marked clearly and located properly, and that they are not
slipping on the wire. Tape flags should be located every 100 m and marked in km (0.5, 0.6, …, 1.3,
etc.)
3.1.2 Topographic Maps
Locate at least two copies of the topographic maps covering the survey area. One of these
is to be used for the field and one is to be used as a clean, "hotel room" copy. Data are to be
transferred from the field map to the hotel copy on a daily basis. The proposed lines are marked
with a "Hi-Liter" on the field copy and are subject to change as the survey progresses. For this
reason the hotel map is labeled only with the actual data points as the survey progresses. Also, it is
probable that not all proposed lines will actually be run. If the proposed SP lines have not been
marked on the field copy of the map, contact the responsible geophysicist. The clean hotel maps
should be rolled and placed in a map tube for protection.
3.1.3 Last Minute Check
Before leaving for the field, do a small survey in the vicinity of the office to insure that all
equipment is present and working.
ZONGE ENGINEERING & RESEARCH SP FIELD PROCEDURES
August 18, 1983 Page 10
3.1.4 Programmable Calculator
If a programmable calculator is going to be used it is advisable at this time to obtain or
develop the program for obtaining the drift correction, tie-in voltage, and absolute voltage for each
station (See Section 4).
3.2 Explanation of the Data Sheet
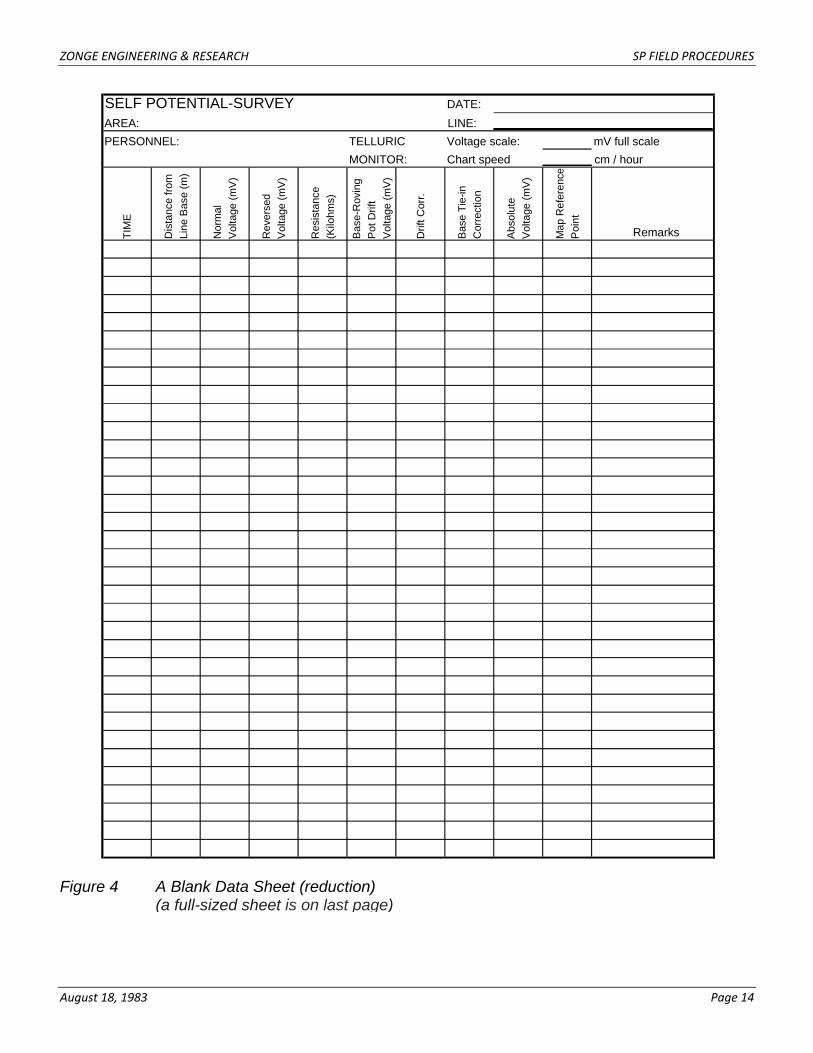
The data sheet (Figure 4) is used to record all numbers and remarks relevant to the survey.
New data sheets should be started at the beginning of each day, or at the beginning of each new
line designation. All field data are to be entered in black ball point pen on the data sheets (assume
the data sheet will get wet). If an error is made, cross it out with a single line, and rewrite the data
above the error or on the next line of the data sheet. Illegible field notes can make the entire survey
useless. The methods to be used for acquiring the recorded data are discussed in the following
section. A completed data sheet is shown in Figure 3.
3.2.1 Date
Record the month, date, and year (e.g., 7/24/80) when that particular form is being filled out.
The beginning of each day should start on a new data sheet.
3.2.2 Area
Record the name designated for the survey and the name of the map quadrangle on which
the survey is currently being run. When assessment work is being done on two or more claim
blocks, the field crew must also designate which claim blocks are being worked on each day so that
the work done for the benefit of each set of claims may be legally determined.
3.2.3 Line
Record the reference points used to designate the beginning and end of the survey line.
The reference point at the beginning of the line must be recorded at the beginning of each line.
Enter the reference for the end of the line when you reach it. The line designation will have the
Form G-H or AC-AD (see "Use of Reference Points", Section 3.3).
3.2.4 Personnel
Record the names of the persons on the crew for that particular line.
3.2.5 Time
Record the time at which the measurement was made in 24 hour local time, i.e., 0000 to 2359
hours.
ZONGE ENGINEERING & RESEARCH SP FIELD PROCEDURES
August 18, 1983 Page 11
3.2.6 Distance From Line Base
Record the distance from the base pot to the roving pot in meters, i.e., 100, 200, 300, etc., not
1, 2, 3 or some other private code.
3.2.7 Normal Voltage
This is the voltage reading between the base pot and roving pot in millivolts. The normal
polarity is the base pot connected to the negative input of the DVM and the roving pot to the positive
input of the DVM. The sign of the voltage reading, whether positive or negative, is to be stated
explicitly on the data sheet, i.e., +150. not just 150.
3.2.8 Reversed Voltage
Record the voltage reading between the base pot and roving pot with reverse polarity, i.e.,
the base pot connected to the positive DVM input, and the roving pot to the negative input. The
sign of the voltage is again recorded explicitly. The reversed voltage should be equal in magnitude
(within +/- 5 mV) and of opposite polarity from the normal voltage. If it is not, then telluric activity
should be suspected or other problems (such as a loose connection) may exist.
3.2.9 Resistance
Record the resistance in kilohms between the base pot and the roving pot, measured with the
DVM. In areas of extreme SP, i.e., the areas of interest, the resistance may be negative. In these
areas, check the resistance with polarity reversed, and record both values, normal polarity written
above the reversed polarity.
3.2.10 BasetoRoving Pot Drift Voltage
Record the voltage between the base and roving pots while placed in the copper sulfate bath.
The measurement is made at the beginning of each line, and every time the base pot is picked up at
the end of a line. The measurement is made with the normal polarity convention: the base pot
connected to the negative DVM terminal and the roving pot to the positive terminal of the DVM.
3.2.11 Drift Correction
This is a number which must be added to the normal voltage to compensate for drift in the
electrodes. To obtain the drift correction, reverse the sign of the drift voltage measurements which
are taken at the beginning and the end of the line. Put these values in the drift correction column,
then interpolate between the beginning and the end of the line as a function of time to obtain the drift
correction for the new base station, i.e., the last station on the line.

ZONGE ENGINEERING & RESEARCH SP FIELD PROCEDURES
August 18, 1983 Page 12
3.2.12 Base Tiein Correction
The base tie-in correction is the absolute voltage of the base from which a line is run. This
value must be added to the entire line in order to refer the voltage to the survey base. The
procedure for obtaining this value is given in Section 4.
3.2.13 Absolute Voltage
This is the station voltage relative to the Survey Base in millivolts. It is calculated by adding
the normal voltage to the drift and base tie-in corrections.
3.2.14 Map Reference Point
The entries in this column consist of letters of the alphabet and refer to similarly labeled
points on the topographic map used for the survey and associated profiles. See the following
section on "Use of Reference Points" for a detailed description of these labels.
3.2.15 Remarks
Any topographic or cultural point which shows on the map should be noted here. Also, any
nearby culture which might affect the survey, e.g., culverts, powerlines, etc., should be noted here.
Many comments will be short (i.e., base station, end of line, pipeline 100m north, etc.) and will fit in
this section. Do not try to "squeeze" the information in; if more room is needed, write across the
form as in Figure 3. While the crew's life story is not required, in general, there cannot be too many
comments. Most crews err on the side of too few and cryptic comments. Be sure this does not
apply to you. Imagine yourself trying to make sense of another crew's comments a year hence,
and write for that crew. Remember that it is frequently necessary to relocate the survey stations at
some later time. Be sure your descriptions are adequate to allow subsequent crews to relocate
these points.
Always note any stations which are flagged in the remarks, e.g. kilometer stations. Be sure
to describe the location of every base station exactly and concisely so that follow-up surveys can
locate that same point.

ZONGE ENGINEERING & RESEARCH SP FIELD PROCEDURES
August 18, 1983 Page 13
Figure 3 Example of Completed Data Sheet.
ZONGE ENGINEERING & RESEARCH SP FIELD PROCEDURES
August 18, 1983 Page 14
SELF POTENTIAL-SURVEY DATE:
AREA: LINE:
PERSONNEL: TELLURIC Voltage scale: mV full scale
MONITOR: Chart speed cm / hour
TIM
E
Dis
tanc
e fr
om
Line
Bas
e (m
)
Nor
mal
Vol
tage
(m
V)
Rev
erse
d
Vol
tage
(m
V)
Res
ista
nce
(Kilo
hms)
Bas
e-R
ovin
g
Pot
Drif
t
Vol
tage
(m
V)
Drif
t Cor
r.
Bas
e T
ie-in
Cor
rect
ion
Ab
solu
te
Vol
tage
(m
V)
Map
Ref
eren
ce
Poi
nt
Remarks
Figure 4 A Blank Data Sheet (reduction) (a full-sized sheet is on last page)

ZONGE ENGINEERING & RESEARCH SP FIELD PROCEDURES
August 18, 1983 Page 15
3.3 Use of Reference Points
3.3.1 Reference Points
Reference points, indicated by the symbols given in Appendix A. are used to relate the map,
raw data sheets, and profiles together. Without these it is difficult, if not impossible, to cross
reference these documents. Reference points are useful in answering the following types of
questions:
1. What data points were taken on a particular day? Where is this on which map? On
the profiles?
2. A particular section of data looks interesting in profile. Where is this located on the
map?
3. The geology of an area shows one particular region of interest. What lines cross this
area, and what do the profiles look like?
4. The data on a profile look suspicious. Where on the map is this section located?
Where in the field notes is the description of telluric problems or data noise located?
5. Given any profile, where on the raw data sheets are the original measurements
recorded?
3.3.2 Standardized Use of Reference Points
The use of reference points has been standardized so that a good data sheet can be
constructed without an undue expenditure of time either by the field crew, the analyst interpreting
the survey after it is complete, or a survey crew extending the survey the next field season.
3.3.3 Mandatory Reference Points
The following reference points are mandatory and are designed to facilitate the interpretation
and drafting of the final report. They must be noted and described in the field notes, and clearly
marked on the field map.
1. The start of the day as month, date, and year, e.g., 7/24/80.
2. The end of the day.
3. The intersection of two SP lines.
4. The beginning of a new line.
5. The end of a line.
6. The meeting of any person of interest. If property boundaries are involved, sketch or
have the property owner sketch the property boundaries on the field map.

ZONGE ENGINEERING & RESEARCH SP FIELD PROCEDURES
August 18, 1983 Page 16
3.3.4 Designation of Reference Points
All reference points are designated by letters of the alphabet. They are labeled in sequence
beginning with A. If more than 26 letters are required, the 27th through 52nd are designated
AA-AZ, the 53rd through 78th are BA-BZ, etc. Each point so labeled is placed on four documents:
1 On the field map next to the reference symbol described in Appendix A while in the
field.
2 On the raw data sheet in the column marked "Map Reference Point" while in the field.
3. On the hotel map next to the reference symbol described in Appendix A.
4. On the profile at the appropriate location.
3.3.5 Recording of Reference Points
The explanation of a reference point is written on the data sheet in the section labeled
"Remarks". Do not try to fit all the comments in just this column. If more than a word or two is
necessary, use the horizontal lines of the data sheet as a "notebook". Make all comments legible,
and include all pertinent information. Illegible and uninterpretable field notes are the principal
problem with many surveys. Do not let your survey be ruined by bad field notes. The time used to
adequately document the survey is well spent. An undocumented survey is of no value to anyone.
3.4 Reconnaissance
Spend a morning or afternoon (four or five hours should be sufficient) driving around the
survey area to learn the "lay of the land". The most direct way to do this is to drive to the best
vantage point available, orient and study the map for awhile. Look for roads, vegetated areas,
houses, mine dump s, etc. (anything that might affect the survey). If major producers of cultural
noise are not already on the map, draw them in. This might include power substations, high
tension lines, new mines, etc. Look at the terrain with the highlighted SP lines in mind. Look for
alternate routes when the ones marked appear exceptionally difficult. While at your vantage point,
prepare a quick plan of attack as to which lines are to be done first, and which last. As a general
rule, the easier lines should be done first. This will help to establish a reasonable pace early in the
survey, and help define areas of most interest. When you have a good feeling for the area, drive
around to locate some of the roads and alternate routes. As was previously mentioned, four or five
hours is sufficient for this kind of reconnaissance. Do not get wanderlust and spend more time than
this. As the survey progresses, much more will be learned about the area.
ZONGE ENGINEERING & RESEARCH SP FIELD PROCEDURES
August 18, 1983 Page 17
3.5 Acquiring the Data
3.5.1 Survey Base Location
Move to the location of the proposed survey base. The survey base is the location to which all
measurements refer and will normally be located by the responsible geophysicist. The base may
be marked on the field map, given to the crew, or chosen during the reconnaissance of the prospect
at the beginning of the survey by the geophysicist. The survey base is chosen to:
1. Lie outside any area of known or suspected mineralization.
2. Be away from areas of cultural disturbances.
3. Be in an area not unduly subject to disturbance by animals or humans.
4. Be above the water table and away from areas where reducing (low Eh - high pH)
conditions, e.g. swamps, marshes, bogs, etc. might prevail.
Investigate the survey base location for obvious difficulties at this time. High tension lines
within 500 m, a buried gas pipeline with 500 m, and housing developments with associated
pipelines within 500 m are all examples of problems which may necessitate moving the survey base
location. The survey base may only be relocated with the prior knowledge and consent of the
responsible geophysicist. Once a suitable survey base has been found, the telluric monitor should
be deployed in the immediate vicinity.
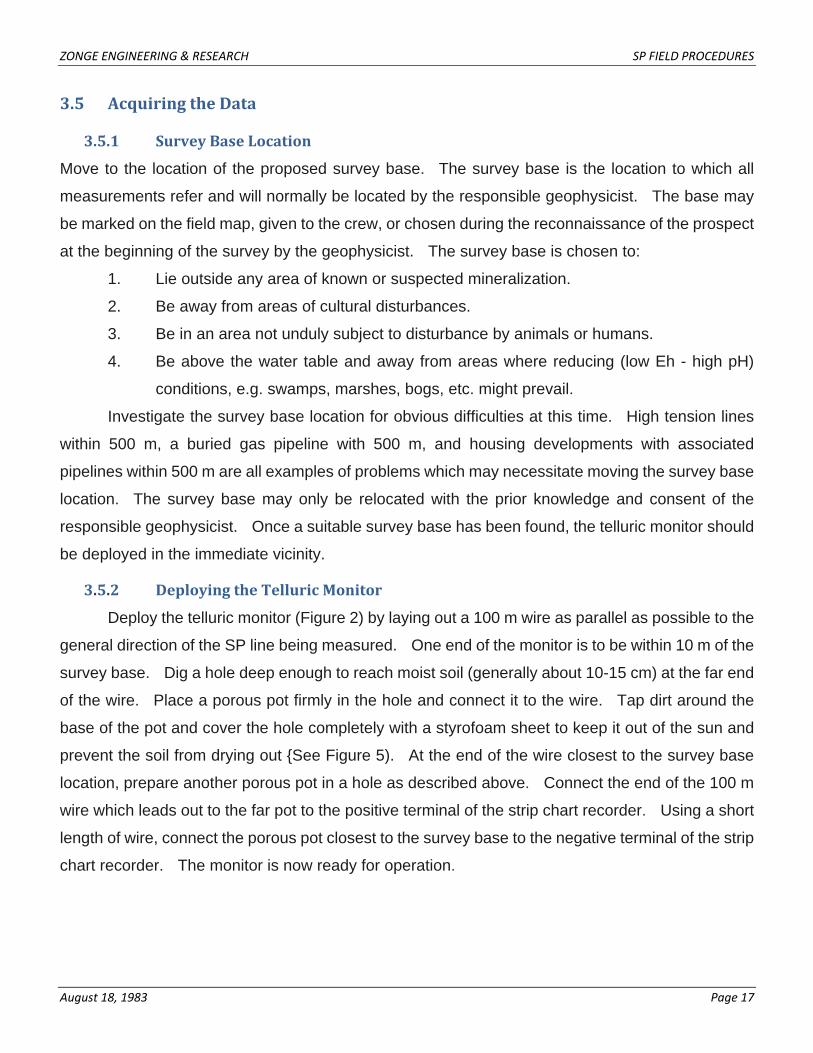
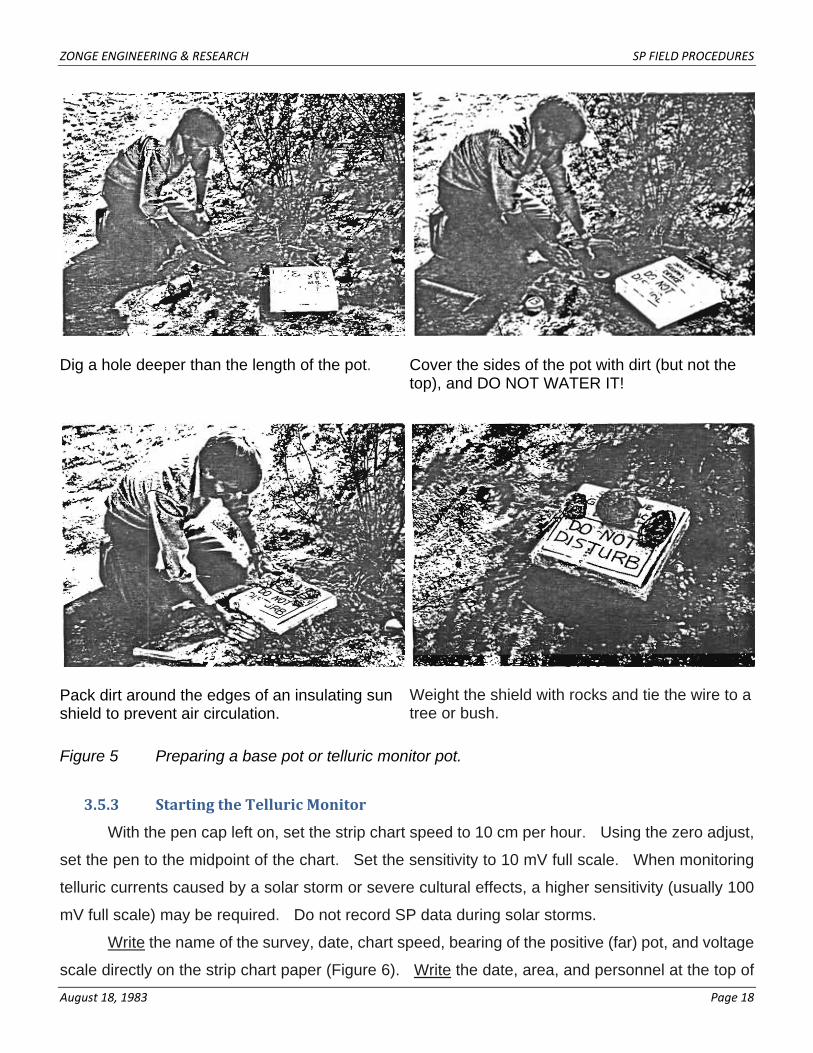
3.5.2 Deploying the Telluric Monitor
Deploy the telluric monitor (Figure 2) by laying out a 100 m wire as parallel as possible to the
general direction of the SP line being measured. One end of the monitor is to be within 10 m of the
survey base. Dig a hole deep enough to reach moist soil (generally about 10-15 cm) at the far end
of the wire. Place a porous pot firmly in the hole and connect it to the wire. Tap dirt around the
base of the pot and cover the hole completely with a styrofoam sheet to keep it out of the sun and
prevent the soil from drying out {See Figure 5). At the end of the wire closest to the survey base
location, prepare another porous pot in a hole as described above. Connect the end of the 100 m
wire which leads out to the far pot to the positive terminal of the strip chart recorder. Using a short
length of wire, connect the porous pot closest to the survey base to the negative terminal of the strip
chart recorder. The monitor is now ready for operation.
ZONGE ENGINEERING & RESEARCH SP FIELD PROCEDURES
August 18, 1983 Page 18
Dig a hole deeper than the length of the pot.
Cover the sides of the pot with dirt (but not the top), and DO NOT WATER IT!
Pack dirt around the edges of an insulating sun shield to prevent air circulation.
Weight the shield with rocks and tie the wire to a tree or bush.
Figure 5 Preparing a base pot or telluric monitor pot.
3.5.3 Starting the Telluric Monitor
With the pen cap left on, set the strip chart speed to 10 cm per hour. Using the zero adjust,
set the pen to the midpoint of the chart. Set the sensitivity to 10 mV full scale. When monitoring
telluric currents caused by a solar storm or severe cultural effects, a higher sensitivity (usually 100
mV full scale) may be required. Do not record SP data during solar storms.
Write the name of the survey, date, chart speed, bearing of the positive (far) pot, and voltage
scale directly on the strip chart paper (Figure 6). Write the date, area, and personnel at the top of
ZONGE ENGINEERING & RESEARCH SP FIELD PROCEDURES
August 18, 1983 Page 19
the data sheet. Mark the full scale voltage and the drive speed of the telluric monitor at the top of
the data sheet as illustrated in Figure 3. Errors on the data sheet should be crossed out with a
single line only. Always use black ball point pen to write on the data sheet (assume the data sheet
will get wet). Sketch the location and orientation of the telluric monitor line on the field map using
the symbols described in Appendix A. On the field map also give the month, date, and year of the
station occupation. Begin monitoring by removing the pen cap. Make sure the drive is operating
and the paper is smoothly engaged in the chart drive cogs and that the pen is marking the paper
correctly.
Mark the time directly on the strip chart paper (see Figure 6). A tick mark for the time is
made by deflecting the voltage-"zero" switch on the front of the recorder. Whenever you return to
the monitor, put another time mark and the voltage information on the strip chart as just described.
When a line is completed, mark the time again. Remember, the records are useless if the data are
not properly recorded.
It may become necessary to change voltage scales during the course of the day. All
changes must be carefully annotated directly on the chart record at the time they are made.
Problems with the recorder such as a stuck drive, pen out of ink, etc., should be recorded both on
the strip chart and the data sheet. Mark a reference point on the strip chart paper (Figure 6) and in
the "Map Reference" column of the data sheet (Figure 3 and Appendix A). Refer to Section 3.3 for
the "Use of Reference Points."
Watch the telluric monitor for five minutes. If the voltage on the chart record is steady, the
location of the survey base is good and the survey may begin. Proceed to measure the pot drift
voltage.
If the voltage is not steady, with greater than +/- 2 mV of drift, there may be a cultural source
of time-varying currents in the area necessitating the relocation of the survey base. If cultural
interference is encountered, the responsible geophysicist should be requested to pick an alternate
location for the survey base, preferably as far away as practicable from the area of the suspected
cultural disturbance. Re-deploy the telluric monitor at the new base. If the voltage is steady at the
alternate location, proceed to measure the pot drift voltage.
ZONGE ENGINEERING & RESEARCH SP FIELD PROCEDURES
August 18, 1983 Page 20
Occasionally the telluric monitor indicates electrical noise throughout the survey area. The
noise may be caused by a very large cultural power producer or user in the area, or by natural
telluric currents. If a source of cultural noise is not immediately evident, it is often useful to leave
the telluric monitor out overnight. If the noise persists overnight, the source is cultural. If the noise
declines or dies out during the night, it is due to solar activity and will most probably disappear within
a few days. If the noise source proves to be cultural in origin, contact the responsible geophysicist
immediately. If the noise is telluric in origin, continue to deploy the telluric monitor on a daily basis
until quieter conditions prevail. Continue to deploy the monitor with every line for at least one day
Figure 6 The telluric monitor strip chart. This is an illustration of what a typical strip chart
record should look like. The base designation given to a strip chart record is thesame as that given to the nearest base station.
ZONGE ENGINEERING & RESEARCH SP FIELD PROCEDURES
August 18, 1983 Page 21
following the cessation of telluric activity. The maximum telluric noise which can be tolerated is
specified in Appendix E.
After establishing the survey base, the telluric monitor need only be deployed when cultural
or telluric activity is encountered. Electrical interference during a survey line will be evident by an
unstable voltage reading at a station.
3.5.4 Measure the Drift Voltage
Immediately before and after each line, check the drift voltage between the roving pot and the
base pot. To do this, place both pots in the porous pot bath. While keeping the pot and the interior
of the bath out of the sun, connect the base pot to the negative terminal of the digital voltmeter
(DVM), and the roving pot to the positive terminal. Measure the voltage that exists between the
pots. This voltage is called the drift voltage and should be less than +/-5 mV. If greater than +/- 5
mV is measured, use a different pair of pots which have been filled with copper sulfate crystals and
water and left in the bath for at least 12 hours. If this procedure does not reduce the drift voltage to
less than 5 mV, mix the copper sulfate solutions of the roving and base pots together and clean the
ceramic bases. The pots and the bath used for the survey must contain undissolved copper sulfate
crystals to insure the solution is saturated.
3.5.5 Plant the Base Pot
While keeping the bath shaded, remove the base pot (the pot with the large base) and dry the
terminal post. Place the base pot in a hole sufficiently deep that moist soil is reached and the entire
pot is below ground level, but well above the water table, i.e., no water should trickle into the hole.
Push dirt around the sides of the pot to hold it securely in the bottom of the hole. Do not allow the
copper post on the top of the pot to contact dirt from the side of the hole, and be sure the copper
sulfate bath solution has been dried off from the contact post as it may cause spurious contact
potentials. Do not expose the pot to sunlight at any time. Connect the free end of the wire from
the wire reel to the base pot. Cover the pot with a styrofoam sheet. Weight the styrofoam sheet
with a rock and cover the edge with dirt to prevent air circulation. In this fashion, the base pot is
reasonably isolated from temperature changes, photoelectric effects, and drying of the ground
around the base pot while the line is being run (see Figure 5).
Record the base pot location and reference point on the map using the appropriate symbol
(Appendix A), and in the "Map Reference" column of the data sheet (Figure 4) together with the
month, date, and year on the field map. Be specific, complete, and accurate in your location
description.
ZONGE ENGINEERING & RESEARCH SP FIELD PROCEDURES
August 18, 1983 Page 22
Tie the wire around a tree or large rock to prevent the base pot from being pulled loose by
cars, animals, or as the wire is being unreeled.
After tying the wire, weight it down so that it lies as flat on the ground as possible. This is to
minimize the possibility of automobiles or animals catching the wire and breaking it.
On driving lines, mount the wire reel in the back of the vehicle so that it may be unreeled as
the vehicle drives down the road (Figure 7). The reel should be placed so that it is securely
fastened and need not be moved for the duration of the survey. For walking lines, the breast reel
should be carried in the most comfortable and convenient manner (see Figure 14). Make sure
sufficient spares are taken at this time; i.e., extra banana plugs, voltmeter lead wires, shrink tubing,
matches or lighter, electrical tape, flagging tape, spare pen, etc., so that the survey may be
continued in spite of Murphy.
3.5.6 Measurement Station Locations
Begin unreeling the wire by driving or walking to the first measurement station. The operator
monitors the wire as it is being unreeled and watches for the distance marks. Stations are normally
taken every 200 m when exploring for porphyry sulfides. However, in areas where the potential
relative to the survey base is lower than -100 mV, stations must be occupied every 100 m.
Figure 7 Equipment set-up in vehicle for driving lines.
ZONGE ENGINEERING & RESEARCH SP FIELD PROCEDURES
August 18, 1983 Page 23
The minimum sampling interval for any survey can be determined using the Nyquist sampling
theorem. If the expected target is one kilometer across, then stations must be taken at least every
0.5 km to define the anomaly, i.e. the maximum station interval is equal to one-half the target width.
In theory, if the target is a 10 m wide dike, then the station interval should be 5 m. In practice,
however, the SP anomaly will be larger than the causative body so that for a 10 m mineralized dike
the SP anomaly will probably be approximately 20 m across. In this case, a station interval of 10 m
would suffice for reconnaissance, though a smaller sampling interval would be desirable when
doing a detailed survey of the anomaly. The time, and hence the cost, of any SP survey is critically
dependent on the station interval. Use the largest practical station interval as indicated by prior
experience even though this station interval may violate the Nyquist sampling theorem. On the
other extreme, it is seldom practical to use a station interval greater than 200 m due to risks of
broken wire, target size, and other operational problems which usually make it advisable to stop
every 200 m and take a reading.
At the measurement station, place the roving pot in the most conductive ground within 10 m
of the distance mark on the wire. Dry off the terminal post when the roving pot is removed from the
bath. Dig a hole sufficiently deep to reach moist soil. Insert the pot by pressing it downward and
twisting. Make sure it is kept in the shade at all times (Figure 8). Do not water the pots at any
time. Do not touch the copper post on the top of the electrode with the hand while making a voltage
reading since this changes the impedance of the circuit and affects the voltage reading on the DVM
by producing spurious potentials.
3.5.7 Resistance Measurement
Measure the resistance between the base and roving pots with the DVM. The resistance
should be less than 50 kilohms. If it is not, deepen the roving pot hole, replant the pot, and
measure the resistance again. If that fails to reduce the resistance to below 50 kilohms, relocate
the hole and try again. Place the pot in the most conductive of the holes tried. Record the
resistance value on the data sheet. Do not make lengthy resistance measurements because they
may polarize the two electrodes. In areas of very high negative SP, the resistance measured with
normal polarity will commonly be negative. If this is the case, read the resistance both with normal
polarity and reversed polarity and record both values with the normal polarity value above the
reversed.
ZONGE ENGINEERING & RESEARCH SP FIELD PROCEDURES
August 18, 1983 Page 24
3.5.8 Normal Polarity Voltage Measurement
NORMAL VOLTAGE. Measure the voltage between the base and roving pots with normal
polarity. The normal polarity is defined to be the base pot wire attached to the negative terminal of
the DVM, and the roving pot connected to the positive terminal. Record this measurement in the
"Normal Voltage" column with the sign explicitly given, i.e., +150, not just 150.
TIME. Record the time of the normal polarity measurement in Column 1 of the data sheet.
Use 24 hour local time (e.g., 0000 to 2359 hours).
3.5.9 Reverse Polarity Voltage Measurement
Reverse the polarity of the input leads at the DVM (i.e., base pot to positive lead, roving pot to
negative lead) and take another measurement. Record the reverse polarity measurement in the
proper column on the data sheet. If the normal and reverse polarities do not agree to within 5 mV,
something is wrong and must be corrected. The most likely cause is a broken wire. Recheck the
resistance with the polarity reversed. Check the wire connections to make sure they are secure.
If it is suspected that the wire is broken, follow the procedure given in Appendix B. If a broken wire
is not the problem, try the other DVM. If one DVM is bad, continue the survey with the good
instrument and have the bad one repaired or replaced as soon as possible.
Figure 8 Keep the roving pot in the shade. This avoids photochemical potentials and helps tominimize temperature variations.
ZONGE ENGINEERING & RESEARCH SP FIELD PROCEDURES
August 18, 1983 Page 25
Another cause of non-repeatability is telluric activity, and such activity will be evident on the
telluric monitor if it is deployed. If it is not deployed, telluric activity may manifest itself as a varying
voltage on the DVM, although caution should be exercised since a broken wire or leaky insulation
may give the same sort of drift.
REMARKS. Record pertinent remarks and mark a reference point where necessary.
Always record any topographic or cultural features observed, i.e., saddles, stream crossings,
culverts, power lines, etc. On driving lines, the driver should be especially alert for such features
and point them out to the operator, whose field of vision is somewhat limited within the vehicle. See
Section 3.3 for the "Use of Reference Points." An explanation for a reference point is mandatory.
When noisy data must be recorded, include under "Remarks" an estimate of the total variation in
voltage (for example. +/- 20 mV). It is impossible to make too many remarks. The first time you try
to locate a point used by a previous survey crew, you will find out why.
Record the estimated station location on the field map. Mark the reference point
designation on the map if one is used. If the location coincides with, or is close to a topographic
expression visible on the map, be sure to note it in the "Remarks" column.
3.5.10 Clean the Roving Pot
After the voltage reading is completed, remove the porous pot from the shaded hole, fill the
hole with dirt, clean the pot base with a stiff bristled brush while keeping it in the shade, and place it
in the porous pot bath. This keeps the copper sulfate bath clean, reduces the drift, and minimizes
electrochemical reactions between different soil types as the survey moves along. Cover the
ceramic tips with a plastic cap if the pot bath is inaccessible (as on walking lines) to protect it and
keep it clean.
3.5.11 Move to the Next Station
Drive or walk to the next station, repeat the measurement station procedure, then move to
the next station until the line is completed. Flag at least every 1,000 meter station, or every 10th
station, with line number, distance, and date. These stations are to be re-occupied when picking
up the wire. Flagged holes should be annotated as flagged on the data sheet, and should be filled
in with dirt after completing the measurement to prevent the hole from drying out.
3.5.12 Establish a New Base
When the end of the wire is reached, and a line is to be continued, a new base should
normally be established in the same hole as the last measurement station on a line; however, a
ZONGE ENGINEERING & RESEARCH SP FIELD PROCEDURES
August 18, 1983 Page 26
base can be established in a flagged hole other than the last measurement station if conditions,
such as steep SP gradients, warrant. A hole where a new base is to be established should be
farther away from the road shoulder and in less rocky ground that the average roving pot hole, and
should be made deep enough to accommodate a base pot. It must also be above the water table
and away from marshy or swampy ground, bogs, old beaver dams, peat, streams, or any other
areas where reducing (low Eh - high pH) conditions might exist. A location on a hillside in sandy
loam is an ideal site, but may seldom be found. Do not put the base pot in road fill material, mine
tailings or dumps, earth dams, or other disturbed areas.
Since the error resulting from the establishment of new base stations is additive, the number
of base stations must be kept to an absolute minimum. Also, the accuracy of the normal voltage is
much more critical. For a hole in which a new base is eventually to be established, watch the drift
of the normal voltage measurement for at least two minutes. Write down the average voltage
under "Normal Voltage" on the data sheet. Follow the same procedure for the reversed polarity
reading. Estimate the amount of drift, if any, in the voltage measurement (+/-10 mV, for example)
and put this in the "Remarks" column. After the reading, fill in the hole to prevent it from drying out
and flag the hole so it will be easy to find later. In some areas, it is often advisable to hide a flag
behind a tree, or away from the trail to minimize removal by passers-by.
Base stations must not be established in areas of steep potential gradient, i.e., greater than
100 mV change per 100 meters, or in areas with noticeable time-varying fields due to cultural
activity. Ideally, each new base station should be in an area where the SP is close to background,
usually 0 +/- 50 mV. Occasionally, this will mean that the crew must back up several stations, or
splice on a second reel and continue forward, if telluric activity permits, to establish the best location
for the next base station. As stated before, the number of base stations must be kept to a minimum
since the errors inherent in establishing bases are additive. For this reason, the crew should make
each line a minimum of 4 to 5 km long and move the base pot only when absolutely necessary.
Often lines in several directions can be run from a single base. This should be done even when it
means spooling off a kilometer or more of wire before beginning the new line.
If a second reel of wire is available, it is often desirable to splice onto the first reel and
continue a line without establishing a new base. Do this if the telluric activity over a two minute
period at the last station of the line is less than +/- 25 mV. This tolerance should be rechecked
every kilometer as the line lengthens. When telluric conditions are quiet, lines as long as 10 km or
more may be run off the same base.
ZONGE ENGINEERING & RESEARCH SP FIELD PROCEDURES
August 18, 1983 Page 27
If cultural noise is present at the last station of a line, it is frequently possible to splice on the
second reel and move out of the area of cultural interference to establish the next base station. Of
course, if the continuation of the line moves toward the source of cultural interference instead of
away from it, such action may simply make the problem worse. However, this may serve to
pinpoint the source of cultural interference, if it is not obvious, and allow the crew to work around the
noise source on future lines. The field notes should contain liberal comments on what happened,
and what steps were taken to remedy the situation. If the area of cultural interference proves to be
so large that it interferes with the survey objectives, such as in the vicinity of a large operating mine
or power station, the responsible geophysicist should be consulted. Under no circumstances
should a base station be established in an area of known cultural interference.
3.5.13 Reel in the Wire and Reoccupy Stations
For driving lines, reel up the wire and re-occupy the stations at the one kilometer intervals
which were flagged on the way out. The roving pot for the re-occupation is placed in the same hole
used for the first potential reading at that location. After completing the reading, fill in the hole with
dirt again since the same hole may be used later when tying lines together.
Record the re-occupation resistance, time, and voltage exactly like any measurement
station.
Write the word "re-occupation" (or "reoc") in the "Remarks" column of the data sheet. A lack
of agreement between measurements (+/- 10 mV) is an indication that something is wrong. The
most likely causes for a station to drift are: 1) telluric activity; 2) cultural activity; 3) a broken wire; or
4) possibly electrode drift if the pots are exposed to sunlight or large temperature changes.
Telluric and cultural noise is usually AC and will appear as a voltage drift on the voltmeter.
When telluric or cultural activity is suspected, leave the wire reel at the last station, return to the
present base station, and deploy the telluric monitor, if it has not been deployed already. If long
period tellurics beyond the limits specified in Appendix E are indicated on the telluric monitor, delay
the survey until the telluric activity diminishes or ends. Continue to deploy the monitor with every
line for at least one day following the end of telluric activity in case of any unexpected renewal of
solar activity. Forecasts of solar activity are broadcast on WWV short wave radio stations.
If a wire break is suspected, follow the procedure given in Appendix B.
To reel in the wire for walking lines the procedure stated above for re-occupation is normally
used; however, a second procedure may be preferred in steep terrain when reeling wire up steep
slopes can be avoided. The alternate method is to establish a base at the end of the line with the
ZONGE ENGINEERING & RESEARCH SP FIELD PROCEDURES
August 18, 1983 Page 28
highest elevation. The line is then run predominantly down-slope to the lower elevation. When the
line is completed and tied to an existing line, install the roving pot in the same manner as a base pot
at the last station. Return to the base pot location. The base pot is then pulled out and the line is
reeled in down-slope as well as using the original base pot to do the 1 km re-occupations.
Generally, this alternate method should only be used in the steepest terrain.
Logistics for the alternate method involve letting the operator off as near as possible to the
top of the mountain and driving around for the pickup at the bottom. The operator is then shuttled
back up to the top where the drift measurement is performed and the reeling in of the wire is begun.
The driver goes back to the bottom for the final pick up.
If a third person is available and the crew is equipped with at least two walkie-talkies, the
shuttle trip is not required. The second person waits at the top while the operator goes down the
mountain. At the bottom the operator sets up the roving pot at the last station or a new base station
and then tells the second person by radio to remove the base pot and begin reeling in the wire. The
third person drives the vehicle down for the final pick up (See Appendix D, Walking Line Radio
Procedures).
3.5.14 Drift Voltage
After the last re-occupation, usually at 1 km, reel up the remaining wire, remove and clean the
base electrode, and measure the drift voltage in the manner previously described (see section
3.5.4).
Record the drift voltage in Column 6. Record the time, and in the "Remarks" column, note
the base where the drift measurement was made. Use a new line of the data sheet.
Electrode drift is another possible cause for a lack of agreement between measurements. If
an electrode is exposed to the sun, the incident ultraviolet rays and the increase in temperature will
cause a DC offset in the measurement. If pot drift exceeds the specifications in Appendix E, the
responsible geophysicist must be notified. Excessive pot drift is virtually always the result of
exposure to sunlight and large temperature changes. It is a prime responsibility of the field crew to
guard against this by keeping the pot in the shade at all times, and in the bath when not in use.
3.5.15 Field Data Reduction
Reverse the sign of the drift voltage measurements which were taken at the beginning and
the end of the line. Put this value in the "Drift Correction" column. Interpolate the drift correction
as a function of time between the beginning and the end of the line (see Figure 3. page 20 for an
example).
ZONGE ENGINEERING & RESEARCH SP FIELD PROCEDURES
August 18, 1983 Page 29
The absolute voltage of the base station used for the line is the base tie-in correction for the
line. Thus, for lines using the survey base where the absolute voltage is zero, the base tie-in
correction is zero.
For lines done using other bases, the base tie-in correction is the absolute voltage of the
appropriate base, which will be the absolute voltage of the last station on the previous line.
Compute the absolute voltage for any hole in which a new base is to be established by
adding the normal polarity voltage measurement for that hole to the base tie-in correction and drift
correction for that hole. The absolute voltage of the new base becomes the base tie-in correction
for any line using the new base.
3.5.16 Beginning a New Line
Repeat the procedure used to do the initial line given above. Make sure that the base pot is
placed in exactly the same hole as used for the final measurement station on the previous line. By
knowing the base tie-in correction for the new line, the operator will know when absolute voltages
are below -100 mV, requiring a change from 200 to 100 m station spacings.
At the end of each line, mark the last station recorded with a reference point on the map and
in the "Map Reference Point" column. Complete the data sheet by marking the line, e.g., line A-B,
at the top of the data sheet.
3.6 Replacing the Copper Sulfate Solution
3.6.1 When to Change Solution
This chore is necessary when greater than 5 mV of drift between pots is observed in the field.
While the porous pots themselves will rarely require cleaning, it will be necessary to clean out the
bath about once a month due to dirt buildup.
3.6.2 Cleaning
To clean the porous pots, pour out the solution and wash the pots with water. Distilled water
is preferred, but not essential except in areas where the water is foul to the taste, or is excessively
chlorinated. Clean the ceramic bases thoroughly with a stiff bristled brush and rinse thoroughly
and replace the tips if they are excessively worn. Remove any corrosion from the copper rods with
emery paper. Fill the pot about one-third full with copper sulfate crystals and fill the remainder with
water, leaving approximately a 1/2 inch air gap between the cover and the top of the solution.
When replacing the porous pot solution, always change the porous pot bath solution at the same
time.
ZONGE ENGINEERING & RESEARCH SP FIELD PROCEDURES
August 18, 1983 Page 30
After cleaning out accumulated dirt from the pot bath, pour about two inches of water into the
bottom of the bath and add enough copper sulfate crystals to saturate the solution. It is important
that this chore be performed in the afternoon as soon as the crew returns from the field. The
solution must be allowed to stabilize as long as possible (minimum 12 hours) before data acquisition
begins. After the solution has stabilized, the bottom of the bath must still have undissolved crystals
to insure the solution is saturated. If more copper sulfate crystals must be added, wait an additional
12 hours for the solution to stabilize. Spending the effort to prepare the bath right the first time will
save considerably more time later.
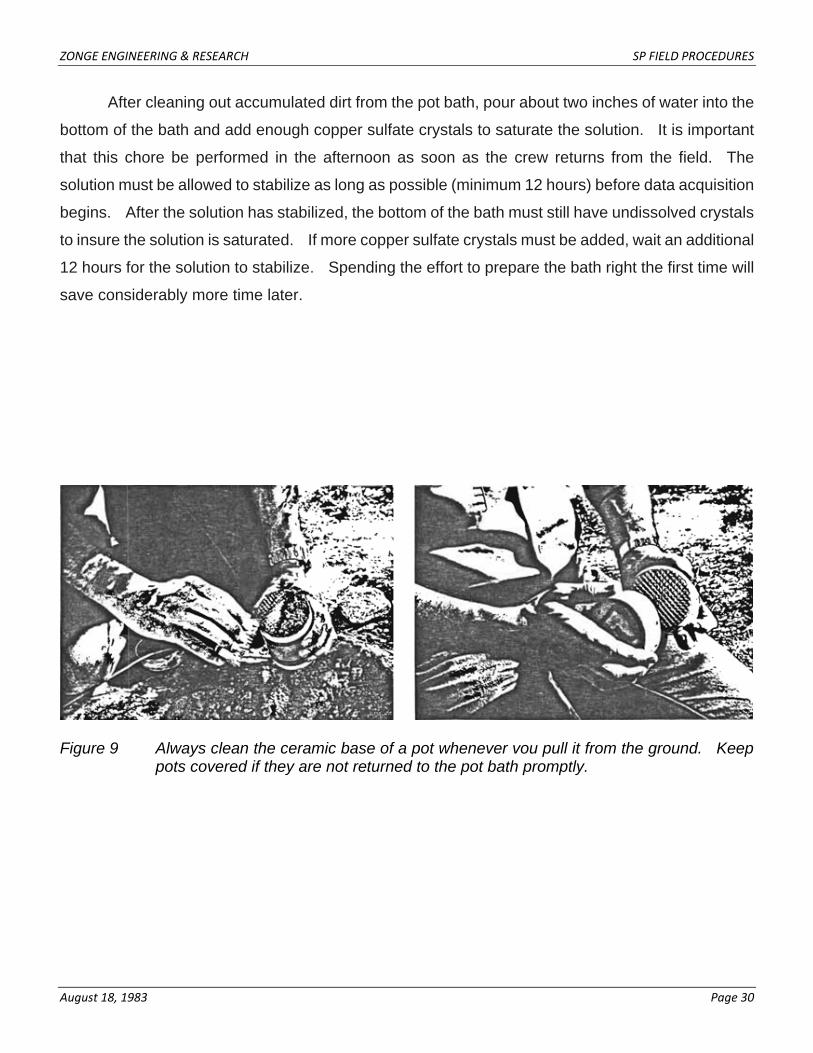
Figure 9 Always clean the ceramic base of a pot whenever vou pull it from the ground. Keep
pots covered if they are not returned to the pot bath promptly.
ZONGE ENGINEERING & RESEARCH SP FIELD PROCEDURES
August 18, 1983 Page 31
4 DATA REDUCTION
4.1 Absolute Voltage Relative to the Survey Base
To obtain the absolute voltage of a station relative to the survey base there are two
corrections: the drift correction, and the base tie-in correction.
4.1.1 Drift correction
To determine the drift correction, reverse the sign of the drift voltage measurements which
were taken at the beginning and the end of the line. Put these values in the "Drift Correction"
column, then interpolate as a function of time between the beginning and the end of the line. Most
scientific calculators make such interpolation a simple matter.
4.1.2 Base tiein correction
The base tie-in correction is the absolute voltage of the base from which a line is run. This is
the value that must be added to the entire line to refer the voltage to the survey base. The base
tie-in correction for lines run off the survey base is, by definition, zero. All other lines will most likely
have a non-zero tie-in correction. The tie-in correction is determined by finding the drift-corrected
absolute voltage of the last station of the previous line. Since this station is normally used as the
base station of the current line the absolute voltage of the new base station is known.
Absolute voltage (Vabs) for any other station on a line is determined by adding the normal
voltage (Vnorm) at that station to the appropriate drift (Cdrift) and tie-in corrections (Cbase). A
completed data sheet on which these corrections have been made is shown on Figure 3
(Vabs
= Vnorm + Cdrift + Cbase).
4.2 Absolute Voltage From A Floating Base
4.2.1 Logistical Problems
Because of logistical problems, it may be necessary to plant a new base in a location for
which the absolute voltage is not known. However, somewhere the line must tie to a flagged hole
in which the absolute voltage has previously been determined. If the survey is to be extended
farther from the currently floating base, then the tie point on the existing line must be a previous
base station. In the event that no further lines are to be run from the floating base, then a tie to one
of the flagged 1 km re-occupation points on a previous survey line will suffice. Since it will not
generally be known in advance whether or not the line will be extended, it is good field practice to
always tie the line to a previous base station.
ZONGE ENGINEERING & RESEARCH SP FIELD PROCEDURES
August 18, 1983 Page 32
4.2.2 Conversion
To convert the normal polarity measurements to absolute voltages for this case, a "floating"
base calculation is used. The principle is the same, but the procedure is slightly different. First,
obtain the interpolated drift correction the same way as before. Second, for the tie point where the
absolute voltage has previously been determined, put this value in the "Absolute Voltage (mV)"
column. The base tie-in correction (Cbase) for the line is now determined algebraically by
subtracting the normal voltage (Vnorm) and the interpolated drift correction (Cdrift) from the previously
determined absolute voltage at the known base station (Vbase) (Cbase = Vbase – Vnorm – Cdrift). The
base tie-in correction calculated in this manner applies to the entire line and is also by definition the
absolute voltage of the "floating" base. Absolute voltages (Vabs) for the entire line are calculated as
before, by adding the normal voltages (Vnorm) to the base tie-in (Cbase) and the drift corrections. A
complete data sheet in which this correction has been performed is shown on Figure 10.
(Cdrift) (Vabs = Vnorm + Cbase + Cdrift).
4.2.3 When To Use
A floating base should be used only as a last resort since it is impossible to know if the
floating base is in a region of steep gradients, or when the absolute voltage goes below -100 mV
(which requires going from 200 to 100 m spacings along the lines). Generally, if a floating base is
required, the first 500 m, at least, should be run at 100 m spacing for these reasons. The tie point
to a previous line must be outside an area of steep gradients, and the other precautions for
establishing a base station should be carefully observed when using a floating base.
4.3 Loops
4.3.1 Test of Measurement Error
As a test of measurement error caused from using several bases along a long line, it is
desirable to create a loop of SP lines to check the voltage error around the loop. When closing a
loop by occupying a point from two or more different bases that are already tied together along the
back side of the loop, the absolute voltage at the point should be the same referenced to all base
stations in the loop. Voltage errors when tying loops should be less than 50 mV. When small
anomalies are encountered closure of loops is especially important as a check that an anomaly
actually exists.

ZONGE ENGINEERING & RESEARCH SP FIELD PROCEDURES
August 18, 1983 Page 33
Figure 10 A completed data sheet using a "floating" base. Note the different base tie-in
corrections used for the data stations and the re-occupation points.
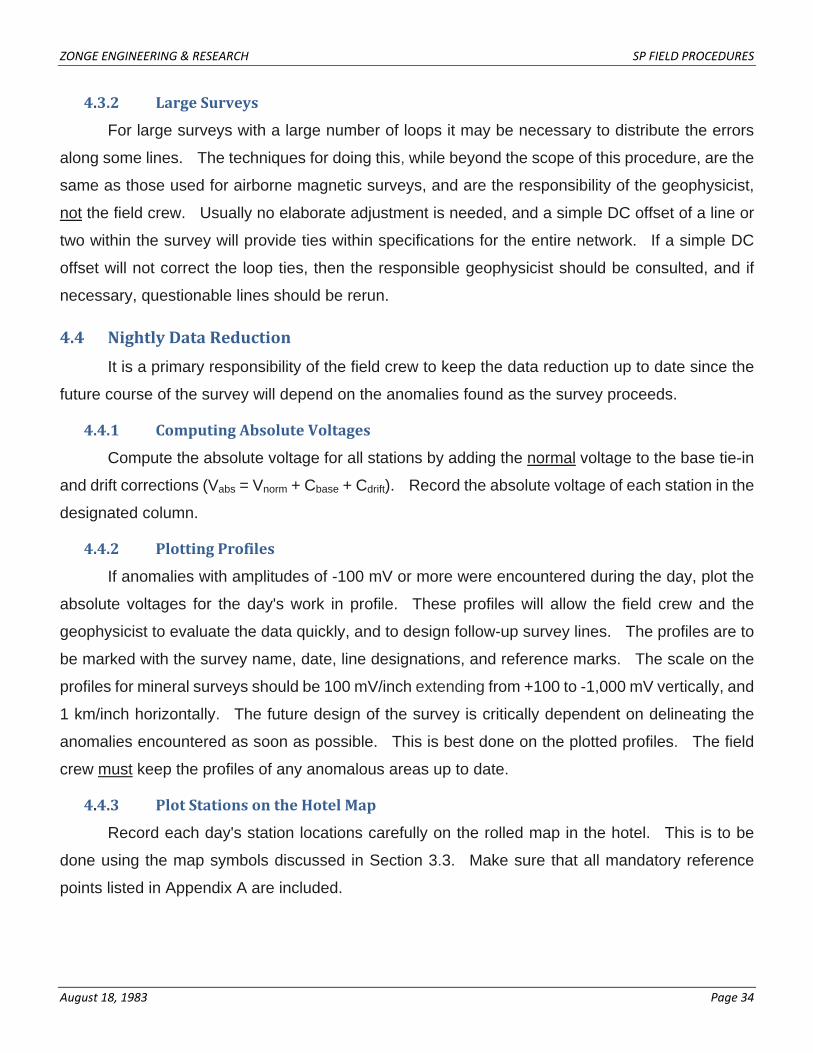
ZONGE ENGINEERING & RESEARCH SP FIELD PROCEDURES
August 18, 1983 Page 34
4.3.2 Large Surveys
For large surveys with a large number of loops it may be necessary to distribute the errors
along some lines. The techniques for doing this, while beyond the scope of this procedure, are the
same as those used for airborne magnetic surveys, and are the responsibility of the geophysicist,
not the field crew. Usually no elaborate adjustment is needed, and a simple DC offset of a line or
two within the survey will provide ties within specifications for the entire network. If a simple DC
offset will not correct the loop ties, then the responsible geophysicist should be consulted, and if
necessary, questionable lines should be rerun.
4.4 Nightly Data Reduction
It is a primary responsibility of the field crew to keep the data reduction up to date since the
future course of the survey will depend on the anomalies found as the survey proceeds.
4.4.1 Computing Absolute Voltages
Compute the absolute voltage for all stations by adding the normal voltage to the base tie-in
and drift corrections (Vabs = Vnorm + Cbase + Cdrift). Record the absolute voltage of each station in the
designated column.
4.4.2 Plotting Profiles
If anomalies with amplitudes of -100 mV or more were encountered during the day, plot the
absolute voltages for the day's work in profile. These profiles will allow the field crew and the
geophysicist to evaluate the data quickly, and to design follow-up survey lines. The profiles are to
be marked with the survey name, date, line designations, and reference marks. The scale on the
profiles for mineral surveys should be 100 mV/inch extending from +100 to -1,000 mV vertically, and
1 km/inch horizontally. The future design of the survey is critically dependent on delineating the
anomalies encountered as soon as possible. This is best done on the plotted profiles. The field
crew must keep the profiles of any anomalous areas up to date.
4.4.3 Plot Stations on the Hotel Map
Record each day's station locations carefully on the rolled map in the hotel. This is to be
done using the map symbols discussed in Section 3.3. Make sure that all mandatory reference
points listed in Appendix A are included.
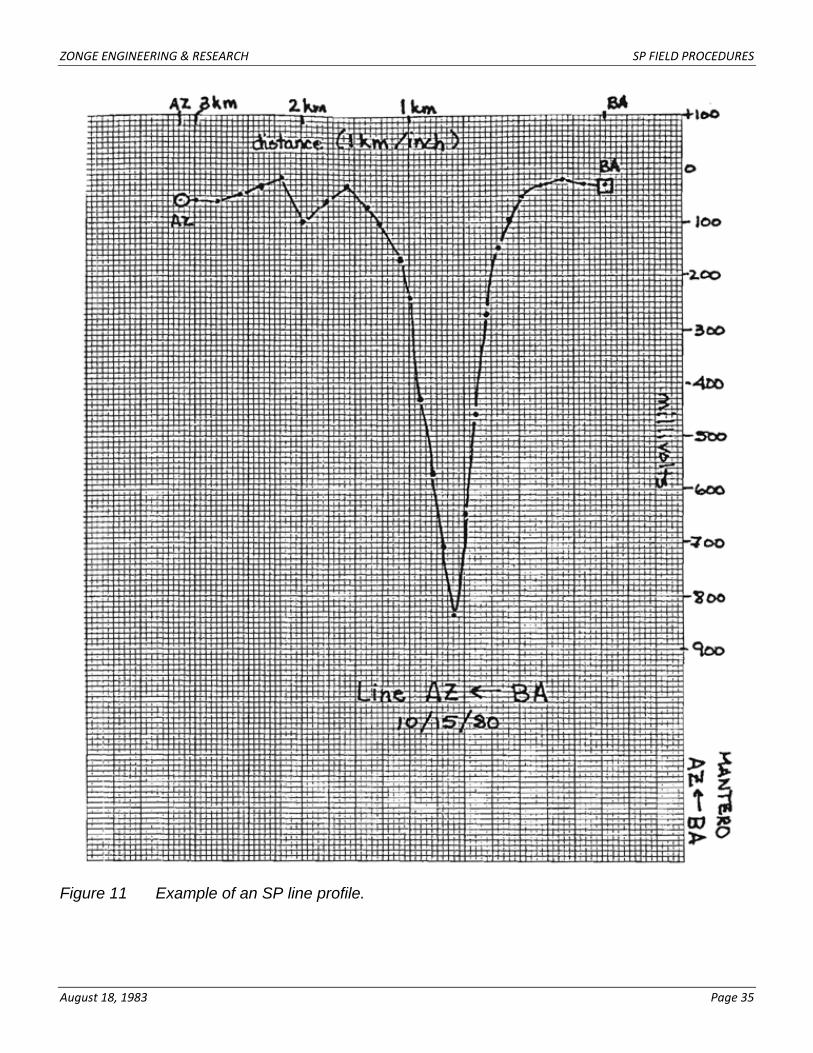
ZONGE ENGINEERING & RESEARCH SP FIELD PROCEDURES
August 18, 1983 Page 35
Figure 11 Example of an SP line profile.
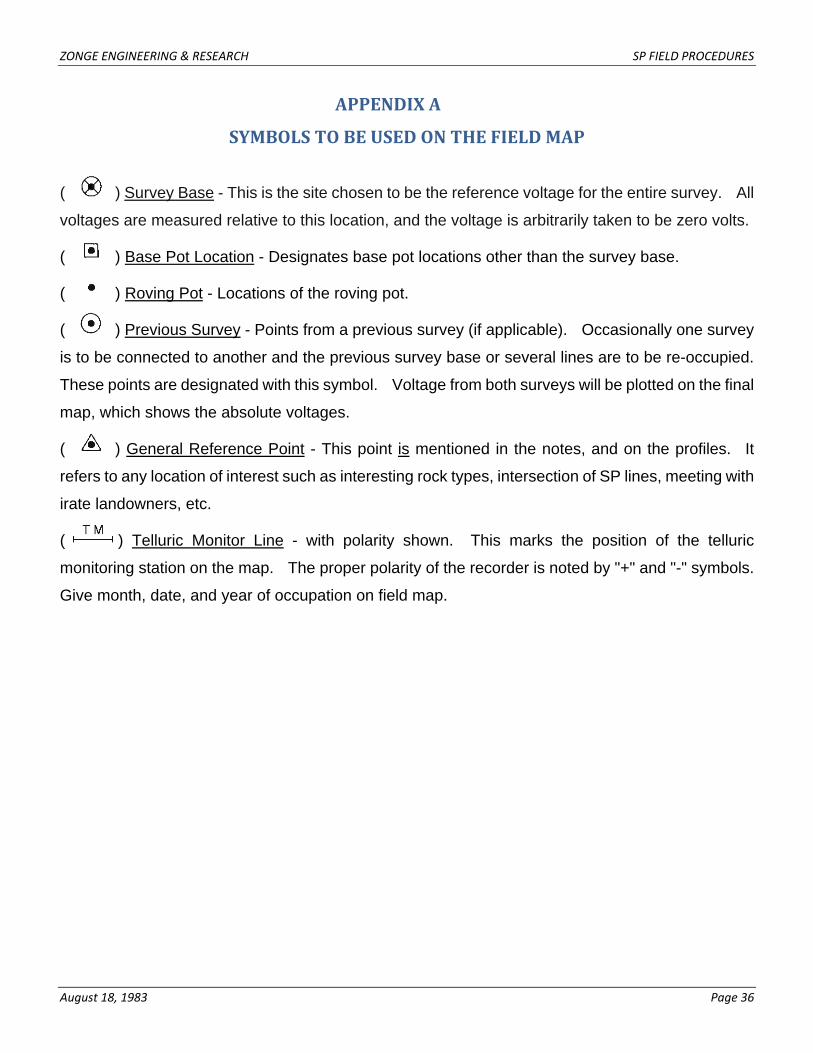
ZONGE ENGINEERING & RESEARCH SP FIELD PROCEDURES
August 18, 1983 Page 36
APPENDIX A
SYMBOLS TO BE USED ON THE FIELD MAP
( ) Survey Base - This is the site chosen to be the reference voltage for the entire survey. All
voltages are measured relative to this location, and the voltage is arbitrarily taken to be zero volts.
( ) Base Pot Location - Designates base pot locations other than the survey base.
( ) Roving Pot - Locations of the roving pot.
( ) Previous Survey - Points from a previous survey (if applicable). Occasionally one survey
is to be connected to another and the previous survey base or several lines are to be re-occupied.
These points are designated with this symbol. Voltage from both surveys will be plotted on the final
map, which shows the absolute voltages.
( ) General Reference Point - This point is mentioned in the notes, and on the profiles. It
refers to any location of interest such as interesting rock types, intersection of SP lines, meeting with
irate landowners, etc.
( ) Telluric Monitor Line - with polarity shown. This marks the position of the telluric
monitoring station on the map. The proper polarity of the recorder is noted by "+" and "-" symbols.
Give month, date, and year of occupation on field map.
ZONGE ENGINEERING & RESEARCH SP FIELD PROCEDURES
August 18, 1983 Page 37
APPENDIX B
TROUBLESHOOTING WIRE BREAKAGE
Wire breakage is a common mechanical problem associated with SP surveys. Wire breaks
are generally discovered when the voltage readings are unstable, and when an infinite or very high
resistance is measured between the base and roving pot. However, a number of other problems
cause symptoms similar to a broken wire, and these should be tested first. When an infinite or very
high resistance reading is observed which cannot be corrected by relocating the roving pot, first
check that the banana plug is securely in the reel. Often this is the only problem. If the plug is in,
check the leads from the voltmeter. Sometimes the connection between the banana plug and the
voltmeter lead wire will open circuit. Sometimes the problem is in the polarity-reversing switchbox.
These problems may be quickly diagnosed by measuring the resistance of the meter leads with the
tip of the banana plug shorted to the copper post of the roving electrode. Infinite resistance in this
circuit is an indication that the problem is in the meter leads, and not in the wire.
If the problem is not in the meter leads, then some other part of the circuit is open. Infinite
resistance may mean a separation of the wire from its connection with the female banana plug on
the inside of the reel, although this is rare. To diagnose this problem, slit the insulation in the wire
just where it comes off the reel and measure the resistance of the circuit between the female banana
plug on the inside of the reel and the wire where it has been slit (Figure 13). Infinite resistance for
this circuit means that the wire has probably separated from its connection to the female banana
plug on the inside of the reel. Solving this problem necessitates reeling the wire back up while
making voltage measurements, to the point where the break was diagnosed.
If the circuit on the inside of the reel is all right, and the meter leads test all right, then the
break must have occurred somewhere between where the wire comes off the reel and the base pot
location. Take the reel out of the vehicle, and drive back to the base pot, checking for breaks along
the way. If the base pot has been disturbed, or there is a simple break in the wire, it is often
possible to fix the circuit without having to reel in the wire. Sometimes the wire may be missing a
section (as much as 100 m or more). Every time the wire is broken by a vehicle, it must be checked
to ensure a segment is not missing. Missing segments must be replaced before the survey can
continue. This usually requires reeling the wire up to the point of the break, replacing the missing
segment, unreeling the wire back out to the last station, and continuing the survey.
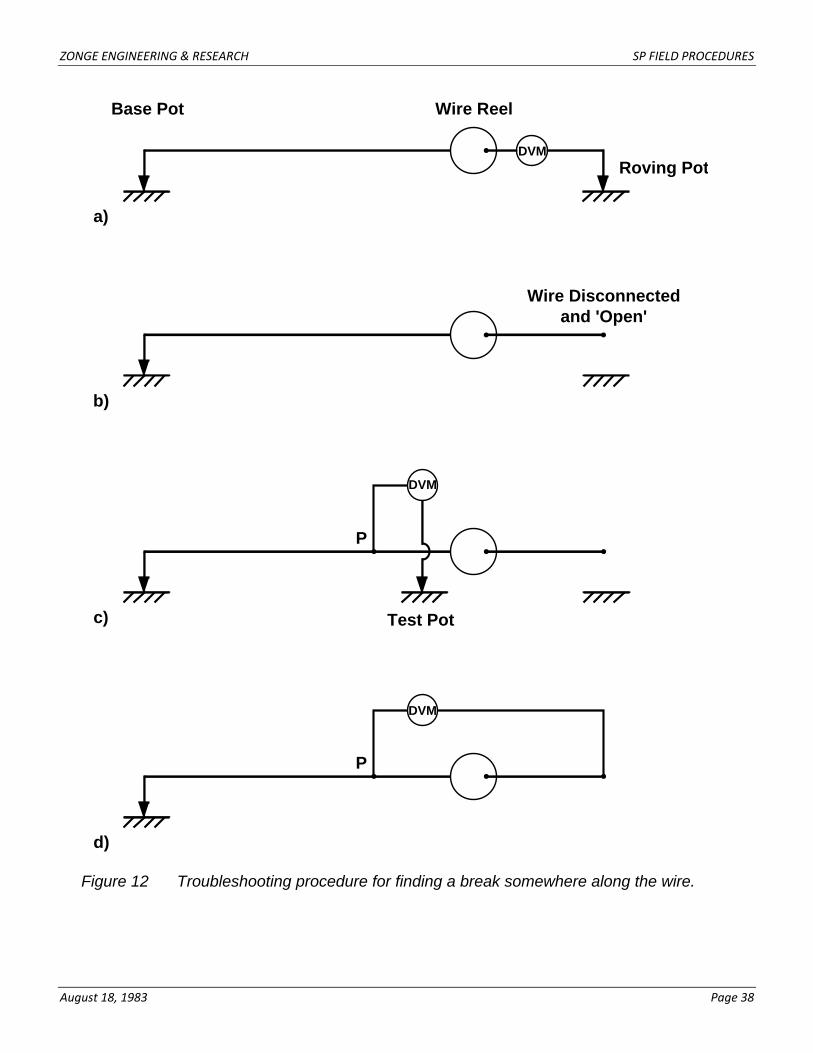
ZONGE ENGINEERING & RESEARCH SP FIELD PROCEDURES
August 18, 1983 Page 38
Figure 12 Troubleshooting procedure for finding a break somewhere along the wire.
a)
Base Pot Wire Reel
Roving PotDVM
b)
Wire Disconnectedand 'Open'
c) Test Pot
P
DVM
d)
P
DVM
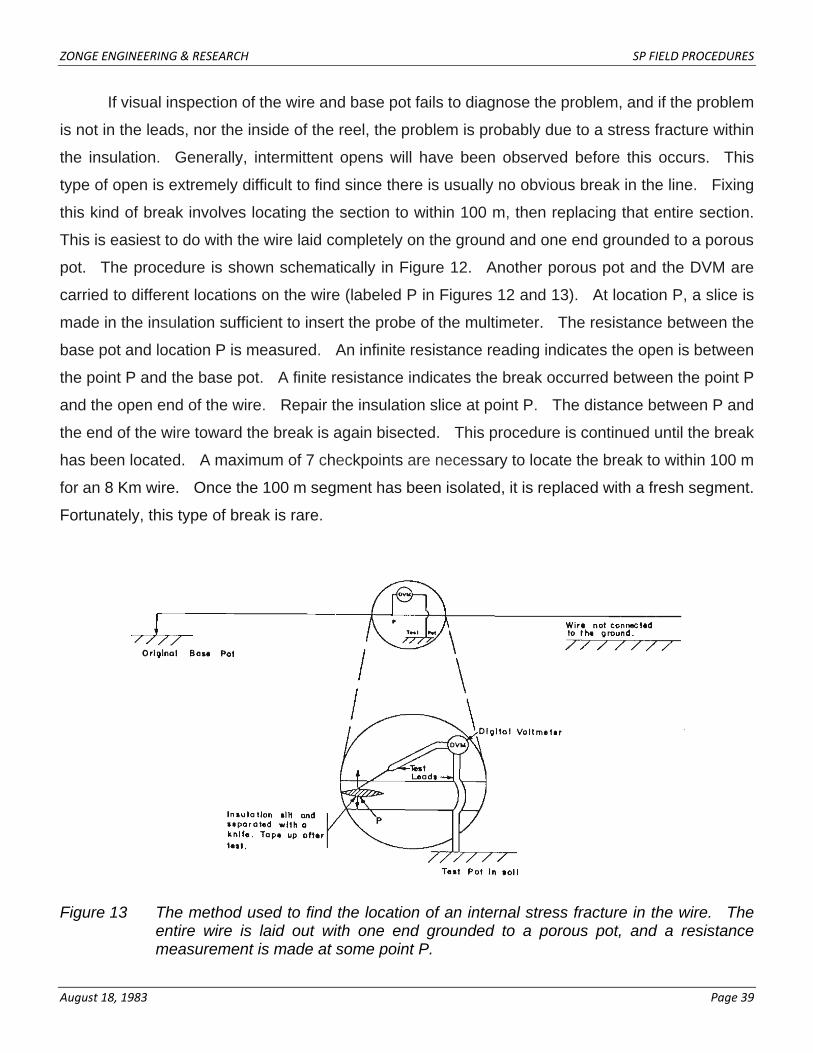
ZONGE ENGINEERING & RESEARCH SP FIELD PROCEDURES
August 18, 1983 Page 39
If visual inspection of the wire and base pot fails to diagnose the problem, and if the problem
is not in the leads, nor the inside of the reel, the problem is probably due to a stress fracture within
the insulation. Generally, intermittent opens will have been observed before this occurs. This
type of open is extremely difficult to find since there is usually no obvious break in the line. Fixing
this kind of break involves locating the section to within 100 m, then replacing that entire section.
This is easiest to do with the wire laid completely on the ground and one end grounded to a porous
pot. The procedure is shown schematically in Figure 12. Another porous pot and the DVM are
carried to different locations on the wire (labeled P in Figures 12 and 13). At location P, a slice is
made in the insulation sufficient to insert the probe of the multimeter. The resistance between the
base pot and location P is measured. An infinite resistance reading indicates the open is between
the point P and the base pot. A finite resistance indicates the break occurred between the point P
and the open end of the wire. Repair the insulation slice at point P. The distance between P and
the end of the wire toward the break is again bisected. This procedure is continued until the break
has been located. A maximum of 7 checkpoints are necessary to locate the break to within 100 m
for an 8 Km wire. Once the 100 m segment has been isolated, it is replaced with a fresh segment.
Fortunately, this type of break is rare.
Figure 13 The method used to find the location of an internal stress fracture in the wire. The
entire wire is laid out with one end grounded to a porous pot, and a resistancemeasurement is made at some point P.
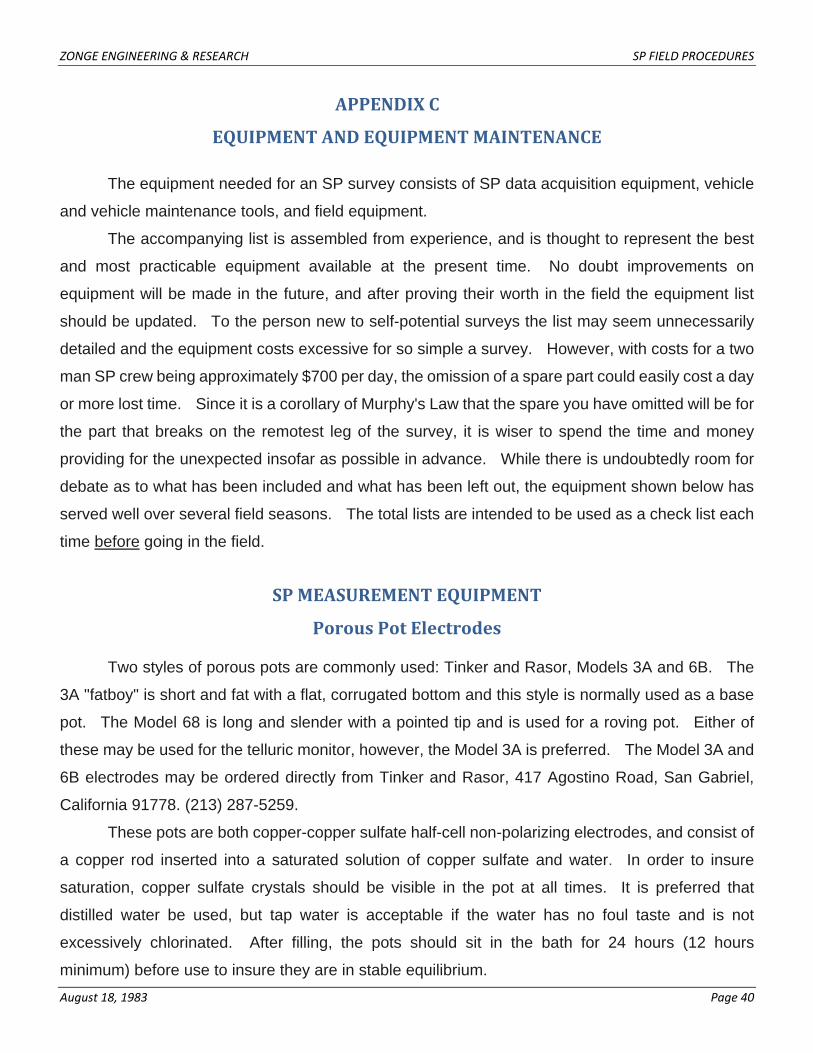
ZONGE ENGINEERING & RESEARCH SP FIELD PROCEDURES
August 18, 1983 Page 40
APPENDIX C
EQUIPMENT AND EQUIPMENT MAINTENANCE
The equipment needed for an SP survey consists of SP data acquisition equipment, vehicle
and vehicle maintenance tools, and field equipment.
The accompanying list is assembled from experience, and is thought to represent the best
and most practicable equipment available at the present time. No doubt improvements on
equipment will be made in the future, and after proving their worth in the field the equipment list
should be updated. To the person new to self-potential surveys the list may seem unnecessarily
detailed and the equipment costs excessive for so simple a survey. However, with costs for a two
man SP crew being approximately $700 per day, the omission of a spare part could easily cost a day
or more lost time. Since it is a corollary of Murphy's Law that the spare you have omitted will be for
the part that breaks on the remotest leg of the survey, it is wiser to spend the time and money
providing for the unexpected insofar as possible in advance. While there is undoubtedly room for
debate as to what has been included and what has been left out, the equipment shown below has
served well over several field seasons. The total lists are intended to be used as a check list each
time before going in the field.
SP MEASUREMENT EQUIPMENT
Porous Pot Electrodes
Two styles of porous pots are commonly used: Tinker and Rasor, Models 3A and 6B. The
3A "fatboy" is short and fat with a flat, corrugated bottom and this style is normally used as a base
pot. The Model 68 is long and slender with a pointed tip and is used for a roving pot. Either of
these may be used for the telluric monitor, however, the Model 3A is preferred. The Model 3A and
6B electrodes may be ordered directly from Tinker and Rasor, 417 Agostino Road, San Gabriel,
California 91778. (213) 287-5259.
These pots are both copper-copper sulfate half-cell non-polarizing electrodes, and consist of
a copper rod inserted into a saturated solution of copper sulfate and water. In order to insure
saturation, copper sulfate crystals should be visible in the pot at all times. It is preferred that
distilled water be used, but tap water is acceptable if the water has no foul taste and is not
excessively chlorinated. After filling, the pots should sit in the bath for 24 hours (12 hours
minimum) before use to insure they are in stable equilibrium.
ZONGE ENGINEERING & RESEARCH SP FIELD PROCEDURES
August 18, 1983 Page 41
Regular maintenance of the pots consists of brushing off the ceramic bases with a stiff nylon
bristled brush and changing the solution. The bases are to be brushed off whenever the pots are
pulled out of the ground. The copper sulfate solution is replaced whenever it appears cloudy or is
causing drift problems (>5 mV). The tips need to be replaced whenever they begin to leak, are
broken. or become excessively worn, and the copper rods should be kept free of corrosion. It is
good practice to have one or two spare tips submersed in the bath in order to minimize stabilization
time for a replacement tip.
Copper sulfate crystals, a stiff non-metallic brush, extra tips for both pot styles, and a
container with the bottom filled with copper sulfate solution for pot storage should all be carried with
the crew in the field. As the pot tips become worn, another set of pots should be prepared in
advance to replace the ones in use.
Porous Pot Bath
This is an insulated container with the bottom filled with open-cell foam saturated with copper
sulfate solution. It serves two functions: 1) to store the pots so that the ceramic bottom is immersed
and the copper sulfate will not crystallize out, and 2) as a temperature insulator for the roving pot
between data stations. A small cooler ("Playmate") works quite well. This is the bath in which drift
voltage is measured and all pots are stored when not being used. A wooden rack to hold the
electrodes upright in the bath should be constructed to fit the insulated container. A one-inch thick
foam padding immersed in the copper sulfate solution at the bottom of the bath will minimize tip
wear.
Figure 14 Porous pot electrodes and an insulated pot bath with wood rack in bottom to hold
electrodes. Foam padding placed under rack.
ZONGE ENGINEERING & RESEARCH SP FIELD PROCEDURES
August 18, 1983 Page 42
Porous Pot Tips
The ceramic bottoms of the porous pots are rugged and wear out infrequently, but extra tips
for both the base and roving pots are easy to carry and could save a lot of time in the event of
breakage. A couple of spare tips are normally kept in the copper sulfate bath to minimize the time
required for the pots to stabilize after changing tips. Spare tips can be ordered directly from Tinker
and Rasor.
Stiff Bristled Brush
The brush is used to clean the bottom of the porous pots before putting the pots back in the
copper sulfate bath. The bristles should not be made of metal which can rub off on the ceramic
bottom of the pot. A variety of these are sold at most supermarkets, usually for cleaning
vegetables.
Copper Sulfate Crystals
The copper sulfate solution of the porous pot bath needs to be replaced regularly. Low
grade copper sulfate is often sold in hardware stores as septic system root killer. Use this type only
when higher grades are unavailable and only for the porous pot bath. Ten pounds of crystals
(technical grade or better) should be sufficient to last a summer.
Wire
The wire commonly used for SP surveys may be obtained from Mark Products, 10507
Kinghurst Drive, Houston, Texas 77009, (713) 498-0600 or Zonge Engineering. For walking lines,
15 kilometers of #26 gauge stranded, single conductor, cadmium-bronze wire is required. The wire
should be marked in 100 m lengths on four of the Sharpe reels (3 kilometers each). The remaining
3 kilometers should be kept as a reserve. For driving lines 12 kilometers of #20 gauge, 7x6x36
stranded, single conductor, copper clad steel wire is required. Eight of the 12 kilometers is to be
marked every 100 m on two Zonge reels in 4 kilometer lengths, and the rest held in reserve.
The wire is marked every 100 m with cloth bookbinding tape ("Mystic" tape) folded over the
wire onto itself. Distances are marked directly on the tape in kilometers (1, 1.1, 1.2, etc.) with
indelible ink. Occasionally the tape will slip and markers should be repaired as soon as slippage is
noticed. Mystic bookbinding tape is widely available in supermarkets and drug stores.
ZONGE ENGINEERING & RESEARCH SP FIELD PROCEDURES
August 18, 1983 Page 43
Wire breaks are spliced using a wireman's splice and insulated with shrink tubing. All
abrasions through the insulation must be repaired with electrical tape as soon as noticed.
Wire Reels for Driving Lines
Three large wire reels with a minimum capacity of 4 km of #20 gauge wire are required for the
driving lines. The Zonge Engineering Portable Reel BR/12 which may be purchased from 3322
East Fort Lowell Road, Tucson, Arizona 85716, (520) 327-5501, serves the purpose quite well, and
is readily available.
Wire Reels for Walking Lines
Three small wire reels are required for walking lines. These reels should have detachable
spools. The Model GR-1000 reel is lightweight, rugged, and reliable. They may be purchased
from Edgar Sharpe and Associates. Ltd., 1983 Kipling Avenue North, Rexdale, Toronto, Ontario,
Canada, (416) 743-8144. In addition to the spools supplied when one orders the "GR-1000,
complete", two additional spools per reel are required.
Digital Voltmeter
Two Fluke 8020B DVM are required. They may be purchased from John Fluke
Manufacturing Company, P.O. Box 43210, Mount Lake, Terrance, Washington, 98043, (800)
426-0361 or their local distributor. This meter has a high input impedance (10 Megohms), and will
read from 0.1 mV to 1,000 volts. This DVM runs for approximately 200 hours on a single 9 volt
alkaline transistor battery. There is a low voltage indicator incorporated into the display to give
sufficient warning to replace the battery. The only maintenance required is battery replacement.
An extra battery should be carried for each DVM.
Scientific Calculator
A handheld calculator which includes most scientific functions and is quasi-programmable is
required. One of the more inexpensive, yet adequate models is the Texas Instruments TI-35
calculator. Many crews prefer the more expensive, though more flexible TI-59 programmable
calculator.
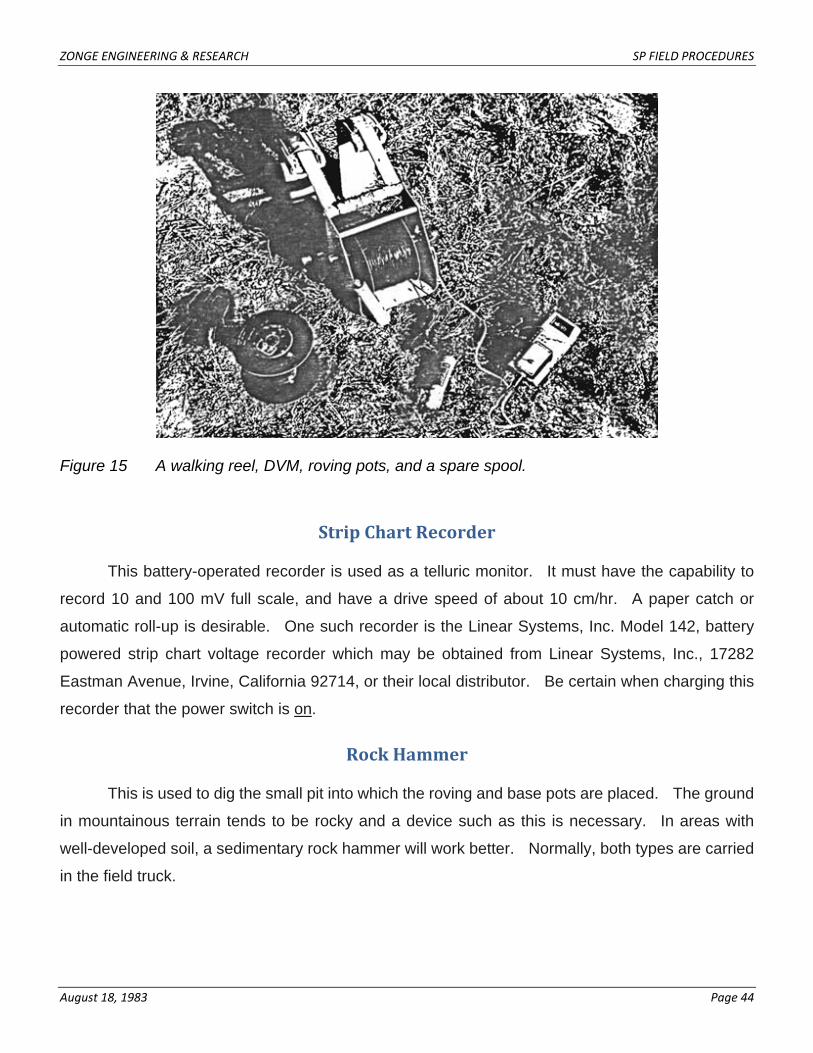
ZONGE ENGINEERING & RESEARCH SP FIELD PROCEDURES
August 18, 1983 Page 44
Strip Chart Recorder
This battery-operated recorder is used as a telluric monitor. It must have the capability to
record 10 and 100 mV full scale, and have a drive speed of about 10 cm/hr. A paper catch or
automatic roll-up is desirable. One such recorder is the Linear Systems, Inc. Model 142, battery
powered strip chart voltage recorder which may be obtained from Linear Systems, Inc., 17282
Eastman Avenue, Irvine, California 92714, or their local distributor. Be certain when charging this
recorder that the power switch is on.
Rock Hammer
This is used to dig the small pit into which the roving and base pots are placed. The ground
in mountainous terrain tends to be rocky and a device such as this is necessary. In areas with
well-developed soil, a sedimentary rock hammer will work better. Normally, both types are carried
in the field truck.
Figure 15 A walking reel, DVM, roving pots, and a spare spool.

ZONGE ENGINEERING & RESEARCH SP FIELD PROCEDURES
August 18, 1983 Page 45
Tools
The crew should have a basic set of tools for field repairs. A suggested list follows. Crews
should have a separate list of tools and spare parts located in the glove box of the vehicle. The
tools are to be checked by the crew before departing for the field.
Whenever an item needs replacement in the field, whether from the spares provided or
otherwise, a replacement should be ordered at once. If the breakage of equipment will hinder or
slow production, the responsible geophysicist should be notified at once. Be certain that the truck
spares are for the truck you are taking into the field, and that nuts and bolts for the vehicle are in the
same units (English or metric) as the field vehicle which will be used. If metric nuts and bolts are
used, add a set of metric tools to the following list.
SP FIELD EQUIPMENT (Minimum)
1 4-wheel drive heavy duty vehicle rigged to spool out and recover wire from the tail gate and equipped with a two-way radio.
4 Copper-copper sulfate half-cell electrodes (Tinker and Rasor, Model 3A)
5 Copper-copper sulfate half cell electrodes (Tinker and Rasor, Model 6B)
2 extra Ceramic tips for 3A electrodes
2 extra Ceramic tips for 6B electrodes
2 extra Nuts for electrodes
10 lbs Copper sulfate crystals (technical grade)
2 Digital Multimeters (Fluke. Model 8020A DVM)
2 extra Batteries for the Digital Multimeter
2 extra Fuses for the Digital Multimeter
15 km 26-gauge stranded cadmium bronze wire. single conductor, insulated
3 Walking line reels, complete (Edgar Sharpe Model GR-1000)
6 extra Spools for walking line reels (3 km marked wire per spool on 4 spools, 2 empty)
12 km 20-gauge 7x6x36 stranded copper clad steel wire, single conductor, insulated 4 km marked wired per spool
3 Driving line reels, Zonge Engineering Portable Reel BR/12 (4 km marked wire per spool on 2 reels, 1 empty)
2 "Playmate" coolers for the strip chart recorder and porous pot bath
3 Stiff bristled brushes, non-metallic
2 Ordinary rock hammers
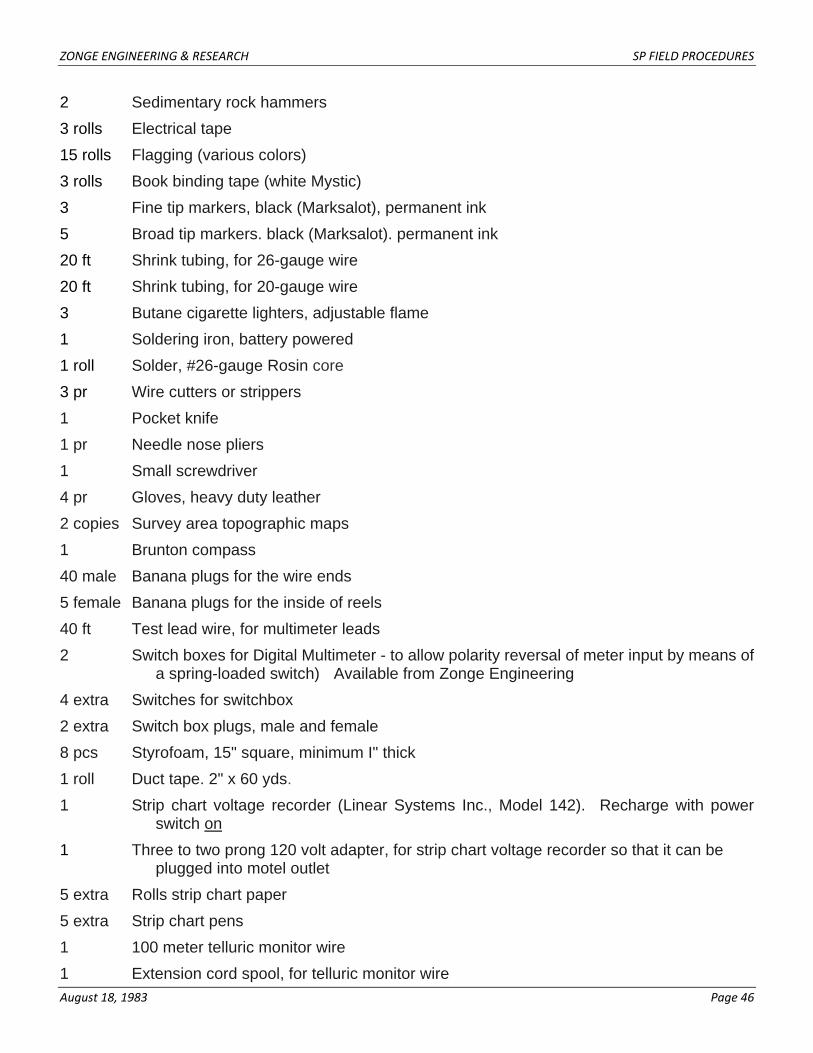
ZONGE ENGINEERING & RESEARCH SP FIELD PROCEDURES
August 18, 1983 Page 46
2 Sedimentary rock hammers
3 rolls Electrical tape
15 rolls Flagging (various colors)
3 rolls Book binding tape (white Mystic)
3 Fine tip markers, black (Marksalot), permanent ink
5 Broad tip markers. black (Marksalot). permanent ink
20 ft Shrink tubing, for 26-gauge wire
20 ft Shrink tubing, for 20-gauge wire
3 Butane cigarette lighters, adjustable flame
1 Soldering iron, battery powered
1 roll Solder, #26-gauge Rosin core
3 pr Wire cutters or strippers
1 Pocket knife
1 pr Needle nose pliers
1 Small screwdriver
4 pr Gloves, heavy duty leather
2 copies Survey area topographic maps
1 Brunton compass
40 male Banana plugs for the wire ends
5 female Banana plugs for the inside of reels
40 ft Test lead wire, for multimeter leads
2 Switch boxes for Digital Multimeter - to allow polarity reversal of meter input by means of a spring-loaded switch) Available from Zonge Engineering
4 extra Switches for switchbox
2 extra Switch box plugs, male and female
8 pcs Styrofoam, 15" square, minimum I" thick
1 roll Duct tape. 2" x 60 yds.
1 Strip chart voltage recorder (Linear Systems Inc., Model 142). Recharge with power switch on
1 Three to two prong 120 volt adapter, for strip chart voltage recorder so that it can be plugged into motel outlet
5 extra Rolls strip chart paper
5 extra Strip chart pens
1 100 meter telluric monitor wire
1 Extension cord spool, for telluric monitor wire
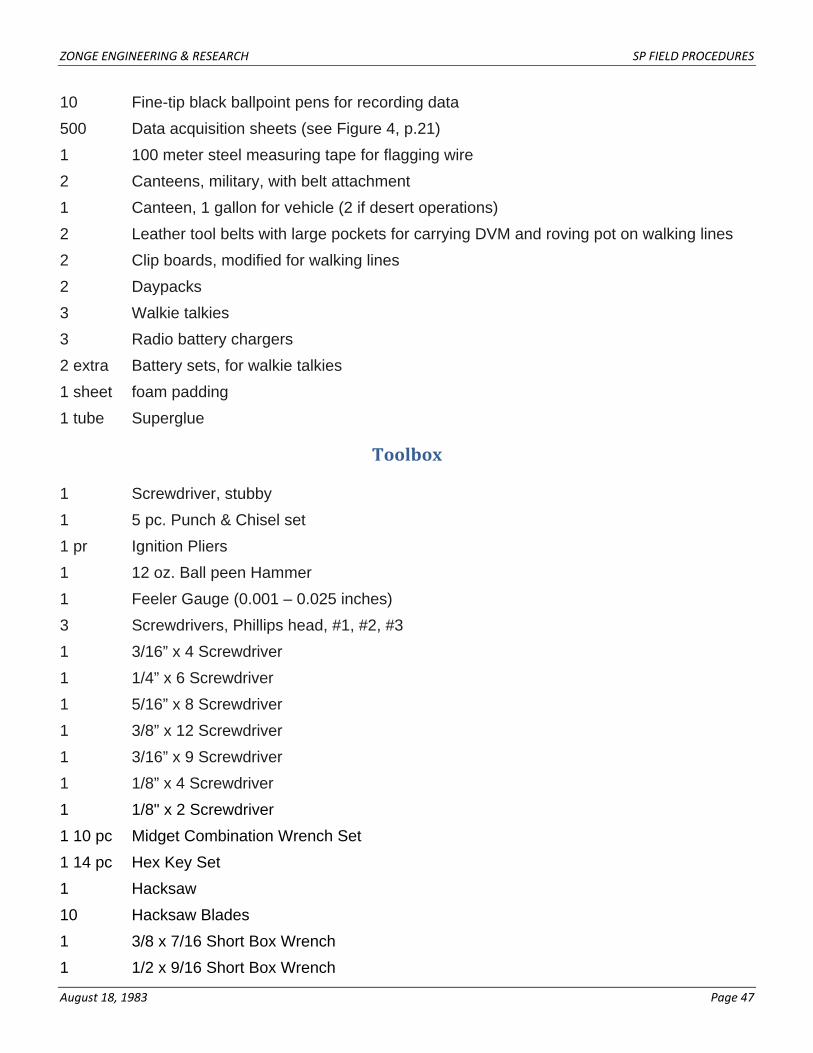
ZONGE ENGINEERING & RESEARCH SP FIELD PROCEDURES
August 18, 1983 Page 47
10 Fine-tip black ballpoint pens for recording data
500 Data acquisition sheets (see Figure 4, p.21)
1 100 meter steel measuring tape for flagging wire
2 Canteens, military, with belt attachment
1 Canteen, 1 gallon for vehicle (2 if desert operations)
2 Leather tool belts with large pockets for carrying DVM and roving pot on walking lines
2 Clip boards, modified for walking lines
2 Daypacks
3 Walkie talkies
3 Radio battery chargers
2 extra Battery sets, for walkie talkies
1 sheet foam padding
1 tube Superglue
Toolbox
1 Screwdriver, stubby
1 5 pc. Punch & Chisel set
1 pr Ignition Pliers
1 12 oz. Ball peen Hammer
1 Feeler Gauge (0.001 – 0.025 inches)
3 Screwdrivers, Phillips head, #1, #2, #3
1 3/16” x 4 Screwdriver
1 1/4” x 6 Screwdriver
1 5/16” x 8 Screwdriver
1 3/8” x 12 Screwdriver
1 3/16” x 9 Screwdriver
1 1/8” x 4 Screwdriver
1 1/8" x 2 Screwdriver
1 10 pc Midget Combination Wrench Set
1 14 pc Hex Key Set
1 Hacksaw
10 Hacksaw Blades
1 3/8 x 7/16 Short Box Wrench
1 1/2 x 9/16 Short Box Wrench
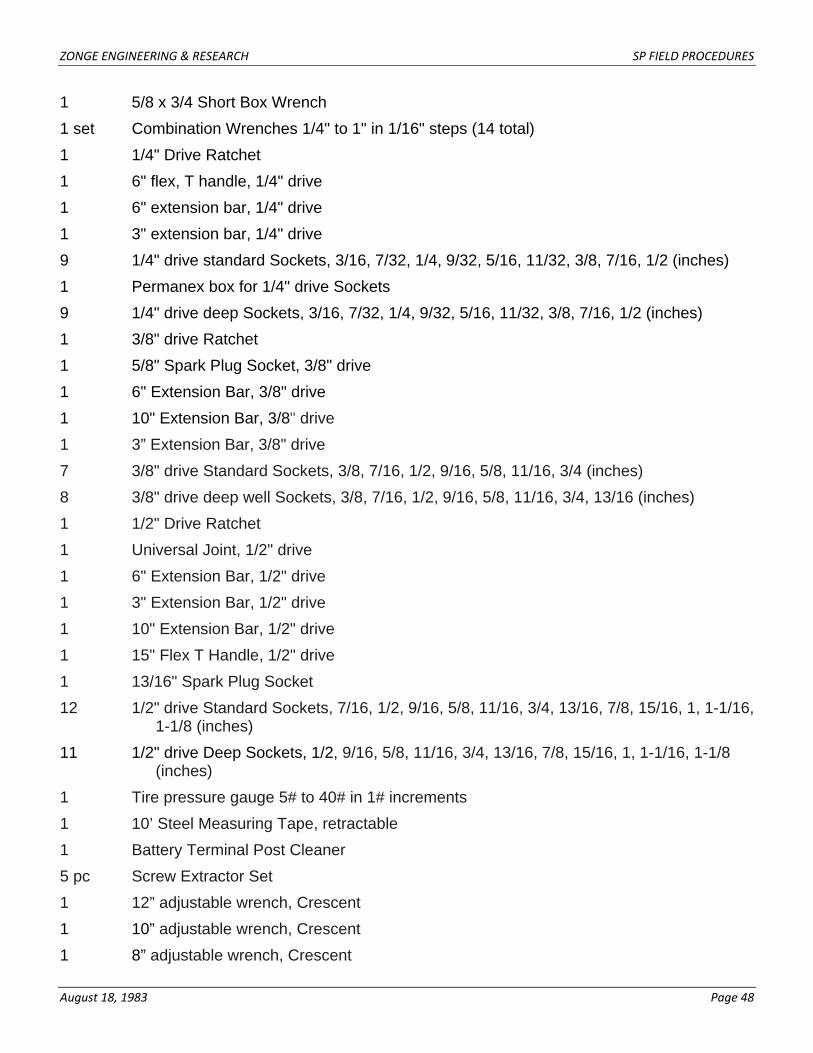
ZONGE ENGINEERING & RESEARCH SP FIELD PROCEDURES
August 18, 1983 Page 48
1 5/8 x 3/4 Short Box Wrench
1 set Combination Wrenches 1/4" to 1" in 1/16" steps (14 total)
1 1/4" Drive Ratchet
1 6" flex, T handle, 1/4" drive
1 6" extension bar, 1/4" drive
1 3" extension bar, 1/4" drive
9 1/4" drive standard Sockets, 3/16, 7/32, 1/4, 9/32, 5/16, 11/32, 3/8, 7/16, 1/2 (inches)
1 Permanex box for 1/4" drive Sockets
9 1/4" drive deep Sockets, 3/16, 7/32, 1/4, 9/32, 5/16, 11/32, 3/8, 7/16, 1/2 (inches)
1 3/8" drive Ratchet
1 5/8" Spark Plug Socket, 3/8" drive
1 6" Extension Bar, 3/8" drive
1 10" Extension Bar, 3/8" drive
1 3” Extension Bar, 3/8" drive
7 3/8" drive Standard Sockets, 3/8, 7/16, 1/2, 9/16, 5/8, 11/16, 3/4 (inches)
8 3/8" drive deep well Sockets, 3/8, 7/16, 1/2, 9/16, 5/8, 11/16, 3/4, 13/16 (inches)
1 1/2" Drive Ratchet
1 Universal Joint, 1/2" drive
1 6" Extension Bar, 1/2" drive
1 3" Extension Bar, 1/2" drive
1 10" Extension Bar, 1/2" drive
1 15" Flex T Handle, 1/2" drive
1 13/16" Spark Plug Socket
12 1/2" drive Standard Sockets, 7/16, 1/2, 9/16, 5/8, 11/16, 3/4, 13/16, 7/8, 15/16, 1, 1-1/16, 1-1/8 (inches)
11 1/2" drive Deep Sockets, 1/2, 9/16, 5/8, 11/16, 3/4, 13/16, 7/8, 15/16, 1, 1-1/16, 1-1/8 (inches)
1 Tire pressure gauge 5# to 40# in 1# increments
1 10’ Steel Measuring Tape, retractable
1 Battery Terminal Post Cleaner
5 pc Screw Extractor Set
1 12” adjustable wrench, Crescent
1 10” adjustable wrench, Crescent
1 8” adjustable wrench, Crescent

ZONGE ENGINEERING & RESEARCH SP FIELD PROCEDURES
August 18, 1983 Page 49
1 pr Vice Grip Pliers
1 pr Channel Lock Pliers
1 pr Slip joint or common gas pliers
1 pr Heavy duty Cutters, TL Pliers
16 pc Drill Set – Carbon steel 1/16” to 9/16” with 3/8” shanks on larger drills.
1 3/8” chuck reversible and/or variable speed drill motor, 12 VDC operation if available
1 Come Along, large, Rigid model 584
25 ft Chain with hooks each end
3 30’ Nylon snatch-em tow straps 30,000# rating
1 Hydraulic jack, low profile, 5 ton
1 Hi-lift jack
1 Lug wrench
1 Flashlight with alkaline batteries
1 Complete set of fan belts
1 Set of radiator hoses, complete
8 ft Heater hose, 5/8”
1 Large Crowbar
2 Shovels
1 Small tarp or sand mat (desert operations)
1 3# to 5# Sledge hammer
1 5# Fire extinguisher, mounted on bracket in truck
1 MSHA First aid kit
1 Sven folding saw (Eddie Bauer)
1 Grease gun and cartridge of grease in plastic bag
Asstd Rags
1 roll Toilet paper
1 roll Paper towels
1 Container, hand cleaner
1 can Heavy duty brake fluid
2 cans Fix a flat
1 roll 16 Gauge wire
6 Assorted bungee cords with hooks at each end
1 pr Battery Jumper cables
1 Tire pump (electrical or spark plug)
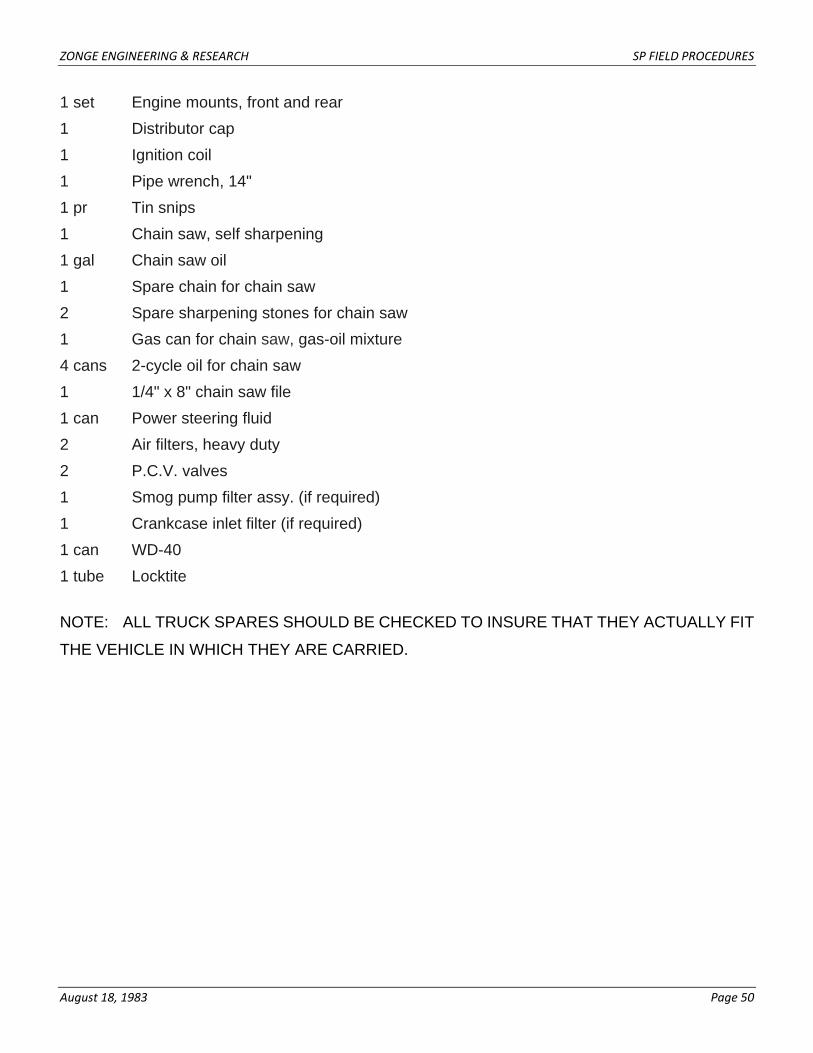
ZONGE ENGINEERING & RESEARCH SP FIELD PROCEDURES
August 18, 1983 Page 50
1 set Engine mounts, front and rear
1 Distributor cap
1 Ignition coil
1 Pipe wrench, 14"
1 pr Tin snips
1 Chain saw, self sharpening
1 gal Chain saw oil
1 Spare chain for chain saw
2 Spare sharpening stones for chain saw
1 Gas can for chain saw, gas-oil mixture
4 cans 2-cycle oil for chain saw
1 1/4" x 8" chain saw file
1 can Power steering fluid
2 Air filters, heavy duty
2 P.C.V. valves
1 Smog pump filter assy. (if required)
1 Crankcase inlet filter (if required)
1 can WD-40
1 tube Locktite
NOTE: ALL TRUCK SPARES SHOULD BE CHECKED TO INSURE THAT THEY ACTUALLY FIT
THE VEHICLE IN WHICH THEY ARE CARRIED.
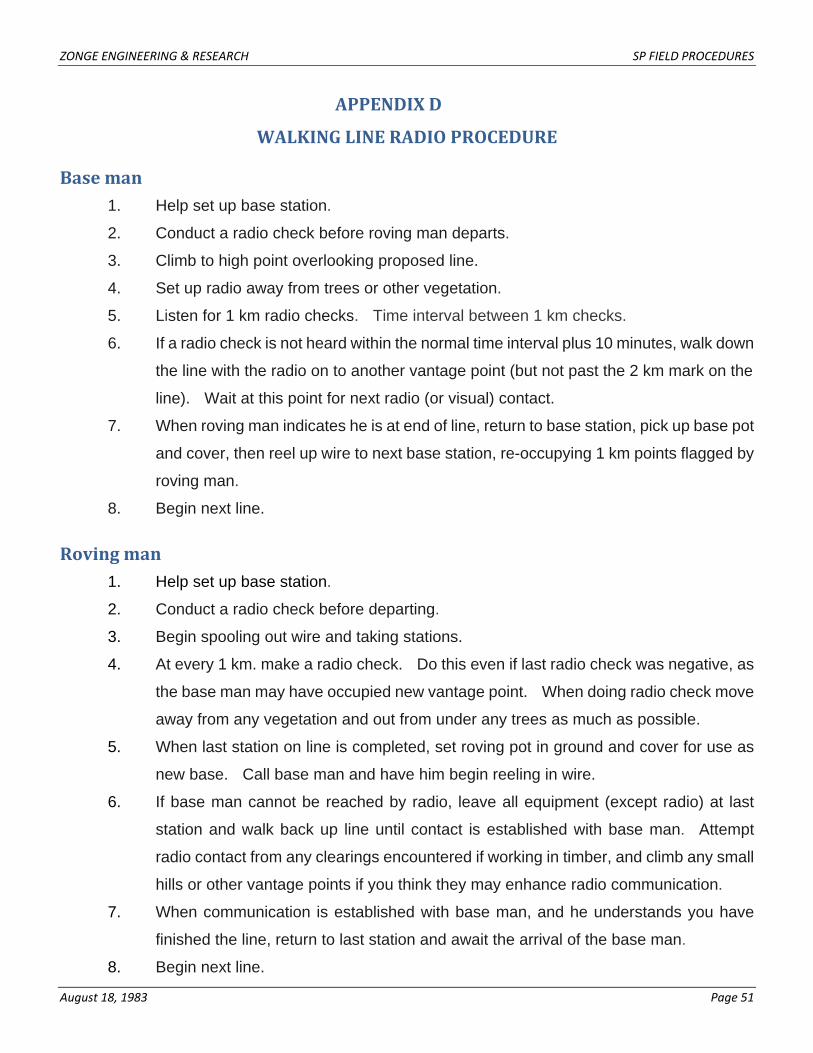
ZONGE ENGINEERING & RESEARCH SP FIELD PROCEDURES
August 18, 1983 Page 51
APPENDIX D
WALKING LINE RADIO PROCEDURE
Base man 1. Help set up base station.
2. Conduct a radio check before roving man departs.
3. Climb to high point overlooking proposed line.
4. Set up radio away from trees or other vegetation.
5. Listen for 1 km radio checks. Time interval between 1 km checks.
6. If a radio check is not heard within the normal time interval plus 10 minutes, walk down
the line with the radio on to another vantage point (but not past the 2 km mark on the
line). Wait at this point for next radio (or visual) contact.
7. When roving man indicates he is at end of line, return to base station, pick up base pot
and cover, then reel up wire to next base station, re-occupying 1 km points flagged by
roving man.
8. Begin next line.
Roving man 1. Help set up base station.
2. Conduct a radio check before departing.
3. Begin spooling out wire and taking stations.
4. At every 1 km. make a radio check. Do this even if last radio check was negative, as
the base man may have occupied new vantage point. When doing radio check move
away from any vegetation and out from under any trees as much as possible.
5. When last station on line is completed, set roving pot in ground and cover for use as
new base. Call base man and have him begin reeling in wire.
6. If base man cannot be reached by radio, leave all equipment (except radio) at last
station and walk back up line until contact is established with base man. Attempt
radio contact from any clearings encountered if working in timber, and climb any small
hills or other vantage points if you think they may enhance radio communication.
7. When communication is established with base man, and he understands you have
finished the line, return to last station and await the arrival of the base man.
8. Begin next line.
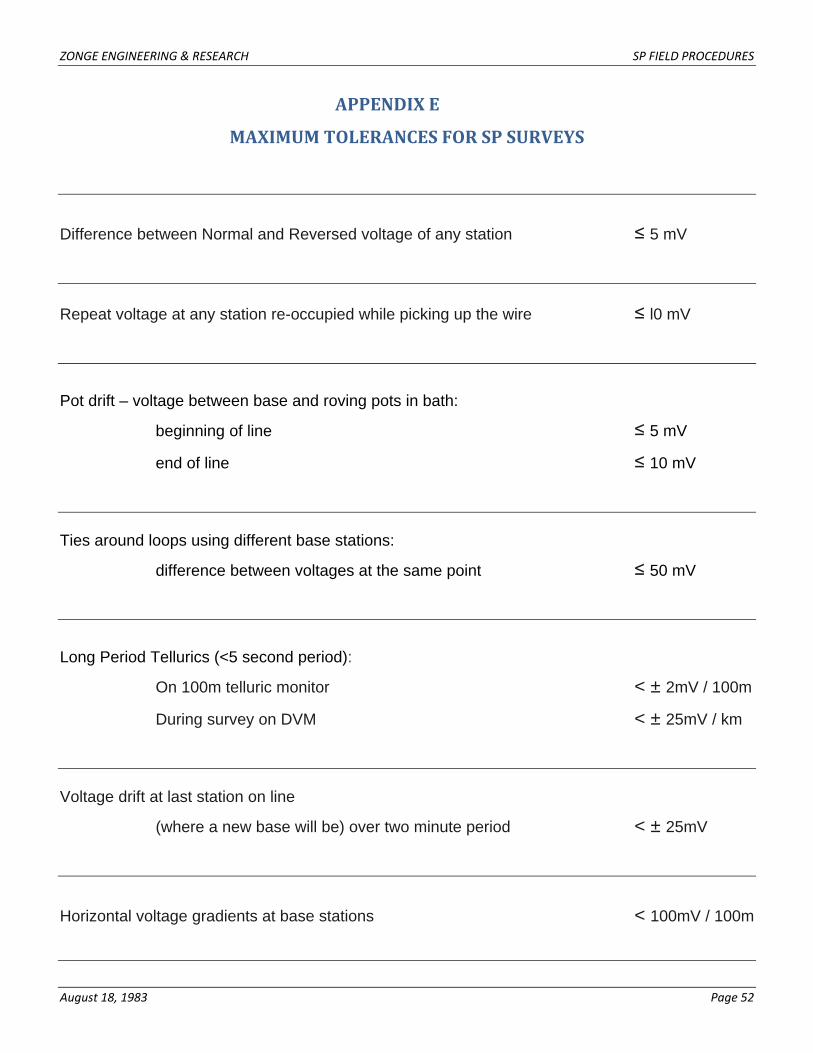
ZONGE ENGINEERING & RESEARCH SP FIELD PROCEDURES
August 18, 1983 Page 52
APPENDIX E
MAXIMUM TOLERANCES FOR SP SURVEYS
Difference between Normal and Reversed voltage of any station ≤ 5 mV
Repeat voltage at any station re-occupied while picking up the wire ≤ l0 mV
Pot drift – voltage between base and roving pots in bath:
beginning of line ≤ 5 mV
end of line ≤ 10 mV
Ties around loops using different base stations:
difference between voltages at the same point ≤ 50 mV
Long Period Tellurics (<5 second period):
On 100m telluric monitor < ± 2mV / 100m
During survey on DVM < ± 25mV / km
Voltage drift at last station on line
(where a new base will be) over two minute period < ± 25mV
Horizontal voltage gradients at base stations < 100mV / 100m

ZONGE ENGINEERING & RESEARCH SP FIELD PROCEDURES
August 18, 1983 Page 53
Station Spacing:
Reduce station spacing to 100 m when absolute voltage drops below -100 mV, otherwise use
200 m station spacing. For SP surveys other than the porphyry sulfides determine station spacing
by dividing expected target width by 1/2, e.g., the station spacing for a target 100 m wide would be
50 m. It will also be necessary to re-mark wire when using other than standard station spacings.
The time and cost of the survey are critically dependent on station spacing. The estimate of target
width should therefore be liberal. Remember that small targets are seldom of economic size or
grade, and that a 100 m station spacing will detect virtually every anomaly likely to be of economic
importance.
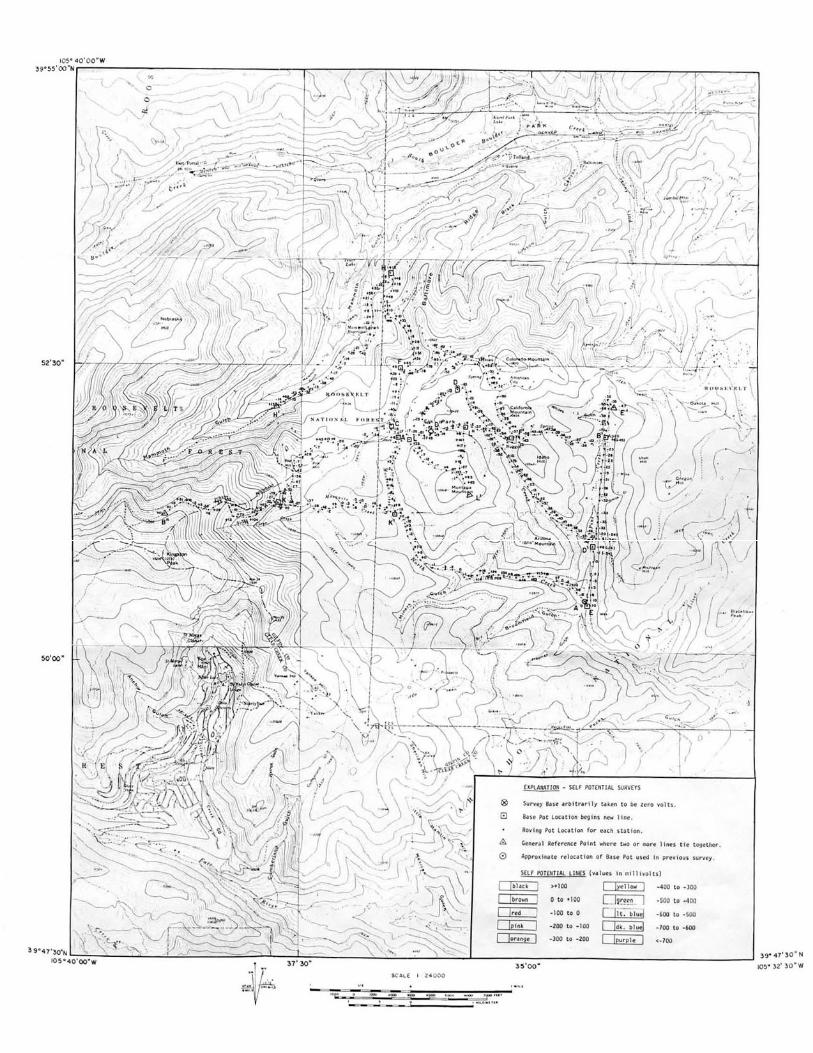

SELF POTENTIAL-SURVEY DATE:
AREA: LINE:
PERSONNEL: TELLURIC Voltage scale: mV full scale
MONITOR: Chart speed cm / hour
TIM
E
Dis
tanc
e fr
om
Line
Bas
e (m
)
Nor
mal
Vol
tage
(m
V)
Rev
erse
d
Vol
tage
(m
V)
Res
ista
nce
(Kilo
hms)
Bas
e-R
ovin
g
Pot
Drif
t
Vol
tage
(m
V)
Drif
t Cor
r.
Bas
e T
ie-in
Cor
rect
ion
Abs
olut
e
Vol
tage
(m
V)
Map
Ref
eren
ce
Poi
nt
Remarks