Embed Size (px)
Citation preview

SP 225Lecture 6
Graphing
Pie Chart
A graph depicting qualitative data as slices of a pie
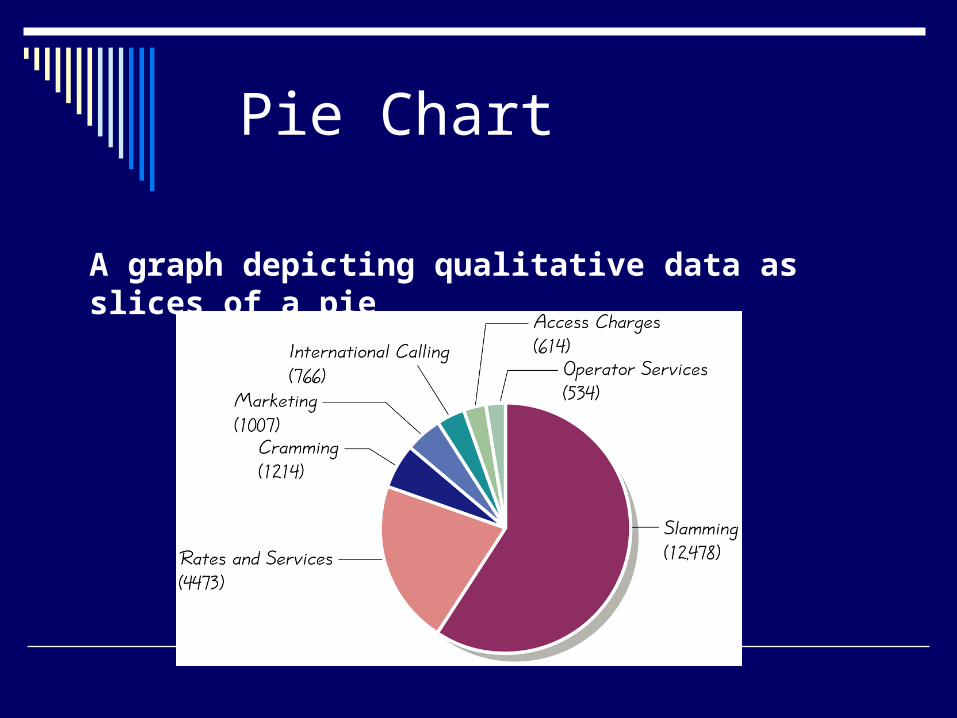
Example
Climate of the World’s Countries
Frequency Percentage
Desert 7 6.9%
Arid Desert 5 4.9%
Arid 6 5.8%
Tropical 32 31.4%
Mediterranean 10 9.8%
Maritime 4 3.9%
Temperate 34 33.3%
Arctic 4 3.9%
Total 102 100%
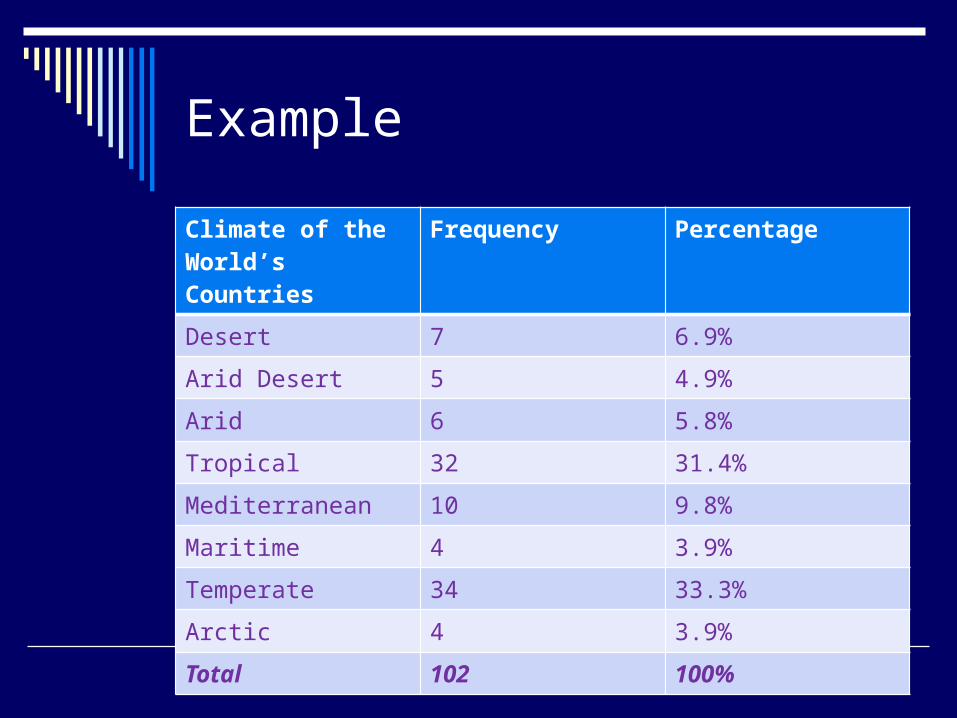
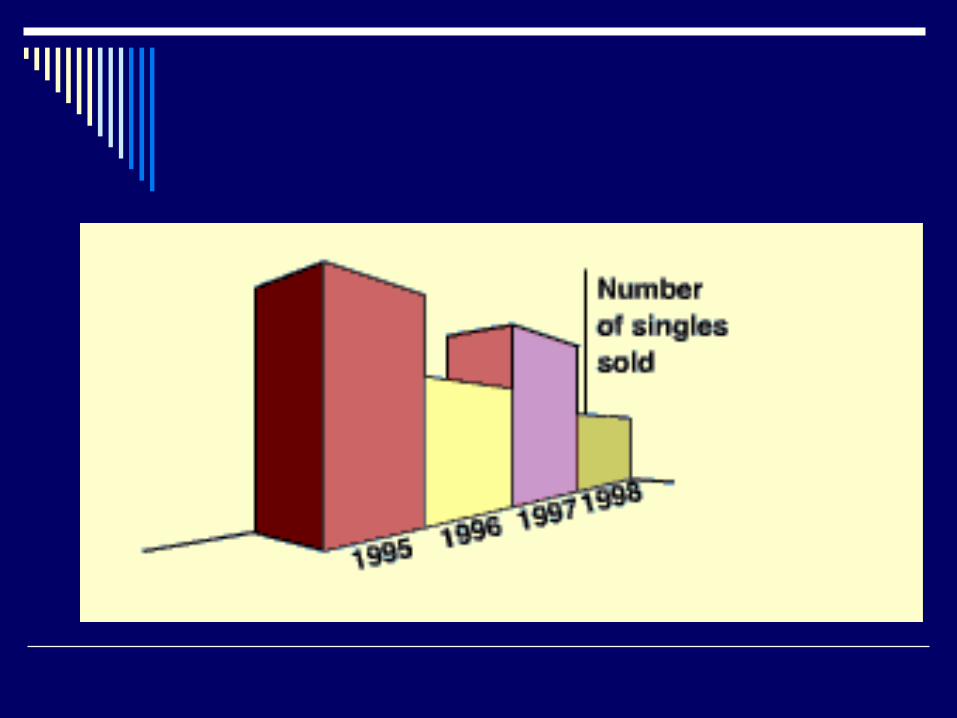
Bar Chart
A bar graph for qualitative data, with the bars arranged in order according to frequencies or natural order
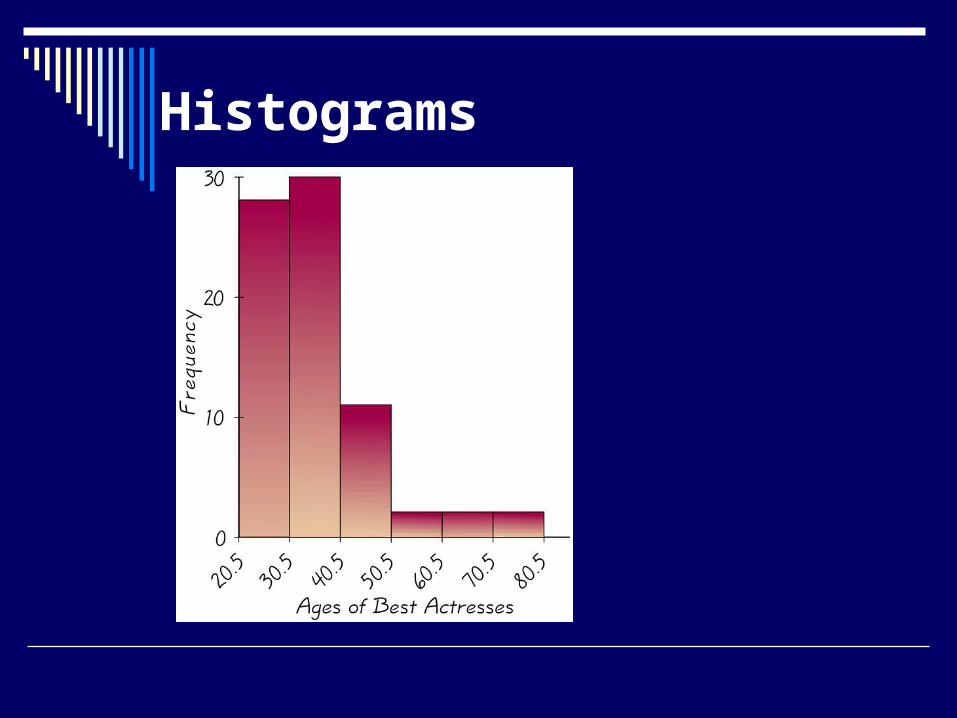
Histograms
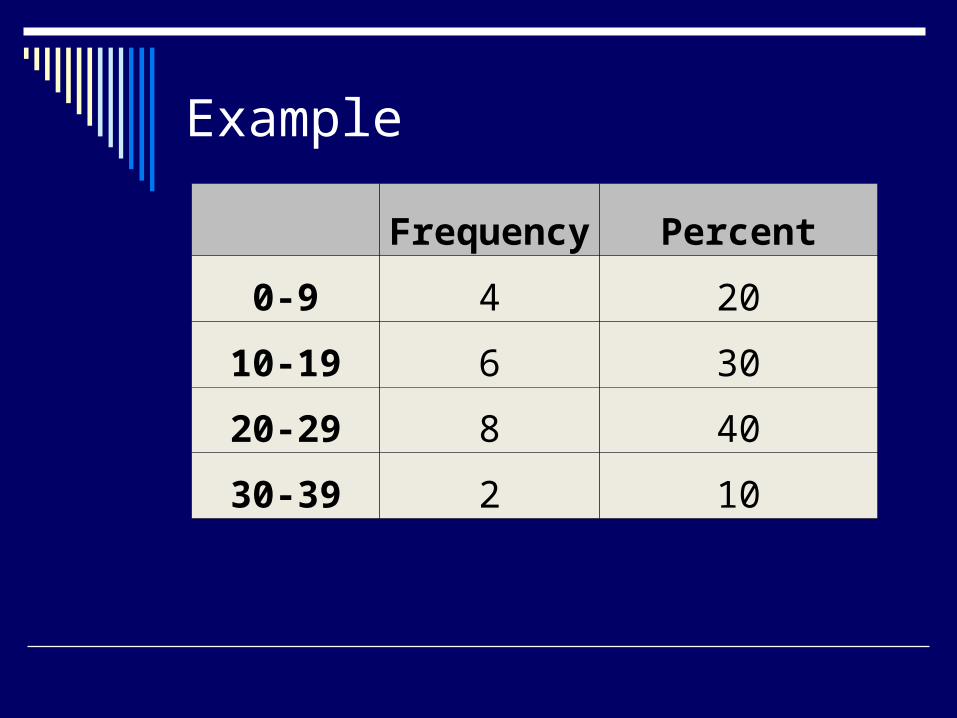
Example
Frequency Percent
0-9 4 20
10-19 6 30
20-29 8 40
30-39 2 10
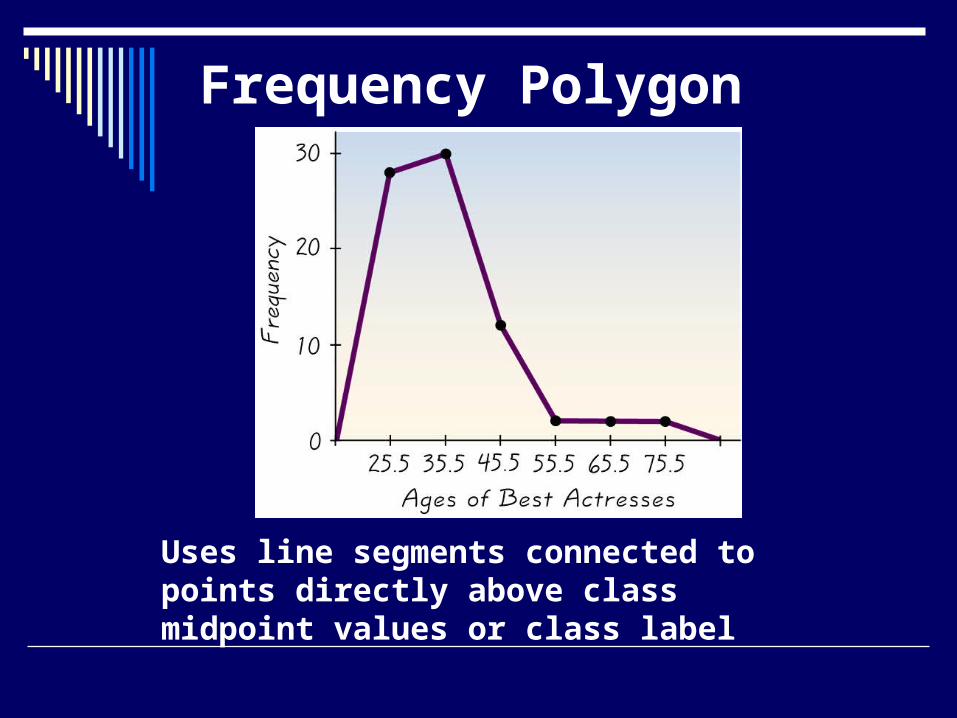
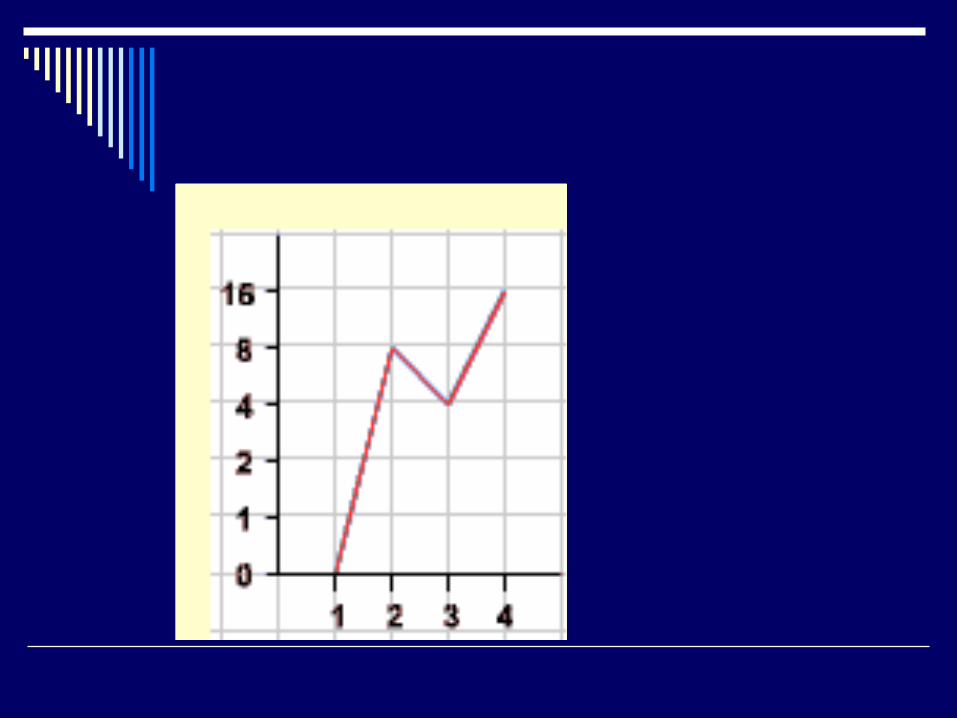
Frequency Polygon
Uses line segments connected to points directly above class midpoint values or class label
Choosing a Graph Type
Choosing a graph type Making graphs in SPSS
In Class What type of chart best displays the data for the
variable income and realrinc? Why? Use SPSS create a graph of each income
variable. Does each graph suggest income inequality
exists? Is either graph misleading? Why?
Write your responses on the SPSS graph output.